Article

Evaluating Power Reliability Dedicated for Sudden Disruptions: Its Application to Determine Capacity on the Basis of Energy Security

1
Department of Mechanical Engineering, College of Science and Engineering, Ritsumeikan University, Shiga 525-8577, Japan
2
UM Power Energy Dedicated Advanced Centre, University of Malaya, Kuala Lumpur 59990, Malaysia
*
Author to whom correspondence should be addressed.
Sustainability 2018, 10(6), 2059; https://0-doi-org.brum.beds.ac.uk/10.3390/su10062059
Submission received: 28 April 2018 / Revised: 24 May 2018 / Accepted: 5 June 2018 / Published: 17 June 2018
(This article belongs to the Special Issue Assessment of Energy Accident Risks)

Abstract

:
Given that a continuous power supply is fundamental to the economy and human well-being, development of a self-sustained electrical system that can withstand sudden disturbances by employing both renewable energy and storage technology is of significant importance. Most of the existing reliability approaches hardly represent a particular method of analyzing system adapting ability to remain self-sufficient in the short-term after the occurrence of sudden disruptions. In addition, existing reliability indexes are developed based on past experience, hardly covering the prediction of disruption risks. As such, a new electricity reliability quantification approach dedicated for sudden disruptions was established and the newly proposed electricity reliability prediction index was evaluated. The developed index was applied to determine optimal capacity sizing in the context of energy security. The availability of such electricity reliability predictions will allow the facility engineer to make wiser decisions to maintain a continuous power supply even after the occurrence of sudden disturbances. The developed algorithm can be readily implemented in any electrical system network including microgrid and rural electrification.

1. Introduction

In a recent times electricity grid systems have been reconsidered in response to the occurrence of extreme events. Vulnerability of centralized grids during contingency planning was made evident (e.g., in the aftermath of the Fukushima nuclear accident in Japan the area where planned power cut was conducted (consisting of 1.45 million corporations) had to stop operation [1]) and the importance of self-sustained distributed grid systems was highlighted in the current policy narratives [2]. Self-sustained distributed grid systems were developed on the basis of local electricity production for local consumption. Utilization of both renewable energy and storage technology is highly matched with the concept of a self-sustained distributed grid. Storage technologies such as batteries are useful to address the issues of renewable energy including intermittencies. However, storage technologies that cause energy losses arising from storing or converting energy, which should be addressed first before other issues [3,4,5,6], ensure that electricity is continuously supplied even when renewable energy does not operate [7]. Given that continuous power supply is fundamental to the economy and human well-being, the development of self-sustained electrical systems to withstand sudden disturbances by employing both renewable energy and storage technology is of significant importance in all energy intensive sectors.
Power reliability is often assessed when evaluating the continuous electricity supply of the grid. Its definition is an ability of the grid system to supply a desired amount of power to consumers within accepted standards [8]. Multiple research reports tended to address the engineering failures of grids and assess power reliability in the context of cascading outages arising from external disturbances [9,10,11,12]. Additionally, electric utility providers employ multiple existing power reliability indexes such as the System Average Interruption Duration Index (SAIDI) and the Customer Average Interruption Duration Index (CAIDI) in conventional grids [13,14]. These indices are computed based on the past experience of the whole grid system. In addition, probabilistic methods including loss-of-load probability (e.g., in previous works [15,16,17]) and loss-of-power supply probability (e.g., in previous works [18,19]) have been also been utilized for quantifying power reliability.
Power reliability is originally comprised of two dimensions: adequacy and security [20], and the sudden occurrence of a disturbance is highly associated with the concept of security in power reliability [21]. It must be noted that the existing reliability indices hardly represent a particular approach to analyzing the extent to which power security contributes to reliability in the grid. Hu et al. monitored the recovery process of a power system from external disturbances [22]. Hazi et al. evaluated the maximum restoration time after power interruptions [23]. Kosai and Unesaki focused on the controllability of alternative energy sources in response to sudden stoppages of nuclear power due to societal issues [24]. This paper focuses on the system’s adapting ability to remain self-sufficient in the short-term after the occurrence of sudden disruptions in the power security narrative.
Pertaining to the cause of influencing the supply reliability in the distributed system through the utilization of renewable energy, the issues of intermittency and dependency on weather conditions have been widely considered [25]. Meanwhile, overall failures, which are also known as “trouble”, in the generation system can also lead to supply interruptions. In an attempt to be resilient to various natural and human events [7,26], it is of significant importance to analyze the power reliability from the security perspective based on the system’s trouble. This paper focuses on the controllability of storage technology after sudden troubles.
The existing reliability indices hardly cover the prediction of supply disruption risk. Meanwhile, a more advanced electricity supply reliability index is now required, where a prediction of supply reliability in the near future is vital to ensure continuous supply [9]. Hence, a new power reliability prediction index will be provided in this research.
Furthermore, the appropriate design of installation capacity size for ensuring the power reliability is of paramount concern [27]. However, it must be mentioned that power reliability is not sufficient for designing the appropriate capacity sizing in the grid. Earlier research papers analyzed the relation between cost and reliability [21,28,29], between redundancy, diversification, and reliability [24], and between CO2 emissions, cost, diversification, and reliability [30]. Since various elements were involved in the decision-making process for capacity sizing, a more holistic concept beyond reliability was required, such as energy security. Energy security is a driving force of determining best-energy source composition [31], which has the potential to be applied to the distributed system scale to determine optimal capacity sizing. In fact, reliability is one of the aspects of the energy security narratives [32,33], particularly for security of electricity supply [34,35]. Subsequently, economic aspects have also been proposed as an indicator for energy security [35,36] from various viewpoints, such as retail electricity price [37,38,39] and volatile oil price [37,38,40]. Additionally, the diversification of energy sources is also proposed as another important indicator for energy security [41,42,43]. Sovaccol mentioned that the damages arising from troubles in complex energy systems can be minimized by diversification [32]. Meanwhile, the research related to energy security of the distributed system scale has only been scarcely discussed in a more holistic manner integrating reliability with both economic factors and diversification.
As such, the objective of this paper is to develop the methodology for evaluating system adapting ability to remain self-sufficient in a short-term period after the occurrence of sudden disruptions, to establish a new electricity reliability index dedicated to the power security aspect, and apply the developed index into determining optimal capacity sizing in the context of energy security.
This paper proceeds as follows. Section 2 establishes the methodology of the electricity reliability index dedicated for the power security and energy security index. Section 3 analyzes the system adapting ability to remain self-sufficient in the short-term period after the occurrence of sudden disruptions and the implementation of the electricity reliability index. The obtained electricity reliability index is applied to the energy security index to identify the optimal capacity sizing in Section 4. Finally, Section 5 concludes this paper.

2. Materials and Methods

2.1. Development and Evaluation of Electricity Reliability Index Dedicated for the Sudden Disruption

In this research, electricity reliability focusing on the security aspect refers to the capability of the electrical system to remain self-sufficient for as long as possible, even when trouble occurs. It would appear that sudden disruptions of power generation are highly associated with three factors, including the magnitude of sudden disruptions (hereafter referred to trouble rate), the timing of occurrence of sudden disturbances (hereafter referred to instant of trouble), and the influential periods from the occurrence of sudden disruptions until recovery (hereafter referred to trouble duration). Ultimately, the battery takes the role of the security aspect and must be able to supply sufficient energy to the local loads during periods of trouble. As such, the supply reliability is based upon the amount of time the system can remain self-sufficient after the occurrence of a sudden disruption using the battery, hereafter referred to as the sustainable duration. Based on the sustainable duration, a new electricity reliability index dedicated to the security aspect was proposed and is also known as the System Electricity Sustainable Duration Index (SESDI) in this research. The methodology for the electricity reliability analysis will consists of 2 main components:
  • Analysis of the sustainable duration for the electrical system
  • Computation of the sustainable duration analysis to obtain the SESDI for the electrical system.

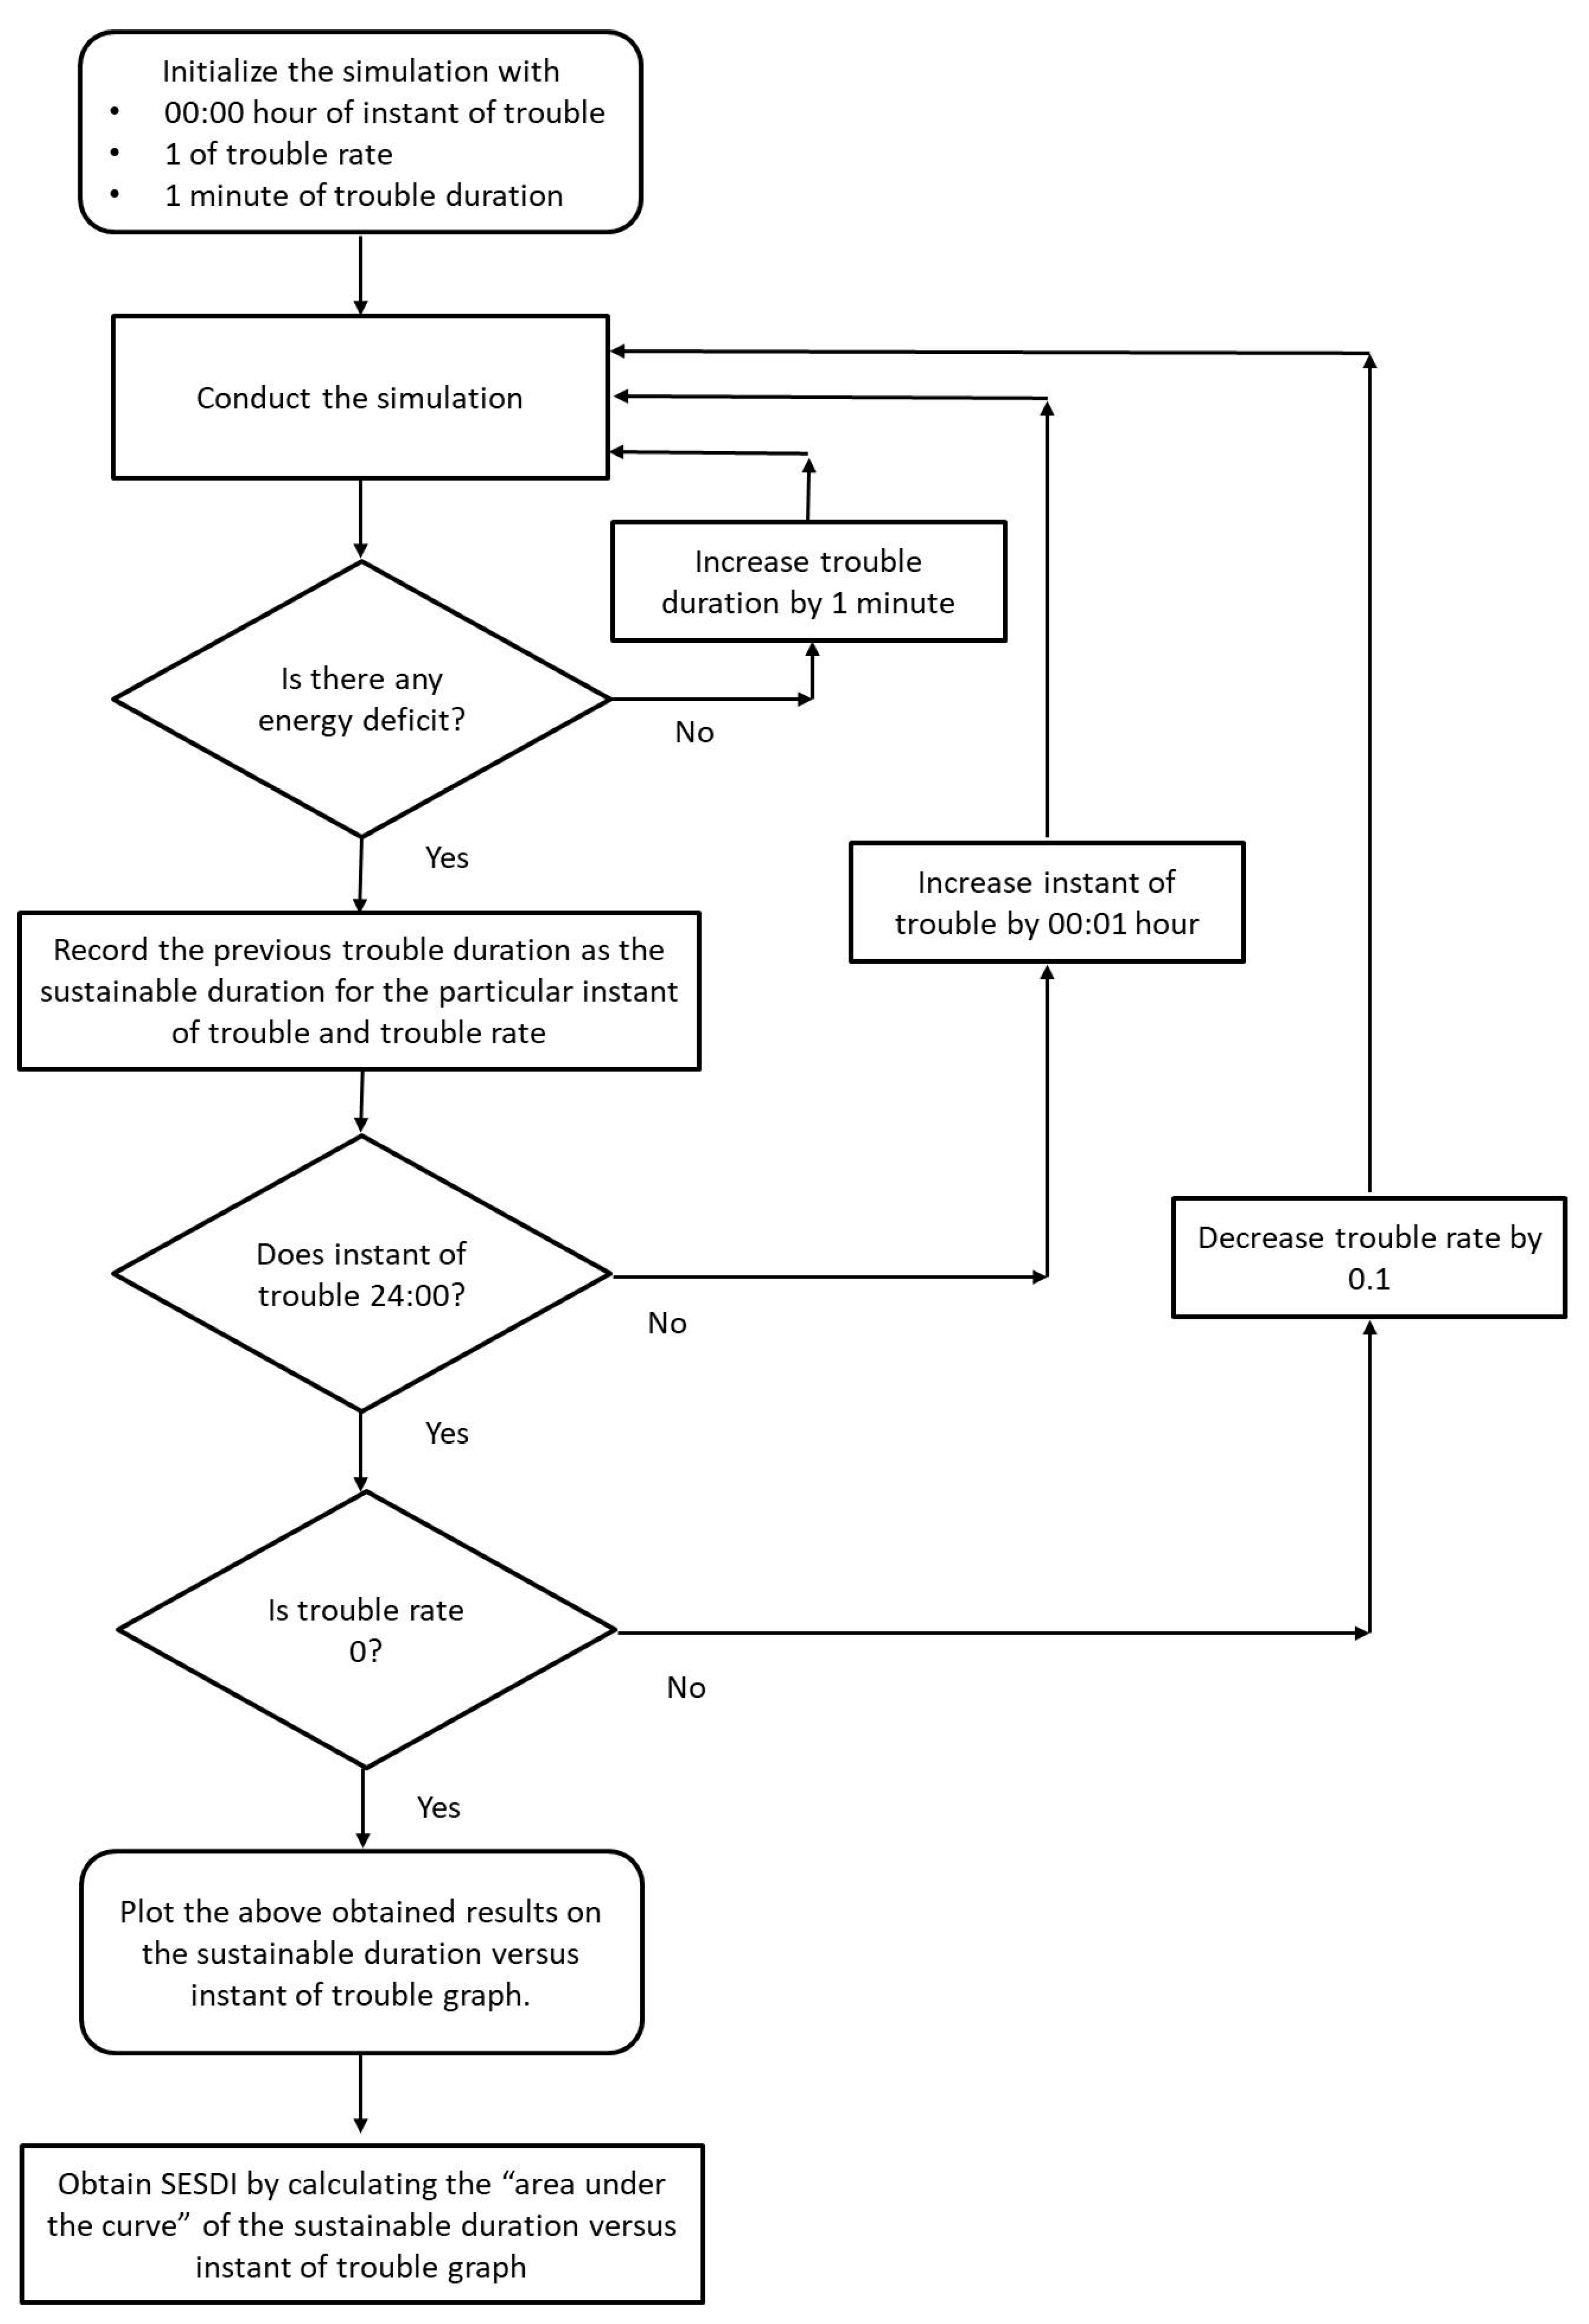
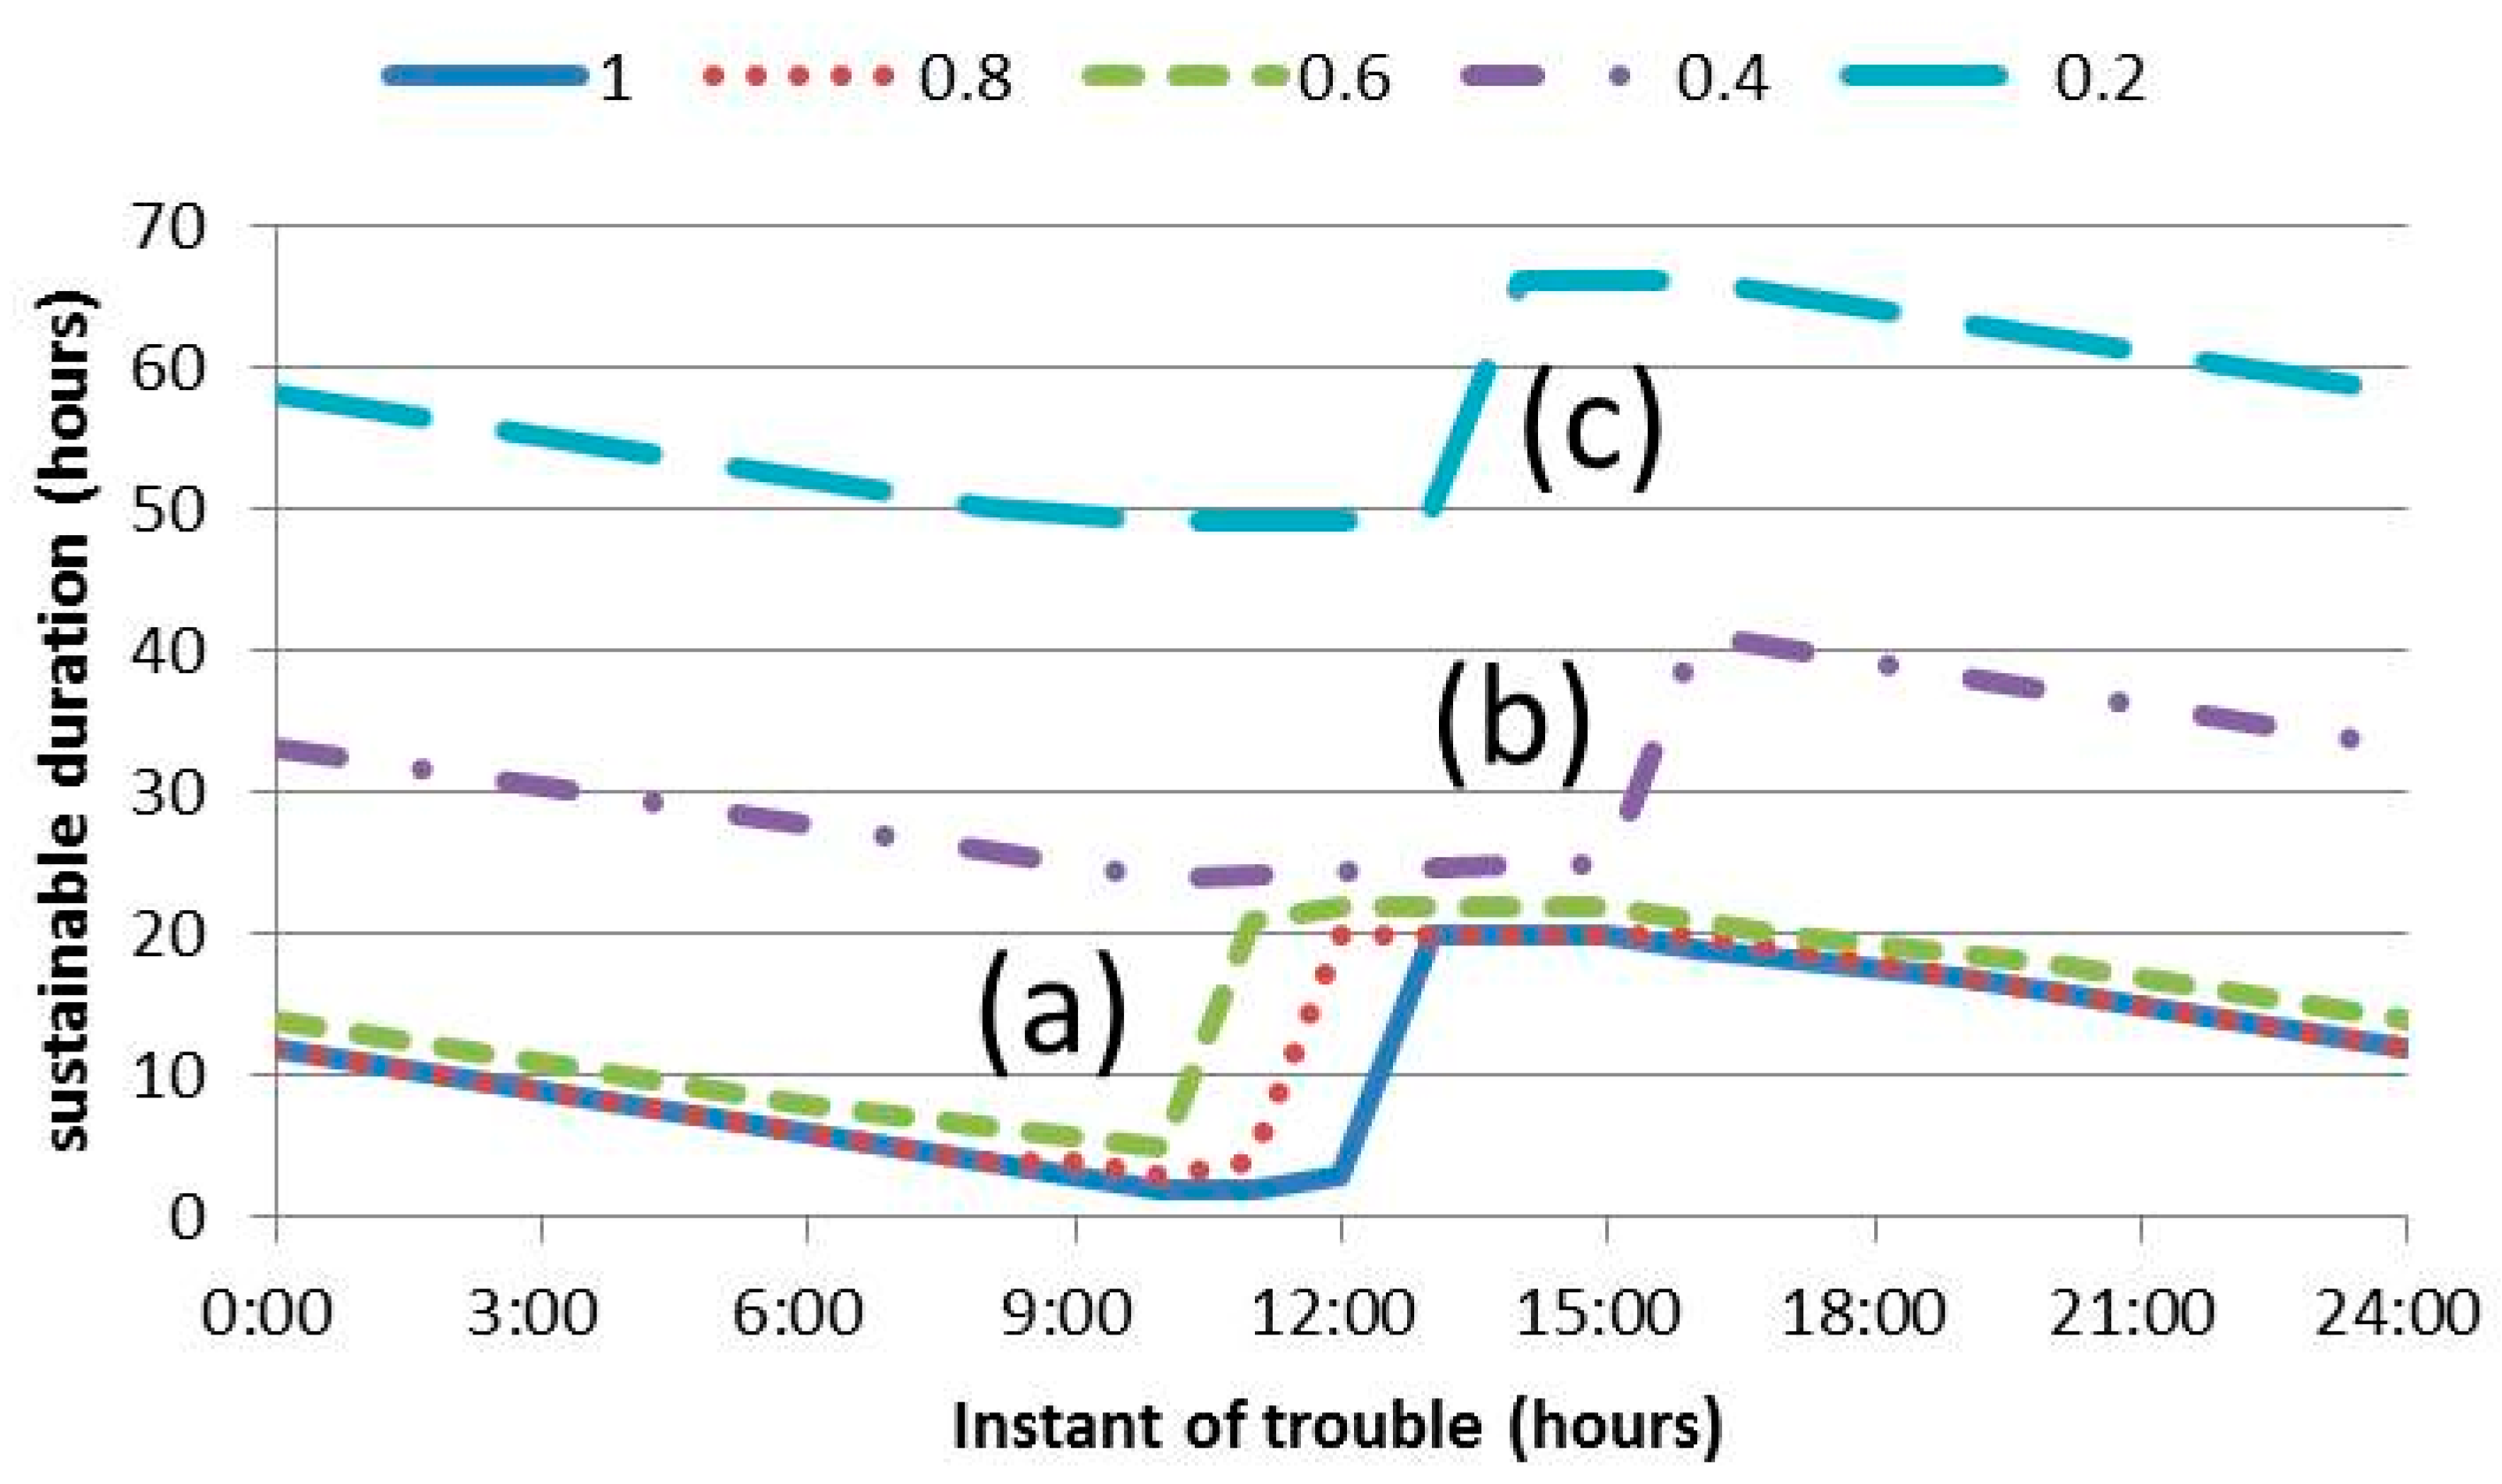
2.1.1. Sustainable Duration Analysis for the Electrical System

A multitude of parameters affect the sustainable duration of an electrical system. Each of the three parameters—magnitude, duration, and instant of trouble—will be analyzed to obtain the sustainable duration. The sustainable duration under the varying nature of trouble can be identified by following the steps below:
  • Initialization of system parameters. The instant of trouble is 00:00 h. The trouble rate is 1 (100% failure). The trouble duration is 1 min.
  • Run the simulation and check if there is any energy deficit. An energy deficit occurs when all energy sources have been depleted by the consumption of the electrical system.
  • If there is no energy deficit, the simulation is repeated with increasing trouble duration in steps of 1 min until the energy deficit is obtained. Once the energy deficit is obtained, the previous trouble duration is recorded as the sustainable duration for the particular instant of trouble and trouble rate.
  • Repeat Steps 2 and 3 for the increasing instant of trouble in step 00:01 h until 24:00 h.
  • Repeat Steps 2 to 4 for decreasing trouble rate in steps of 0.1 until a trouble rate of 0 is reached.
  • The above obtained results are then plotted on the sustainable duration versus instant of trouble graph.

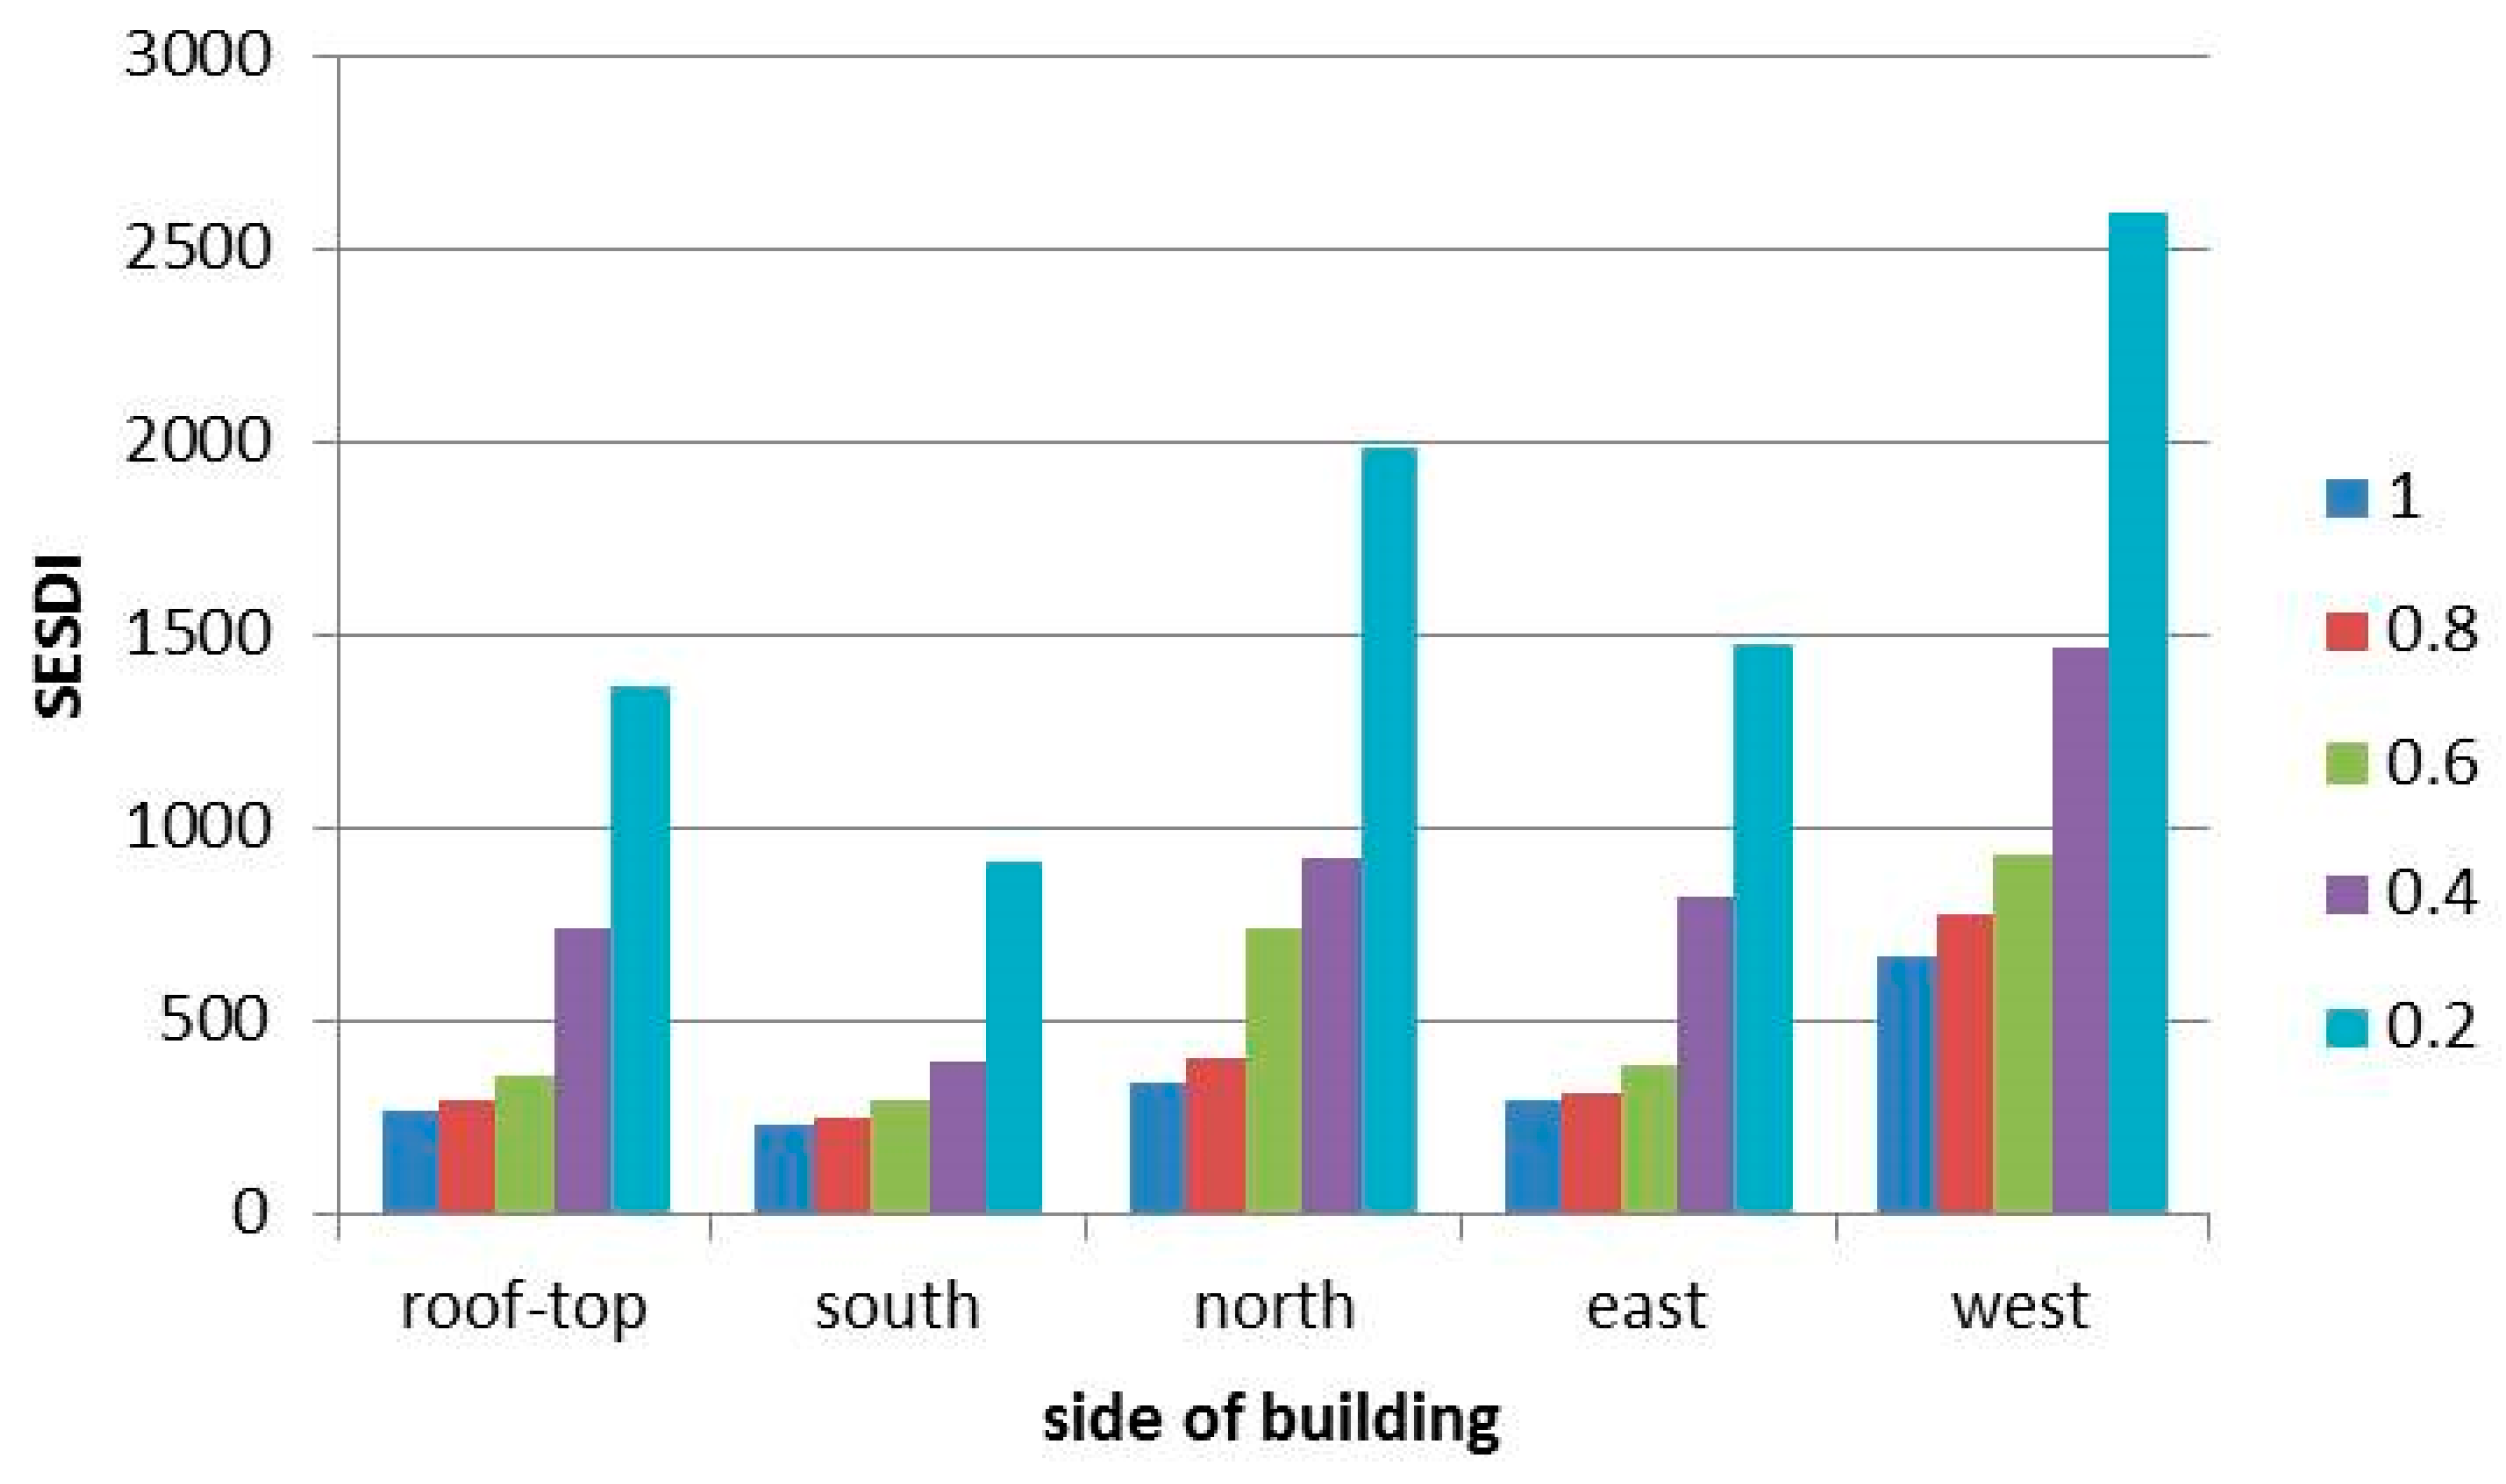
2.1.2. Computation of the Sustainable Duration Analysis to Obtain the SESDI for the Electrical System

After obtaining the sustainable duration, the SESDI is obtained by calculating the “area under the curve” of the sustainable duration versus instant of trouble graph in the following equation.
S E S D I = f ( t ) d t
where, f ( t ) : sustainable duration curve.
The overall flow is presented in Figure 1.

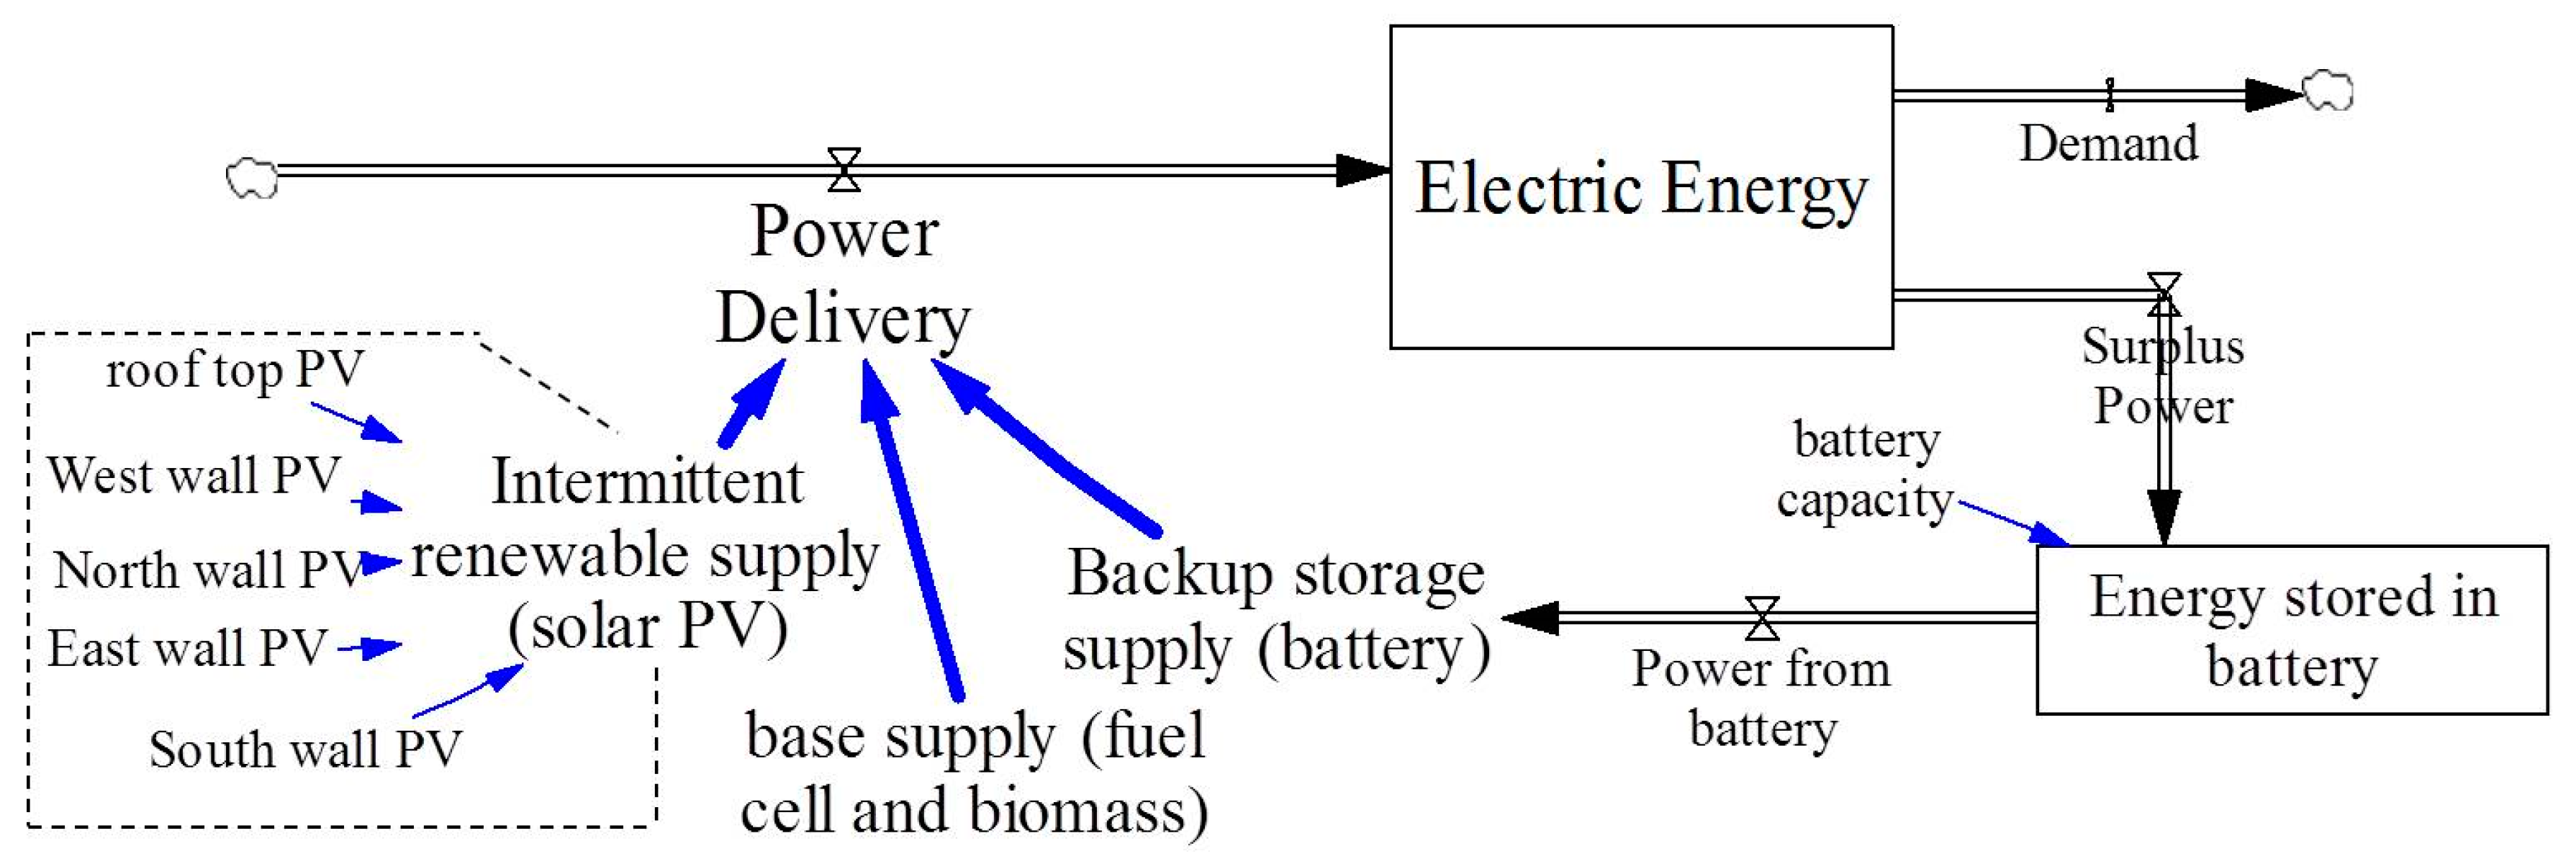
2.2. Site Identification and System Modelling as an Illustrative Study

The scale of distributed grid system is assumed to be the power flow in the building for simplicity. Currently, the building sector consumes 40% of the primary energy and contributes 24% of worldwide greenhouse gas emissions [44]. The energy management and saving in the building sector has the potential to address energy-related issues [45]. Ease of access to building energy data for experimentation purposes is the main criteria in selecting a site for the development of this quantitative analysis. Though a distributed grid finds its main application in any electricity network, unfortunately, an actual distributed network with ease of access to energy data is not readily available. As such, a fictitious building will have to be identified. Consequently, Wisma R&D, a high rise building in Kuala Lumpur, Malaysia has been identified as a suitable site that fits the above criteria.
The electricity demand and supply model is constructed by using System Dynamics as shown in Figure 2. System Dynamics is a method to describe, model, simulate, and analyze dynamically complex issues and systems in terms of process, information, organizational boundaries, and strategies [46]. The nature of energy system has dynamic complexities [47] and deep uncertainties [48], with which System Dynamics could be used as an appropriate method for dealing. The System Dynamics analysis in this research uses “Vensim 6” from VENTANA Systems, Inc., Harvard, MA, USA. The authors employed System Dynamics for the development of a power flow model [21,49].
The developed model in Figure 2 consists of three main types of installed power supply, comprising of base supply, intermittent renewable supply, and backup storage supply. The fuel cell and biomass generators represent the base supply which delivers a continuous and constant amount of power throughout the system all the time. Fuel cell systems offer high modularity across a wide range of loads and minimal environmental impact by being installed as a grid independent generator for on-site services [50]. Biomass can also be implemented as a renewable energy supply option hierarchy [51]. Due to favorable climate conditions and an economy that is still reliant on some form of mass agriculture in Malaysia, there is abundance of feedstock supply ready for utilization of biomass energy [52]. The intermittent renewable supply is represented by the solar photovoltaic (PV) generator covering the roof-top and also the four sides of building while the battery acts as the backup storage supply. A total of five units of inverters are assumed to be used to convert the direct current (DC) power from the solar panel in each of the five sides of the building to alternating current (AC) power. The summation of the power from all three main sources is referred to as the power delivery. The power delivery will support the load demand in the system. In addition, any surplus power not consumed by the loads will be channeled to the battery for storage. The stored energy will then be used during the period when the load demand is greater than the combined power from both the intermittent renewable supply and base supply. The period of study was one week and the daily solar radiation data is assumed to remain the same for each day.
It must be noted that the power generated from solar PV in Figure 2 can be further influenced by the installation orientation, solar irradiation, installed capacity, magnitude of solar PV trouble, the duration of trouble, as well as the time instant of trouble. As such, a more detailed model showing the configurable parameters of the solar PV model is shown in Figure 3. The magnitude, duration, and time instant of solar PV trouble are respectively indicated as trouble rate, trouble duration, and instant of trouble in this model. The instant of PV trouble is assumed to occur only on Monday.
The sustainable duration analysis in this proposed fictitious electrical system was first conducted to identify the available surface area on each of the 5 sides of the building (roof-top and also the four sides of external walls). Next, the solar irradiance on the building and the corresponding PV power, generated by a number of solar PV panels, were measured throughout a day period. Based on the available area on each sides of building together with the measured PV power generation curve, the solar PV power delivery curve was calculated. Subsequently, the load demand in the building was also measured throughout the 7-day period. After that, the minimum required installed capacity for the base supply was identified through analytical methods based on the ability of the electrical system to self-sustain.
Following the developed steps in Section 2.1, the troubled PV surface of the building was converted in the order of the roof-top, the east, west, north, and south walls. It must be noted that the trouble rate at each of the sides of the building was set to a discrete value in steps of 0.2. The reason for this is the prior assumption that a total of five units of inverters are used to convert the DC power from the solar panel in each sides of the building to AC power.
The SESDI is first generated for trouble in all sides of the building. Finally, the overall SESDI is computed by taking the root mean square of all the individual SESDI for the changing trouble rate in each side of the building.

3. Results

A new electricity reliability index, known as SESDI, has been developed in Section 2.2. An analysis will now be conducted to compute the SESDI index to evaluate the near future supply reliability in the electrical system. The results of the analysis are presented in the following sections.

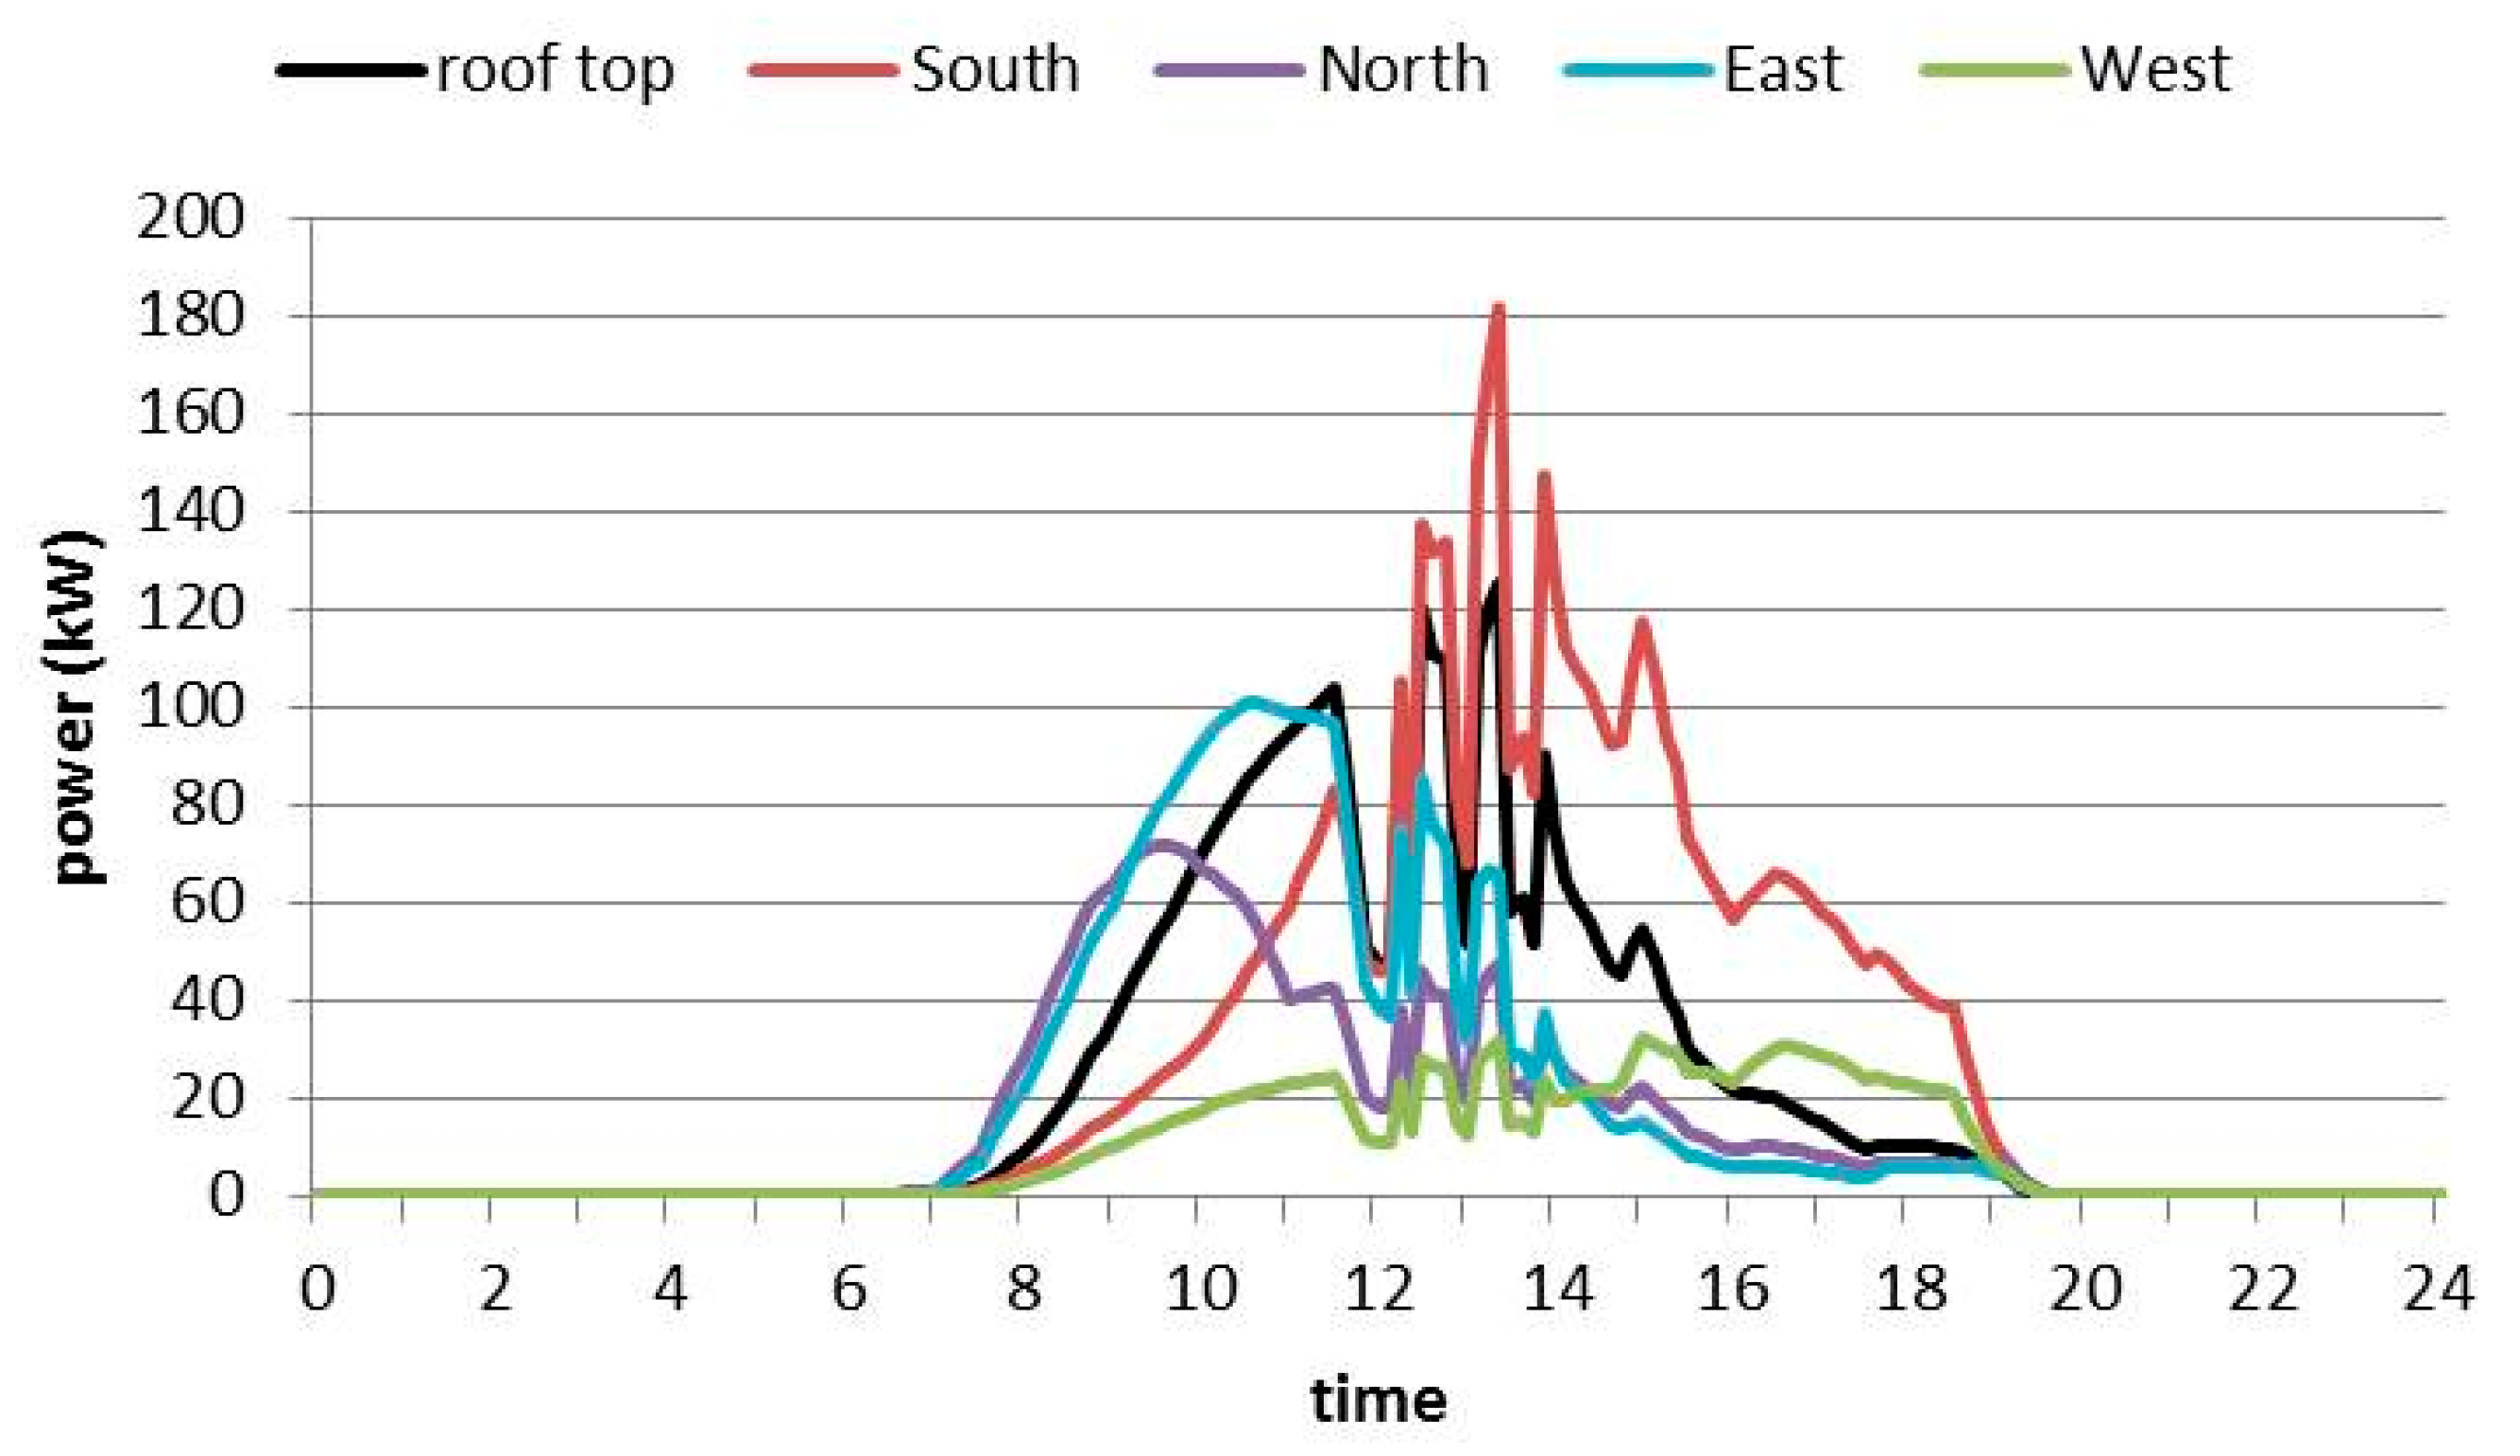
3.1. Calculation of Solar PV Power Delivery Curve from Five Sides of Building

The case study was conducted for a fictitious electrical system at Wisma R&D, in Malaysia. The dimensions of roof-top, north, south, east, and west walls are 1174.5 m2, 2296.8 m2, 2296.8 m2, 1425.6 m2, and 1425.6 m2, respectively. In 2014, a total of 10 m2 of solar PV panels were installed on the roof-top of this building. The installed PV panels were of the type PV-AE125MF5N and the panel is rated to generate 125 W/m2. The solar irradiance and the corresponding PV power generated by these solar PV panels were measured on the 26 February 2014. Given the available surface area in the building of 8619.3 m2 and assuming the same type of PV panel with 125 W/m2 were to be installed, the maximum PV solar capacity that can be installed is computed as 1077 kW.
Next, the measured power from the 10 m2 of solar PV panels will have to be converted to the other five sides of the building through the normalization approach. The normalization of solar PV irradiation from a horizontal surface to each of the sides of a wall can be computed based on the data obtained from the New Energy and Industrial Technology Development Organization [53]. The instantaneous power for each of the sides of the building is shown in Figure 4, which is also known as the power delivery curve. In the morning, the PV on the east and north walls generated a larger amount of power, while in the afternoon the south wall had the largest electricity generation potential compared to the other walls. In addition, the load demand in the building was measured from 23 April–29 April 2016.

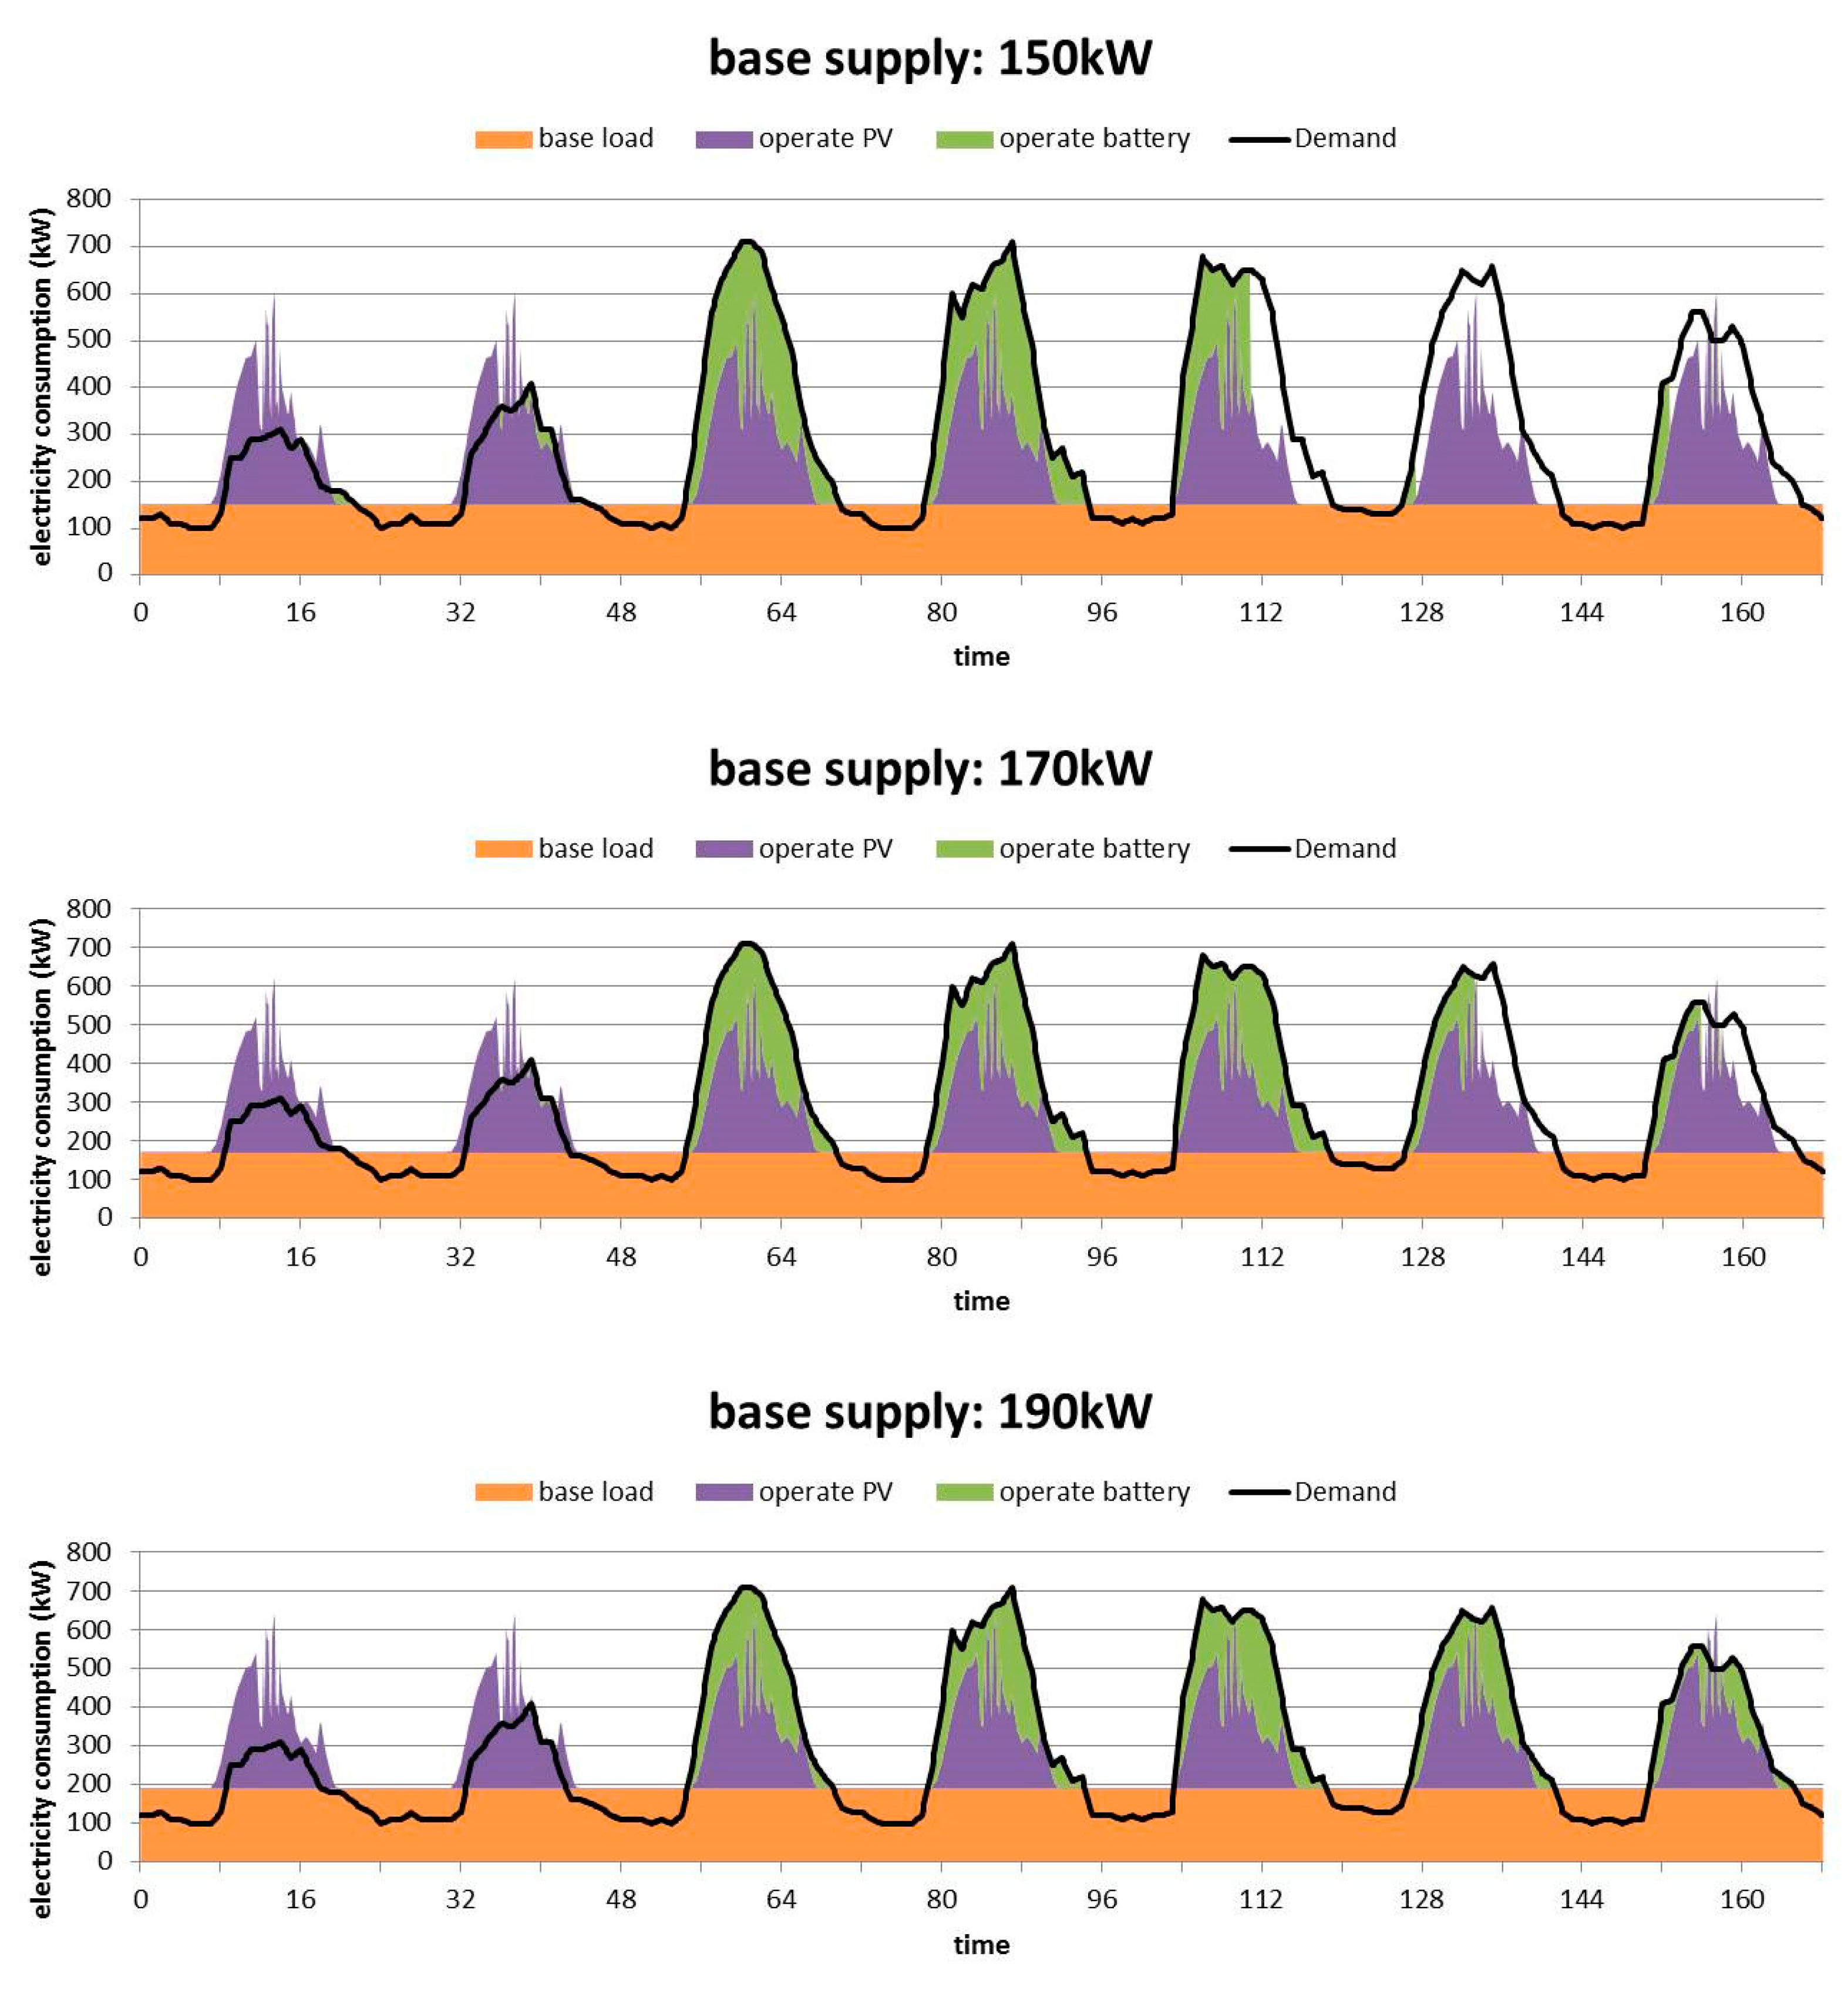
3.2. Identification of the Minimum Required Installed Capacity for Base Supply

The battery is modeled using the Sodium Sulfur (NaS) battery technology which has been demonstrated in Japan and US for the required medium battery capacity system. Based on the study conducted by Chen et al. [54], the power conversion efficiency for this battery model was set to 83%. In this research, NGK batteries with 40 NaS modules are proposed for the electrical system. Each of these 40 NaS battery modules has a storage capacity of 200 kWh and peak power delivery of 33 kW [55]. As such, the total storage capacity is 8640 kWh and the peak power delivery is 1200 kW.
Simulation in System Dynamics for energy supply–demand balance throughout a week period was conducted for 150 kW–190 kW of base supply with 40 NaS battery modules. Selected results at 150 kW, 170 kW, and 190 kW of base supply are shown in Figure 5. The unshaded area under the demand curve indicates that the available generation is unable to meet the demand. In contrast, the shaded area above the demand curve indicates that surplus power can be used as energy storage. In the case of 150 kW and 170 kW of base supply, there exist some undashed areas under the demand curve that indicates that this building will experience a power disruption. On the other hand, in the case of the 190 kW base supply, this supply allows the electrical system to self-sustain and even produce surplus power which can be used for storage.
It must be noted that the unshaded area under the demand curve can be computed in kWh and is known as the energy deficit. Figure 6 shows the amount of energy deficit for the different base supply capacities. It can be observed that with 40 NaS battery modules, a minimum of 183 kW of base supply capacity is required to ensure that there is no energy deficit. Any base supply capacity which is more than the minimum can be used. As such, 190 kW of base supply was identified as an ideal case to conduct the sustainable duration analysis.

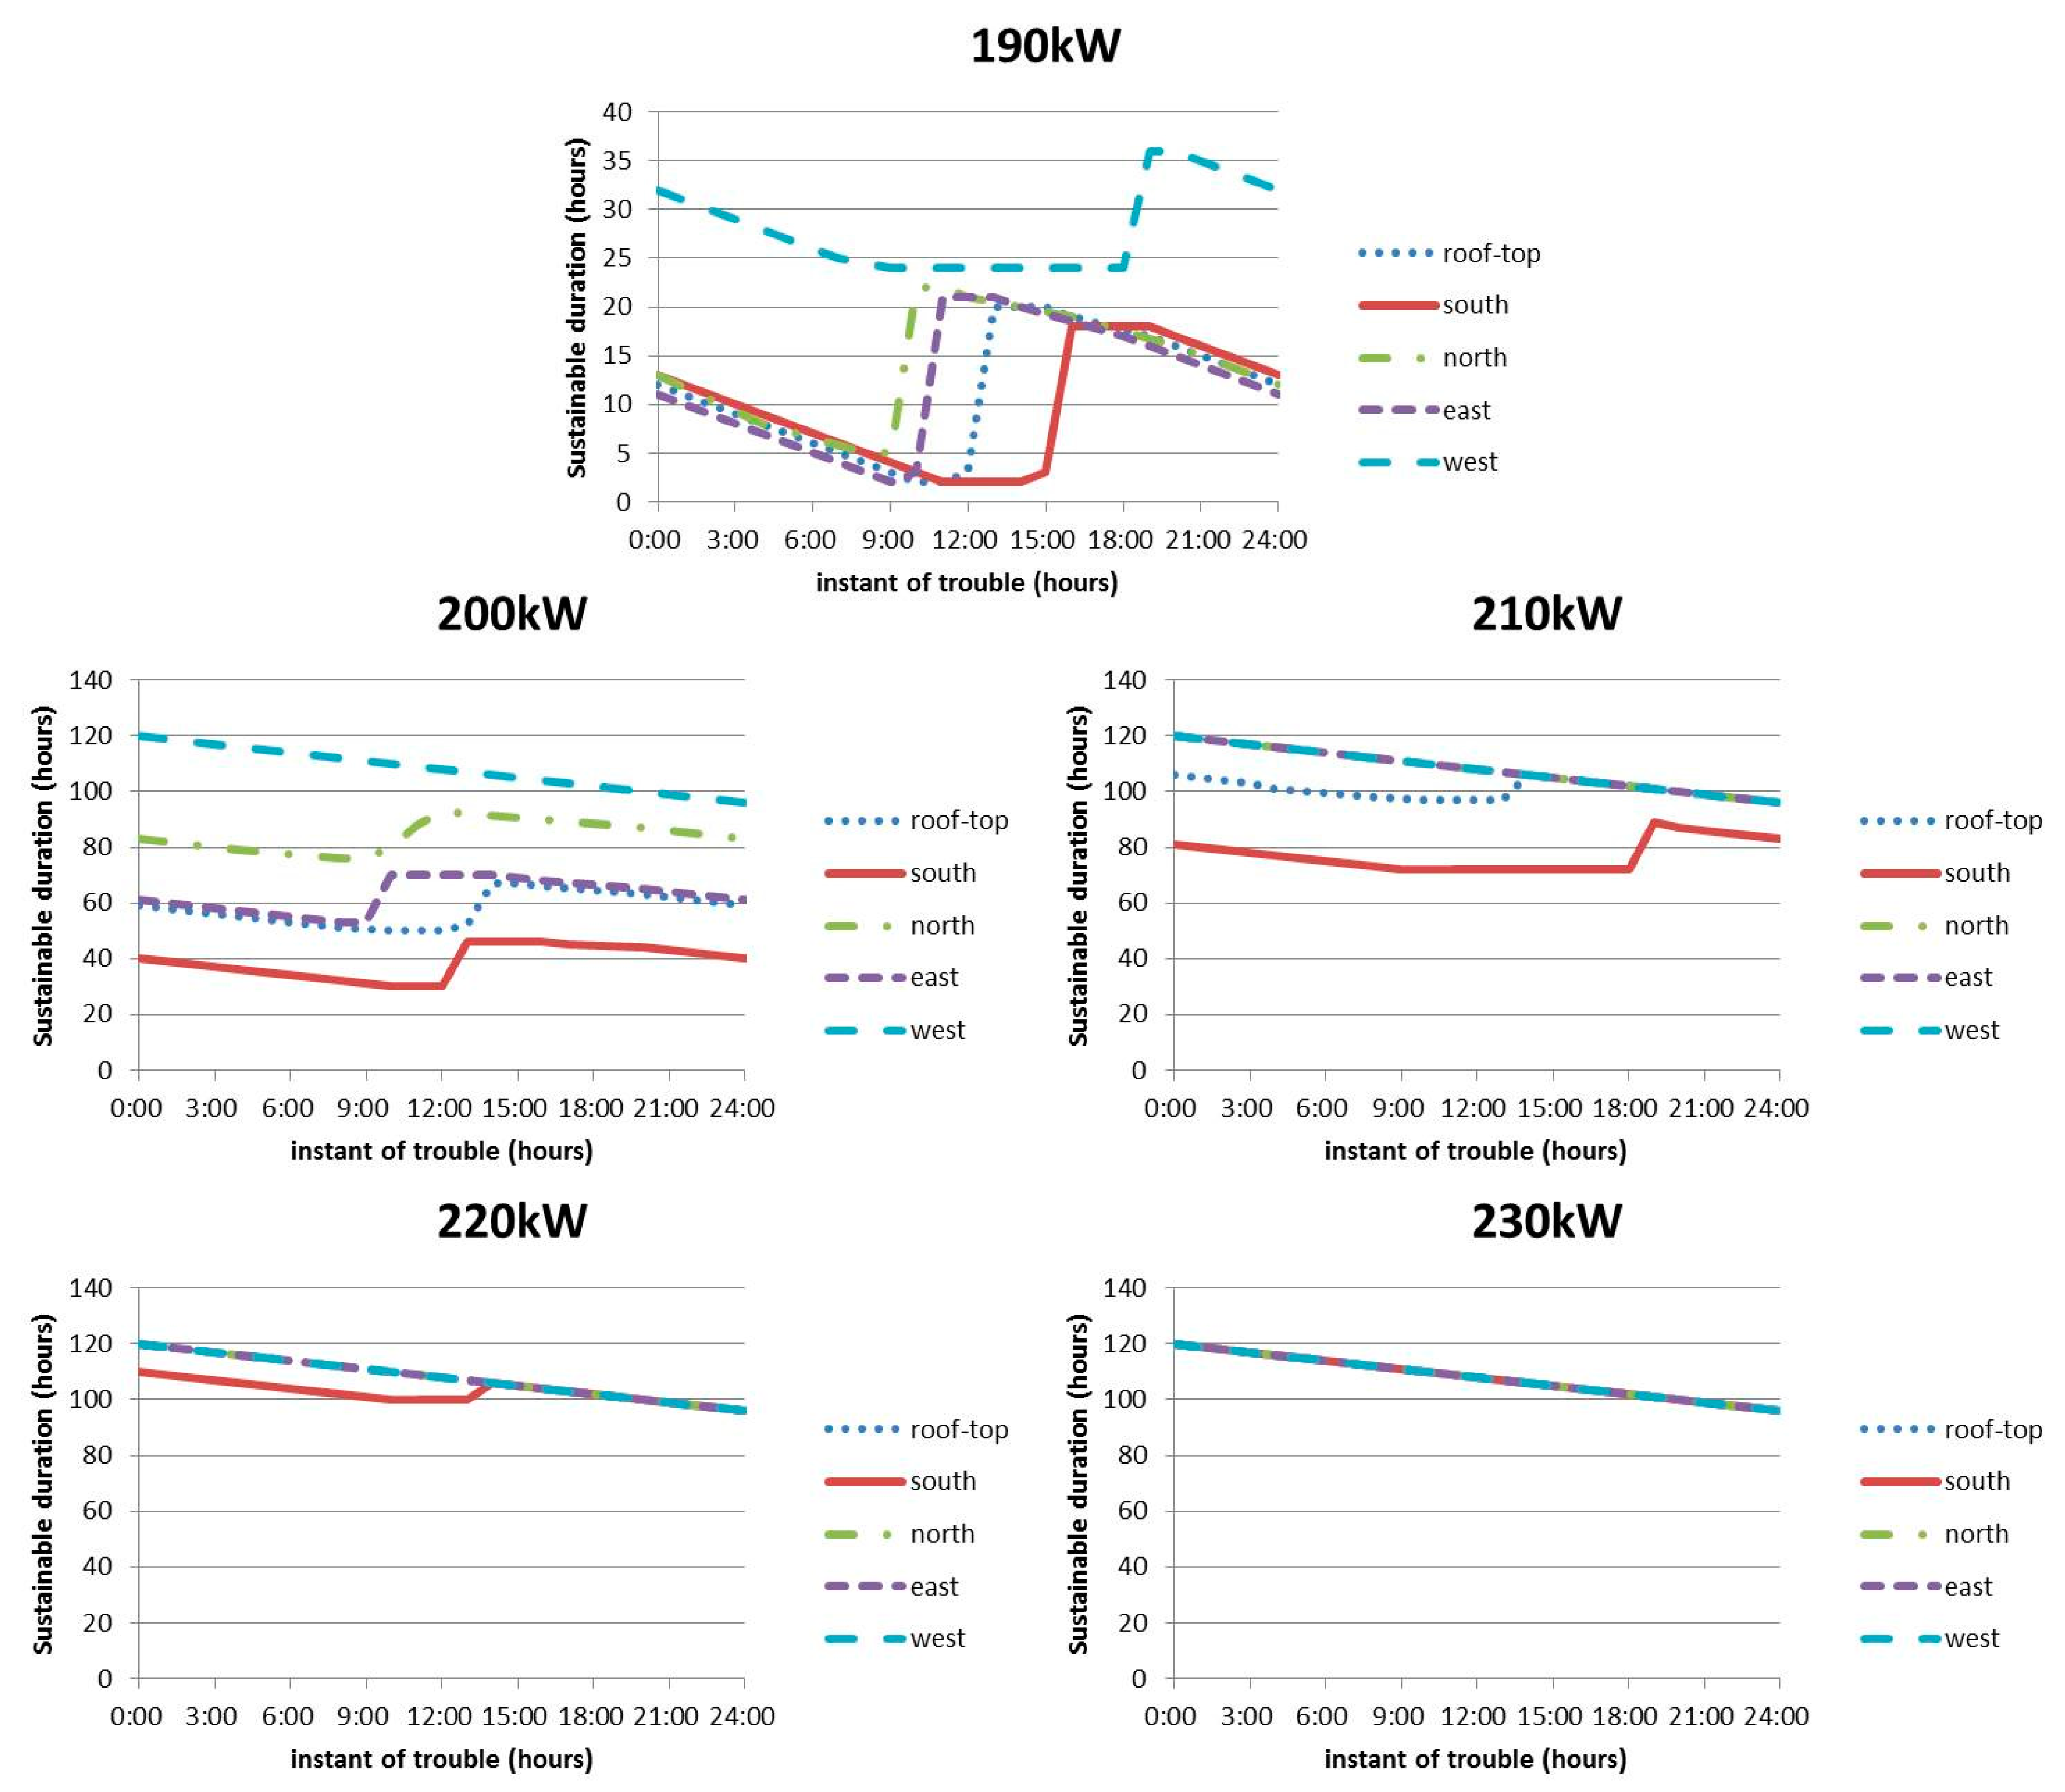
3.3. Sustainable Duration Analysis

The sustainable duration was analyzed following the steps in Section 2.1. The sustainable duration analysis was conducted for PV trouble at the five sides of the building. Figure 7 shows the sustainable duration results for different PV trouble rates at the roof-top, which is also known as the sustainable duration curve. Each of the sustainable duration curves for the different PV trouble rates have a similar trend. The sustainable duration gradually declines with an increasing instant of trouble, while it dramatically increases at a particular instant of trouble. Then again, the sustainable duration gradually declines with an increasing instant of trouble. The point where the sustainable duration dramatically increases is also known as the time boundary in this research. The time boundary is the point where the reliability was enhanced significantly. For a roof top trouble rate of 1.0, the time boundary was 12 pm. If a roof-top PV trouble rate of 1.0 occurs before this time boundary at 12:00, the electricity reliability is low due to the short sustainable duration. In contrast, the reliability is significantly improved when the same trouble occurs after the time boundary.
Besides that, it can be observed from Figure 7 that the increase in PV trouble rate leads to a lower sustainable duration curve. It should be noted that the time boundary is not consistent for the different condition of the sustainable duration curve. Each sustainable duration range at the time boundary (referred to as (a), (b), and (c)) corresponds to the time when PV does not operate because of night. The time boundaries of (a), (b), and (c), when referring to the sustainable duration axis, represent the nights of Monday, Tuesday, and Wednesday, respectively. Finally, it can be seen that the reliability of the electrical system is more secured with a lower trouble rate.
It can be mentioned that this sustainable duration can indicate the prediction of electricity reliability in the near future. The availability of such an electricity reliability prediction allows the facility engineer to make wiser decisions when they are provided with information on the available time before the stored energy is depleted.

3.4. Evaluation of the SESDI

The SESDI is first computed for PV trouble at the roof-top. For the different PV trouble rates, the area under the sustainable duration curve in Figure 7 was computed to obtain the SESDI. Similarly, the SESDI for the south, north, east, and west walls were also computed as summarized in Figure 8. It can be observed that the SESDI increases as the PV trouble rate is decreased and vice versa. In addition, under the same PV trouble rate, the SESDI decreases in the order of west, north, east, roof-top, and south walls of the building.
After that, the overall SESDI can be calculated by taking the root mean square for all 25 SESDIs in Figure 8 in the following equation.
O v e r a l l   S E S D I = i = 1 25 S E S D I 2 25
The computation of the overall SESDI took into account the different trouble rates at all sides of the building. The overall SESDI under 190 kW of base supply was 969.

4. Discussion

The developed methodology for evaluating the system adapting ability to remain self-sufficient in the short-term period after the occurrence of sudden disruptions was utilized to compute the new electricity reliability index dedicated for the power security aspect in Section 3. The SESDI is now readily implemented to determine the optimal capacity sizing in the context of energy security.
In this analysis the energy security index was developed based on three main indicators—electricity reliability, cost of energy, and diversification of energy sources. Under the previously identified maximum solar PV capacity of 1077 kW and 40 NaS battery modules, the energy security index was analyzed following the steps below:
  • The possible range of the base supply capacity will be identified through analysis of the sustainable duration.
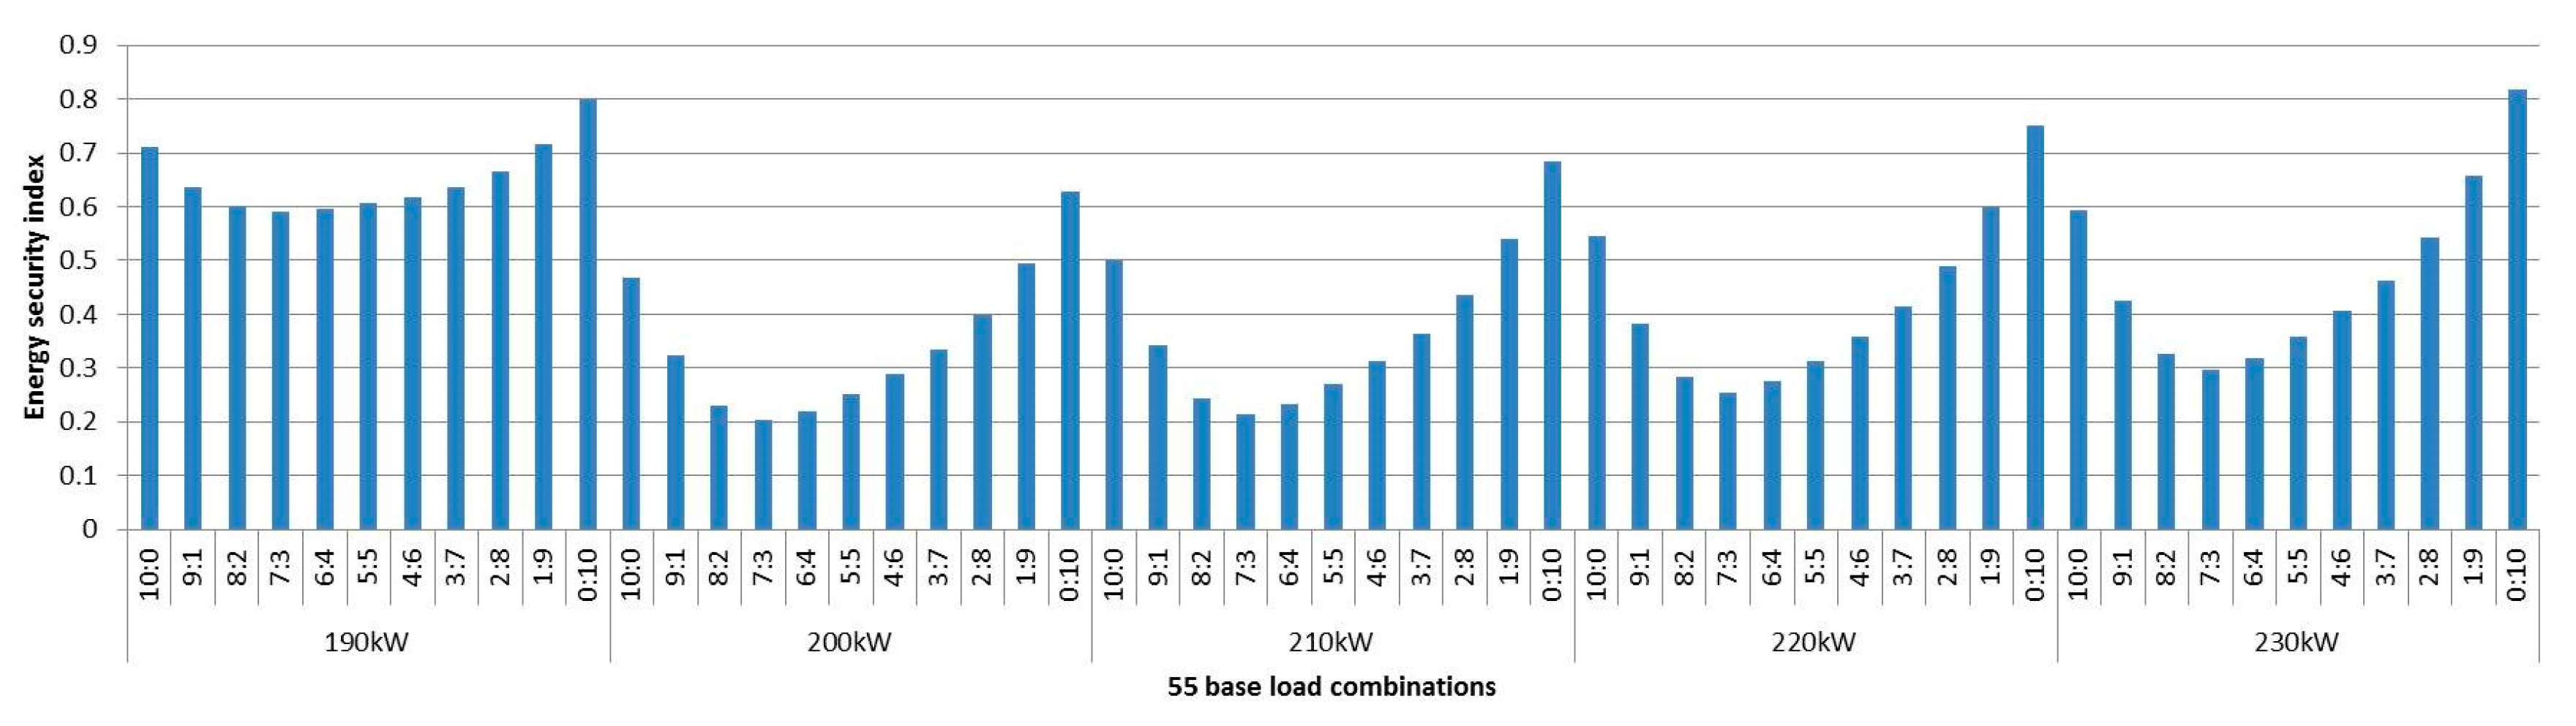
  • Three indicators were computed based on the different base supply capacities.
  • The computed values were normalized to be expressed in common units and were aggregated to obtain the energy security index.

4.1. Identification of the Possible Range of Installed Capacity for Base Supply

The previous section identified that the assessed electrical system requires a minimum 190 kW base supply to ensure sustainability. It must be noted that the 190 kW of the base supply only allows self-sufficiency under normal conditions. However, when the solar PV is experiencing trouble, some extra capacity beyond the 190 kW would be needed to account for the loss of power. As such, this section will identify the upper limit and also the range of possible base supply capacities.
It is assumed that any trouble in the solar PV can be rectified within five days. As such, the upper limit for base supply capacity is defined as the capacity that allows the electrical system to remain self-sufficient until the fifth day, even when solar PVs on any sides of the building are completely interrupted. In this analysis, the sustainable duration simulation as conducted in Section 2.1 is repeated here, but for an increasing amount of base supply capacity in steps of 10 kW. Upon completion of the simulation for each of the base supply capacities, the sustainable duration will be evaluated. If the electrical system cannot remain self-sufficient until the fifth day, the base supply capacity will be increased by 10 kW and the above steps will be repeated. The simulation will only stop when the electrical system can remain self-sufficient until the fifth day, even when PVs on any sides of the building are completely interrupted. The base supply capacity will be recorded as the upper limit of base supply capacity. The flow chart of the steps for identifying the possible range of installed base supply capacity is presented in Figure 9.
After completing the sustainable duration analysis for the different base supply capacities, the sustainable duration versus instant of trouble curve for varying trouble rates at all sides of the building are shown in Figure 10. In order to achieve self-sufficiency until the fifth day, the sustainable duration versus instant of trouble curve must be a straight line, starting with 120 sustained hours for the instant of trouble at 00:00 and ending with 96 sustained hours for the instant of trouble at 24:00. This ideal line is also known as the self-sufficient line.
It can be seen from Figure 10 that for a base supply between 190 kW and 220 kW, there is at least one sustainable duration curve that is below the self-sufficient line. This indicates that the electrical system is unable to remain self-sufficient until the fifth day. In contrast, a base capacity of 230 kW allows the electrical system to remain self-sufficient until the fifth day even when the installed PVs on any one side of the building are experiencing trouble.
In summary, the possible range of base supply capacity is between 190 kW and 230 kW. Subsequently, the energy security index under this varying amount of base supply capacity will be computed in the next section.

4.2. Computation of the Proposed Three Indicators

First, the electricity reliability in this section can be computed using the overall SESDI established in the previous section.
The cost of energy focuses on the base supply only since battery capacity and PV panel capacity do not change in the presented scenarios. In this model, the fuel cell and biomass generator are used as base supply generators. The levelized cost of energy (LCOE) is used in this analysis as it is accepted as a valuable financial tool for the comparison of various power sources [56]. 0.12 $/kWh of the LCOE of the fuel cell was used as the input for the costs in this research [57]. In contrast, the LCOE data of a small scale gas engine for biofuels [58] was taken from the work of the International Renewable Energy Agency (IRENA) [56], where the LCOE of the biomass fluidized bed gasifier was listed as 0.07–0.24 $/kWh. In this research, the mean value of 0.16 $/kWh is used as the input for biomass generator.
The diversification can be obtained by using Herfindahl–Hirschman Index (HHI) in the analysis. A lower value of HHI corresponds to higher diversity. In this study, base supply is composed of fuel cell and biomass with eleven possible combinations of fuel cell:biomass ratio: 10:0, 9:1, 8:2, 7:3, 6:4, 5:5, 4:6, 3:7, 2:8, 1:9, and 0:10.
The analysis in this section is conducted based on a total of 55 possible base supply combinations, comprising of five different possible capacities for the base supply (190, 200, 210, 220, and 230 KW) and 11 types of fuel cell to biomass ratio.

4.3. Evaluation of the Energy Security Index

Three energy security indicators were normalized. The computed value of electricity reliability, cost of energy, and diversification of energy sources is given in the form of X r i , X c i , and X d i , respectively. The lower value of cost and diversification, and the higher value of electricity reliability are regarded as a better choice. The normalized indicators are estimated by using the scaling technique where the minimum value is set to zero and the maximum is set to unity in the following manner:
I r i = M a x ( X r i ) X r i M A X ( X r i ) M i n ( X r i )
where r = electricity reliability, i = 55 combinations of base supply
I c i = X c i M i n ( X c i ) M A X ( X c i ) M i n ( X c i )
where c = cost, i = 55 combinations of base supply
I d i = X d i M i n ( X d i ) M A X ( X d i ) M i n ( X d i )
where d = diversification, i = 55 combinations of base supply
Finally, the energy security index was derived as the root mean square of the three normalized attributes with equal weight:
E n e r g y   s e c u r i t y   i n d e x = ( I r i ) 2 + ( I c i ) 2 + ( I d i ) 2 3
While the weighting on each of the proposed indicators is subjectively determined [59], an equal weight approach is commonly used as a reference case.
The energy security index represents the optimized relationship between the three indicators with the lower index indicating the better combination of the output of base supply and also fuel cell to biomass ratio.
Figure 11 shows the result of the energy security index. Under the 55 base supply combinations, 200 kW of base supply with a fuel cell to biomass ratio of 7:3 results in the best energy security index. In contrast, 230 kW of base supply comprising entirely of biomass results in the worst energy security index. For each of the different base supply capacities, the fuel cell to biomass ratio of 7:3 is the best combination for the base supply capacity. Due to the more expensive LCOE of biomass compared to the fuel cell, the fuel cell to biomass ratio of 0:10 resulted in the worst energy security index. On the other hand, for each of the different base supply capacities, there was a slight difference in the energy security index under the identical fuel cell to biomass ratios. This arises from the cost difference based on the given base supply capacity. Generally, 190 kW of base supply is more vulnerable compared to the other cases, due to the lower electricity reliability index. The development of this energy security index will assist the operator to decide the appropriate capacity sizing by considering energy security risk.
It should be mentioned that it is difficult to validate the obtained results. This is because the SESDI can be considered as a first-developed reliability index dedicated for power security. Many works have assessed the reliability of the electrical system by employing other indexes, including loss of load probability (LOLP), loss of load expectations (LOLE), and expected undelivered energy (EUE), which are highly associated with power adequacy [60]. Given the conceptual differences between static reliability of power adequacy and dynamic reliability of power security, the comparative analysis between the SESDI and other reliability indexes is not suitable for the validation of the obtained results. In addition, this paper develops the fictitious building with imaginary onsite-installed energy sources. Since the actual measured value is nonexistent, the simulated results on the basis of parametric analysis cannot be compared with the real data.
However, system modeling of the electrical system at the national scale by employing System Dynamics has already been validated through the comparison of the real grid in Japan [24]. This earlier research paper also conducted the parametric analysis using the real capacity of the energy source. Taking into consideration the high similarity in terms of close-loop modeling due to the utilization of storage technology and the utilization of real measured load demand and irradiation, it would be sufficiently conceivable to consider the obtained results in this paper valid. Furthermore, the dynamic behavior of simulated system modeling would be clearly verified in Figure 5.
The proposed approach contributes to the understanding of the electricity reliability dedicated for sudden disturbances and its application to determining optimal capacity sizing in the context of energy security. Meanwhile the analysis could be further improved by the inclusion of additional factors.
It must be noted that the load demand in this paper is measured in the building, as an example of electrical system, which has yet to install any demand response tool. However, in future, there is a high tendency for demand response tools, such as Home Energy Management System (HEMS) for a house scale, Building Energy Management System (BEMS) for a building scale, and two-way communication systems for a microgrid-scale to be installed to manage the power to prevent depletion. Consequently, the load demand curve will be shifted. As such, the results obtained in this research may deviate slightly if demand response tools are being applied. In cases where demand response tools are expected to be installed in the future electrical systems, further research can be conducted to first predict the actual load demand curve. After that, the previously developed SESDI and energy security index can again be applied for electricity reliability and energy security.
In addition, both SESDI and energy security index were formulated in this paper by considering constant backup storage capacity. To further enhance the SESDI and energy security index, future work should take into account the variation in the backup storage capacity. This will allow the utility operator to determine the best combination of both backup storage capacity and base supply capacity.
Subsequently, power reliability dedicated for the security aspect is computed on the basis of parametric assessment in a fictitious electricity grid system in this paper. On the other hand, most of the earlier research works practically conducted an empirical assessment in the context of the real world to assess power reliability. It must be noted that the existing approaches are highly associated with the adequacy aspect rather than the security aspect regarding power reliability. Integration of parametric assessment with empirical assessment would assist in providing a more comprehensive framework for evaluating power reliability from the perspectives of both adequacy and security.
Finally, even though the energy security analysis in this paper uses equal weight, the weighting of cost, security, and diversification might vary when evaluating other systems due to their different design goals. The assignment of weights will be influenced by the discrepancies in culture, economy, policy, and geographical locations. Furthermore, the cost of fuel cell and biomass energy generators could be expected to be cheaper in response to improved technologies stimulated by market competitiveness. In addition, global warming has the potential to change the weather, which would shift the pattern of irradiation. These uncertainties would affect the respective results of a composite index. As such, to implement this developed energy security index to other power systems, each of the weighting factors have to be fine-tuned accordingly.

5. Conclusions

This paper first proposed the concept of the prediction of supply reliability dedicated for the sudden disruption in an electrical system, which is based upon the amount of time the system can remain self-sufficient after the occurrence of trouble. This newly proposed electricity reliability index is known as System Electricity Sustainable Duration Index (SESDI). The methodology for quantitative analysis of electricity reliability was developed based on a fictitious electrical system. Subsequently, the developed electricity reliability was employed to form the energy security index to determine the optimal capacity sizing. It has been discovered that under the identified maximum solar PV capacity of 1077 kW and 40 NaS battery modules, 200 kW of base supply with a fuel cell to biomass ratio of 7:3 can be considered as the most appropriate installation design in this research.
The electricity demand and supply model developed in this paper does not consider the situation where electricity is transferred from other regions during contingencies in the fictitious grid connected power system. The difficulty of accounting for the emergent power importation from the outside after the occurrence of a sudden disruption in the developed algorithm is the major limitation of the current situation of the SESDI. This is because SESDI is highly dedicated for the closed power grid system. In practice, there are several other power system configurations that operate as an electrical system network. At least, given the similarity in system configuration, an algorithm to evaluate the electricity reliability and energy security can be readily implemented in any electrical system network including microgrids and rural electrification, as well as any self-contained national grid. In fact, the national grid of Japan experienced a sudden supply disruption in the aftermath of the Fukushima disaster due to the governmental strategy (e.g., planned power cuts [61]), and the developed algorithm is applicable to these situations. Additionally, the ease of applying or extending this methodology into other electrical system networks would be considered attractive. What implementers need to adjust in this developed methodology is the energy sources corresponding to the particular assessed grid and the time scale corresponding to the definition of short-term recovery from sudden disturbances. Considering the algorithm developed in this paper as a starting point of quantifying the vulnerability of a power system to sudden disturbances, an in-depth study will be undertaken to improve the power reliability.

Author Contributions

Conceptualization, S.K., C.K.T. and E.Y.; literature review, S.K. and E.Y.; methodology, S.K. and C.K.T.; software, S.K.; formal analysis, S.K.; investigation, S.K.; data curation, C.K.T.; writing-original draft preparation, S.K.; writing-review & editing, C.K.T.; supervision, C.K.T. and E.Y.; Funding Acquisition, E.Y.

Funding

This research was partially funded by the UM Living Lab Grant Program titled “Optimizing Energy Cost with the Evolution Computing Based Building Energy Management System” (program No: LL010/LL011/LL012-15SUS) through its sub-program titled “Smart Energy Utilization” (sub-program No: LL010-15SUS), Malaysia, and by the Environment Research and Technology Development Fund (S-16, 3K163001) of the Ministry of the Environment, Japan.

Acknowledgments

The authors would like to thank the editor and anonymous reviewers.

Conflicts of Interest

The authors declare no conflicts of interest.

References

  1. Ministry of Economy, Trade and Industry (METI). The Impact of Electricity Supply Limitation. 2011. Available online: http://www.chusho.meti.go.jp/pamflet/hakusyo/h23/h23/html/k124000.html (accessed on 7 April 2016).
  2. Ministry of Economy, Trade and Inovation. Energy Strategic Plan. 2014. Available online: http://www.enecho.meti.go.jp/en/category/others/basic_plan/pdf/4th_strategic_energy_plan.pdf (accessed on 20 August 2015).
  3. Vale, B.; Vale, R. The New Autonomous House: Design and Planning for Sustainability; Thames & Hudson Ltd.: London, UK, 2002. [Google Scholar]
  4. Feist, W. Life-cycle energy analysis: Comparison of low-energy house, passive house and self-sufficient house. In Proceedings of the International Symposium of CIB W67, Vienna, Austria, 8–10 September 1997. [Google Scholar]
  5. Kramer, J.; Krothapalli, A.; Greska, B. The Off-grid Zero Emission Building. In Proceedings of the Energy Sustainability Conference, Long Beach, CA, USA, 27–30 July 2007. [Google Scholar]
  6. Laustsen, J. Energy Efficiency Requirements in Building Codes. In Energy Efficiency Policies for New Building; OECD/IEA: Paris, France, 2008. [Google Scholar]
  7. Iqbal, M.T. A feasibility study of a zero energy home in Newfoundland. Renew. Energy 2004, 29, 277–289. [Google Scholar] [CrossRef]
  8. North American Electric Reliability Council (NERC). Glossary of Terms Used in NERC Reliability Standards. 2017. Available online: www.nerc.com/files/glossary_of_terms.pdf (accessed on 1 March 2017).
  9. Kjølle, G.H.; Utne, I.B.; Gjerde, O. Risk analysis of critical infrastructures emphasizing electricity supply and interdependencies. Reliab. Eng. Syst. Saf. 2012, 105, 80–89. [Google Scholar] [CrossRef]
  10. Chang, L.; Wu, Z. Performance and reliability of electrical power grids under cascading failures. Electr. Power Energy Syst. 2011, 33, 1410–1419. [Google Scholar] [CrossRef]
  11. Ren, H.; Dobson, I.; Carreras, B.A. Long-term effect of the n-1 criterion on cascading line outages in an evolving power transmission grid. IEEE Trans. Power Syst. 2008, 23, 1217–1225. [Google Scholar] [CrossRef]
  12. Haarla, L.; Pulkkinen, U.; Koskinen, M. A method for analysing the reliability of a transmission grid. Reliab. Eng. Syst. Saf. 2006, 93, 277–287. [Google Scholar] [CrossRef]
  13. Layton, L. Electric System Reliability Indices. 2004. Available online: http://iiee.org.ph/wp-content/uploads/2015/06/Distribution-System-Reliability-Improvement-2015-IIEE-MYC.pdf (accessed on 9 November 2016).
  14. Čepin, M. Distribution and Transmission System Reliability Measures. In Assessment of Power System Reliability; Springer: Berlin, Germany, 2011; Chapter 14; pp. 215–226. [Google Scholar]
  15. Celik, N. Effect of different load profiles on the loss-of load probability of stand-alone photovoltaic systems. Renew. Energy 2007, 32, 2096–2115. [Google Scholar] [CrossRef]
  16. Jakhrani, Q.; Othman, A.-K.; Rigit, A.R.H.; Samo, S.R.; Kamboh, S.A. A novel analytical model for optimal sizing of standalone photovoltaic systems. Energy 2012, 46, 675–682. [Google Scholar] [CrossRef]
  17. Lucio, J.H.; Valdés, R.; Rodríguez, L.R. Loss-of-load probability model for stand alone photovoltaic systems in Europe. Sol. Energy 2012, 86, 2515–2535. [Google Scholar] [CrossRef]
  18. Abouzahr, I.; Ramakumar, R. Loss of power supply probability of stand alone photovoltaic systems: A closed form approach. IEEE Trans. Energy Convers. 1991, 6, 1–11. [Google Scholar] [CrossRef]
  19. Cabral, V.T.; Filho, D.O.; Diniz, A.S.A.C.; Martins, J.H.; Toledo, O.M.; de Vilhena, B.L.; Neto, M. A stochastic method for stand-alone photovoltaic system sizing. Sol. Energy 2010, 84, 1628–1636. [Google Scholar] [CrossRef]
  20. Kundur, P.; Paserba, J.; Ajjarapu, V.; Andersson, G.; Bose, A.; Canizares, C.; Hatziargyriou, N.; Hill, D.; Stankovic, A.; Taylor, C.; et al. Definition and classification of power system stability. IEEE Trans. Power Syst. 2004, 19, 1387–1401. [Google Scholar]
  21. Kosai, S.; Yamasue, E. Cost-Security Analysis Dedicated for the Off-grid Electricity System. Renew. Energy 2018, 115, 871–879. [Google Scholar] [CrossRef]
  22. Hu, F.Y.; Yeung, C.H.; Yang, S.; Wang, W.P.; Zeng, A. Recovery of infrastructure networks after localised attacks. Sci. Rep. 2016, 6, 24522. [Google Scholar] [CrossRef] [PubMed] [Green Version]
  23. Hazi, G.; Bică, D.; Hazi, A. Considerations on an Indicator Guaranteed in the Electricity Supply to Consumers. Procedia Technol. 2015, 19, 643–650. [Google Scholar] [CrossRef]
  24. Kosai, S.; Unesaki, H. Quantitative Analysis on the Impact of Nuclear Energy Supply Disruption on Electricity Supply Security. Appl. Energy 2018, 208, 1198–1207. [Google Scholar] [CrossRef]
  25. Zhang, S.; Huang, P.; Sun, Y. A multi-criterion renewable energy system design optimization for net zero energy buildings under uncertainties. Energy 2016, 94, 654–655. [Google Scholar] [CrossRef]
  26. Miller, W. What does built environment research have to do with risk mitigation, resilience and disaster recovery? Sustain. Cities Soc. 2015, 19, 91–97. [Google Scholar] [CrossRef]
  27. Khatib, T.; Mohamed, A.; Sopian, P. A review of photovoltaic systems size optimization techniques. Renew. Sustain. Energy Rev. 2013, 22, 454–465. [Google Scholar] [CrossRef]
  28. Henneaux, P.; Labeau, P.E.; Maun, J.C. Blackout Probabilistic Risk Assessment and Thermal Effects: Impacts of Changes in Generation. IEEE Trans. Power Syst. 2013, 28, 4722–4731. [Google Scholar] [CrossRef]
  29. Henneaux, P.; Labeau, P.E.; Maun, J.C. A level-1 probabilistic risk assessment to blackout hazard in transmission power systems. Reliab. Eng. Syst. Saf. 2012, 102, 41–52. [Google Scholar] [CrossRef]
  30. Kosai, S.; Rahim, N.A. Energy mix with the vulnerability of nuclear power utilization. In Proceedings of the 4th IET International Conference on Clean Energy and Technology CEAT 2016, Kuala Lumpur, Malaysia, 14–15 November 2016; pp. 1–7. [Google Scholar] [CrossRef]
  31. Ang, W.; Choong, W.L.; Ng, T.S. Energy security: Definitions, dimensions and indexes. Renew. Sustain. Energy Rev. 2015, 42, 1077–1093. [Google Scholar] [CrossRef]
  32. Sovacool, B.K. Evaluating energy security in the Asia pacific: Towards a more comprehensive approach. Energy Policy 2011, 39, 7472–7479. [Google Scholar] [CrossRef]
  33. Sovacool, B.K.; Mukherjee, I. Conceptualizing and measuring energy security: A synthesized approach. Energy 2011, 36, 5343–5355. [Google Scholar] [CrossRef]
  34. Portugal-Pereira, J.; Esteban, M. Implications of paradigm shift in Japan’s electricity security of supply: A multi-dimensional indicator assessment. Appl. Energy 2014, 123, 424–434. [Google Scholar] [CrossRef]
  35. Jansen, C. Energy Services Security: Concepts and Metrics; Energy Research Centre of the Netherlands (ECN): ZG Petten, The Netherlands, 2009. [Google Scholar]
  36. Streimikiene, D.; Ciegis, R.; Grundey, D. Energy indicators for sustainable development in Baltic State. Renew. Sustain. Energy Rev. 2007, 11, 877–893. [Google Scholar] [CrossRef]
  37. Sovacool, B.K.; Brown, M.A. Competing dimensions of energy security: An international perspective. Annu. Rev. Environ. Resour. 2010, 35, 77–108. [Google Scholar] [CrossRef]
  38. Institute for 21st Century Energy. Energy Index of U.S. Energy Security Risk ed.; Chamber of Commerce: Washington, DC, USA, 2012. [Google Scholar]
  39. Winzer, C. Conceptualizing energy security. Energy Policy 2012, 46, 36–48. [Google Scholar] [CrossRef]
  40. Martchamadol, J.; Kumar, S. Thailand’s energy security indicators. Renew. Sustain. Energy Rev. 2012, 16, 6103–6122. [Google Scholar] [CrossRef]
  41. Cohen, G.; Joutz, F.; Loungani, P. Measuring energy security: Trends in the diversification of oil and natural gas supplies. Energy Policy 2011, 39, 4860–4869. [Google Scholar] [CrossRef] [Green Version]
  42. Wu, G.; Liu, L.C.; Han, Z.Y.; Wei, Y.M. Climate protection and China’s energy security: Win-win or tradeoff. Appl. Energy 2012, 97, 157–163. [Google Scholar] [CrossRef]
  43. Cabalu, H. Indicators of security of natural gas supply in Asia. Energy Policy 2010, 38, 218–225. [Google Scholar] [CrossRef]
  44. International Energy Agency (IEA). Towards Net Zero Energy Solar Buildings—Fact Sheet; SHC Task 40/ECBCS Annex 52 IEA; IEA: Paris, France, 2011. [Google Scholar]
  45. Clift, R. Climate change and energy policy: The importance of sustainability arguments. Energy 2007, 32, 262–268. [Google Scholar] [CrossRef]
  46. Wolstenholme, E.F. System Enquiry. A System Dynamics Approach; John Wiley and Sons: Chichester, UK, 1990. [Google Scholar]
  47. Senge, P. The Fifth Discipline: The Art and Practice of Learning Organization; Random House Business: New York, NY, USA, 1990; p. 424. [Google Scholar]
  48. Lempert, R.; Popper, S.; Bankes, S. Shaping the Next One Hundred Years: New Methods for Quantitative, Long-Term Policy Analysis; RAND Report MR-1626; RAND Corporation: Santa Monica, CA, USA, 2003. [Google Scholar]
  49. Kosai, S.; Tan, C. Quantitative analysis on a zero energy building performance from energy trilemma perspective. Sustain. Cities Soc. 2017, 32, 130–141. [Google Scholar] [CrossRef]
  50. Chartered Institution of Building Services Engineers (CIBSE). Fuel Cells for Buildings. DATASHEET. 2012. Available online: http://www.cibse.org/getmedia/dc463e28-a44d-4072-8d76-8a023815b6c1/Datasheet-4-Fuel-cells.pdf.aspx (accessed on 2 September 2016).
  51. Torcellini, P.; Pless, S.; Deru, M.; Crawley, D. Zero Energy Buildings: A Criteria Look at the Definition; ACEEE Summer Stud: Pacific Grove, CA, USA, 2006. [Google Scholar]
  52. Oh, T.H.; Pang, S.Y.; Chua, S.C. Energy policy and alternative energy in Malaysia: Issues and challenges for sustainable growth. Renew. Sustain. Energy Rev. 2010, 14, 1241–1252. [Google Scholar] [CrossRef]
  53. New Energy and Industrial Technology Development Organization (NEDO). NEDO Irradiation Data Base. 2016. Available online: http://app0.infoc.nedo.go.jp/metpv/metpv.html (accessed on 8 July 2016).
  54. Chen, H.; Cong, T.N.; Yang, W.; Tan, C.T.; Li, Y.; Ding, D. Progress in electrical energy storage system: A critical review. Prog. Nat. Sci. 2009, 19, 291–312. [Google Scholar] [CrossRef]
  55. NGK Insulator. Sodium Sulphur Battery, Energy Storage System. 2016. Available online: https://www.ngk.co.jp/nas/specs/#dStructure (accessed on 19 July 2016).
  56. International Renewable Energy Agency (IRENA). Renewable Energy Technologies: Cost Analysis Series. 2012. Available online: https://www.irena.org/DocumentDownloads/Publications/RE_Technologies_Cost_Analysis-BIOMASS.pdf (accessed on 27 August 2016).
  57. McPhail, S.J.; Leto, L.; Pitra, M.D.; Cigolotti, V.; Moreno, A. International Status of Molten Carbonate Fuel Cells Technology; Advanced Fuel Cells Implementing Agreement, Annex 23—MCFC; E.N.E.A.: Rome, Italy, 2015. [Google Scholar]
  58. Bradin, J.; Tunér, M.; Odenbrand, I. Small Scale Gasification: Gas Engine CHP for biofuels. Lund University and Linnaeus University, Växjö/Lund. 2011. Available online: http://www.ieatask33.org/download.php?file=files/file/publications/new/Small%20Small_scale_gasification_overview.pdf (accessed on 31 August 2016).
  59. Sartori, I.; Napolitano, A.; Voss, K. Net zero energy buildings: A consistent definition framework. Energy Build. 2012, 48, 220–232. [Google Scholar] [CrossRef] [Green Version]
  60. Nakahara, T.; Kurihara, I. Reliability Criteria for Generation and Transmission System Planning in Foreign Countries. IEEJ Trans. Power Energy 1994, 114, 960–963. [Google Scholar] [CrossRef]
  61. TEPCO. Tokyo Electronic Company Press Release. 2011. Available online: http://www.tepco.co.jp//cc/press/index1103-j.html (accessed on 15 August 2015).
Figure 1. Flowchart of the steps for obtaining the SESDI.
Sustainability 10 02059 g001
Figure 2. Electricity demand and supply model.
Sustainability 10 02059 g002
Figure 3. Solar photovoltaic (PV) model.
Sustainability 10 02059 g003
Figure 4. PV power for each sides of building.
Sustainability 10 02059 g004
Figure 5. One-week electricity configuration in the case of 150, 170, 190 kW.
Sustainability 10 02059 g005
Figure 6. Amount of energy deficit under the different base supply capacities.
Sustainability 10 02059 g006
Figure 7. Sustainable duration for the roof-top under 190 kW of base supply when changing the PV trouble rate.
Sustainability 10 02059 g007
Figure 8. SESDI of each sides of the building under different PV trouble rates.
Sustainability 10 02059 g008
Figure 9. Flowchart of the steps for the identification of the possible range of installed base supply capacity.
Sustainability 10 02059 g009
Figure 10. Sustainable duration curve under 1.0 of the trouble rate with different base supply.
Sustainability 10 02059 g010
Figure 11. Energy security index.
Sustainability 10 02059 g011

