Changes in Environmental Awareness and Its Connection to Local Environmental Management in Water Conservation Zones: The Case of Beijing, China

 , ,
, ,
Abstract
:1. Introduction
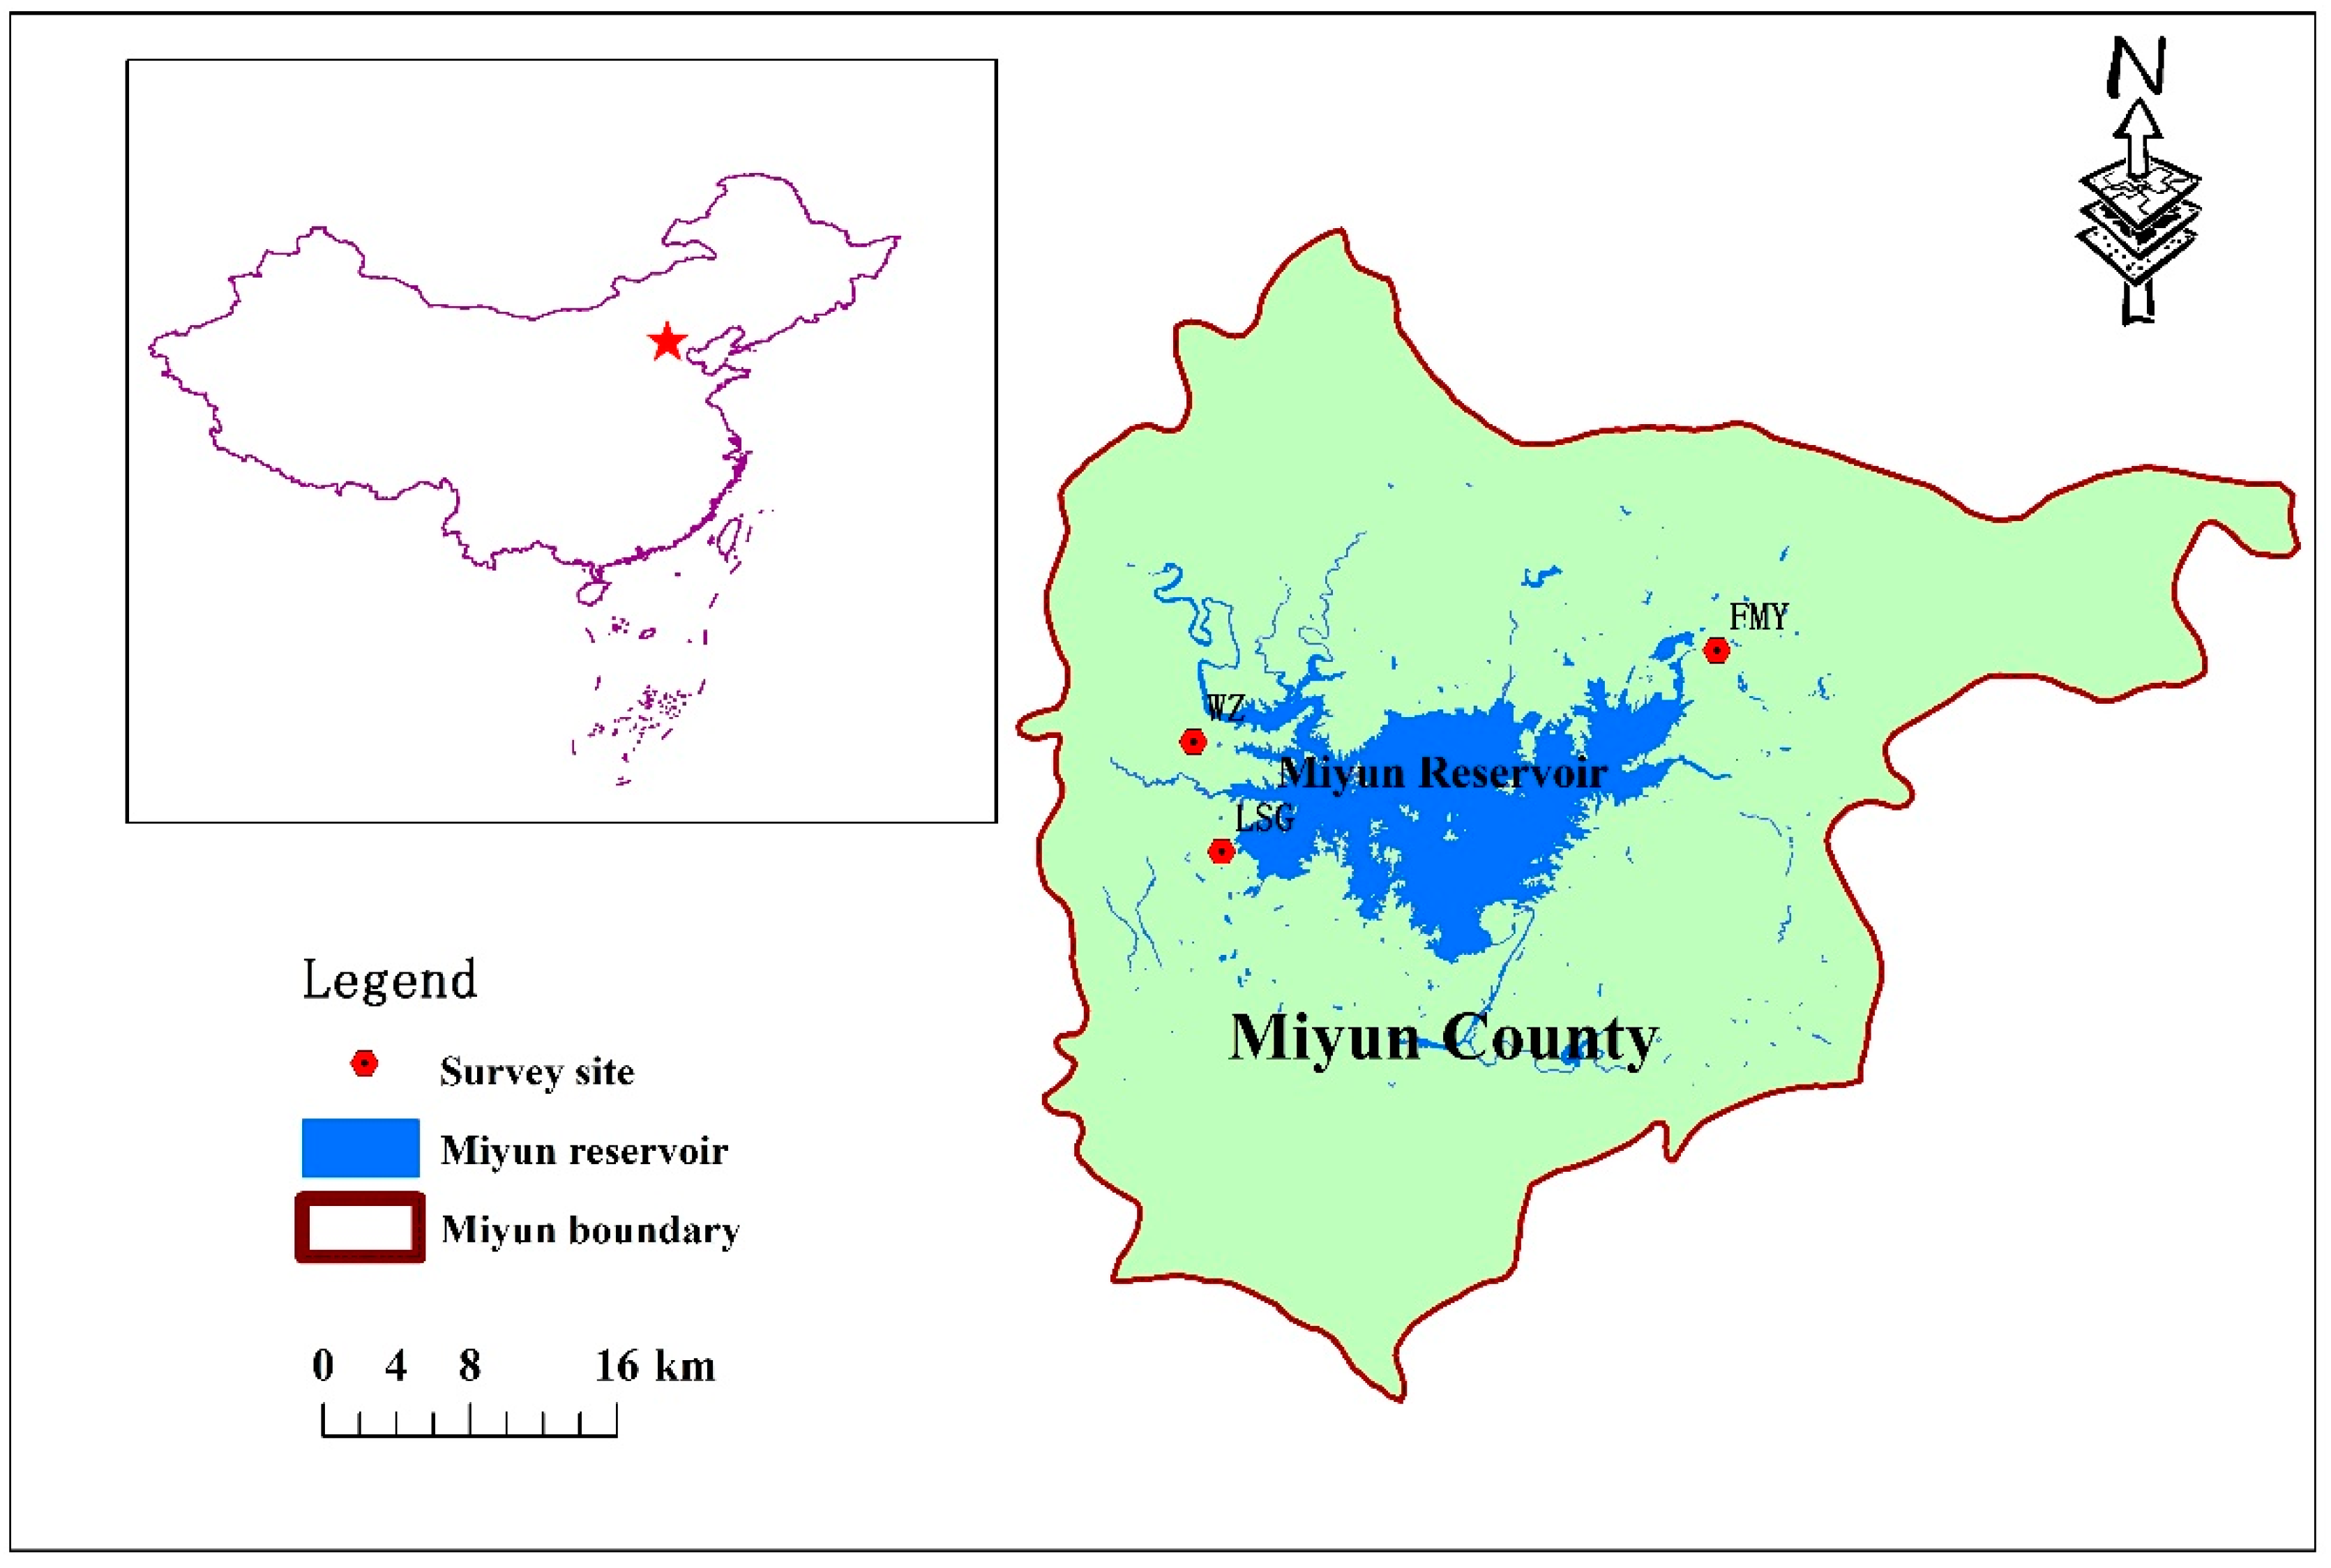
2. Study Area
3. Methodology
3.1. Questionnaire Design
- (1)
- Demographic and socioeconomic information, including age, gender, education level, and economic source.
- (2)
- Environmental behavior, including wastewater treatment, garbage collection, and human and animal feces treatment.
- (3)
- Perception of water environmental quality, including water quality and pollution status.
- (4)
- Attitude towards environmental improvement, including residents’ willingness to pay (WTP) for environmental management services, attitude towards environmental protection measures, and responsibility for environmental improvement [14].
3.2. Data Collection
3.3. Calculation Method
4. Results
4.1. Demographic and Socioeconomic Characteristics
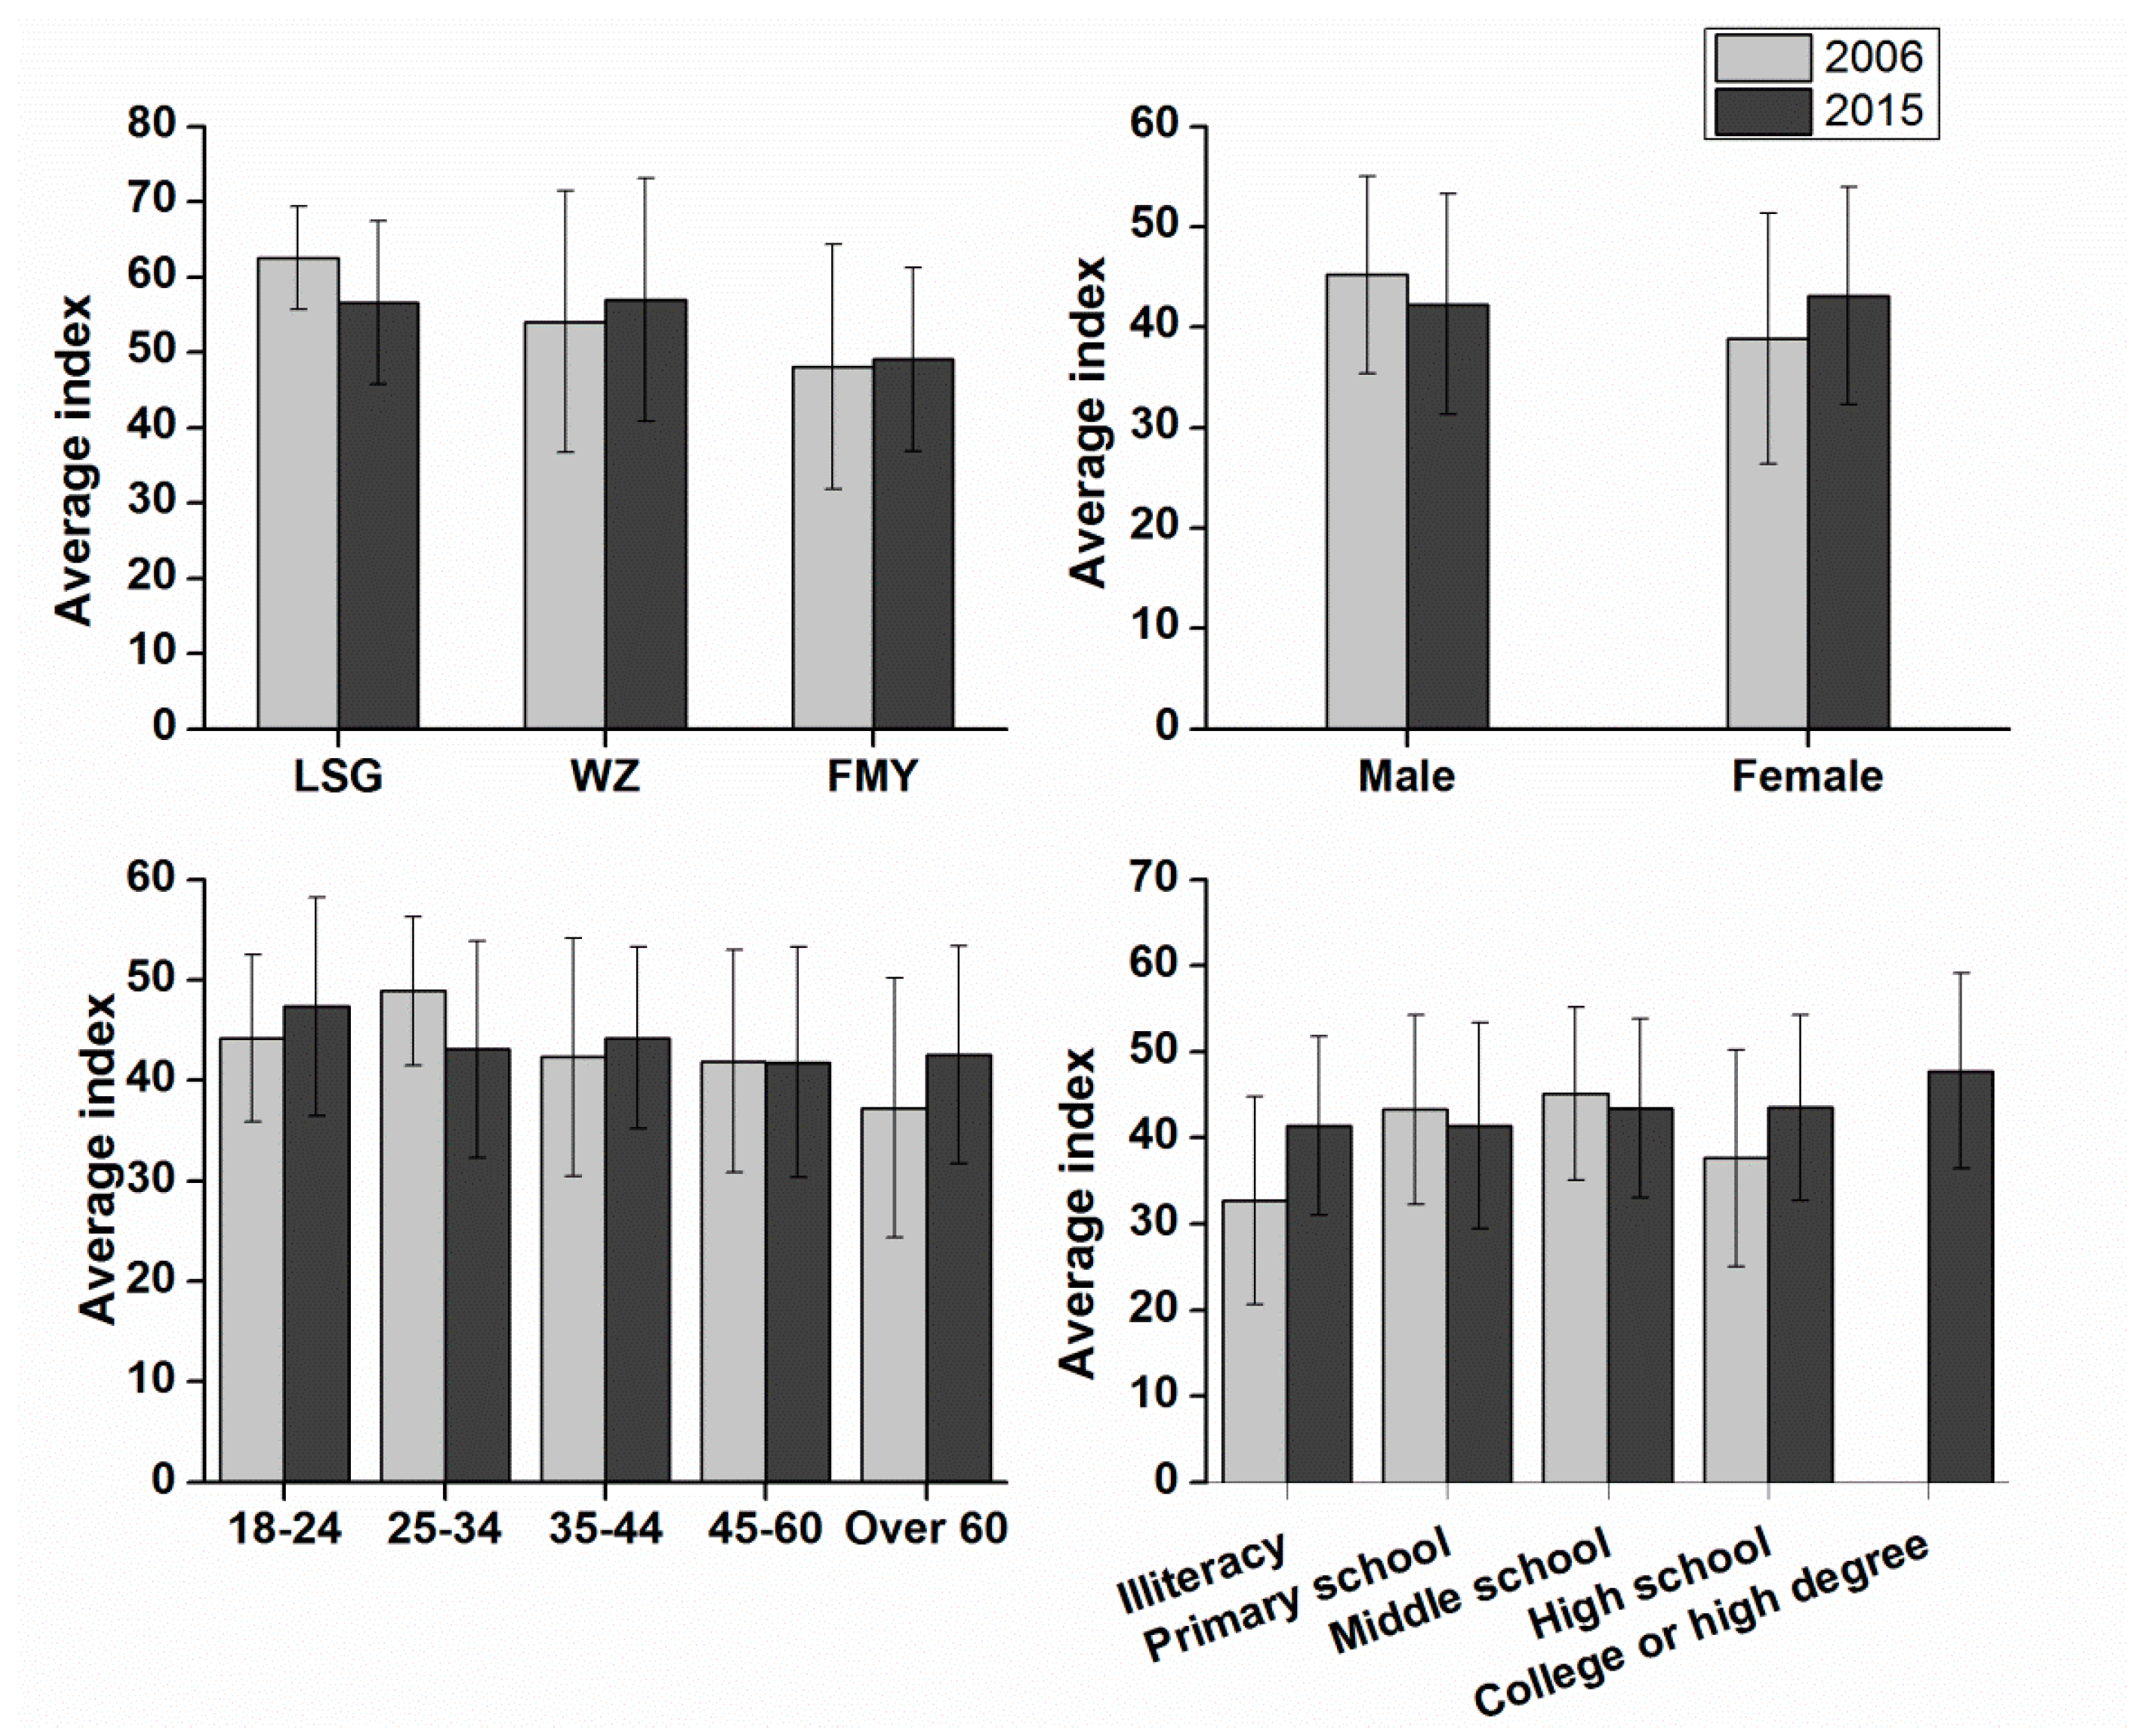
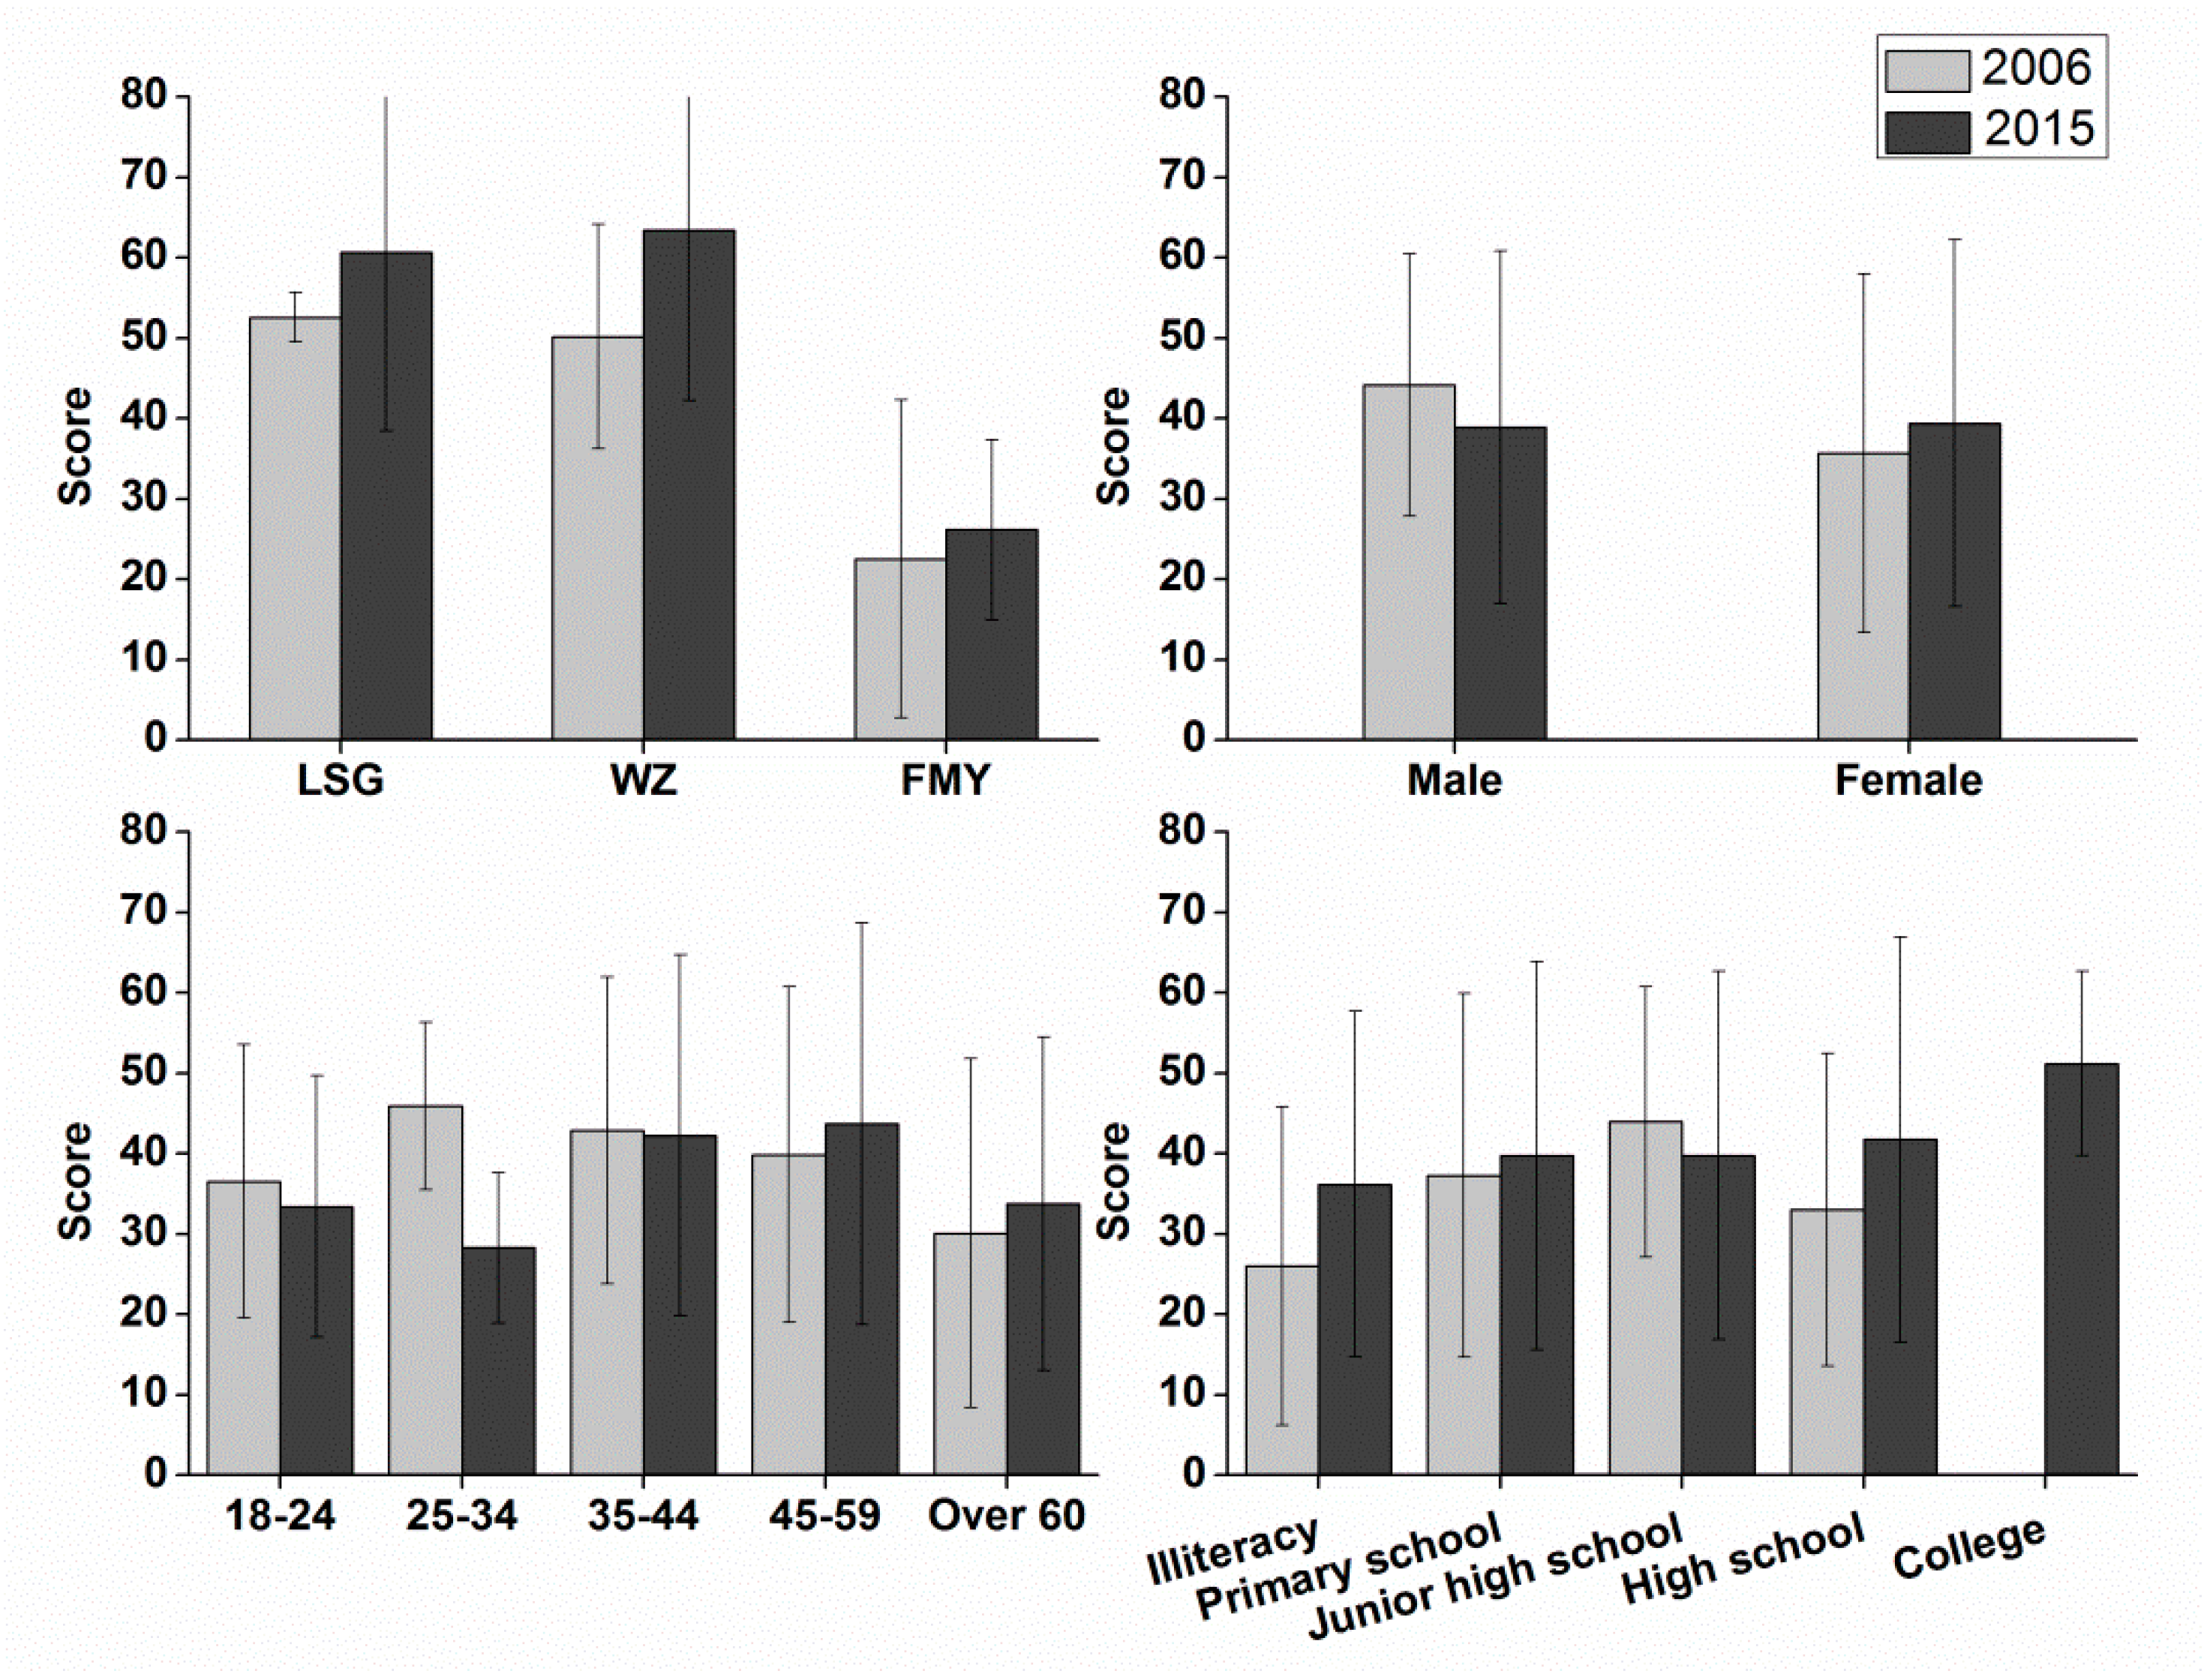
4.2. Comprehensive Index of Environmental Awareness
4.3. Analysis of Changes in Environmental Behavior
4.3.1. Wastewater Treatment
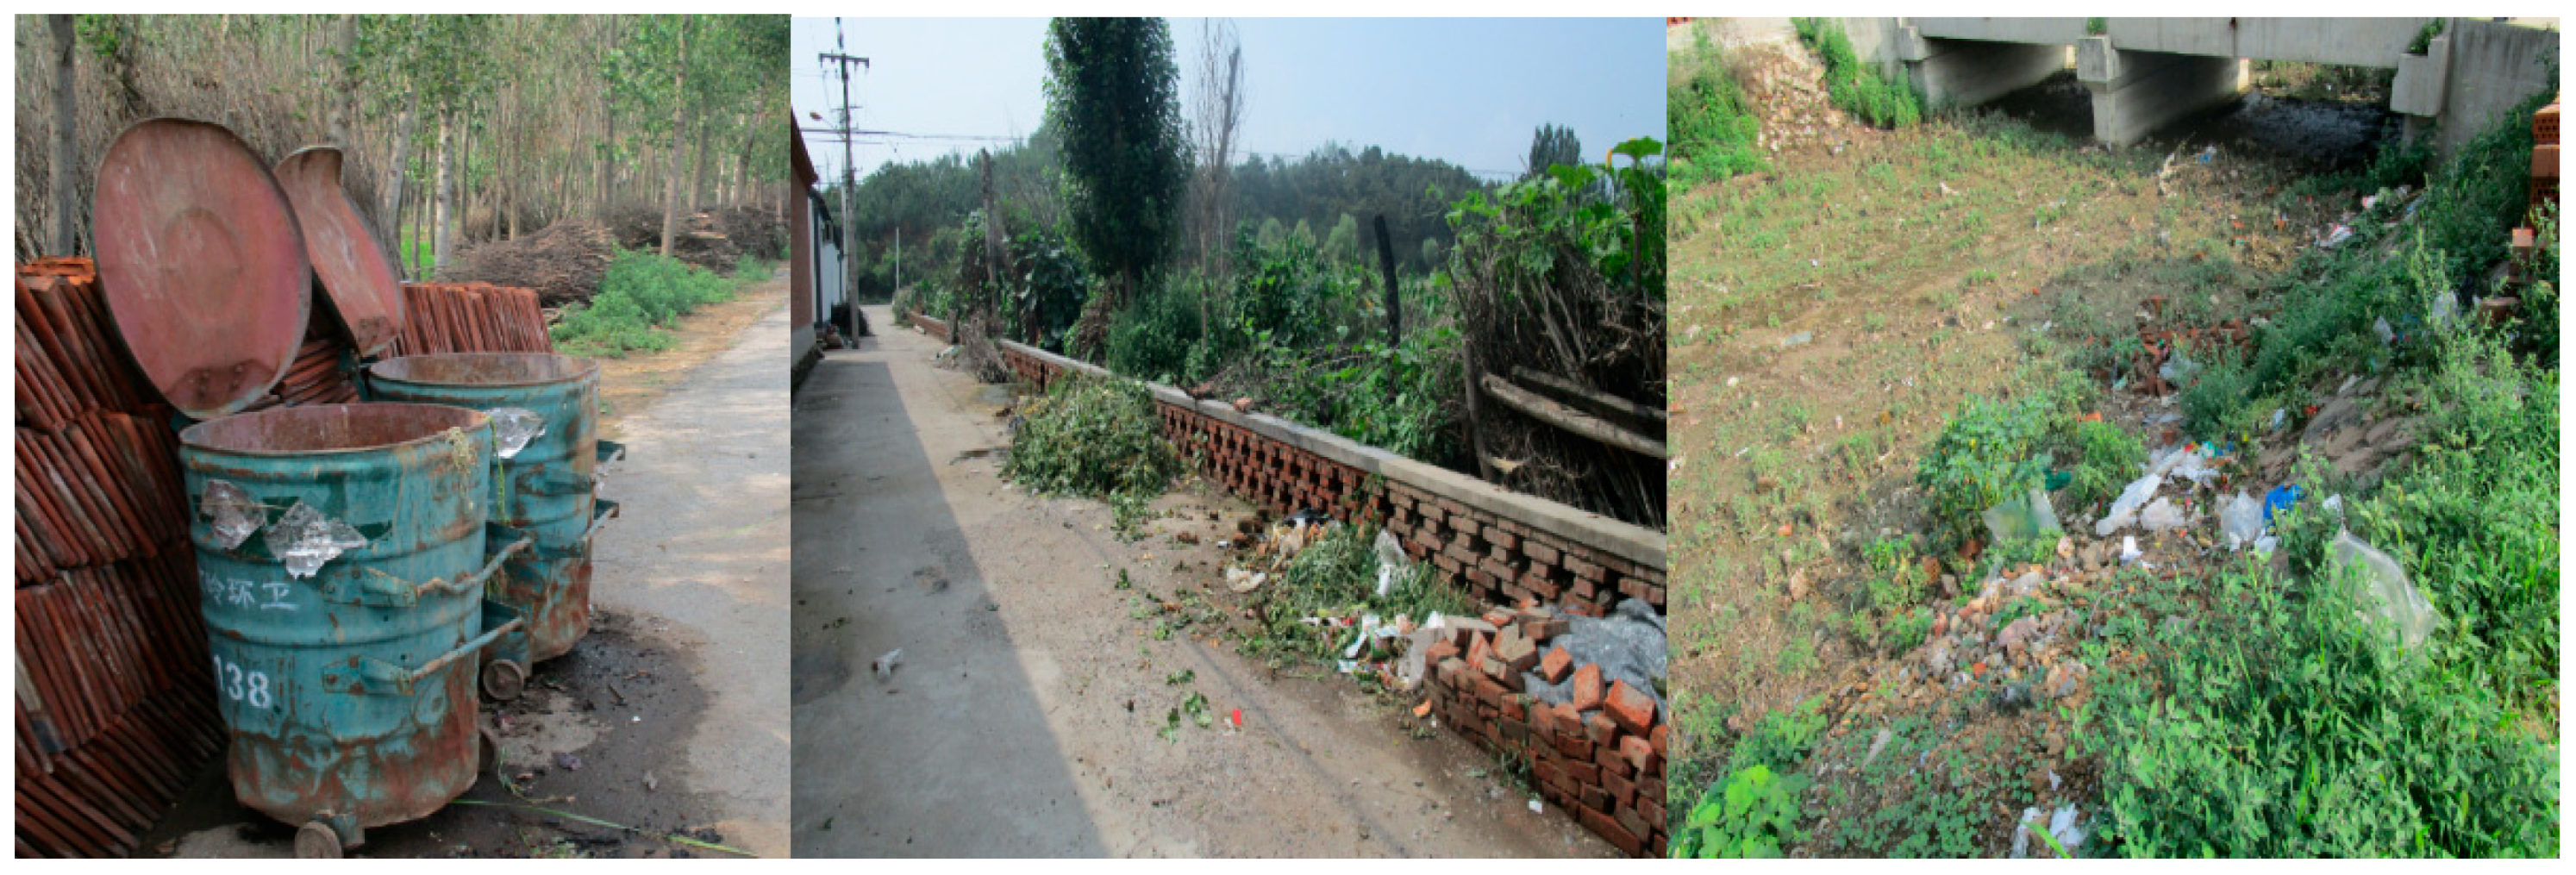
4.3.2. Daily Garbage Treatment
4.3.3. Feces Treatment
4.4. Analysis of Changes in Water Quality Perception
4.4.1. Perception of Water Quality
4.4.2. Source of Water Pollution
4.4.3. Access to Environmental Information
4.5. Analysis of Changes in Attitude Toward Environmental Improvement
4.5.1. Responsibility to Improve the Environment
4.5.2. Attitude Toward Environmental Protection Measures
4.5.3. Changes in Willingness to Pay for Improvement in the Water Environment
5. Discussion
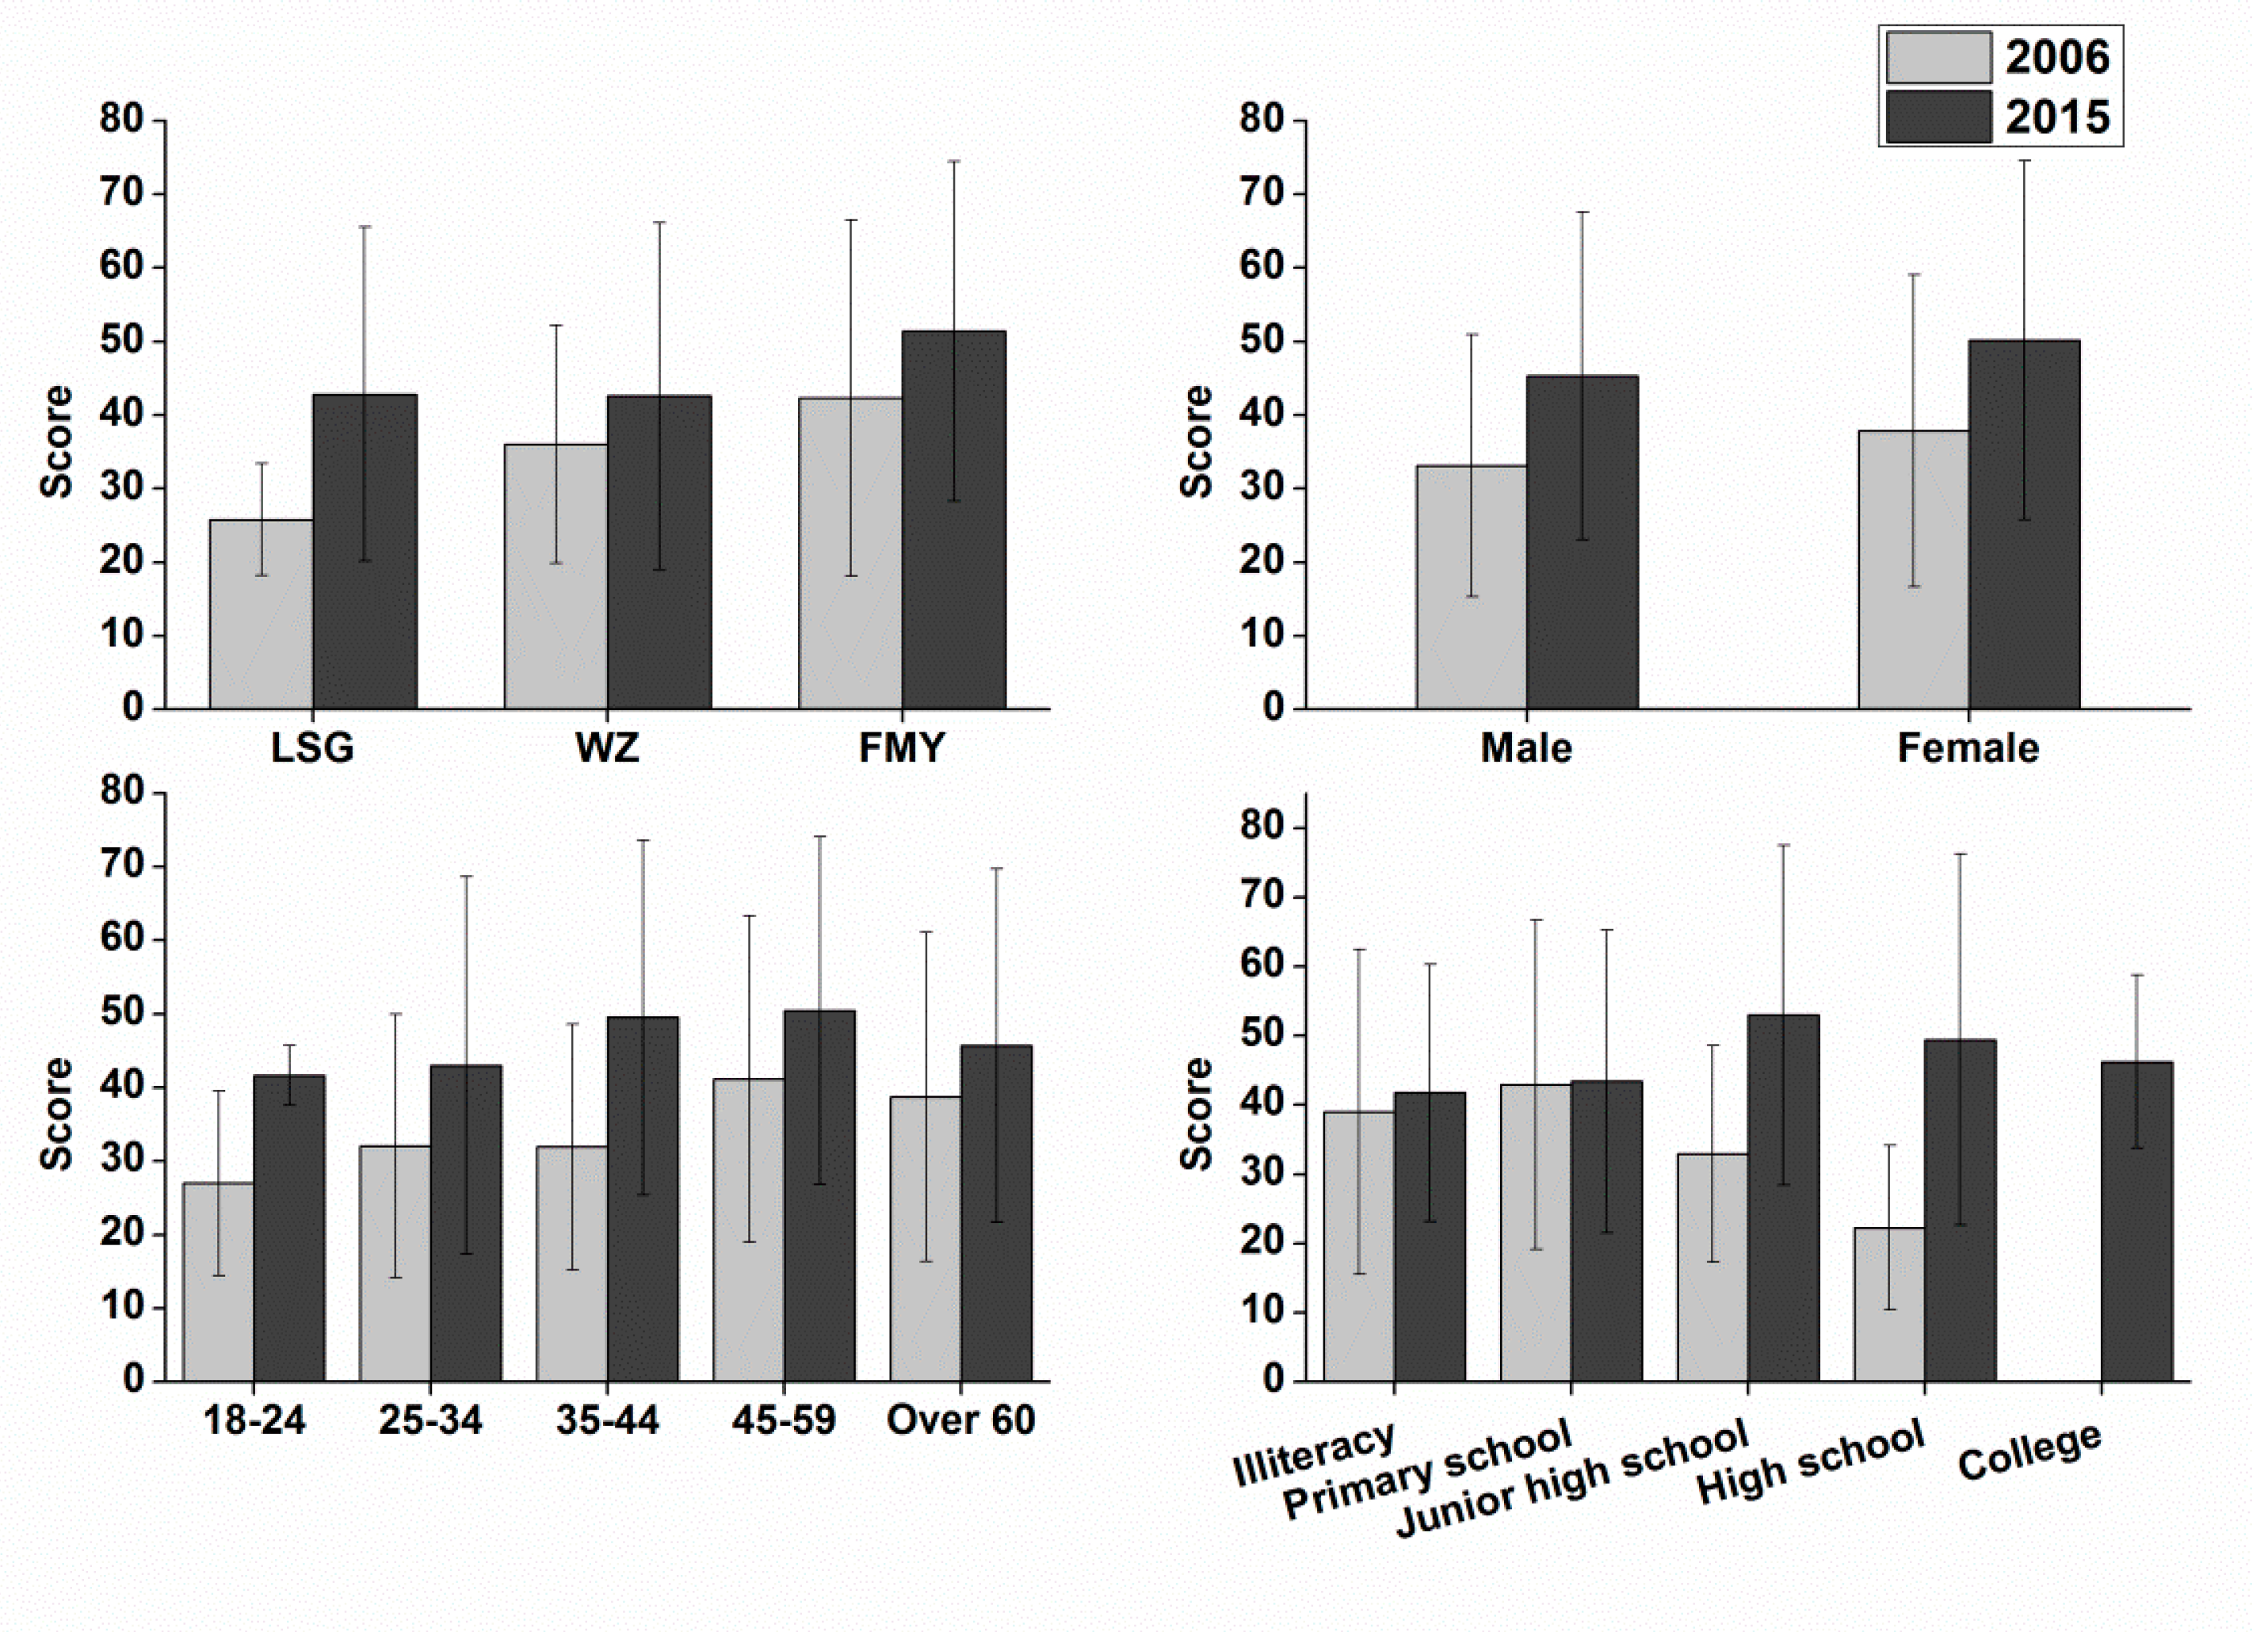
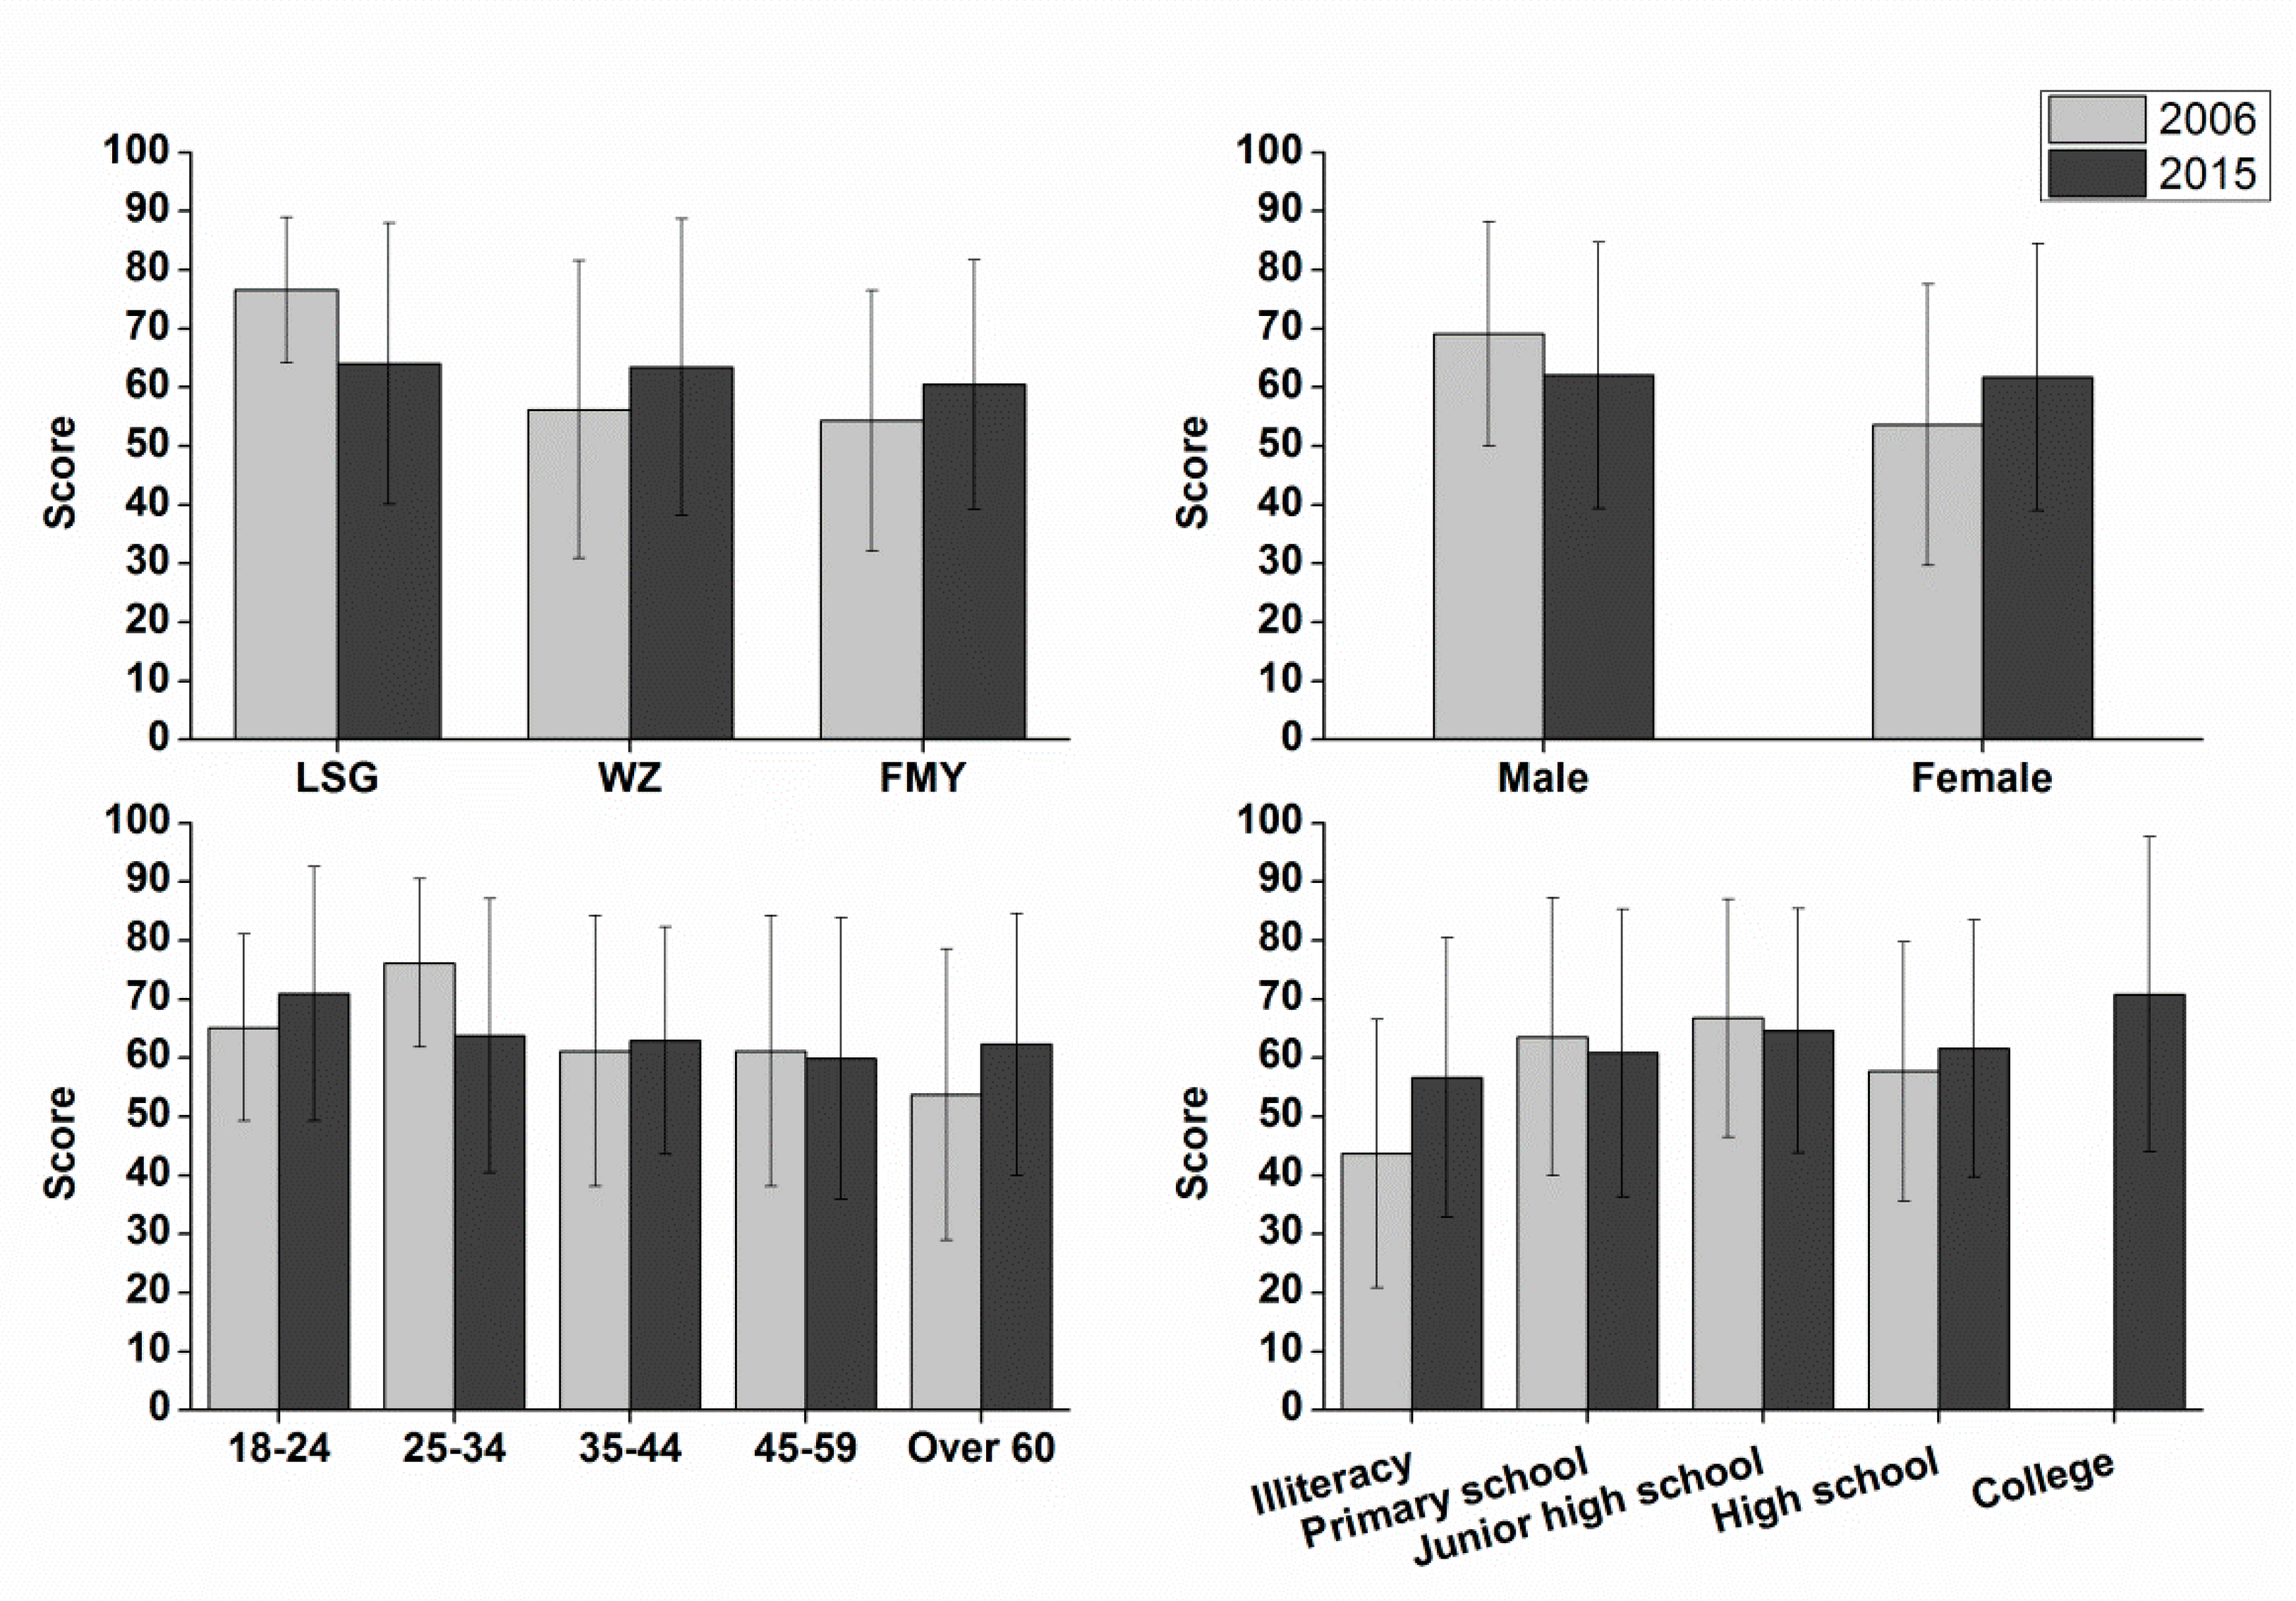
5.1. Factors Influencing Environmental Awareness
5.2. The Connection between Environmental Behavior and Rural Infrastructure
5.3. The Connection between Environmental Perception and Information Disclosure
5.4. The Connection between Environmental Attitude and Local Environmental Governance
6. Conclusions
Funding
Acknowledgments
Conflicts of Interest
References
- Li, W.; Mauerhofer, V. Behavioral Patterns of Environmental Performance Evaluation Programs. J. Environ. Manag. 2016, 182, 429–435. [Google Scholar] [CrossRef] [PubMed]
- Kokkinen, E. Measuring Environmental Awareness in the World; University of Oulu: Oulu, Finland, 2013. [Google Scholar]
- Zhang, B.; Cao, C.; Hughes, R.M.; Davis, W.S. China’s New Environmental Protection Regulatory Regime: Effects and Gaps. J. Environ. Manag. 2017, 187, 464–469. [Google Scholar] [CrossRef] [PubMed]
- Wang, L. The Changes of China’s Environmental Policies in the Latest 30 Years. Procedia Environ. Sci. 2010, 2, 1206–1212. [Google Scholar] [CrossRef]
- Lu, Y.; Abeysekera, I. Stakeholders’ Power, Corporate Characteristics, and Social and Environmental Disclosure: Evidence From China. J. Clean. Prod. 2014, 64, 426–436. [Google Scholar] [CrossRef]
- Zhang, X.; Chen, C.; Lin, P.; Hou, A.; Niu, Z.; Wang, J. Emergency Drinking Water Treatment during Source Water Pollution Accidents in China: Origin Analysis, Framework and Technologies. Environ. Sci. Technol. 2011, 45, 161–167. [Google Scholar] [CrossRef] [PubMed]
- Tian, Y.; Wang, C. Environmental Education in China: Development, Difficulties and Recommendations. J. Soc. Sci. Stud. 2015, 31, 31. [Google Scholar] [CrossRef]
- Tian, X.-L.; Guo, Q.-G.; Han, C.; Ahmad, N. Different Extent of Environmental Information Disclosure Across Chinese Cities: Contributing factors and correlation with local pollution. Glob. Environ. Chang. 2016, 39, 244–257. [Google Scholar] [CrossRef]
- Fryxell, G.E.; Lo, C.W.H. The Influence of Environmental knowledge and values on managerial behaviours on behalf of the environent an empirial examination of Managers in China. J. Bus. Eth. 2003, 46, 45–69. [Google Scholar] [CrossRef]
- Liu, L.; de Jong, M.; Huang, Y. Assessing the Administrative Practice of Environmental Protection Performance Evaluation in China: The Case of Shenzhen. J. Clean. Prod. 2016, 134, 51–60. [Google Scholar] [CrossRef]
- Xi, W. A Study on China’s System of Public Participation in Environmental Protection—Taking Haikou’s “Two Constructions” for Example. IOP Conf. Ser. Earth Environ. Sci. 2017, 51, 012012. [Google Scholar] [CrossRef]
- CECPA (China Environment Culture Promotion Association). China’s Public Environmental Protection Index; CECPA: Beijing, China, 2008. [Google Scholar]
- Zhang, X.; Wang, Y.; Qi, Y.; Wu, J.; Liao, W.; Shui, W.; Zhang, Y.; Deng, S.; Peng, H.; Yu, X.; et al. Evaluating the Trends of China’s Ecological Civilization Construction Esing a Novel Indicator System. J. Clean. Prod. 2016, 133, 910–923. [Google Scholar] [CrossRef]
- Wang, X.; Feng, Q.; Zhang, Y.; Duan, S.; Novotny, V. Public Perceptions and Support of Environmental Management in the Source Area of Drinking Water for Beijing, China. Environ. Eng. Res. 2010, 151, 49–56. [Google Scholar] [CrossRef]
- Ding, Z.; Hong, S.; Dong, S.; Hu, T.; Liu, Z. Public Investigations on Monitoring Systemof Water Pollution Control in Huaihe and Taihu Regions. Environ. Prot. Sci. 2007, 336, 97–99. (In Chinese) [Google Scholar]
- Xu, D.; Chang, L.; Hou, T.; Zhao, Y. Measure of Watershed Ecological Compensation Standard Based on WTP and WTA: A case study in Liaohe River Basin. Resour. Sci. 2012, 347, 1354–1361. (In Chinese) [Google Scholar]
- Luan, Y.; Liu, J.; Deng, J.; Zeng, B. Analysis and Evaluation of Public Participation in Water Resources Management of Baiyangdian Basin, China. Res. Environ. Sci. 2010, 236, 703–710. (In Chinese) [Google Scholar]
- Yan, G.; Kang, J.; Wang, G.; Lin, H.; Zhu, J.; Liu, C.; Sun, W.; Li, Y.; Jin, T. Change Trend of Public Environmental Awareness in Shanghai (2007 to 2011). Energy Procedia 2012, 16, 715–721. [Google Scholar] [CrossRef]
- Shao, F.; Wang, Y.; Wang, H. Investment on Environmental Awareness of College Students in Jinan. Environ. Sci. Manag. 2010, 359, 152–157. (In Chinese) [Google Scholar]
- Lv, J.; Chen, T.; Liu, L. An Investigation and Analysis of Tourists Environmental Consciousness. Geogr. Res. 2009, 281, 259–270. (In Chinese) [Google Scholar]
- Lv, J.; Liu, L. Analysis of Environmental Awareness Level of Community Residents in the Development of Grassland Tourism. Chin. Rural Econ. 2008, 01, 40–49. (In Chinese) [Google Scholar]
- Chen, M.; Qian, X.; Zhang, L. Public Participation in Environmental Management in China: Status Quo and Mode Innovation. Environ. Manag. 2015, 553, 523–535. [Google Scholar] [CrossRef] [PubMed]
- Wang, Y.; Sun, M.; Yang, X.; Yuan, X. Public Awareness and Willingness to Pay for Tackling Smog Pollution in China: A Case Study. J. Clean. Prod. 2016, 112, 1627–1634. [Google Scholar] [CrossRef]
- Qin, H. Rural-to-Urban Labor Migration, Household Livelihoods, and the Rural Environment in Chongqing Municipality, Southwest China. Hum. Ecol. 2010, 385, 675–690. [Google Scholar] [CrossRef] [PubMed]
- Anderson, B.A.; Romani, J.H.; Phillips, H.E.; Wentzel, M.; Tlabela, K. Exploring Perceptions, Behaviors and Awareness: Water and Water Pollution in South Africa; Population Studies Center Research Report; University of Michigan: Ann Arbor, MI, USA, 2006; pp. 1–30. [Google Scholar]
- Liu, X.; Vedlitz, A.; Shi, L. Examining the Determinants of Public Environmental Concern: Evidence from National Public Surveys. Environ. Sci. Policy 2014, 39, 77–94. [Google Scholar] [CrossRef]
- Mei, N.S.; Wai, C.W.; Ahamad, R. Environmental Awareness and Behaviour Index for Malaysia. Procedia Soc. Behav. Sci. 2016, 222, 668–675. [Google Scholar] [CrossRef]
- Umuhire, M.L.; Fang, Q. Method and Application of Ocean Environmental Awareness Measurement: Lessons Learnt From University Students of China. Mar. Pollut. Bull. 2016, 1022, 289–294. [Google Scholar] [CrossRef] [PubMed]
- Sullivan, S.; Erickson, D.; Young, R.K.D. Environmental Awareness, Economic Orientation, and Farming Practices: A Comparison of Organic and Conventional Farmers. Environ. Manag. 1997, 215, 747–748. [Google Scholar]
- Marcinkowski, T.J. An analysis of Correlates and Predictor of Responsible Environmental Behavior. Diss. Abstr. Int. 1988, 1249, 3677-A. [Google Scholar]
- Yusof, N.A.; Zainul Abidin, N.; Zailani, S.H.M.; Govindan, K.; Iranmanesh, M. Linking the Environmental Practice of Construction Firms and the Environmental Behaviour of Practitioners in Construction Projects. J. Clean. Prod. 2016, 121, 64–71. [Google Scholar] [CrossRef]
- Ruepert, A.; Keizer, K.; Steg, L.; Maricchiolo, F.; Carrus, G.; Dumitru, A.; García Mira, R.; Stancu, A.; Moza, D. Environmental Considerations in the Organizational Context: A Pathway to Pro-environmental Behaviour at Work. Energy Res. Soc. Sci. 2016, 17, 59–70. [Google Scholar] [CrossRef]
- Vincenzi, S.L.; Possan, E.; de Andrade, D.F.; Pituco, M.M.; de Oliver Santos, T.; Jasse, E.P. Assessment of Environmental Sustainability Perception Through Item Response Theory: A Case Study in Brazil. J. Clean. Prod. 2018, 170, 1369–1386. [Google Scholar] [CrossRef]
- Johnson, B.G.; Faggi, A.; Voigt, A.; Schnellinger, J.; Breuste, J. Environmental Perception Among Residents of a Polluted Watershed in Buenos Aires. J. Urban Plan. Dev. 2005, 141. [Google Scholar] [CrossRef]
- Kil, N.; Holland, S.M.; Stein, T.V. Structural Relationships Between Environmental Attitudes, Recreation Motivations, and Environmentally Responsible Behaviors. J. Outdoor Recreat. Tour. 2014, 7–8, 16–25. [Google Scholar] [CrossRef]
- Chen, W.Y.; Hua, J. Citizens’ Distrust of Government and Their Protest Responses in a Contingent Valuation Study of Urban Heritage Trees in Guangzhou, China. J. Environ. Manag. 2015, 155, 40–48. [Google Scholar] [CrossRef] [PubMed]
- Ane, P. An Assessment of the Quality of Environmental Information Disclosure of Corporation in China. Syst. Eng. Procedia 2012, 5, 420–426. [Google Scholar] [CrossRef]
- Blackstock, K.L.; Ingram, J.; Burton, R.; Brown, K.M.; Slee, B. Understanding and Influencing Behaviour Change by Farmers to Improve Water Quality. Sci. Total Environ. 2010, 40823, 5631–5638. [Google Scholar] [CrossRef] [PubMed]
- Hu, D.; Wang, R. Exploring Eco-construction for Local Sustainability: An Eco-village Case Study in China. Ecol. Eng. 1998, 11, 167–176. [Google Scholar] [CrossRef]
- Geng, R.; Wang, X.; Sharpley, A. Developing and Testing a Best Management Practices Tool for Estimating Effectiveness of Nonpoint Source Pollution Control. Environ. Earth Sci. 2015, 744, 3645–3659. [Google Scholar] [CrossRef]
- Islam, M.T.; Abdullah, A.B.; Shahir, S.A.; Kalam, M.A.; Masjuki, H.H.; Shumon, R.; Rashid, M.H. A Public Survey on Knowledge, Awareness, Attitude and Willingness to Pay for WEEE Management: Case Study in Bangladesh. J. Clean. Prod. 2016, 137, 728–740. [Google Scholar] [CrossRef]
- Morgan, R. An Investigation of Constraints Upon Fisheries Diversification Using the Analytic Hierarchy Process (AHP). Mar. Policy 2017, 86, 24–30. [Google Scholar] [CrossRef]
- Saaty, T.L. How to Make a Decision: The Analytic Hierarchy Process. Eur. J. Oper. Res. 1990, 48, 9–26. [Google Scholar] [CrossRef]
- Saaty, T.L. Rank from Comparisons and From Ratings in the Analytic Hierarchy/Network Processes. Eur. J. Oper. Res. 2006, 1682, 557–570. [Google Scholar] [CrossRef]
- Qiu, J.; Shen, Z.; Chen, L.; Xie, H.; Sun, C.; Huang, Q. The Stakeholder Preference for Best Management Practices in the Three Gorges Reservoir Region. Environ. Manag. 2014, 545, 1163–1174. [Google Scholar] [CrossRef] [PubMed]
- Rezadoost, B.; Allahyari, M.S. Farmers’ Opinions Regarding Effective Factors on Optimum Agricultural Water Management. J. Saudi Soc. Agric. Sci. 2014, 131, 15–21. [Google Scholar] [CrossRef]
- Banister, J.; Bloom, D.E.; Rosenberg, L. Population Aging and Economic Growth in China; PGDA Working Paper No. 53; Program on the Global Demography of Aging: Boston, MA, USA, 2010. [Google Scholar]
- Bogner, F.X.; Wiseman, M. Environmental Percetion of Rural and Urban Pupils. J. Environ. Psychol. 1997, 172, 111–122. [Google Scholar] [CrossRef]
- Hirsh, J.B. Personality and Environmental Concern. J. Environ. Psychol. 2010, 302, 245–248. [Google Scholar] [CrossRef]
- Mukhamedova, N.; Wegerich, K. The Feminization of Agriculture in Post-Soviet Tajikistan. J. Rural Stud. 2018, 57, 128–139. [Google Scholar] [CrossRef]
- Hunter, L.M.; Hatch, A.; Johnson, A. Cross-National Gender Variation in Environmental Behaviors. Soc. Sci. Q. 2004, 853, 677–694. [Google Scholar] [CrossRef]
- Zhou, J.-B.; Zou, J. The Evaluation and Influence Factor of Beijing’s Public Environmental Awareness. Soc. Sci. Beijing 2005, 2, 128–133. (In Chinese) [Google Scholar]
- Morren, M.; Grinstein, A. Explaining Environmental Behavior Across Borders: A Meta-Analysis. J. Environ. Psychol. 2016, 47, 91–106. [Google Scholar] [CrossRef]
- Shubiao, W.; David, A.; Lin, L.; Renjie, D. Performance of Integrated Household Constructed Wetland for Domestic Wastewater Treatment in Rural Areas. Ecol. Eng. 2011, 376, 948–954. [Google Scholar]
- Ahlers, A.L.; Schubert, G. “Building a New Socialist Countryside”—Only a Political Slogan? J. Curr. Chin. Aff. 2009, 38, 35–62. [Google Scholar]
- Suraj, A.; Sutar, S.M.G. Solid Waste Management in Rural Areas Emerging Towards Growth Centre Through GIS SystemMahalung, Solapur. Int. J. Sci. Res. 2015, 47, 475–478. [Google Scholar]
- Zeng, C.; Niu, D.; Zhao, Y. A Comprehensive Overview of Rural Solid Waste Management in China. Front. Environ. Sci. Eng. 2015, 96, 949–961. [Google Scholar] [CrossRef]
- Cordell, D.; Rosemarin, A.; Schroder, J.J.; Smit, A.L. Towards Global Phosphorus Security: A Systems Framework for Phosphorus Recovery and Reuse Options. Chemosphere 2011, 846, 747–758. [Google Scholar] [CrossRef] [PubMed]
- Buzov, I. Social Network Sites as Area for Students’ Pro-environmental Activities. Procedia Soc. Behav. Sci. 2014, 152, 1233–1236. [Google Scholar] [CrossRef]
- Noorhosseini, S.A.; Allahyari, M.S.; Damalas, C.A.; Moghaddam, S.S. Public Environmental Awareness of Water Pollution From Urban Growth: The Case of Zarjub and Goharrud Rivers in Rasht, Iran. Sci. Total Environ. 2017, 599–600, 2019–2025. [Google Scholar] [CrossRef] [PubMed]
- Gadenne, D.L.; Kennedy, J.; McKeiver, C. An Empirical Study of Environmental Awareness and Practices in SMEs. J. Bus. Eth. 2008, 84, 45–63. [Google Scholar] [CrossRef]
- Jiang, S.; Shen, L.; Zhou, L. Empirical Study on the Contribution of Infrastructure to the Coordinated Development between Urban and Rural Areas: Case Study on Water Supply Projects. Procedia Environ. Sci. 2011, 11, 1113–1118. [Google Scholar]
- Sun, C.; Yuan, X.; Xu, M. The Public Perceptions and Willingness to Pay: From the Perspective of the Smog Crisis in China. J. Clean. Prod. 2016, 112, 1635–1644. [Google Scholar] [CrossRef]
- Dobbie, M.F.; Brown, R.R.; Farrelly, M.A. Risk Governance in the Water Sensitive City: Practitioner Perspectives on Ownership, Management and Trust. Environ. Sci. Policy 2016, 55, 218–227. [Google Scholar] [CrossRef]
- Nunkoo, R.; Smith, S.L.J. Political Economy of Tourism: Trust in Government Actors, Political Support, and Their Determinants. Tour. Manag. 2013, 36, 120–132. [Google Scholar] [CrossRef]
- Deng, Y.; Brombal, D.; Farah, P.; Moriggi, A.; Critto, A.; Zhou, Y.; Marcomini, A. China’s Water Environmental Management towards Institutional Integration. A Review of Current Progress and Constraints vis-a-vis the European Experience. J. Clean. Prod. 2016, 113, 285–298. [Google Scholar] [CrossRef]


| Village Name | Type of Village | Total Households | Total Population | Permanent Population |
|---|---|---|---|---|
| Lishugou | Eco-village | 108 | 245 | 160 |
| Wangzhuang | Eco-village | 103 | 235 | 200 |
| Fangmayu | Agri-village | 756 | 2156 | 1800 |
| Intensity of Importance, on an Absolute Scale | Definition (Compare i and j) |
|---|---|
| 1 | Equal importance |
| 3 | Moderate importance of one over another |
| 5 | Essential or strong importance |
| 7 | Very strong importance |
| 9 | Extreme importance |
| 2,4,6,8 | Intermediate values between the two adjacent judgments |
| Reciprocal | If activity i has one of the above numbers assigned to it when compared with activity j, then j has the reciprocal value when compared with i |
| Environmental Awareness | Environmental Behavior | Environmental Perception | Environmental Attitude |
|---|---|---|---|
| Environmental behavior | 1 | 2 | 0.6 |
| Environmental perception | 0.5 | 1 | 0.33 |
| Environmental attitude | 1.67 | 3 | 1 |
| Environmental Behavior | Wastewater Treatment | Feces Treatment | Residential Garbage Collection |
|---|---|---|---|
| Wastewater treatment | 1 | 3 | 1 |
| Feces treatment | 0.33 | 1 | 0.33 |
| Residential garbage collection | 1 | 3 | 1 |
| Environmental Perception | Water Quality | Water Pollution |
|---|---|---|
| Water quality | 1 | 1 |
| Water pollution | 1 | 1 |
| Environmental Attitude | Willingness to Pay | Attitude toward Government Policy | Attitude toward Environmental Improvement |
|---|---|---|---|
| Willingness to pay | 1 | 3 | 2 |
| Attitude toward government policy | 0.33 | 1 | 0.5 |
| Attitude toward environmental improvement | 0.5 | 2 | 1 |
| Variable | Options | 2006 | 2015 | ||
|---|---|---|---|---|---|
| Number | Percent | Number | Percent | ||
| Gender | Male | 71 | 56.8% | 69 | 53.5% |
| Female | 54 | 43.2% | 60 | 46.5% | |
| Total | 125 | 100% | 129 | 100% | |
| Age | 18–24 | 5 | 4% | 6 | 4.7% |
| 25–34 | 17 | 13.6% | 10 | 7.8% | |
| 35–44 | 52 | 41.6% | 11 | 8.5% | |
| 45–60 | 35 | 28% | 51 | 39.5% | |
| Over 60 | 16 | 12.8% | 51 | 39.5% | |
| Total | 125 | 100% | 129 | 100% | |
| Education level | Illiterate | 15 | 12% | 20 | 15.5% |
| Primary school | 31 | 24.8% | 37 | 28.7% | |
| Junior high school | 68 | 54.4% | 42 | 32.6% | |
| High school | 11 | 8.8% | 26 | 20.2% | |
| College | 0 | 0 | 4 | 3.1% | |
| Total | 125 | 100% | 129 | 100% | |
| Economic source | Rural tourism | 0 | 0 | 25 | 19.4% |
| Farming | 112 | 89.6% | 19 | 13.2% | |
| Work outside | 2 | 1.6% | 64 | 51.2% | |
| Subsides | 0 | 0 | 19 | 14.7% | |
| Other | 11 | 8.8% | 2 | 1.6% | |
| Total | 125 | 100% | 129 | 100% | |
| C | W | V | Options | W | Variable Index | Category Index | Weighted Index | |||
|---|---|---|---|---|---|---|---|---|---|---|
| 2006 | 2015 | 2006 | 2015 | 2006 | 2015 | |||||
| EB | 0.25 | Wastewater treatment | 0 Anywhere 3 Infiltration pool 5 Sewer without treatment 10 Sewer with treatment | 0.43 | 17.92 | 36.98 | 37.65 | 44.90 | 9.41 | 11.23 |
| Domestic garbage treatment | 0 Anywhere 8 Garbage can 10 Classified | 0.43 | 62.88 | 42.09 | ||||||
| Feces treatment | 0 Roadside 3 Fertilizer 5 Garbage can 8 Pay someone to take away 10 Centralized disposal | 0.14 | 33.28 | 56.98 | ||||||
| EP | 0.31 | Water quality | 0 Do not care 3 General 6 Good 10 Poor | 0.5 | 42.08 | 53.49 | 35.16 | 47.56 | 10.9 | 14.74 |
| Water pollution | 0 Not clear 2 No pollution 5 Slightly polluted 10 Seriously polluted | 0.5 | 28.32 | 41.63 | ||||||
| EA | 0.44 | Responsibility for environmental improvement | 0 Not care 5 Government 10 People and society | 0.3 | 78.70 | 77.91 | 62.4 | 61.31 | 27.46 | 27.0 |
| Attitude toward environmental protection measures | 0 Against 3 Go with the flow 5 Comply with the direction made by local government 8 Support 10 Strongly Support | 0.16 | 78.80 | 74.11 | ||||||
| Willingness to pay | 0 Against 3 Go with the flow 5 Comply with the direction made by local government 8 Support 10 Strongly Support | 0.54 | 48.48 | 48.29 | ||||||
| TI | 47.77 | 52.97 | ||||||||
| Question | Options | 2006 | 2015 |
|---|---|---|---|
| How do you normally deal with wastewater, such as washing water, etc.? | Splashed somewhere conveniently | 48.8% | 49.6% |
| Pour into infiltration pool | 42.4% | 7.0% | |
| Sewage pipes (no treatment) | 7.2% | 17.1% | |
| Sewage pipes (with treatment) | 1.6% | 26.4% | |
| How do you normally deal with domestic garbage? | Throw about conveniently | 24.8% | 42.6% |
| Throw in garbage can | 61.6% | 51.9% | |
| Dispose after sorted | 13.6% | 1.6% | |
| Other way | 0 | 3.1% | |
| How do you normally deal with human and animal waste? | Use as fertilizer | 88% | 34.1% |
| Throw on the side of the road | 2.4% | 7.0% | |
| Throw in garbage can | 1.6% | 5.4% | |
| Pay someone to clean up | 5.6% | 20.2% | |
| Centralized treatment | 1.6% | 27.9% | |
| No treatment | 0.8% | 3.1% |
| Question | Options | 2006 | 2015 |
|---|---|---|---|
| What do you think of the water quality? | General | 68.8% | 51.2% |
| Good | 23.2% | 25.6% | |
| Poor | 8% | 23.3% | |
| What do you think of the pollution situation? | Don’t know | 23.2% | 14% |
| Not polluted | 49.6% | 40.3% | |
| Slightly polluted | 17.6% | 24% | |
| Seriously polluted | 9.6% | 21.7% | |
| What do you think is the main pollution source? | Domestic garbage | 40.8% | 60.5% |
| Livestock manure | 4.8% | 13.4% | |
| Pesticide and chemical fertilizer | 22.4% | 7.6% | |
| Industry | 3.2% | 5% | |
| Agri-tourism | 6.7% | ||
| Don’t know | 28.8% | 13.4% | |
| How do you get environmental information? | No idea | 4% | 0.8% |
| Trained by local government | 0% | 5.4% | |
| Publicity column | 16.8% | 14% | |
| Communicate with others | 3.2% | 14.7% | |
| direct experience | 4.8% | 15.5% | |
| Public media | 71.2% | 49.6% |
| Question | Options | 2006 | 2015 |
|---|---|---|---|
| Who do you think should bear the responsibility to improve the environment? | No need to improve | 5.6% | 5.4% |
| Improve by government | 31.2% | 32.6% | |
| Improve by individuals and society | 63.2% | 62% | |
| What do you think of government’s policy and environmental measures? | I oppose these measures | 0.80% | 2.3% |
| I don’t care about it | 8.0% | 7.8% | |
| Comply with the government’s direction | 20.0% | 27.1% | |
| I support these measures | 24.0% | 24.0% | |
| I strongly support these measures | 47.2% | 38.0% | |
| Would you pay some money to implement some measures for environmental protection? | Unwilling to pay | 25.6% | 26.8% |
| Follow general trend (e.g., others’ advice) | 8% | 15.7% | |
| Comply with the direction made by local government | 25.6% | 15% | |
| Willing to pay | 40.8% | 42.5% |
| Year | Variables | G | A | EL | EB | EP | EA |
|---|---|---|---|---|---|---|---|
| 2006 | G | 1 | |||||
| A | −0.028 | 1 | |||||
| EL | −0.193 * | −0.478 ** | 1 | ||||
| EB | −0.143 | −0.099 | 0.158 | 1 | |||
| EP | 0.117 | 0.190 * | −0.253 ** | −0.324 ** | 1 | ||
| EA | −0.324 ** | −0.213 * | 0.208 * | 0.261 ** | 0.068 | 1 | |
| TS | −0.288 ** | −0.223 * | 0.188 * | 0.320 ** | 0.152 | 0.964 ** | |
| 2015 | G | 1 | |||||
| A | −0.069 | 1 | |||||
| EL | 0 | −0.478 ** | 1 | ||||
| EB | 0.002 | −0.107 | 0.013 | 1 | |||
| EP | 0.105 | 0.041 | 0.134 | −0.119 | 1 | ||
| EA | −0.002 | −0.057 | 0.101 | 0.129 | −0.11 | 1 | |
| TS | 0.038 | −0.07 | 0.109 | 0.266 ** | −0.058 | 0.950 ** |
© 2018 by the authors. Licensee MDPI, Basel, Switzerland. This article is an open access article distributed under the terms and conditions of the Creative Commons Attribution (CC BY) license (http://creativecommons.org/licenses/by/4.0/).
Share and Cite
Du, Y.; Wang, X.; Brombal, D.; Moriggi, A.; Sharpley, A.; Pang, S. Changes in Environmental Awareness and Its Connection to Local Environmental Management in Water Conservation Zones: The Case of Beijing, China. Sustainability 2018, 10, 2087. https://0-doi-org.brum.beds.ac.uk/10.3390/su10062087
Du Y, Wang X, Brombal D, Moriggi A, Sharpley A, Pang S. Changes in Environmental Awareness and Its Connection to Local Environmental Management in Water Conservation Zones: The Case of Beijing, China. Sustainability. 2018; 10(6):2087. https://0-doi-org.brum.beds.ac.uk/10.3390/su10062087
Chicago/Turabian StyleDu, Yi, Xiaoyan Wang, Daniele Brombal, Angela Moriggi, Andrew Sharpley, and Shujiang Pang. 2018. "Changes in Environmental Awareness and Its Connection to Local Environmental Management in Water Conservation Zones: The Case of Beijing, China" Sustainability 10, no. 6: 2087. https://0-doi-org.brum.beds.ac.uk/10.3390/su10062087