Article

What Gets Measured, Gets Done: Development of a Circular Economy Measurement Scale for Building Industry

by
Pedro Nuñez-Cacho
1,*,
Jaroslaw Górecki
2,
Valentín Molina-Moreno
3 and
Francisco A. Corpas-Iglesias
1
1
Polytechnic School of Linares, University of Jaén, 23071 Jaén, Spain
2
Faculty of Civil Engineering, Architecture and Environmental Engineering, University of Science and Technology in Bydgoszcz, 85-796 Bydgoszcz, Poland
3
Faculty of Business and Management, University of Granada, 18010 Granada, Spain
*
Author to whom correspondence should be addressed.
Sustainability 2018, 10(7), 2340; https://0-doi-org.brum.beds.ac.uk/10.3390/su10072340
Submission received: 1 June 2018 / Revised: 27 June 2018 / Accepted: 2 July 2018 / Published: 5 July 2018
(This article belongs to the Collection Sustainable Built Environment)

Abstract

:
The construction industry is among the sectors that need closer attention due to their environmental impact. The Circular Economy (CE) model promotes the transition to more sustainable production models, which are based on careful management of resources and the reduction of negative externalities generated by such businesses. Its application in this industry can foster significant improvements in sustainability. However, the measurement of the degree of implementation of CE is difficult, owing to an absence of psychometrically sound measures. In this paper, the development of the CE scale for the building industry was described, treated as an instrument that allows for a direct measurement of the importance of CE for companies. The processes used to generate items by applying the e-Delphi research technique were explained in the article, and the developed scale was tested and validated through confirmatory factor analysis (CFA). The final construction is composed of seven different weighted dimensions: four related to Resource Management: 3Rs (Reduce, Reuse, and Recycle), Efficient Management of Energy, Water, and Materials; two dimensions regarding environmental impact: Emissions and Wastes generated; and, one providing indicators of transition to the CE.

1. Introduction

A market release of new construction materials in the twentieth century, with a simultaneous offer of their resilience and durability, affected the environmental impact of this industry [1]. The sector nowadays is one of the main generators of waste, and is also one of the most environmentally harmful and least sustainable branches of economy [2].
Prospects for the future are quite dismal. In general, we can observe the systemic, exponential growth of certain key indicators, such as population growth, concentration of CO2 in the atmosphere, and consumption of energy, water, minerals, and natural resources [3]. Over the past 20 years, the emission of greenhouse gases (GHG), which are assumed to induce substantial environmental damage and to be a major cause of climate change, has increased significantly with the continuous growth of carbon dioxide emissions [4]. This rapid environmental deterioration is leading most industrialized countries to reach new agreements that involve a reorientation of the production processes, according to the commitments of the Paris Agreement (2015), within the Framework of the Convention of the United Nations on Climate Change, where the measures to reduce carbon dioxide emissions were settled, starting from 2020.
In this context, the building sector plays a strategic role, being one of the most significant emitters of harmful gases, generator of waste, and consumer of resources [5]. Modern construction materials with excellent building features show a side effect through the drastic increase in the environmental impact of this sector [6]. Currently, one of the key aspects is to minimise waste, and therefore, waste minimising strategies, need to be considered as an integrated element of the production system [5]. Apart from this, reuse of elements (e.g., parts of buildings) needs the deep consideration of their quality, usefulness in terms of dimensions (do they fit into a new place?), and market issues (do people want to buy used materials?). Reuse of elements presents a challenge for both architects and contractors. On the other hand, the use of intelligent material pooling is a useful framework of collaboration for the different actors in this sector [7].
Besides, many countries around the world are looking for new sustainable building models, by exerting pressure on the sector to look for the reduction of environmental impact [8]. The industry needs to implement new eco-efficiency strategies, maintaining or increasing the value of economic output while simultaneously diminishing the environmental impact [7]. However, a current status is different; there is too much waste being produced by construction projects, with few conceptions of what to do with it. On the other hand, a resource scarcity is making us search for new technologies of waste recovery that convert the outputs of the production system into inputs of the new production [9,10].
Industrial ecology (IE) examines the flows of materials and energy in industrial systems [11,12]. The IE enables understanding how the industrial system works, how it is regulated, and what interactions it presents, to restructure it in order to make it similar to natural systems. Focusing on the connections between operators within the industrial ecosystem, this approach aims to create closed loop processes in which waste serves as an input, thus eliminating the notion of an undesirable byproduct.
The IE adopts a systemic point of view, designs production processes according to local ecological constraints, while observing its global impact from the beginning, and it tries to give them shape so that they perform as close as possible to living systems. This framework is sometimes called the “science of sustainability”, given its interdisciplinary nature, and its principles can also be applied in the service sector. According to the Ellen Macarthur Foundation, industrial ecology also focuses on social welfare supporting restoration of natural capital [11].
The IE is highlighted as one of the antecedents of the CE (EMF, 2013). The latter can be defined as a type of economy with a closed flow of materials, as opposed to the traditional linear economy [13], which, being linear, generates serious problems, such as environmental degradation and scarcity of resources [14]. In this way, the CE will help to maintain harmony between humanity and the environment through the use of closed-circuit entry material.
In the CE there is a following flow of materials: “resources-production-waste-renewable resources” with “low exploitation, high utilization and low effluents”. The basic principles of the CE are the so-called 3R’s: reduction, reuse, and recycling [14,15]. Reduce implies minimizing the entry of energy and raw materials by improving efficiency in production processes. Reuse suggests that byproducts and waste from one company (or industry) can become resources for others. Recycling, on the other hand, promotes the reprocessing of recyclable materials to convert them into new products, so that consumption of the original materials can be reduced [15].

Objectives and Research Question

It seems that the CE should be treated as a production sustainable model, which is especially relevant for this sector. CE represents an industrial system based on reuse and regeneration at conceptual, organisational, and operational levels [16]. However, we need to take into consideration the lack of indicators about circularity, which is one of the most important challenges for the future of CE [17,18]. For instance, in the literature review of Lewandowski [19], the author cites just eight studies focused on an evaluation model, and none of them took into consideration a scale for measurement of CE, which can be confirmed from a review of Tukker [20] or Van Dijk et al. [21]. Other references, such as Lihong and Hui [22] or Shen and Qi [1], are generic; for instance, the measurements focus on emission levels or energy consumption, the sustainability index [23], or sustainability building assessment [24]; while, Silvestre et al. [25] are focussed on specific aspects, such as materials or supply chain management.
From this point of view, there is a lack of knowledge about what type of indicators of CE could be used [17,18]. The indicators reflect the value of the variables in relation to a defined reference point [26]. A crucial question is how to measure the application of CE principles in the building sector.
Therefore, this paper aims to build a validated scale of measurement, which is applicable to the construction industry. It allows for businesses, public administration, and governments to manage a degree of CE implementation. Thus, the following research questions should be formulated:
  • RQ1: How can we measure the degree of implementation of the Circular economy in building companies?
  • RQ2: What are the main dimensions that compose the measuring scale for the building sector?
  • RQ3: What are the most relevant indicators of these dimensions?
To answer these research questions, an exploratory e-Delphi study with a group of industrial and academic experts was performed followed by the confirmatory factor analysis of results. Thus, a more inductive approach was applied for the research, impacting a structure of the paper and limiting the literature review, and the content analysis more to the scale design, rather than developing hypotheses, as is usually done in positivistic and deductive research [27].

2. Theoretical Framework

2.1. Industrial Ecology Theory as Base of the Circular Economy

The principles of CE are supported by the Industrial Ecology theory, a framework that is useful to describe sustainable construction project, because of its design, process flow, energies used, and outputs generated. The Industrial Ecology theory is connected with “creation, use, and management of resources for the adaption, human development, and sustainability of environments”, focusing on the interactions of individuals, groups, and society with the environment. The basic assumptions of this theory according to Ehrenfeld [28] are: The Earth is configured as a closed ecological system, where the scale and design of development are inconsistent with long-term ecological endurance. Society and natural ecosystems have co-evolved; however, ethical and moral aspects of economic actions should turn back to the first plan. In this context, sustainability means maintaining stocks of natural capital, which is affected by emissions, resource consumption, and negative impacts on ecosystem services [29,30,31].
The Industrial Ecology theory is a guide to developing sustainable building industry practices. Firstly, to improve an analog of the metabolic pathway of building processes and material used. Secondly, to create a closed-loop industrial ecosystem, based on CE. Thirdly, to dematerialise outputs of construction projects, while taking into consideration the idea of product as a service, and managing carefully the resources. Fourthly, to systematise a pattern of energy use, based on an efficiency improvement approach [28,32].

2.2. Evolution, Definition, Key Aspects and Model of Assesment of the Circular Economy (CE)

Business sustainability is clearly related to consumption and production patterns. Companies, in aiming to achieve sustainable business development, must strive to fulfil present needs while minimising resource consumption, so as not to threaten future opportunities and the capabilities of the enterprise and society [33]. The economic theory has evolved in the following way. In the first place, a linear economy maintains the basic idea of abandoning all use of non-renewable resources.
Taking into account the Industrial Ecology theory, CE is an industrial economic model that is restorative and regenerative by intention and design [8], so that the production system regenerates the inputs used, and tries to reduce the negative externalities of the economy. Its objective is to efficiently manage the resources, minimise waste through the use of renewable energy, and reduce the amount of chemical pollutants and toxic waste through careful design. Besides, waste management continues to be a challenge for developing countries [34]. According to the Industrial Ecology theory, CE can be considered as a response of businesses to environmental requirements, in order to guarantee the survival, maintenance, and sustainability of the environment.
Several key factors support the concept of CE. One can sell the use of products but not the material. In CE, the customer merely uses the product, and the supplier is responsible for recycling it. Customers can purchase use as a service, and when the product becomes obsolete, it is recovered and renewed. In the design process, several concepts need to be taken into consideration, such as modularity, versatility, and adaptability, the most important properties in a changing world. The principle of the 3Rs (reduce, reuse, recycle) contributes to reducing the pressure on the global stock of resources [3], respecting the environment and promoting the sustainability. In the past, reuse and service-life extension were often strategies in the case of scarcity or poverty, whereas today, they are signs of good resource management.
The evaluation of the degree of implementation of the Circular economy in a company has been scarcely developed. The literature review on this concept, according to Saavedra et al. [12], where were presented the mostly used concepts connected with CE appearing in the articles, revealed no mentions about its assessment. However, there are several papers that have analyzed this matter. The work of Geng et al. [35] highlights the lack of indicators on sustainability in the industry, which becomes a challenge for researchers and companies. Among the indicators that were analyzed by these authors, the ecoefficiency indicators used for the evaluation stand out an eco-efficient industrial park. Most of them mean using less water, less energy, and less material per unit of product or per unit of added economic value. It also translates into less solid waste, less wastewater, less air, less hazardous emissions, and waste per unit of product or per unit of economic value added.
On the other hand, Haas et al. [36] presents an evaluation of CE through the application of a systemic solution and the socio-metabolic perspective to evaluate the current level of circularity of the global economy. To do so, they define and quantify a set of key indicators to characterize the circularity of economies and apply it to the world economy and the European Union. The assessment of these authors is based on five groups of indicators: material size, growth, degree of circularity within the economy, biodegradable flows, and throughput. In short, as the CE study progresses, instruments are needed to allow for its evaluation. These instruments of assessment should be focused on the analysis of each sector. Besides, they should incorporate the key sections of CE, developing useful indicators for each of these sections. Bonciu [16] noted that the fourth key aspect that distinguishes CE from previous studies on sustainability is the need to develop a series of specific CE indicators that allow for its implementation and subsequent monitoring.

2.3. Key Factors of CE: Resource Management and Transition to the Circular Model
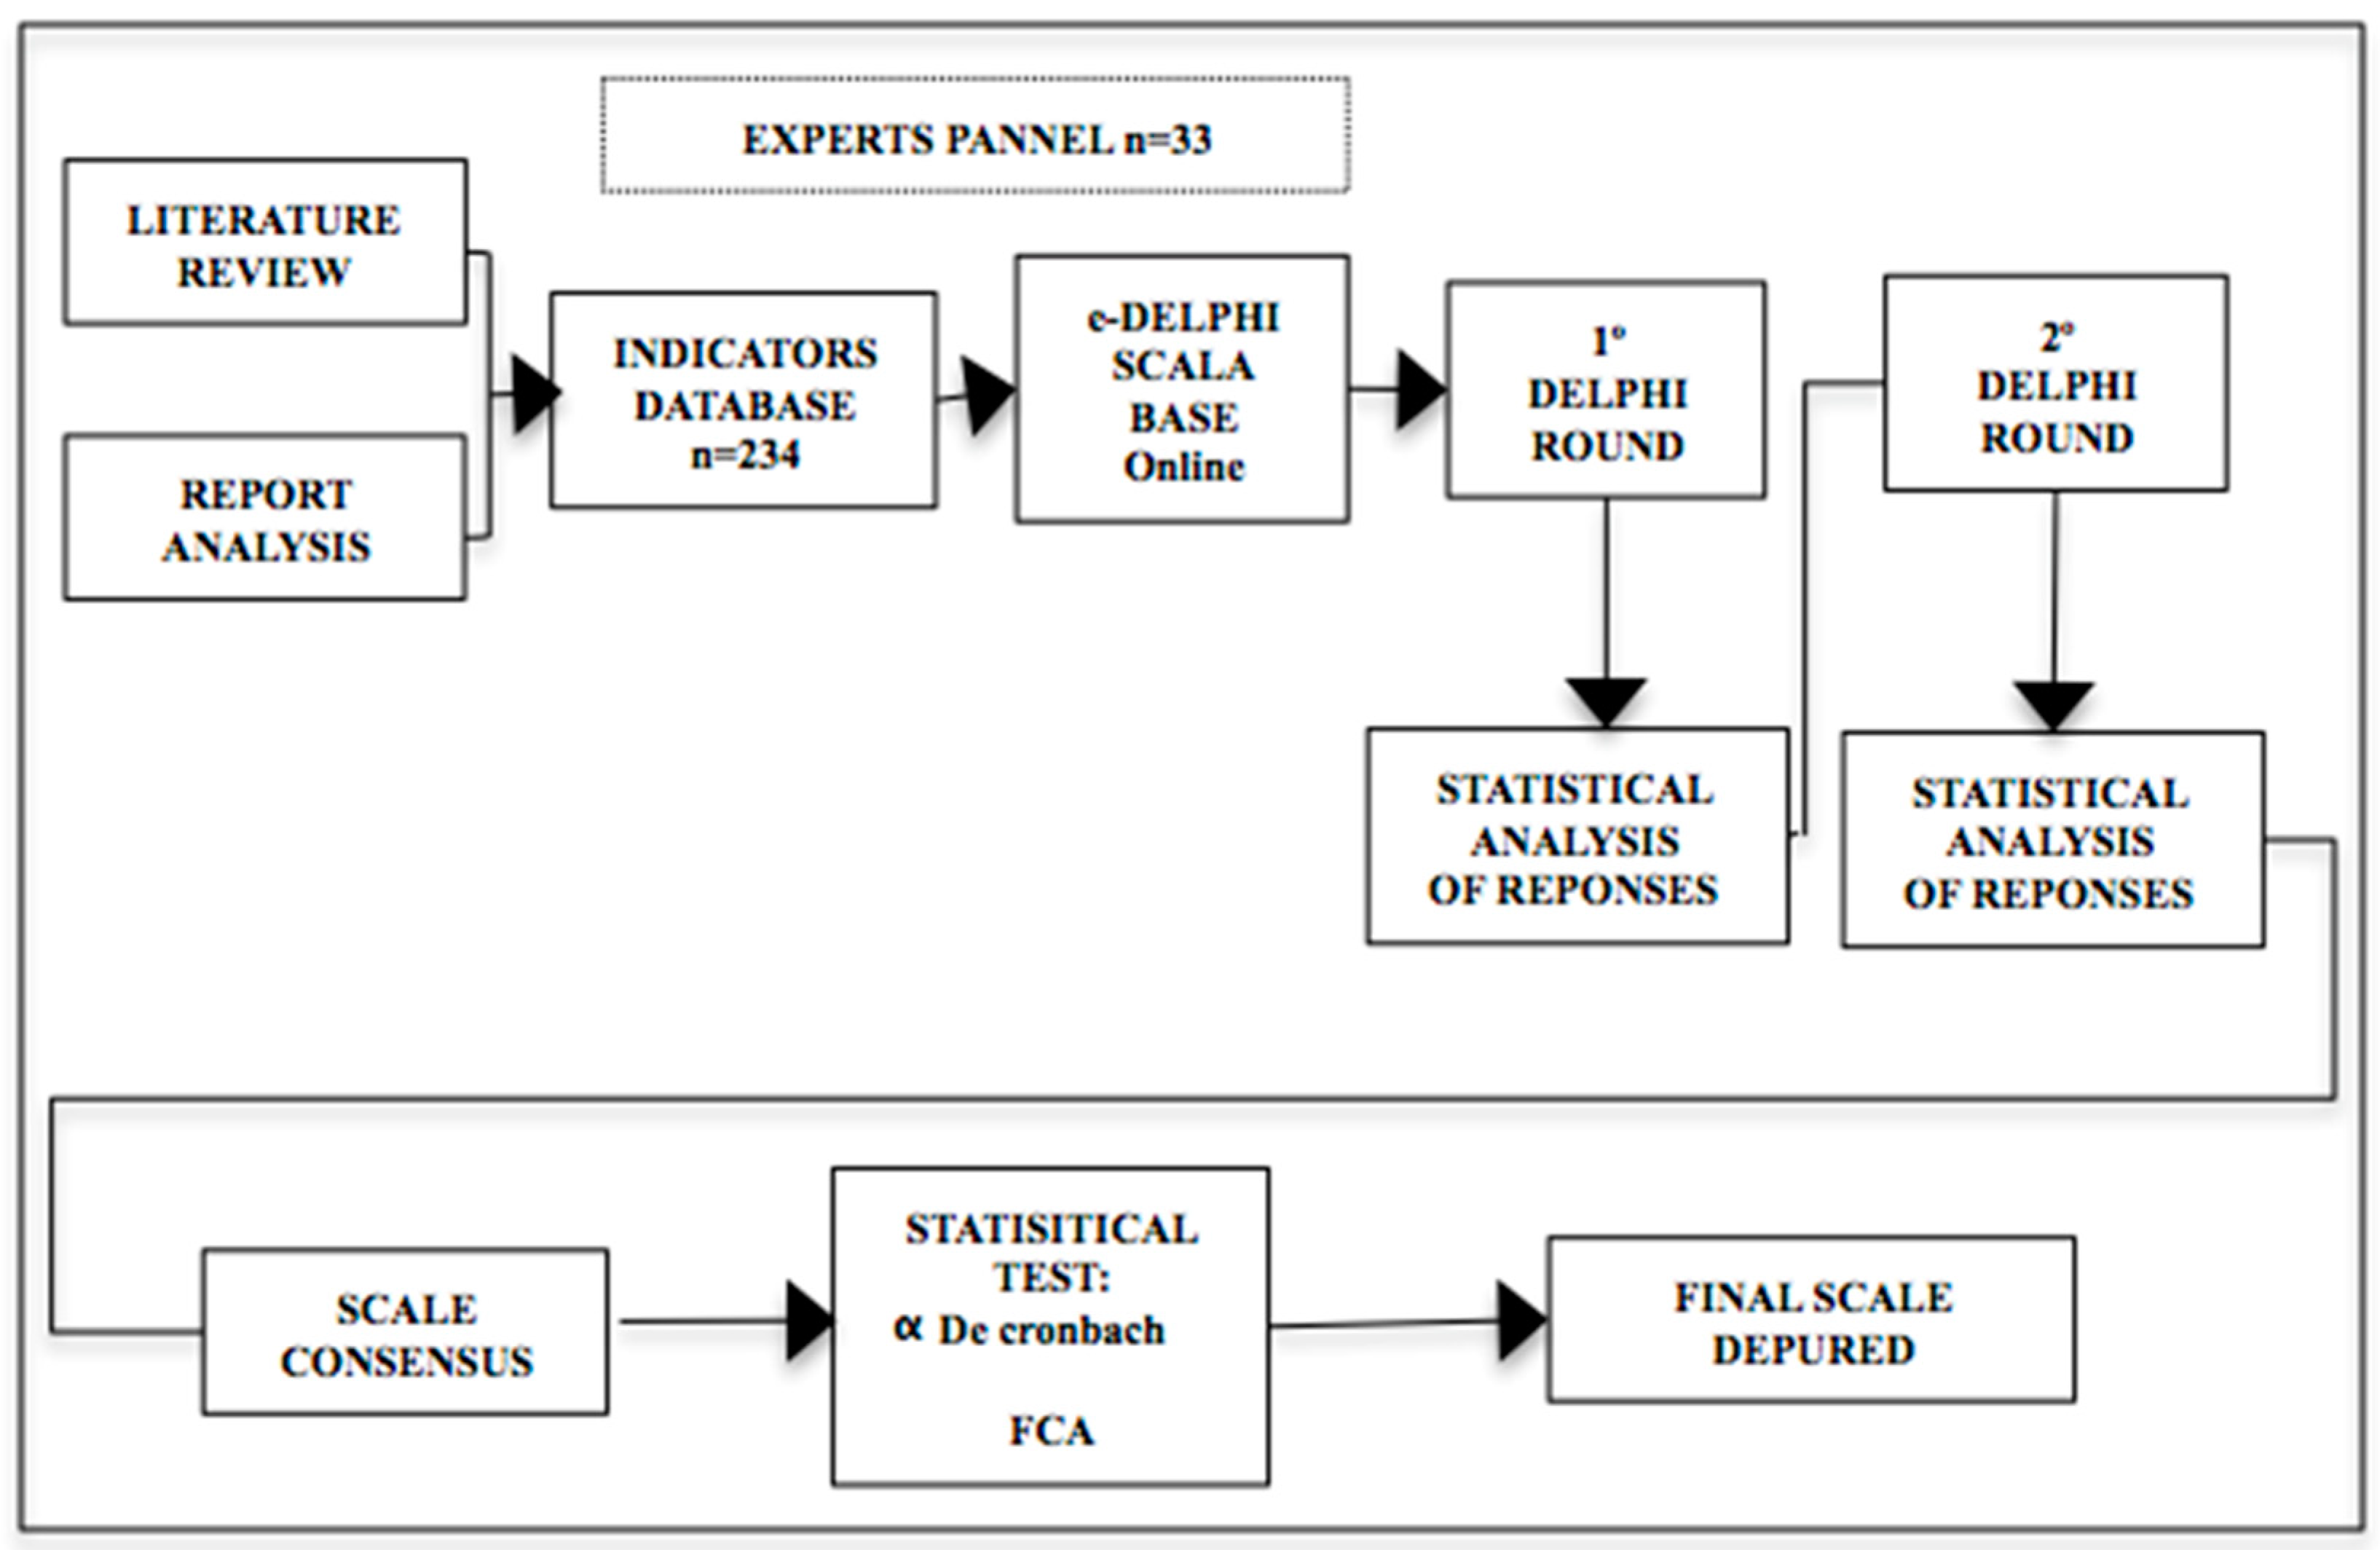
The resources used can have both types of flows: biological, when materials are designed to re-enter the biosphere, and technical, because they are designed to run with minimal loss of quality [11]. Biological nutrients are materials, which can be renewed without human processing. This resource must be transformed and reintegrated into the biosphere without requiring any type of chemical process.
The second type of flow is related to technological nutrients whose main characteristic is that materials are recycled completely, with a need of specific human action for every step of the circular flow. In this point, several principles that are relevant for CE can be noted: Firstly, product maintenance is very important to extend durability of factors of production, through maintaining good nutrient conditions and the same user. Secondly, reuse or redistribution allows for other people to use a second-hand product. The product is returned to the supplier where can be useful for other products. Thirdly, after refurbishing and remanufacturing of the technological nutrient, it is returned to the supplier in good condition, and is directly ready to serve again. Finally, the recycling process returns obsolete raw materials to manufacturers for reconstruction as a new product. All of these principles impact on reducing the volume of negative environmental outputs.
Another issue affecting the community is the increased level of resource consumption by society and the manufacturing industry, increasing pressure through new environmental regulations, price volatility of resources, and risk in daily supply [8]. Currently, when the resource scarcity is a serious concern for authorities [35], there is a need for new business models that allow us to manage it properly. New strategies should also be designed keeping in mind the principle of resources that are regenerative by design [37].
The implementation of the production system requires transition from a classical model of linear economy, which produces goods and discards waste, to a new business production model, based on a transformation to CE.
There are three types of triggers that act as disruptions. Firstly, environmental and social responsibility factors become disruptions, because the company recognises the necessity of ensuring the company’s long-term sustainability. Secondly, there are factors related to legal, ethical, and regulatory changes that are required by laws and procedures, the transformation of production processes for greater efficiency, and a reduction of environmental impact. Thirdly, the companies will implement new ways of manufacturing based on the principle of CE, because these changes will guarantee their long-term sustainability [38].
Furthermore, the change of production model will be linked to the introduction of new concepts, such as the product-service systems (PSS), which relates to this transition of gathering products and services into one offer. It has been identified as a paradigm for the development of integrated offers with interactions, creating more value, rather than a simple concatenation of product and service offers [39]. The PSS model will guarantee the return of the goods to the companies at the end of their useful life, through the reverse supply chain of management.
In this context, a dynamic interaction occurs between the business model, product design, production chain management, and customers, by treating of all of these elements as an integral part of the manufacturer [8]. Company structures and their interactions currently condition the business model, whereas the interactions between energy flows, stocks, and resources are noteworthy elements in CE processes [3]. Therefore, the company requires reverse logistics, which is defined as a process by which a manufacturing entity systematically takes back previously shipped products or parts from the point-of-consumption for possible recycling, remanufacturing, or disposal. A reverse logistic system constitutes a supply chain that is redesigned to systematically manage the flow of parts and products destined for remanufacturing, recycling, or disposal activities. This enhanced supply chain is, therefore, capable of effectively using resources that were not previously considered or utilised [40]. The relevance of reverse supply chain management in CE is that it allows for us to close the loops, by returning products and resources to the supplier. So, if the company has not deployed reverse logistics, the production system cannot be considered compatible with an idea of CE.

3. Methodology

3.1. Application of the Methodology to Solve the Research Questions

The Delphi technique or method is used to achieve scientific consensus around issues or predictions. When it is used correctly, the method can significantly contribute to broadening knowledge among experts [41,42]. The Delphi technique is known as the acquisition of knowledge based on consensus and the comments of multiple experts [43,44], being relevant, among other purposes, to define a system of sustainability indicators, and more specifically, for the design of a scale of measurement of CE. Delphi allows the systematic collection of expert judgments on a particular topic through a set of comments, consecutively applying questionnaires with summarised information on the options that are chosen in the previous answers [45]. Conducting the Delphi studies is possible on the Internet platform, where iterative data collection can be more efficient. According to MacEachren et al. [46], the “e-Delphi” technique represents recent attempts to make the Delphi process digital, in order to optimize the ability of the method to organize generalized and diverse group thinking, while capitalizing on the aforementioned methodological advantages. The e-Delphi is based on the Internet-based platform to organize, control, and facilitate communications between the researcher and the panel of experts. This method has been shown to be a reliable qualitative research approach with the potential to solve problems, thus contributing to decision making and reaching a group consensus in a variety of areas [47].

3.2. Design of the Research

The study consisted of two rounds. The process was initiated with the development of the questionnaires and panel preparation in the first quarter of 2017, and was completed in the fourth quarter of the same year. The scheme proposed by the research is shown in Figure 1.

3.2.1. Building the Indicators Database

The objective of this phase was to build the base scale that the panel of experts would later test to measure the CE in the construction sector. The input with which the base scale was made was composed of two different sources. First, a review of the literature was carried out (Table 1), in which indicators that had previously been used to measure aspects related to the CE were searched. As a result, 38 articles were obtained, published in different indexed journals, and 21 of them fitted with the research, thus contributing a total of 107 indicators to the base scale.
Secondly, looking to the practical purpose and immediate practical applicability of the scale, the academic literature had to be complemented with a practical approach. Thus, some indicators were incorporated from a sample of top international companies of the construction industry: ACS, Bechtel Report, Bouyguees Report, China Com. Construction, Honchtief, Oderbrecht, Skanska, Strabag, Technip, and Vinci. To perform this research, the content analysis methodology was used, working with information from the sustainability reports of the aforementioned companies. Thus, in line with Campopiano and De Massis [48], the documents of sustainability reports from the last three years were analysed. The indicators that companies used for measuring aspects related to CE were collected (Table 2). They were linked to the principles developed in the theoretical framework. Also, information from their websites was explored [35,49]. A total of 127 indicators were obtained from reports and other data sources.

3.2.2. Application of e-Delphi Method to Build the Scale

After that, the 107 indicators from the literature review and the 127 indicators from the report analysis were merged, thereby generating a theoretical-practical database comprising 234 indicators that are related to CE and the building industry. From here, the coordinating group of the e-Delphi method, consisting of the four authors of the work, made an in-depth study of these 234 indicators, coding them, grouping them by topics and screening those that measured the same aspects. After the review conducted by the coordinating group, the initial questionnaire was formulated, containing 83 indicators. Once the problems to be investigated were known, the questionnaire was designed according to the established objectives. Based on the indicators that were selected by the analysis group, the research questionnaire was developed, which initially included the evaluation between 1 and 5 of the importance of the sections that should compose the scale. Subsequently, a series of indicators were offered to highlight the relevance of each of them.
The initial questionnaire was administered through a web-based application, sending to the experts the link, which they had to follow for access to the questionnaire. The number of experts involved could vary from 15 to 50 [43,44,45,46,47]. Initially, a database of 81 experts who were invited to participate in the panel was built. They were selected from academics who are involved in civil engineering, sustainability, and economics problems in different universities, from professionals that are involved in international think tanks supporting sustainable production, as well as from scientists united in the international mailing group “Co-operative Network for Building Researchers”. An acceptance rate of 48% was achieved, with a total of 39 experts agreeing to join the panel. An origin of the experts was as follows: Germany (4), Spain (4), Poland (4), China (3), Great Britain (3), USA (2), Italy (2), the Netherlands (2), and 11 from other countries. Regarding to their professional experience, 19 of the experts came from companies related to the research topic and 14 from the academic world.
Once the questionnaire was administered, six experts were discarded because their responses were incomplete, so that the panel of experts was finally made up of 33 people. The purpose of this qualitative research being to achieve consensus on the scale of CE, a set of rules was established that would help to define the areas of acceptance, rejection, or submission for a second review round. The statistics used were: median, standard deviation, arithmetic mean, and mode of valuation of each of the indicators [27]. The rules for analysing the qualifications of multiple experts with the e-Delphi approach are shown in the Table 3.
After the first round, the above rules were applied and as a result 15 indicators were eliminated, whereas 30 were sent to the second round seeking consensus; and, 38 were accepted in advance. Then the second questionnaire was designed that was composed by total of 68 indicators.
The second round of review was carried out by sending information about the results of each of the indicators to the experts, where the score of each expert disagreed with the average of the rest of the panel. They were provided with statistical information about the indicator, offering two possibilities, either maintaining the previous choice, or proceeding to a review of their assessment to align with the rest of the experts.
After receiving the results of the second round of review, according to the rules, 14 new indicators were eliminated and 16 were accepted, thus 54 indicators conforming the consensus scale. The brief is shown in Table 4.

3.3. Analysis and Depuration of the Scale: Reliability and Validaty

After studying and exposing to the e-Delphi method, once there was consensus between the experts regarding the scale, with seven sections or constructs, it was approached a statistical analysis of these to determine the reliability and validity.
To use the scale, one had to make sure that they had certain characteristics enabling their use for scientific research [58], since they have been obtained by means of a scale with multiple items. A scale of measurement had to be evaluated to ensure that they were useful and also that the information they provided was reliable and valid [59]. These terms, reliability and validity, are two aspects that are closely related and have complementary roles. While reliability is responsible for the consistency, accuracy, and predictability of research findings, validity is intended to determine if we are really measuring what we want, being therefore a broader and more complex aspect than reliability.
A common feature of both evaluations is that they are based on the analysis of correlations between the measure under study and other measures [60]. However, this type of contrast has limitations that are derived from the unobservable nature of the dimensions, which are the object of measurement, as we will see next. Reliability is defined as the degree to which measurements are free of random errors. Thus, a scale or measuring instrument will be reliable when similar results are obtained when applying it two or more times to the same group of individuals.
If the association between the variables that make up the scale is high, then it will produce consistent results [61], therefore one can highlight that it is stable. This association is a necessary condition for the scale used to be valid [59], and its calculation will indicate the quality of the instruments used, in the sense that the structure of the scales is correctly designed, and therefore, the measurements are free from the deviations that are produced by causal errors.
In addition to being stable, the scale must have internal consistency, so that one can accept it as reliable. The Cronbach α coefficient is one of the most commonly used indicators to verify both the reliability of the instrument of measurement as a whole and that of each of its dimensions. This coefficient is obtained as the average of the Pearson correlation coefficients among all of the items of the scale if their scores are standardised, otherwise it will be obtained as the average of the covariances [62].
The values that are adopted by this coefficient are included in the interval (0, 1) that Maholtra [63] and George and Mallery [64] consider satisfactory internal consistency values as those higher than 0.7, while Nunnally [65] maintains that for the scale to have internal consistency, the value of the coefficient must be between 0.7 and 0.8 to be an acceptable level; between 0.8 and 0.9 could be qualified as a good level, and a value greater than 0.9 would be considered to be excellent. To complete the analysis of the reliability of the scale, in addition to the Cronbach coefficient, the characteristics that present the scales were formulated, such as their size or categories, and the index of reliability composed of each construct (IFC), which is an indicator of internal consistency in the measurement of the construct, for which values higher than 0.7 are recommended. The Cronbach’s alpha coefficient of the scale verifies what is recommended for exploratory studies, and the composite reliability index is in line with the recommendations of Bagozzi and Yi [66], as shown in the Table 5.

3.4. Convergent Validity of the Scale: Confirmatory Factor Analysis (CFA) Analysis

In order to perform a convergent validity analysis, the construct validity was determined. The procedure is based on the analysis of the correlations between variables. The convergent validity of a scale or construct assesses the degree to which two measurements of it are correlated [67], and it positively influences reliability, that is, the more reliable the scale of measurement, the more convergence validity it will have [68].
The application of the e-Delphi method determined that the sections that should be measured were: Transition to CE, Materials. Energy, Water, 3R’s, Emissions, and Waste. These categories were analyzed through the indicators finally selected by the experts. To verify the coherence of these groups, the convergent validity was analysed according to these seven dimensions that make up the scale (See Table 5). Thus, a confirmatory factor analysis in the first round was carried out. The results obtained in the analysis led us to eliminate two more indicators, one from the 3R dimension and another from the Waste. Thus, after observing the information provided by the EQS 6.1 program, pointing to these variables as the major error generators in their respective dimensions. Once the aforementioned variables were eliminated, the CFA of the scale was re-performed, obtaining a good fit as indicated by the chi-square coefficient (χ2), the comparative fit index (CFI), the root mean-square error of approximation (RMSEA), and other indicators of the goodness of fit provided by the software used. In those variables in which normality was not observed, the Satorra-Bentler scaled chi-square coefficient (χ2) was used as fit indicator, as shown in the Table 5. Thus, the scale depured was finally composed by 52 indicators.

4. Results

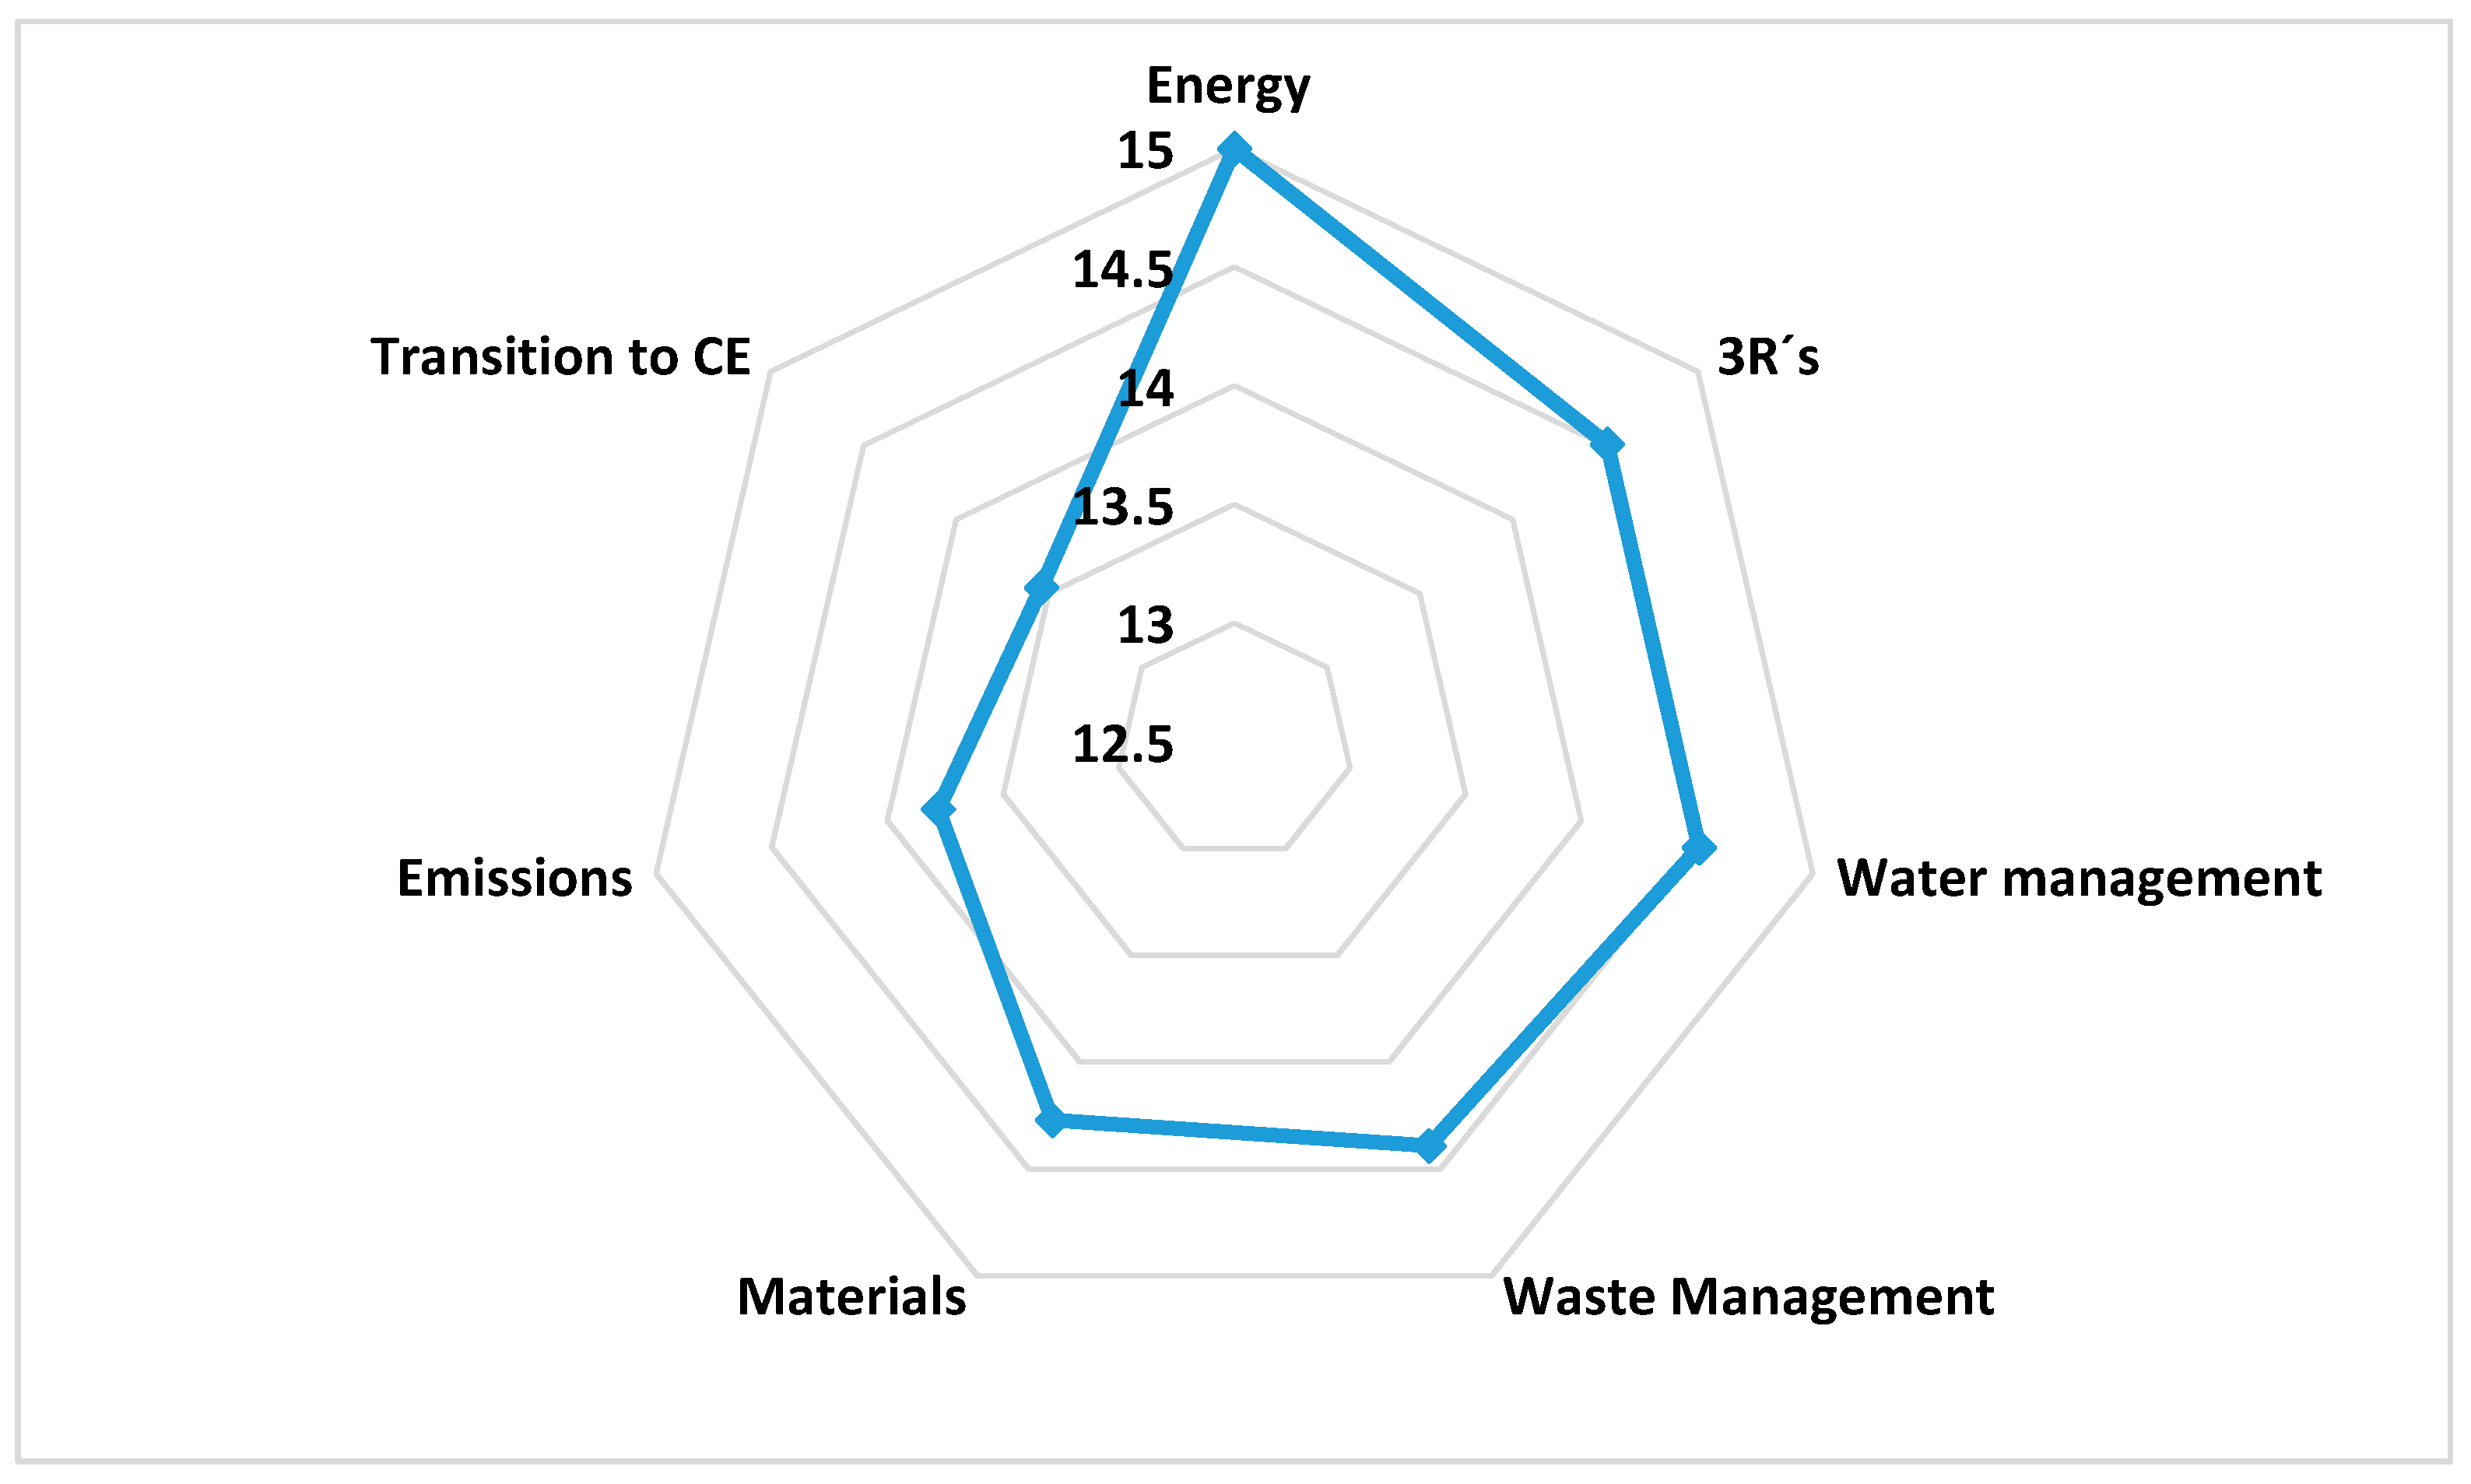
4.1. Dimensions That Compose the CE Building Scale

The first aspect about which the experts were questioned was about the dimensions that should make up the scale. The literature does not establish a clear classification of CE. On the one hand, the articles that follow the cradle-to-cradle (C2C) philosophy focus more on aspects, such as management of resources, eco-efficiency in energy aspects, and zero waste. However, most of the literature is related to the subsequent topics: efficient management of resources, renewable energy, and care of water and materials by promoting the principle of 3Rs: reduce, reuse, and recycle [69,70].
The second group of key concepts that appear in the CE literature are the dimensions that are related to negative externalities generated by the companies or environmental impact, basically classified into two groups: waste management and polluting emissions.
So, in accordance with this structure, we proceeded to code and classify the 234 indicators collected, grouping them into sections. In principle, we included eight dimensions: negative externalities, emissions, waste generated, energy management, water management, materials management, the 3R principles—reduce, recycle, and reuse—and general indicators of transition to the CE. The information received from the experts drives us to reduce to seven dimensions. Table 6 shows the final composition and the Figure 2 highlight the relevance of each dimension.

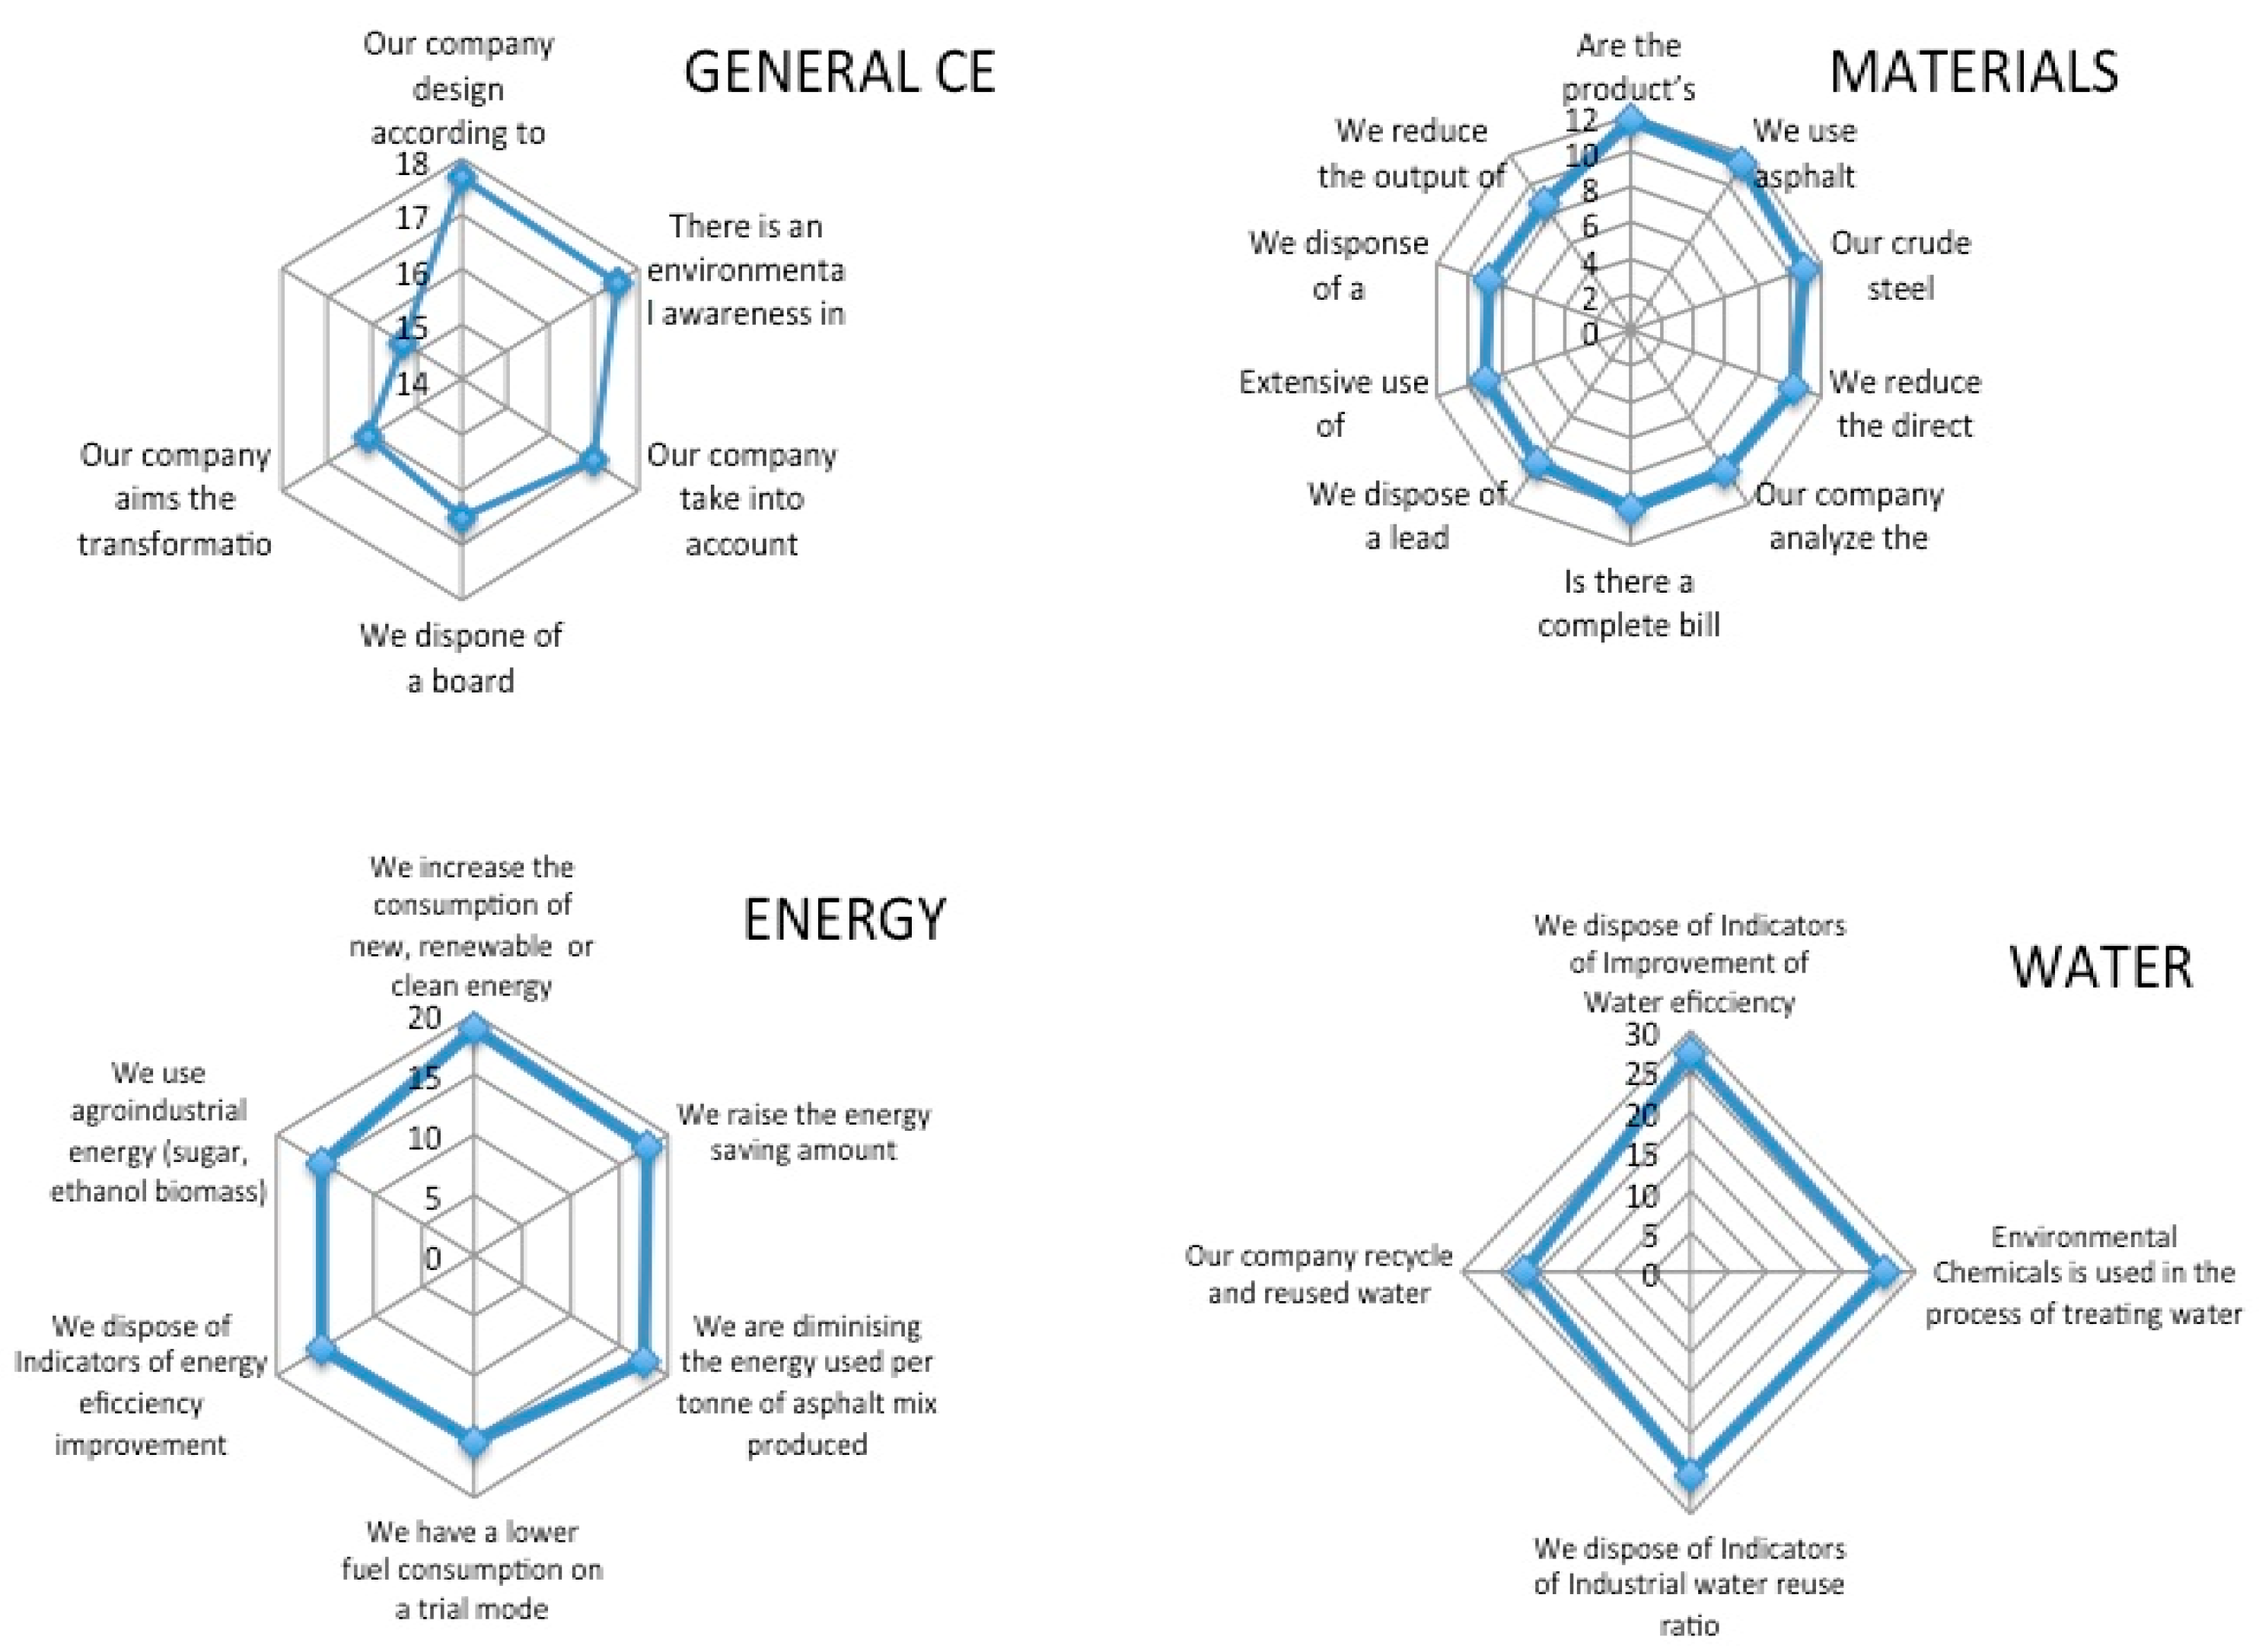
4.2. Indicators That Composed the Dimension Transition to CE

Undoubtedly, CE is a dynamic concept, which includes general aspects and indicators reflecting the idea of transition to a new production model. The initial database was composed of 39 indicators that are related to general issues of the CE and transition.
After analysis and revision by the authors of these indicators, nine indicators were sent to the expert for valuation. The results of this first round led us to reduce the number of indicators to eight, and after the second round of the Delphi method, the final composition was of six indicators.
Table 6 shows that design and transformation to CE are strategic indicators for most of the experts, and the use of the Building Information Modelling (BIM) and dashboard about the management of materials are also elements needed for most of construction based on CE principles. We must even take into consideration the demands of the society around us and the environmental concerns of the company itself, which will lead to a greater awareness of the key aspects of CE.
In relation to the sections that make up the scale, the analysis has determined seven dimensions: Transition to CE, Energy, 3R’s, Water management, Waste management, Materials, and Emissions. Figure 2 shows the weight of each of these dimensions in the total of the scale, highlighting as the most relevant the Energy section, which has a weight in the total of the 15% scale. Then, 3R’s and Water management with a weight of 14.5%, Waste management with a weight of 14.4%, Materials with a weight of 14.2%, and Emissions with weight of 13.8%. On the other hand, Figure 3 shows the indicators of each dimension.

4.3. Indicators that Composed the Dimension Materials Management

Certainly, the existing concern about materials has given great relevance to this dimension of the scale. The initial base of indicators about materials included 43 items. After analysis and depuration by the authors, the initial scale was composed of 16 indicators. These were sent for the first round of the e-Delphi method. The results of the evaluation of the experts led us to eliminate three indicators and send seven to the second round of revision seeking consensus. The validation by the experts in the second round, in accordance with the acceptance and exclusion rules, led us to confirm the final scale by discarding three and accepting ten indicators for the measurement (See Table 6).
Furthermore, the materials dimension of the scale reflects the importance of the existence of indicator of improvement and inverse supply chain, the most ranked indicators. Besides, specific indicators about construction project were well valued by the experts, such as: Asphalt pavement recycled in order to reclaim bitumen, Direct Material Input, and Output of main mineral Resources.

4.4. Indicators that Composed the Dimension: Energy

Energy is undoubtedly a key aspect of the CE. To develop this scale, 32 indicators were taken from the database. Once codified, reviewed, and classified by the authors, eight indicators were selected and sent to the experts for evaluation. From the results of the first round, one indicator was eliminated, and three were revised, seeking consensus among the experts. In the second round, consensus was reached on these indicators, and finally, seven remained. Table 6 shows the values of the energy dimensions indicators. One more indicator was eliminated after of analysis of CFA results.
Most of the indicators were taken from top ranked building companies, and the most valued was: The consumption of new energy, renewable energy, or clean energy, which certainly is a key aspect of CE. The second important indicator was: Energy saving amount. Apart from these, the dimension includes a specific indicator of the building industry as: The level of energy used per tonne of asphalt mix produced.

4.5. Indicators That Composed the Dimension: Water

The initial database included 33 indicators that are related to water, which after the classification and screening process, were grouped into seven, which were sent to the experts in the first round. With the information obtained from the experts and after the statistical analysis, three items were discarded and one was sent for review in search of consensus. Finally, the scale was made up of four indicators, as shown in Table 6.
The indicator: Reuse and recycling of water level is the most valued indicator on the entire scale. Also, the indicator Environmental Chemicals used in the process of treating water and sewage was highly valued. Apart from this, the water dimension includes a dynamic Indicator of improvement and Industrial water reuse ratio.

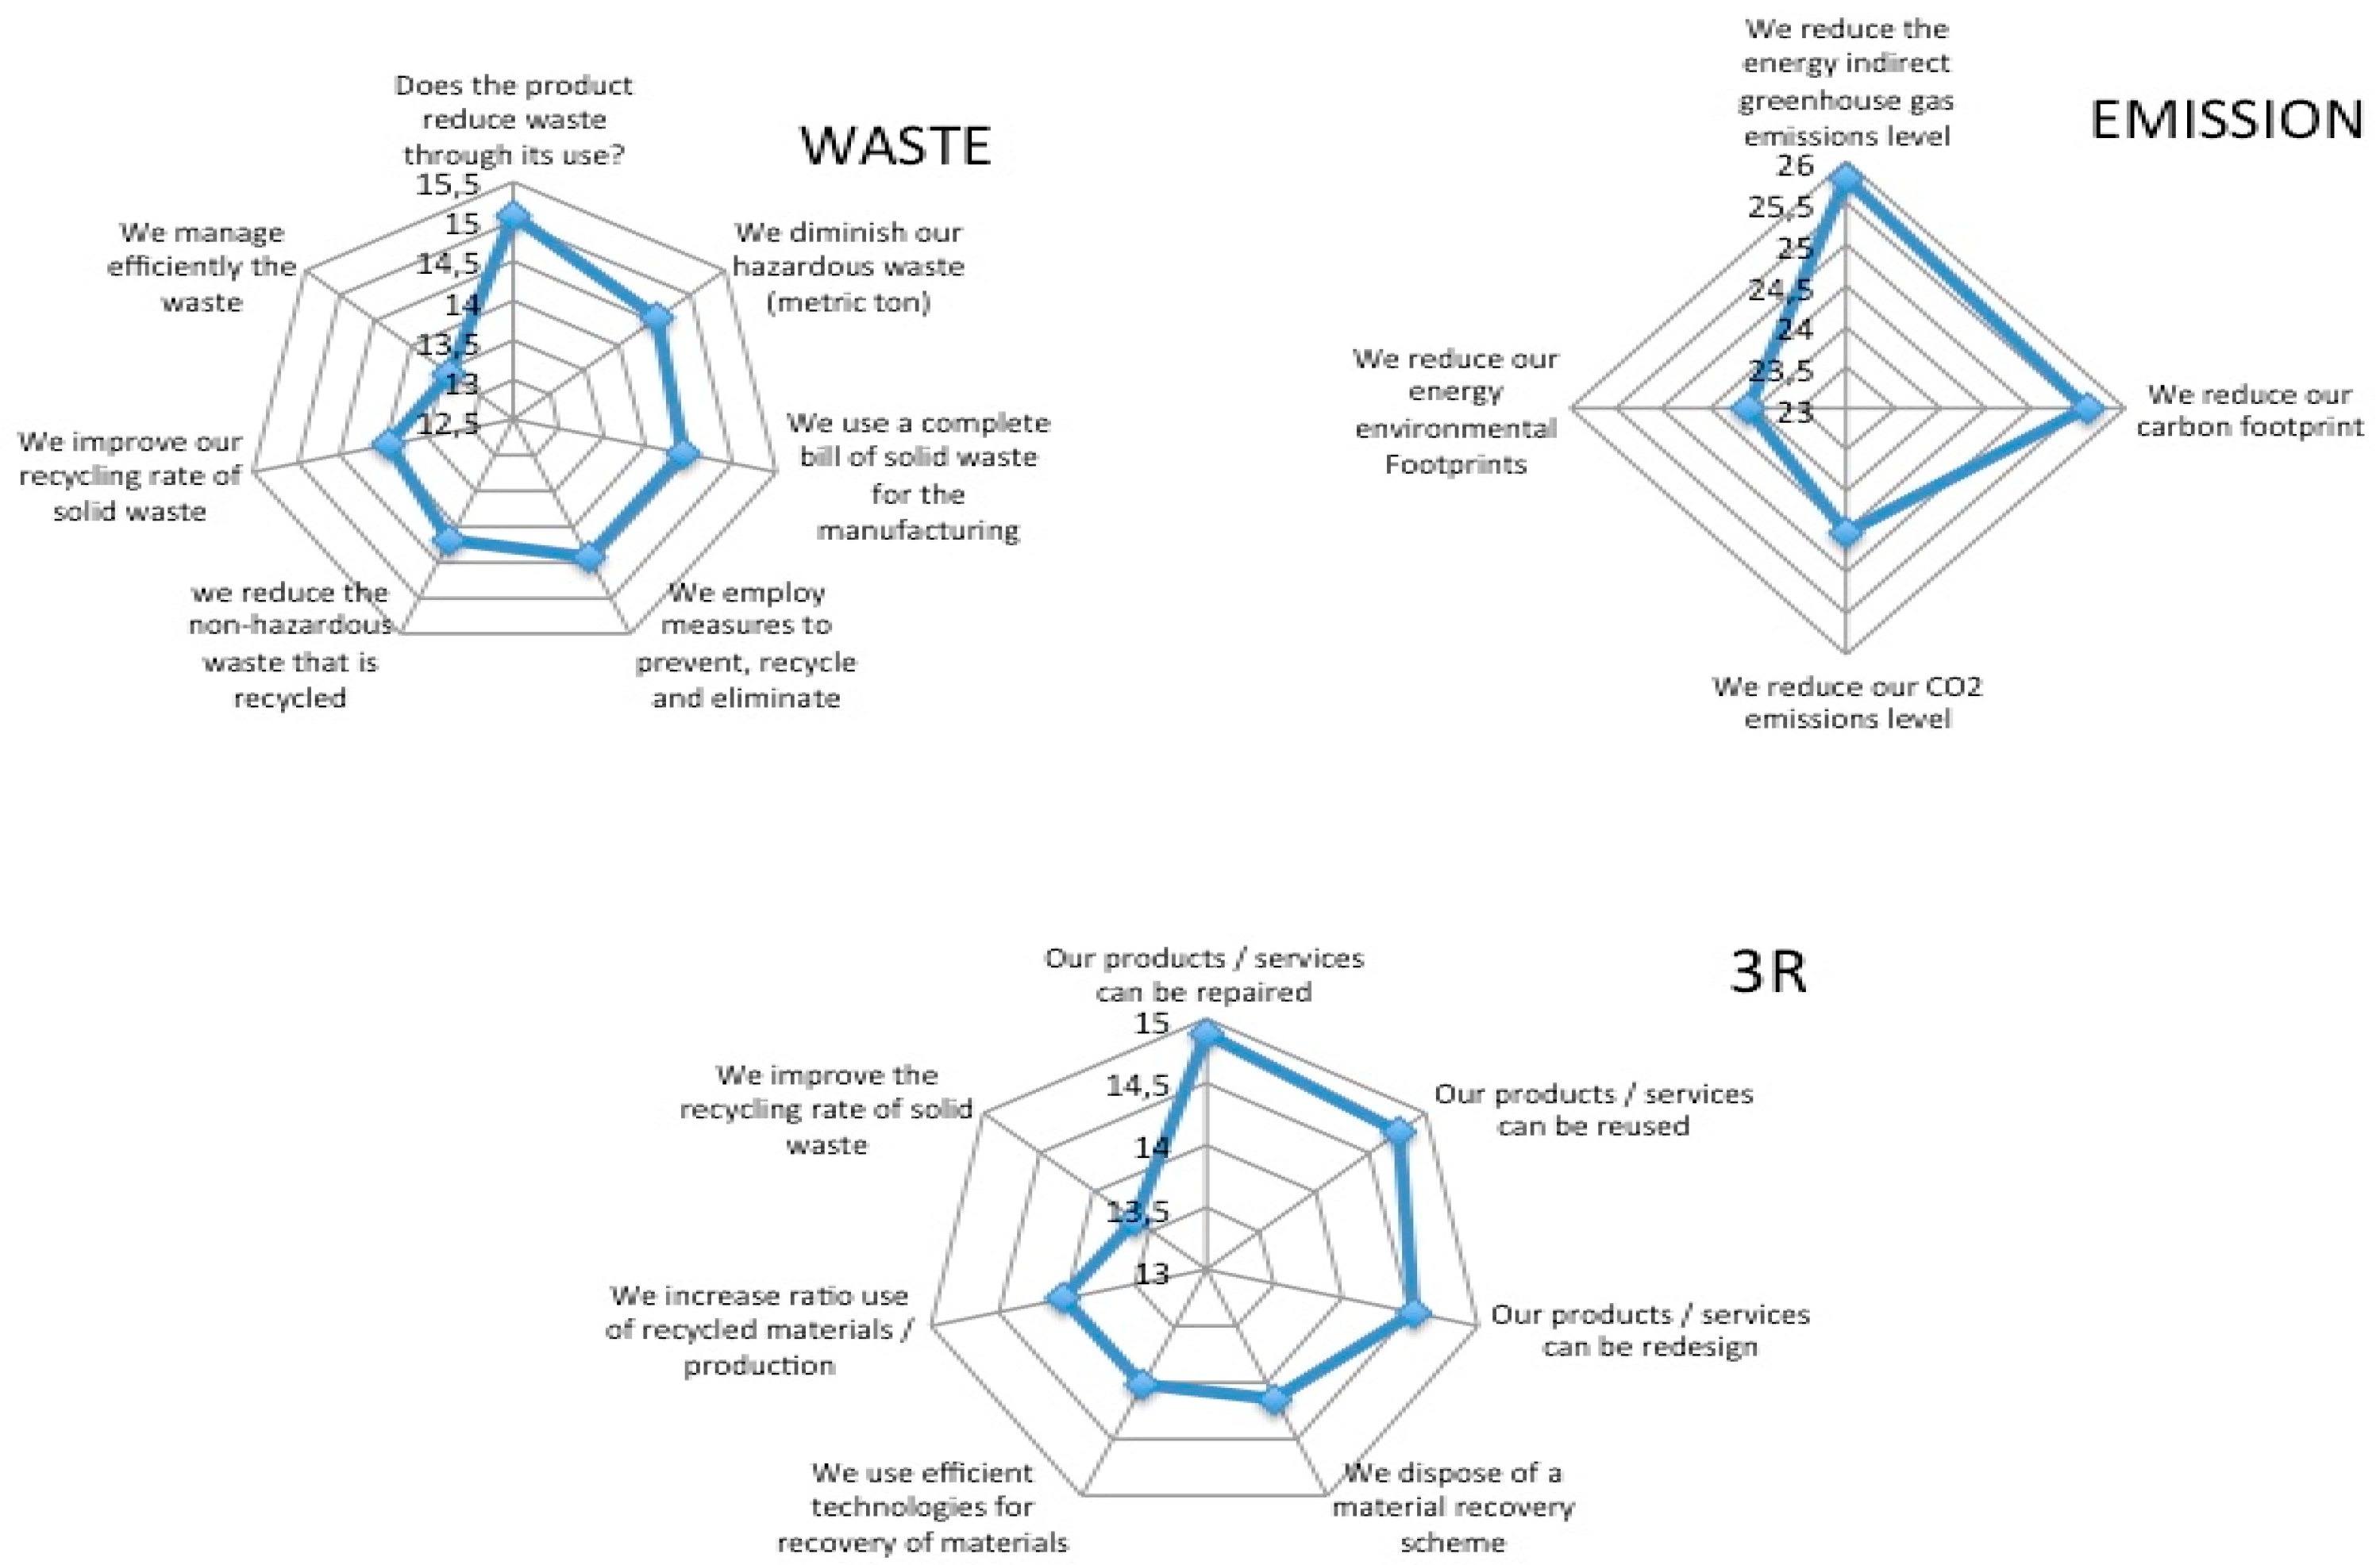
4.6. Indicators That Composed the Dimension: 3Rs Reduce, Reuse and Recycle

The 3R dimension includes indicators that fit in with the Crack to Cradle (C2C) approaches of Braungart (2002), based on the idea of providing a longer life to resources, thanks to the reduction of their consumption, their reuse, and recycling. Initially, 17 indicators of this subject were included in the database, which, after analysis by the authors, were reduced to eight. These were sent in the first round of the e-Delphi to the experts, who proposed the elimination of one indicator that did not verify the rules of acceptance. Besides, two indicators were sent to the expert in order to revise then. The contributions of the experts in this second round led us to keeping seven indicators within the dimension, because consensus was reached on their assessment. The final score of the experts for the 3R scale appears in the Table 6. The most valued indicator was “Our company improves the ratio: use of recycled materials/production”.

4.7. Indicators That Composed the Dimension: Emissions

One of the most worrisome issues today is the reduction of the negative externalities that are generated by a company and their environmental impact [71]. The latest agreements on emissions highlight that it is one of the keys to improving the circularity of an industry such as construction.
To design the Emissions dimension, we started with a total of 43 indicators from the previous works, literature review, and analysis of the reports of the companies in the field of construction. This set was reduced to 10, which were the indicators that were sent to the experts to be evaluated in the first round. The results of the evaluation led us to eliminate two indicators, because the experts did not consider them relevant, and we proceeded to review five of them. In the second round of the e-Delphi method, the experts reached consensus on the elimination of another four indicators, leaving the scale composed of the four items shown in the Table 6.
The indicator Carbon footprint was taken from the work of Griffiths and Cayzer [18], and CO2 emissions level from Zhu and Sarkis [72]; Bouyguees report (2016); and, Skanska report (2016). The most valued indicators for this dimension were: We reduce our energy environmental Footprints (Bechtel report, 2016) and Energy indirect greenhouse gas emissions, taken from Honchtief report (2016).

4.8. Indicators That Compose the Dimension: Waste Management

Another of the essential divisions of the scale for measuring the CE in the construction sector is waste management. Thus, 21 indicators, which were previously selected from our database, served as the base of the scale. The first review by the authors reduced the number of indicators to 11. These were sent to the experts for their assessment, reaching consensus on the acceptance of five indicators, the review of three, and the elimination of three. In the second round three indicators were eliminated. Also, one indicator more was rejected by the results of the CFA analysis, and the final scale was composed of the seven indicators that appear in Table 6.
The indicators Is there a complete bill of solid waste for the manufacturing process? was the most valued by the experts, as was obtained from Griffith and Cayzer [18]. Finally, for the practical application of the scale, the weights of both, each one of the dimensions and the indicators of the same one, are shown in the Table 7.

5. Discussion

The literature review highlighted a challenge, which is that we do not have a specific scale of measurement for the construction industry to guarantee its future sustainability. A general concept of the research relies on a very popular proverb in management and applied economics: “what gets measured, gets done”. By giving a consistent scale for measurement, there appear to be new opportunities for business to examine procedures/strategies (and as a result, to reward or to punish those who get responsibility) in order to achieve what is set out to perform. Through a review of literature, report analysis, application of the Delphi method, and CFA, a scale, that allowed for establishing the position of the building companies regarding CE, was built in response to the research questions of this work.
Therefore, this research helps to advance in the implementation of the CE production model in the building sector, by presenting a scale of desirable indicators of the company’s circularity thinking. This scale of measurement was generated from the analysis and review of 234 indicators. Among our objectives, one was the immediate practical application of the scale to companies in the sector. For these reasons, not only indicators from the academic world were chosen, but also indicators from top construction companies. So, 107 indicators were collected from the literature review and 127 from content analysis of sustainability reports from 10 top building contractors. To answer our research questions, a mix qualitative/quantitative methodology was used, first applying the e-Delphi technique, and after that, a confirmatory factor analysis to measure the validity of the scale.
Thus, the first contribution is a design of the dimensions that comprise the scale. What are the dimensions that experts consider most important when measuring the implementation of the Circular Economy in the construction industry? These are: Energy management, Water management, Waste management, and application of 3Rs principles that were the dimension best ranked. After that, other three dimensions: Emissions, Material, and Transition of CE were included in the scale. This measurement scale was agreed upon by the group of experts through the application of the e-Delphi technique, reaching consensus in the second round, Energy being the dimension that was most valued by the expert group.
This contribution shows that the academic and professional world are seriously concerned about the care of energy. For instance, Geng et al. [35] and Wadel et al. [55] highlighted the lack of absolute material/energy reduction indicators. For this reason, once one knows the dimensions, it can develop and validate specific indicators to measure them, weighting according to the experts their relevance in each dimension. This contribution is important because it allows for progress in the application of the CE, it covers the gap that was highlighted in the research on the subject [12] and evolves from the analysis of previous works of sustainability measurement and CE in companies [2,35,49,51].
The most ranked dimension of the scale (Energy) introduces six indicators, with Removable or clean energy consumption being the indicator most valued by experts. Certainly, companies and academics agree on the need to conveniently manage energy, increasing the use of renewable energy each year to replace those with the greatest environmental impact. This must be complemented with measures that improve energy efficiency, incorporating indicators that help it, so there is a reduction in gross energy consumption. On the other the hand, Water Management dimension is made up of four items, highlighting that the indicator Degree of recycling and water reuse is the most valued of the total of 52 that make up the scale. Therefore, the company must incorporate systems that allow for the reuse and reuse of water, thus showing the concern of the experts for the efficiency in the use of this resource, incorporating specific ratios of reuse and improvement in the efficiency of the use of the water.
Regarding to the dimension 3R’s: Reduce, reuse, and recycle would include the indicators that are related to the possibility that the product will be reused, being this indicator the most valued by the experts. Undoubtedly, the change in the way of production of the construction industry should be supported by the 3R’s, they have very resistant materials that facilitate reuse, so they have to incorporate designs and technologies that allow it.
Six indicators were incorporated to the dimension Transition to CE, where the experts’ view stated the importance of design according to CE principles, as a most valued indicator of this dimension. This shows that, for the company and academics, the design in the construction sector in accordance with the principles of the CE is fundamental for the sustainability of the sector. It is also important to promote the transformation of companies towards this new productive model, taking into consideration the environmental impact of the company.
In addition, the scale Materials included ten indicators, highlighting in this group the importance of the existence of measurements on the efficiency of the use of materials, in line with Wadel et al. [55]. Besides, it is also necessary to incorporate channels into the organization that allow for the recovery of materials through a reverse supply chain. In addition to the relevance of the company using with responsibility the construction materials. The scale of measure includes two dimensions focused on the negative externalities of the companies: Emissions and Waste management. About the first, it analyses the environmental impact, being composed of four indicators. The carbon footprint and the CO2 level being the highest ranked, Thus, the idea of reducing the carbon footprint and global emissions of CO2 are the indicators that have been most valued by academics and entrepreneurs, specifically highlighting the necessity of control of the emissions footprint that was derived of the company’s energy consumption. Secondly, the waste management dimension raises the need to design products that can be reused in order to reduce the waste generated.
Another contribution of the work of this study is the development of a critical analysis in the construction sector on the system of sustainability indicators for this sector. The scale that has been provided can be used for the comparative evaluation, for the improvement of the environmental performance of the construction companies in multiple levels, for the identification of problematic areas in which more effort is required to advance, the cost analysis -benefit, knowing the weights of each dimension, and the final contribution that it will make to the overall valuation of the company. It will also be useful for strategic management, business investment decisions, and many other applications, allowing for the company’s stakeholders to know the position it presents towards CE. With this, a need for integration of these indicators into the company’s decision-making strategies becomes evident, in order to achieve its effective implementation.

Practical Implications and Use of the Scale

Regarding the practical application, our study provides a measurement scale applicable immediately to the construction industry. It is useful for both companies and governments, because these indicators are already being measured by construction firms, thereby guaranteeing the applicability and the possibility of using dynamic indicators that allow for comparing the degree of implementation of the CE between different periods of time. Government and public administrations are concerned about environmental issues, especially CO2 levels, generated waste and scarcity of materials. Besides, they need to assess the implementation of CE, facing new strategic regulations that are implemented or discussed e.g., by the European Union. Our work contributes by providing a scale to evaluate and establish a ranking of implementation of CE, which allows for them to make decisions about sustainability and classify buildings based on their sustainability, taking into account multiple points of view, such as the care of materials, the environmental impact, and the transition effort of the company towards a new model of production. Therefore, the transition to another model of production such as CE is not a question of social responsibility alone, but instead, has become a strategic factor that guarantees companies’ future continuity and the commitment of governments to the CO2 reduction goals.
The application of CE in the building industry will be supported by the ideas of reducing, reusing and recycling, which are the basis of the new productive systems, paying special attention to care of the resources, such as materials, energy, and water. Thanks to these new ways of production, companies will decrease their environmental impact, controlling the CO2 emissions and the waste generated. Their application will promote the sustainability of companies in the future. On the other hand, the companies’ interest groups, public administrations, and institutions seeking sustainability have the right to require from the construction companies to develop their projects in accordance with the CE principles. During the procurement process of public works, companies can be called for bids respecting the CE, so for this type of contract, a measure of the degree to which they implement CE may occur useful.
Taking into account the application of the scale, the respondant will value each indicator from 1 (very low relevance) to 7 (very high relevance). After of the evaluation, the results that were obtained from each dimension will be added and weighted by the established weight of each indicator. After that, the new values will be weighted again, according to the weight of each section. The sum of all weighted dimensions describes the final value of the degree of implementation of CE. The final weighted score will be between 1 and 7, where 1 means that a company does not implement CE at all, and 7 is a company in which CE is fully implemented.

6. Conclusions, Limitations and Future Research Lines

Building industry requires urgent measures. According to the results that were obtained in the analysis, the article contributes to evaluating the implementation of CE in the construction industry, from traditional production systems to the circular model. Energy, materials, water, and 3R are the dimensions of the scale related to resource management. Two dimensions, waste and emissions, are related to the environmental impact, with the remaining being transition to CE. Therefore, the main contribution of this paper is a design of the scale that will provide information to the company itself and its stakeholders, on the degree of long-term sustainability of the construction company, and the degree of implementation of CE.
This work shows some limitations to be considered. In the first place, a questionnaire administered via the web, as an instrument for gathering information from experts in the e-Delphi method, it has the specific limitations derived from the subjectivity of the use of this tool. On the one hand, a respondent does not go into specifics of the phenomenon under study, so it has a margin of free interpretation that can distort the objective established through the indicators. On the other hand, people who have answered the questionnaire can transmit biased information, since many items are based on the perception of the respondent. In addition, the limitations of the Delphi technique, such as the difficulties of experimental control, the recruitment to panels, the commitment of experts, the mutual attrition during the process, and the balance of consensus appear to be significant. Likewise, not everyone has available access to the web platform.
Finally, another limitation comes from the transversal nature of the research. The information has been collected at a certain time, with the exception of certain performance indicators. However, it would be convenient to analyze the effect of training and development of people on the performance of organizations from an evolutionary perspective, using long periods of time that isolate temporal phenomena and specific circumstances that may distort the result of the investigation.
The limitations and the deepening the subject of the study give rise to some future lines of research that are exposed, as follows. It is believed that it would be interesting to evaluate the implementation of the CE, not at a specific moment, but through a broader time frame, through longitudinal analyzes that observe the evolution of the variables under study. Specifically, it is considered that between 5 and 10 years is an appropriate period to longitudinally verify the effects of the practices on the performance indicators of the organization. It would also be interesting to extend the application of this scale to other industrial sectors that are in the process of CE implementation. Besides, the dissemination, the use, integration in the decision making systems, and the evolution of these indicators are new lines of research at multiple levels, which is in line with Geng et al. [35].

Author Contributions

This study is a joint work of the four authors. P.N.-C. (First Author) contributed to the ideas of circular economy and the design of the research, J.G. contribute with the analysis if the building industry, report analysis and Delphi application, while V.M.-M. and F.A.C. worked with data. The four authors interpreted the results and develop discussion and conclusion sections. All authors read and approved the final manuscript.

Acknowledgments

Research Group SEJ 232 Direction and Organization for Competitiveness. Jaen University. Research Group SEJ 478 Advanced Research in Business Addressing. Granada University. 2º Workshop International Circular Economy of Polytechnic School of Linares (Spain).

Conflicts of Interest

The authors declare no conflicts of interest.

References

  1. Shen, X.; Qi, S. Countermeasures towards Circular Economy Development in West Regions. Energy Procedia 2012, 6, 927–932. [Google Scholar] [CrossRef]
  2. Núñez-Cacho, P.; Górecki, J.; Molina, V.; Corpas-Iglesias, F. How to measure and predict degree of circularity thinking in construction sector? Modern way to build competitive advantage. J. EU Res. Bus. 2018, 2018, 1–16. [Google Scholar]
  3. Reh, L. Process engineering in circular economy. Particuology 2013, 11, 119–133. [Google Scholar] [CrossRef]
  4. Ries, J.; Grosse, E.H.; Fichtinger, J. Environmental impact of warehousing: A scenario analysis for the United States. Int. J. Prod. Res. 2016, 55, 6485–6499. [Google Scholar] [CrossRef]
  5. Esa, M.R.; Halog, A.; Rigamonti, L. Developing strategies for managing construction and demolition wastes in Malaysia based on the concept of circular economy. J. Mater. Cycles Waste Manag. 2016. [Google Scholar] [CrossRef]
  6. Khoshnava, S.M.; Rostami, R.; Ismail, M.; Rahmat, A. A cradle-to-gate based life cycle impact assessment comparing the KBFw EFB hybrid reinforced poly hydroxybutyrate biocomposite and common petroleum-based composites as building materials. Environ. Impact Assess. Rev. 2018, 70, 11–21. [Google Scholar] [CrossRef]
  7. Braungart, M.; McDonough, W.; Bollinger, A. Cradle-to-cradle design: Creating healthy emissions–a strategy for eco-effective product and system design. J. Clean. Prod. 2007, 15, 1337–1348. [Google Scholar] [CrossRef]
  8. Lieder, M.; Rashid, A. Towards Circular Economy implementation: A comprehensive review in context of manufacturing industry. J. Clean. Prod. 2016, 115, 36–51. [Google Scholar] [CrossRef]
  9. Mulhall, D.; Braungart, M. Cradle To Cradle criteria for the built environment. Ekonomiaz 2010, 75, 182–193. [Google Scholar]
  10. Van Dijk, S.; Tenpierik, M.; Van den Dobbelsteen, A. Continuing the building’s cycles: A literature review and analysis of current systems theories in comparison with the theory of Cradle to Cradle. Res. Conserv. Recycl. 2014, 82, 21–34. [Google Scholar] [CrossRef]
  11. Ellen Macarthur Foundation Editorial Team. The Circular Model—Brief History and Schools of Thought; Ellen Macarthur Foundation: Cowes, UK, 2013; Available online: http://goo.gl/KHZpJ7 (accessed on 10 April 2017).
  12. Saavedra, Y.M.; Iritani, D.R.; Pavan, A.L.; Ometto, A.R. Theoretical contribution of industrial ecology to circular economy. J. Clean. Prod. 2018, 170, 1514–1522. [Google Scholar] [CrossRef]
  13. Wang, H.; Xu, X.; Zhu, G. Landscape Changes and a Salt Production Sustainable Approach in the State of Salt Pan Area Decreasing on the Coast of Tianjin, China. Sustainability 2015, 7, 10078–10097. [Google Scholar] [CrossRef] [Green Version]
  14. Su, B.W.; Heshmati, A.; Geng, Y.; Yu, X.M. A review of the circular economy in China: Moving from rhetoric to implementation. J. Clean. Prod. 2013, 42, 215–227. [Google Scholar] [CrossRef]
  15. Han, J.; He, X. Development of circular economy is a fundamental way to achieve agriculture sustainable development in China. Energy Procedia 2011, 5, 1530–1534. [Google Scholar]
  16. Bonziu, F. The European economy: From a linear to a circular economy. Rom. J. Eur. Aff. 2014, 14, 78–91. [Google Scholar]
  17. Molina-Moreno, V.; Leyva-Díaz, J.C.; Llorens-Montes, F.J.; Cortés-García, F.J. Design of indicators of circular economy as instruments for the evaluation of sustainability and efficiency in wastewater from pig farming industry. Water 2017, 9, 653. [Google Scholar] [CrossRef]
  18. Griffiths, P.; Cayzer, S. Design of indicators for measuring product performance in the circular economy. In International Conference on Sustainable Design and Manufacturing, 3rd ed.; Setchi, R., Howlett, R.J., Liu, Y., Theobald, P., Eds.; Springer Science and Business Media Deutschland GmbH: Berlin, Germany, 2016. [Google Scholar]
  19. Lewandowski, M. Designing the Business Models for Circular Economy-towards the Conceptual Framework. Sustainability 2016, 8, 43. [Google Scholar] [CrossRef]
  20. Tukker, A. Product services for a resource-efficient and circular economy—A review. J. Clean. Prod. 2013, 97, 76–91. [Google Scholar] [CrossRef]
  21. Murry, J.W.; Hammors, J.O. Delphi, a versatile methodology for conducting qualitative research. Rev. High. Educ. 1995, 18, 423–436. [Google Scholar] [CrossRef]
  22. Wang, L.; Zhang, H. Development of Circular Economy and Optimization of Industrial Structure for Shandong Province. Energy Procedia 2011, 5, 1603–1610. [Google Scholar] [CrossRef]
  23. Ju, C.; Ning, Y.; Pan, W. A review of interdependence of sustainable building. Environ. Impact Assess. Rev. 2016, 56, 120–127. [Google Scholar] [CrossRef]
  24. Kang, H.; Lee, Y.; Kim, S. Sustainable building assessment tool for project decision makers and its development process. Environ. Impact Assess. Rev. 2016, 58, 34–47. [Google Scholar] [CrossRef]
  25. Silvestre, J.D.; de Brito, J.; Pinheiro, M.D. Environmental impacts and benefits of the end-of-life of building materials—Calculation rules, results and contribution to a “cradle to cradle” life cycle. J. Clean. Prod. 2014, 66, 37–45. [Google Scholar] [CrossRef]
  26. Pope, J.; Bond, A.; Hugé, J.; Morrison-Saunders, A. Reconceptualising sustainability assessment. Environ. Impact Assess. Rev. 2016, 62. [Google Scholar] [CrossRef]
  27. Kache, F.; Seuring, S. Challenges and opportunities of digital information at the intersection of Big Data Analytics and supply chain management. Int. J. Prod. Manag. 2017, 37, 10–36. [Google Scholar] [CrossRef]
  28. Ehrenfeld, J. The Importance of LCAs—Warts and All. J. Ind. Ecol. 1997, 1, 41–49. [Google Scholar] [CrossRef]
  29. Sandanayake, M.; Zhang, G.; Setunge, S. A comparative method of air emission impact assessment for building construction activities. Environ. Impact Assess. Rev. 2018, 68, 1–9. [Google Scholar] [CrossRef]
  30. Neumüller, C.; Florian, K.; Jatinder, D.G.; Lasch, R. Integrating Three-dimensional Sustainability in Distribution Centre Selection: The Process Analysis Method-Based Analytic Network Process. Int. J. Prod. Res. 2015, 53, 409–434. [Google Scholar] [CrossRef]
  31. Dyllick, T.; Hockerts, K. Beyond the Business Case for Corporate Sustainability. Bus. Strategy Environ. 2002, 11, 130–141. [Google Scholar] [CrossRef]
  32. Tibbs, H. Industrial Ecology: An environmental agenda for Industry. In Government White Paper; Global Business Network: Washington, DC, USA, 1993. [Google Scholar]
  33. Ngai, E.; Chuck, C.H.; Law, C.; Lo, C.W.; Poon, J.; Peng, S. Business sustainability and corporate social responsibility: Case studies of three gas operators in China. Int. J. Prod. Res. 2017. [Google Scholar] [CrossRef]
  34. Ilić, M.; Nikolić, M. Drivers for development of circular economy—A case study of Serbia. Habitat Int. 2016, 56, 191–200. [Google Scholar] [CrossRef]
  35. Geng, Y.; Fu, J.; Sarkis, J.; Xue, B. Towards a national circular economy indicator system in China: An evaluation and critical analysis. J. Clean. Prod. 2017, 23, 216–224. [Google Scholar] [CrossRef]
  36. Anvari, S.; Turkay, M. The facility location problem from the perspective of triple bottom line accounting of sustainability. Int. J. Prod. Res. 2017, 55, 6266–6287. [Google Scholar] [CrossRef]
  37. Lyle, J.T. Regenerative Design for Sustainable Development; John Wiley & Sons: Hoboken, NJ, USA, 1996; ISBN 978-0-471-17843-9. [Google Scholar]
  38. Núñez-Cacho, P.; Molina-Moreno, V.; Corpas-Iglesias, F.A.; Cortés-García, F.J. Family Bus.es Transitioning to a Circular Economy Model: The Case of “Mercadona”. Sustainability 2018, 10, 538. [Google Scholar] [CrossRef]
  39. Mahut, F.; Daaboul, J.; Bricogne, M.; Eynard, B. Product-Service Systems for servitization of the automotive industry: A literature review. Int. J. Prod. Res. 2016, 55, 2102–2120. [Google Scholar] [CrossRef]
  40. Dowlatshahi, S. A cost-benefit analysis for the design and implementation of reverse logistics systems: Case studies approach. Int. J. Prod. Res. 2010, 48, 1361–1380. [Google Scholar] [CrossRef]
  41. Keeney, S.; Hasson, F.; McKenna, H.P. A critical review of the Delphi technique as a research methodology for nursing. Int. J. Nurs. Stud. 2001, 28, 195–200. [Google Scholar] [CrossRef]
  42. Linstone, H.A.; Turoff, M. The Delphi Method: Techniques and Applications; Addison-Wesley: Reading, MA, USA, 2002. [Google Scholar]
  43. Chu, H.C.; Hwang, G.J. A Delphi-based approach to developing experts system with the cooperation of multiple experts. Experts Syst. Appl. 2007, 34, 2826–2840. [Google Scholar] [CrossRef]
  44. Okoli, C.; Pawlowski, S.D. The Delphi method as a research tool: An example, design considerations and applications. Inf. Manag. 2004, 42, 15–29. [Google Scholar] [CrossRef] [Green Version]
  45. Delbecq, A.L.; Van de Ven, A.H. Group Techniques for Program Planning: A Guide to Nominal Group and Delphi Processes; Gustafson, D.H., Ed.; Scott-Foreman: Glenview, IL, USA, 1975. [Google Scholar]
  46. MacEachren, A.M.; Pike, W.; Yu, C.; Brewer, I.; Gahegan, M.; Weaver, S.D.; Yarnal, B. Building a geocollaboratory: Supporting human environment regional observatory (HERO) collaborative science activities. Comput. Environ. Urban Syst. 2006, 30, 201–225. [Google Scholar] [CrossRef]
  47. Cochran, S.W. The Delphi method: Formulation and refining group judgments. J. Hum. Sci. 1983, 2, 111–117. [Google Scholar]
  48. Campopiano, G.; De Massis, A. Corporate Social Responsibility Reporting: A Content Analysis in Family and Non-family Firms. J. Bus. Ethics 2015, 129, 511–534. [Google Scholar] [CrossRef]
  49. Abu-Ghunmi, D.; Abu-Ghunmi, L.; Kayal, B.; Bino, A. Circular economy and the opportunity cost of not ‘closing the loop’ of water industry: The case of Jordan. J. Clean. Prod. 2016, 131, 228–236. [Google Scholar] [CrossRef]
  50. Genovese, A.; Acquaye, A.A.; Figueroa, A.; Koh, S.C.L. Sustainable Supply Chain Management and the Transition towards a Circular Economy: Evidence and Some Applications; Omega: Biel, Switzerland, 2017; Volume 66, pp. 344–357. ISSN 0305-0483. [Google Scholar]
  51. Ma, S.; Wen, Z.; Chen, J.; Wen, Z. Mode of circular economy in China’s iron and steel industry: A case study in Wu’an city. J. Clean. Prod. 2014, 64, 505–512. [Google Scholar] [CrossRef]
  52. Moriguchi, Y. 3R Initiatives and Circular Economy Material flow indicators to measure progress toward a sound material-cycle society. J. Mater. Cycles Waste Manag. 2007, 9, 112–120. [Google Scholar] [CrossRef]
  53. Sheguetta, M.; Torring, D.; Bruhn, A.; Thomsen, M. Bioextraction potential of seaweed in Denmark—An instrument for circular nutrient management. Sci. Total Environ. 2016, 563, 513–529. [Google Scholar] [CrossRef] [PubMed]
  54. Van Der Wiel, A.; Bossink, B.; Masurel, E. Reverse logistics for waste reduction in cradle-to-cradle-oriented firms: Waste management strategies in the Dutch metal industry. Int. J. Technol. Manag. 2012, 60, 96–113. [Google Scholar] [CrossRef]
  55. Wadel, G.; Avellaneda, J.; Cuchí, A. La sostenibilidad en la arquitectura industrializada: Cerrando el ciclo de los materiales. Inf. Constr. 2010, 62, 37–51. [Google Scholar] [CrossRef] [Green Version]
  56. Widmer, R.; Oswald-Krapf, H.; Sinha-Khetriwal, D.; Schnellmann, M.; Böni, H. Global perspectives on e-waste. Environ. Impact Assess. Rev. 2005, 25, 436–458. [Google Scholar] [CrossRef]
  57. Zhao, Y.; Xing, W.; Lu, W.; Zhang, X.; Christensen, T.H. Environmental impact assessment of the incineration of municipal solid waste with auxiliary coal in China. Waste Manag. 2012, 32, 1989–1998. [Google Scholar] [CrossRef] [PubMed]
  58. Gobin, A.; Linh, P.H.; Hai, L.T.; Hens, L. Social impacts of desertification. In Impact of Global Climate Change and Desertification on the Environment and Society in Southern Centre of Vietnam (A Case Study in the Binh Thuan Province); Vlaamse Instelling voor Technologisch Onderzoek (VITO): Mol, Belgium, 2012. [Google Scholar]
  59. De Vellis, R.F. Scale Development: Theory and Applications; Sage Publications: Newbury, UK, 1991. [Google Scholar]
  60. Peterson, R.A. A meta-analysis of Cronbach’s coefficient alpha. J. Consum. Res. 1991, 21, 381–391. [Google Scholar] [CrossRef]
  61. Camisón, C.; Bou, J.C. Calidad percibida de la empresa: Desarrollo y validación de un instrumento de medida. Rev. Eur. Dir. Econ. Empresa 2000, 9, 9–24. [Google Scholar]
  62. Cronbach, J.L. Coefficient alpha and the internal structure of test. Psychometrika 1954, 16, 297–334. [Google Scholar] [CrossRef]
  63. Malhotra, N.K. Investigación de Mercados: Un Enfoque Práctico; Prentice Hall: Naucalpan de Juárez, México, 1997. [Google Scholar]
  64. George, D.; Mallery, P.Y. SPSS Step by Step: A Simply Guide and Reference; Wadsworsth Publishing: Belmont, CA, USA, 1995. [Google Scholar]
  65. Nunnally, J.C. Psichometric Theory; Mc Graw Hill: New York, NY, USA, 1978. [Google Scholar]
  66. Bagozzi, R.P.; Yi, Y.Y. On the evaluation of structural equation models. J. Acad. Mark. Sci. 1988, 16, 79–94. [Google Scholar] [CrossRef]
  67. Hair, J.F.; Anderson, R.; Tathan, R.L.; Black, W.C. Análisis Multivariante; Prentice Hall: Madrid, Spain, 1999; Volume 4, pp. 581–601. [Google Scholar]
  68. Peter, J.P.; Churchill, G.A.; Brown, T.A. Cautions in the use of different scores in the consumer research. J. Mark. Res. 1993, 19, 655–662. [Google Scholar]
  69. McDonough, W.; Braungart, M.; Anastas, P.T.; Zimmerman, J.B. Peer reviewed: Applying the principles of green engineering to cradle-to-cradle design. Environ. Sci. Technol. 2003, 37, 434–441. [Google Scholar] [CrossRef]
  70. Blériot, J. Cradle to Cradle—Products, but Also Systems. Ellen Macarthur Foundation. 2013. Available online: http://goo.gl/K87JHB (accessed on 10 February 2018).
  71. Shadram, F.; Johansson, T.D.; Lu, W.; Schade, J.; Olofsson, T. An integrated BIM-based framework for minimizing embodied energy during building design. Energy Build. 2016, 128, 592–604. [Google Scholar] [CrossRef]
  72. Zhu, Q.; Sarkis, J. The Moderating Effects of Institutional Pressures on Emergent Green Supply Chain Practices and Performance. Int. J. Prod. Res. 2007, 45, 4333–4343. [Google Scholar] [CrossRef]
Figure 1. Research design. Source: authors.
Sustainability 10 02340 g001
Figure 2. Relevance of each dimension of the Scale.
Sustainability 10 02340 g002
Figure 3. Indicators of each dimension.
Sustainability 10 02340 g003aSustainability 10 02340 g003b
Table 1. Review of literatura sinopsis.
Research Question:What Indicators Are Useful to Measure the Degree of Implementation of the CE?
Sources:Proquest Search Engines; Web of Science; Science Direct; Scopus; Google Academic
Keywords:Circular economy, Building Industry, Sustainability, Scale of measurement
Selection Period:From 2010 untill now
Type of Analysis:Qualitative
Paper selectedAbu-Ghunmi et al. [49]; Bonciu [16]; EMF Indicators [11]; Geng et al. [35]; Genovese et al. [50]; Griffiths and Cayzer [13]; Lewandoski [19]
Lieder and Rashid [8]; Ma et al. [51]; Moriguchi [52]; Nuñez-Cacho et al. [2]; Kang et al. [24]; Reh [3]; Sheguetta et al. [53]; Shen and Qi [1]; Silvestre, Brito and Pineiro [25]; Tukker [20]; Van der Wiel et al. [54]; Wadel, Avellaneda and Cuchí [55]; Widmer et al. [56]; Zhao et al. [57].
Source: Authors.
Table 2. Report analysis.
Research Question:What Indicators are Useful to Measure the Degree of Implementation of EC?
Sources:Sustainability report of top building companies
Keywords:Circular economy, Building Industry, Sustainability, Scale of measurement
Selection Period:2014–2016
Type of Analysis:Report analysis
Report selectedACS Report (2016); BECHTEL Report (2016); BOUYGUEES Report (2016); CHINA COM CONST Report (2016); HONCHTIEF Report (2016); ODERBRECHT Report (2016); SKANSKA Report (2016)
STRABAG Report (2016); TECHNIP Report (2016); VINCI Report (2016)
Source: Authors.
Table 3. Rules of e-Delphi methods.
RULEACTION
1 X ¯ Ii* > 1.9; and δIi > 0.95Reject the indicator
2 X ¯ Ii > 1.9; and δIi <0.95New round of review
31.9 ≤ X ¯ Ii > 1.5; and δIi > 0.85New round of review
41.9 ≤ X ¯ Ii > 1.5; and δIi < 0.85Accept
5 X ¯ Ii ≤ 1.5Accept
6An indicator is accepted when the conditions described in rule 5 are met.Accept
7Stability is reached when few or no changes in the response panel occur from round to [16].Final of review
Source: Adapted from Murry et al. [21]. Ii: Indicator I; X ¯ = Average of the evaluation by the experts, being 1 is very important and 5 very little important; δ = standard deviation of the valuation made
Table 4. Indicators suggested by expert panel.
Status1° Round2° RoundFinal
Eliminated151429
Review30
Accepted381654
Total8330
Table 5. Depuration of the Scale: Reliability, Validity and FCA.
DimensionAlpha De CronbachIFCχ2 (Chi-Squared)p Value *CFIIFIMFIRMRRMSEA
TRANSIT. TO CE0.7450.75416.440.2090.9850.9790.9350.0590.079
MATERIALS0.7970.82146.480.0920.8650.8790.8400.0610.081
ENERGY0.7890.80020.1270.1230.8270.8850.8980.0450.018
WATER0.7710.7775.410.0660.8480.8850.9500.0320.031
3R’s0.7360.76114.40.1080.9830.9900.9910.0610.036
EMISSIONS0.6760.7252.550.2780.9040.9430.9920.0440.080
WASTE0.7940.80813.30.4990.9930.9970.9980.0010.001
Source: Authors; * significant for p > 0.05.
Table 6. Final dimension, statistics, scores, weight of the scale after Delphi round and confirmatory factor analysis (CFA).
Number of Expert with Rating
Final Dimension of the Scale X ¯ δ12345POSITION
Energy1.2730.626257100
3R, Reduce, Reuse and Recycle1.3940.5562210100
Water management1.3940.747256110
Waste Management1.4240.830247101
Management of materials1.4550.8692010101
Emissions generated1.5760.9021910201
Transition to Circular Economy1.6360.7831711400
Indicators of dimension Transition to CE X ¯ δ12345POSITION
Our company design according to Circular economy principles 1.3940.609229200
Our company aims the transformation to Circular economy model1.4240.792199411
Our company take into account environmental issues 1.5450.5641616100
There is an environmental awareness in our society 1.6360.7831712311
Our company use the Building Information Modelling (BIM)1.7270.7191414500
We dispone of a board indicators for management of materials 1.8790.696920311
Indicators that composed the dimension: Material management X ¯ δ12345POSITION
We disponse of a Indicators of Improvement of use of materials 1.5150.7121712400
Are the product’s materials passed back into the supply chain? 1.6060.827199410
Extensive use of environmentally responsible in materials 1.7580.8301415220
We use asphalt pavement recycled in order to reclaim bitumen 1.9390.659522510
We dispose of a lead indicator for resource productivity 2.1210.6966171000
We reduce the direct Material Input2.0610.966519810
Is there a complete bill of materials and substances for the product? 2.2730.9443191010
Our crude steel production is very high 2.3330.6923171210
We reduce the output of main mineral resource2.3640.822221721
Our company analyze the iron resource efficiency2.3940.788317103010º
Indicators that composed the dimension: Energy X ¯ δ12345POSITION
We increase the consumption of new, renewable or clean energy1.2730.517257100
We raise the energy saving amount 1.4240.6631912200
We dispose of Indicators of energy eficciency improvement 1.5150.7552010200
We have a lower fuel consumption on a trial mode 1.9390.747918510
We use agroindustrial energy (sugar, ethanol biomass1.9390.8641214700
We are diminising the energy used per tonne of asphalt mix produced 1.9700.9511215600
Indicators that compose the dimension Water X ¯ δ12345POSITION
Our company recycle and reused water1.2120.6239100
We dispose of Indicators of Industrial water reuse ratio1.4240.7921910400
We dispose of Indicators of Improvement of Water efficiency1.4850.755219210
Environmental Chemicals is used in the process of treating water. 1.9390.8641215420
Indicator that composed the dimension 3 R´s, reduce, reuse and recycle X ¯ δ12345POSITION
Our company improves the recycling rate of solid waste 1.3940.6592011200
Our products/service can be reused 1.4240.6141814100
Our products/service can be redesign 1.4850.8341810500
Our company uses efficient technologies for the recovery of materials1.5760.6631417200
Our products/service can be repaired 1.6060.8991910220
Our company disposes of a material recovery scheme 1.6060.8991611600
Our company improves the ratio: use of recycled materials/production1.6970.8101413600
Indicators of dimensión Emissions X ¯ δ12345POSITION
We reduce our carbon footprint1.3330.816228210
We reduce our CO2 emissions level1.3640.962256110
We reduce the energy indirect greenhouse gas emissions level 1.5150.7551811400
We reduce our energy environmental Footprints1.5760.7921614210
Indicators of dimension Waste Management X ¯ δ12345POSITION
Does the product reduce waste through its use? 1.3640.6991912200
We improve our recycling rate of solid waste1.4850.6191615110
We diminish our hazardous waste 1.5150.7951215420
We manage efficiently the waste 1.5150.795218310
We employ measures to prevent, recycle and eliminate waste 1.5760.7921711500
We reduce the non-hazardous waste that is recycled1.6360.8951614300
We use a complete bill of solid waste for the manufacturing process 1.7580.7511117500
Source: authors. Ii: Indicator i.; X ¯ = Average of the evaluation by the experts, where 1 is very important and 5 very little important; δ = standard deviation of the valuation made, and position order the importance of highest to lowest of each indicator.
Table 7. Scale after Delphi rounds and CFA.
WeightIndicator1: Fully Disagree–7: Fully Agree
General CE Indicators (Weight: 13.54%)1234567
17.68Our company design according to Circular economy principles
17.53There is an environmental awareness in our society
16.94Our company take into account environmental issues
16.49We dispone of a board indicators for management of materials
16.05Our company aims the transformation to Circular economy model
15.30Our company use the Building Information Modelling (BIM)
Material Indicators (Weight: 14.27%)
11.76Are the product’s materials passed back into the supply chain?
11.45We use asphalt pavement recycled in order to reclaim bitumen
10.94Our crude steel production is very high
10.33We reduce the direct Material Input
9.71Our company analyze the iron resource efficiency
9.92Is there a complete bill of materials and substances for the product?
9.20We dispose of a lead indicator for resource productivity
9.00Extensive use of environmentally responsible in materials
8.89We disponse of a Indicators of Improvement of use of materials
8.79We reduce the output of main mineral resource
Energy Indicators (Weight: 15%)
18.69We increase the consumption of new, renewable or clean energy
17.93We raise the energy saving amount
17.48We are diminising the energy used per tonne of asphalt mix produced
15.35We have a lower fuel consumption on a trial mode
15.35We dispose of Indicators of energy eficciency improvement
15.20We use agroindustrial energy (sugar, ethanol biomass)
Water Indicators (Weight: 14.51%)
27.17We dispose of Indicators of Improvement of Water eficciency
25.65Environmental Chemicals is used in the process of treating water
25.22We dispose of Indicators of Industrial water reuse ratio
21.96Our company recycle and reused water
3R’s Indicators (Weight: 14.51%)
14.89Our products/services can be repaired
14.77Our products/services can be reused
14.52Our products/services can be redesign
14.14We dispose of a material recovery scheme
14.02We use efficient technologies for recovery of materials
14.02We increase ratio use of recycled materials/production
13.64We improve the recycling rate of solid waste
Indicators of emissions (Weight: 13.78%)
25.80We reduce the energy indirect greenhouse gas emissions level
25.58We reduce our carbon footprint
24.52We reduce our CO2 emissions level
24.09We reduce our energy environmental Footprints
Indicators of Waste (Weight: 14.39%)
15.06Does the product reduce waste through its use?
14.55We diminish our hazardous waste (metric ton)
14.43We use a complete bill of solid waste for the manufacturing process
14.43We employ measures to prevent, recycle and eliminate waste
14.18we reduce the non-hazardous waste that is recycled
13.93We improve our recycling rate of solid waste
13.42We manage efficiently the waste

