Article

Detail Engineering Completion Rating Index System (DECRIS) for Optimal Initiation of Construction Works to Improve Contractors’ Schedule-Cost Performance for Offshore Oil and Gas EPC Projects

1
POSTECH University & Hyundai Heavy Industries, Engineering Management Team, 400 Bangeojinsunhwan-doro, Dong-gu, Ulsan 44114, Korea
2
Graduate Institute of Ferrous Technology & Graduate School of Engineering Mastership, Pohang University of Science and Technology (POSTECH), 77 Cheongam-Ro, Nam-Ku, Pohang 37673, Korea
*
Author to whom correspondence should be addressed.
Sustainability 2018, 10(7), 2469; https://0-doi-org.brum.beds.ac.uk/10.3390/su10072469
Submission received: 9 April 2018 / Revised: 18 June 2018 / Accepted: 12 July 2018 / Published: 14 July 2018

Abstract

:
Engineering, Procurement, and Construction (EPC) contractors with lump-sum turnkey contracts have recently been suffering massive profit losses due to re-works and schedule delays in offshore oil and gas EPC megaprojects. The main objective of this research is to develop and implement a detail engineering completion rating index system (DECRIS) to assist EPC contractors to optimize fabrication and construction works schedules while minimizing potential re-work/re-order. This is achieved through adequate detail design development and results in minimizing schedule delays and potential liquidated damages (i.e., delay penalties). The developed DECRIS was based on findings from an extensive review of existing literature, industry-led studies, expert surveys, and expert workshops. The DECRIS model is an evolution, and improvement of existing tools such as the project definition raking index (PDRI) and front-end loading (FEL) developed specifically for the early stage of engineering maturity assessment (i.e., planning, basic design, and front-end engineering design (FEED)), prior to EPC projects. The DECRIS was evaluated and validated with thirteen sample as-built offshore megaprojects completed recently. When the DECRIS was applied to the completed projects post-hoc, a correlation (R-squared 0.71) was found between DECRIS scores and schedule/cost performances. This is much superior to the PDRI-Industrial model’s correlation (R-squared 0.04), which was primarily devised for owners’ basic engineering or FEED completion assessment. Finally, as a means of further validation, project schedule and cost performance of an ongoing project was predicted based on the correlations found on the thirteen completed projects. The resultant predicted schedule and cost performance was well matched with the current project performance status. Based on the accuracy of the DECRIS model found in the validation, said model is an effective prospective tool for EPC contractors to manage their engineering and procurement/construction risks during the initial detail design stages.

1. Introduction

Crude oil was historically supplied solely by onshore reservoirs until the 1970s, when these reservoirs were found to be insufficient to meet the growing global oil and gas demand. To supplement demand, deep-water offshore projects were initiated in the 1990s and they now account for about 10% of the total global oil supply [1]. In 2011, shale oil and gas were introduced to the oil and gas market with the development of cost-effective hydrofracturing technologies. This has led to an over-supply of oil and gas and, consequently, an era of low oil prices decreasing major oil companies’ profits [2].
An offshore project requires a significant amount of early investment for drilling and production facility design and construction. To combat lower revenues and increase profits, major oil companies have placed a great deal of attention on cost-saving strategies in these early stages for offshore oil and gas projects [3]. However, these strategies are often poorly planned and implemented, leading to inadequate resource allocation, and improperly accelerated design and construction. This all results in poor quality of work, schedule overrun, and even safety-related accidents on site [2].
Therefore, how can planning be improved? Merrow collected and analyzed project performance data on 100 megaprojects, finding that the success of upstream activities (i.e., planning and early design) is one of the important factors for project success. Without this planning, Merrow found over 65% of the projects studied (>65%) reported project failure in cost, schedule, and/or production [4]. Decisions made during the detail design stage have significant impact on the overall construction cost and schedule. Errors and omissions at this stage cause construction delays and often result in reconstruction, especially in lump-sum turnkey contracts, which are overwhelmingly adopted for Engineering, Procurement, and Construction (EPC) megaprojects. The resultant construction delay and reconstruction results in owners’ claims, namely liquidated damages and performance liquidated damages, which are major reasons for the EPC Contractor’s profit losses. In particular, incomplete and/or inaccurate designs for fabrication (i.e., steel cutting), one of the most critical contract milestones when initiating construction work stipulated on the contract, results in significant reconstruction and associated labor hours. Oil and gas EPC contractors need a customized engineering completion model to measure the completion rating in their engineering management decision-making process at the design stage to mitigate reconstruction and avoid costly consequences. As such, this paper focuses on aiding contractors in the initial design stages.
To compound the negative impacts of poor upfront project planning, many megaprojects are performed to a very tight schedule. A tight schedule usually forces the EPC contractor to concurrently design and construct the project, hoping to meet the owner’s deadline and avoid costly liquidated damages. However, this concurrent design and construction, unless well planned, may lead to a costlier option due to a catastrophic ripple effect when the final design is significantly different from the partially complete design when construction started.
Concerning the contractor-owner relationship on conventional oil and gas projects, the owner hires a contractor for construction only with fully approved for construction (AFC) engineering drawings after AFC completion. Alternatively, in EPC projects, the owner hires a contractor for engineering (final design), procurement of equipment, and construction. This type of contract means that the selected contractor is responsible for completing the remaining design and procurement activities based on the front-end engineering design (FEED) package developed by the project owner. Therefore, the contractor must consider all risks of detail design and procurement, including undetected discrepancies during the FEED verification period that may cause serious cost overrun and/or schedule delay.
Since the early 2000s, South Korean companies have been working as major EPC contractors for offshore oil and gas EPC projects, specifically upstream production facility projects. Three major shipbuilders in South Korea have executed over 50% of worldwide offshore oil and gas EPC mega projects: H company, S company and D company. Since 2008, they have completed about 30 mega projects including fixed platforms and floaters, typically so-called FPSO (Floating projection, storage and offloading) or FLNG (floating Liquefied Natural Gas). The offshore oil and gas EPC contractors have recently reported massive profit losses over US$ 10 bn as shown in Figure 1, between 2013 and 2015, after being awarded many EPC projects since 2010.
The reasons for recent profit losses and damages for Korean offshore EPC contractors in dealing with EPC megaprojects with lump-sum turnkey contracts are likely as follows (identified through subject matter expert interviews and literature review):
  • Lack of EPC Contractor’s capability of FEED verification to justify complex owner requirements;
  • Lack of experience in the use of exotic materials, and installation of special equipment;
  • Lack of experience in performing a fast-track process with a limited schedule;
  • Sub-order items including local content requirements in the host country that may impact on project schedule;
  • Mandatory requirements to procure equipment from approved vendor list (AVL);
  • Owner requirements of single-point responsibility for various contractual liabilities;
  • Delay liquidated damages (so-called penalties) following schedule delay on EPC contractor are unrealistically high (as much as US$ 1–2 million/day); and
  • Re-order for major equipment and critical bulk materials and reconstruction (re-work) due to early fabrication start with incomplete detail design to comply with the completion date and milestones [6].
Many, if not most, of these issues result from improper front-end project planning. To aid contractors in minimizing these issues, the focus of this study is to develop and implement a detail engineering completion rating index system to assist EPC contractors during the initial planning stages. The model aids contractors in determining the optimal starting time for fabrication and construction works to minimize potential re-work/re-order through adequate detail design development.

2. Literature Review

There has been minimal literature dedicated to incorporating an engineering completion rating index to the project schedule and cost performance for oil and gas EPC projects. The most significant existing index models found were the project definition rating index (PDRI) by the Construction International Institute (CII) [7,8,9,10] and the front-end loading (FEL) index by Independent Project Analysis (IPA) [4]. These tools are mainly developed and utilized to define the level of completion of FEED, which is an engineering task prior to EPC detail engineering. These two indexes are typically used by the project owner to quantify the level of project definition and basic engineering maturity and to determine whether the project can move to the next project development stage, typically an EPC contract. The model developed and presented within this paper evolved from these two indexes. As such, a detailed discussion on each model, and associated literature, is discussed below.
FEL measures the level of project definition at the front-end stage of a project, which is broken down into three stages. At the FEL-1 stage, the project definition is reviewed based on the conceptual design and business case evaluation results. In FEL-2, the result of basic design is reviewed. At the end of FEED (FEL-3), the entire FEED package is reviewed for the owner to make the final “Go” or “No-Go” decision, which will result in a significant financial investment and commitment by hiring an EPC contractor. The project definition is classified according to three sections: site factors, design status, and project execution plan. FEL is used to assess the project by numerically quantifying the project definition of each element under each section and then aggregating them into a numeric index. When the FEL index is lower than a pre-determined threshold value at each stage of FEL-1/2/3, over 50% of projects were successful in terms of cost and schedule performance. On the other hand, projects in the high range of the FEL index showed poor project performance [4].
CII’s PDRI is an alternate assessment tool to IPA’s FEL as it serves the same purpose of measuring project definition from the conceptual design stage to the FEED stage of a project. The PDRI’s hierarchical structure is comprised of three sections, categories, and elements [7,8,10]. Three sections include: (a) the basis of project decisions; (b) basis of design; and (c) execution approach to holistically evaluate the project value, scope, definition, and readiness for next stages. The PDRI has 8 to 15 types of categories for each section [7,8,9,10]. At the bottom of the PDRI hierarchy, each element specifies details that can be individually reviewed. Each element is assessed on a scale of 1 to 5 (1 being highly well defined and 5 being not defined at all) and an overall PDRI index is calculated using a scoresheet weighted and normalized for each element. Three to six PDRI reviews are recommended for the owner during the project planning, and FEED stages [11]. The most important PDRI review should be carried out prior to the EPC contract, which is the final investment decision (FID). The CII recommends that the cutoff score of the PDRI at the end of the FEED stage should be 200 as the performance of a project with a score higher than 200 was historically not satisfactory in terms of cost and schedule [10,12]. PDRI can help the owner manage project scope prior to a project authorization and/or the contractor identify incomplete elements related to project scope definition [13].
Multiple publications were dedicated to testing PDRI’s effectiveness. Chu et al. [14] studied PDRI for intelligent green building projects and adjusted weight factors for each element using an analytical network process, and they also expanded PDRI elements up to the project execution phase. In another study, with 51 surveys and statistical analysis, George et al. [15] found that seven major activities have more impact on achieving project success among all activities conducted during front-end planning. This finding is aligned with the fact that PDRI elements are assigned different weights depending upon the level of influence on project outcome. Pheng and Chuan [16] also identified using an analysis of variance (ANOVA) test the five most significant variables that affect work performance in the construction industry and recommended focusing on those significant variables to develop a better working environment. Since previous studies are limited to the front-end planning stage before an EPC contract is established, EPC contractors cannot directly apply the study results to the detail design process.
In the offshore oil and gas sector, FEL and PDRI are being used as an owner’s risk analysis tool [11]. However, these tools focus on the earliest planning phases, stopping once the EPC contractor is selected. This means the tools are lacking and cannot cover the range of detail design and construction phase activities. Additionally, the characteristics of offshore oil and gas projects significantly differ from those of the other construction sectors, making the current FEL and PDRI tools difficult to use as an EPC contractor’s risk management tools.

3. Research Objectives and Contributions

The main objective of this research is to develop a detail engineering completion rating index system (DECRIS) to calculate the engineering completion rating for offshore oil and gas EPC projects, validating efficacy using existing projects. The main objective of the DECRIS is to aid contractors in knowing when they have performed enough project development to begin fabrication. As schedules are often very tight, it is important for fabrication to start as soon as possible. Thus, this paper focuses on the optimal point of fabrication start—steel cutting—in which the design is developed just enough (not more) to minimize re-work during the construction stage.
The main goals for this research are as follows:
  • Research Goal 1—modeling of DECRIS by adjusting previous assessment tools such as PDRI can be developed to measure the optimal progress of detail engineering to initiate the fabrication of initial modules in the scheduling critical path.
  • Research Goal 2—the correlation between the developed DECRIS score and the construction cost and schedule performance.
The research scope of building the DECRIS framework is limited to fixed platforms and floaters such as FPSO and FLNG in offshore oil and gas EPC projects. Other types of offshore structures and subsea structures are excluded in this study.
From discussion with industry experts, and as defined within this paper, the existing tools (PDRI and FEL) are more than adequate in aiding owners through pre-planning of specific types. However, they generally stop at the stage of executing a contract with the contractor and are not tailored for contractor procurement/fabrication scheduling nor the oil and gas industries. As such, one of the main contributions of this research is to present a superior tool than before, focusing on FEED engineering completion prior to EPC projects. What is most lacking for oil and gas projects in using the PDRI and/or FEL methods is when to begin fabrication (discussed above). As such, the DECRIS’s added benefit to the industry is most significantly aiding the contractor in finding the optimal point of the fabrication start of the oil and gas EPC projects.
To provide support that the presented tool is better than existing tools, thirteen offshore EPC megaprojects recently completed are presented (in Section 6.1) for the verification of the DECRIS model. Analysis is performed on the tool’s ability to predict the real projects’ actual cost and schedule performance data. The DECRIS model can contribute to industry as a decision support tool during the EPC contract execution stage to assist EPC contractors in making informed and timely decisions on initiating their construction work activities.

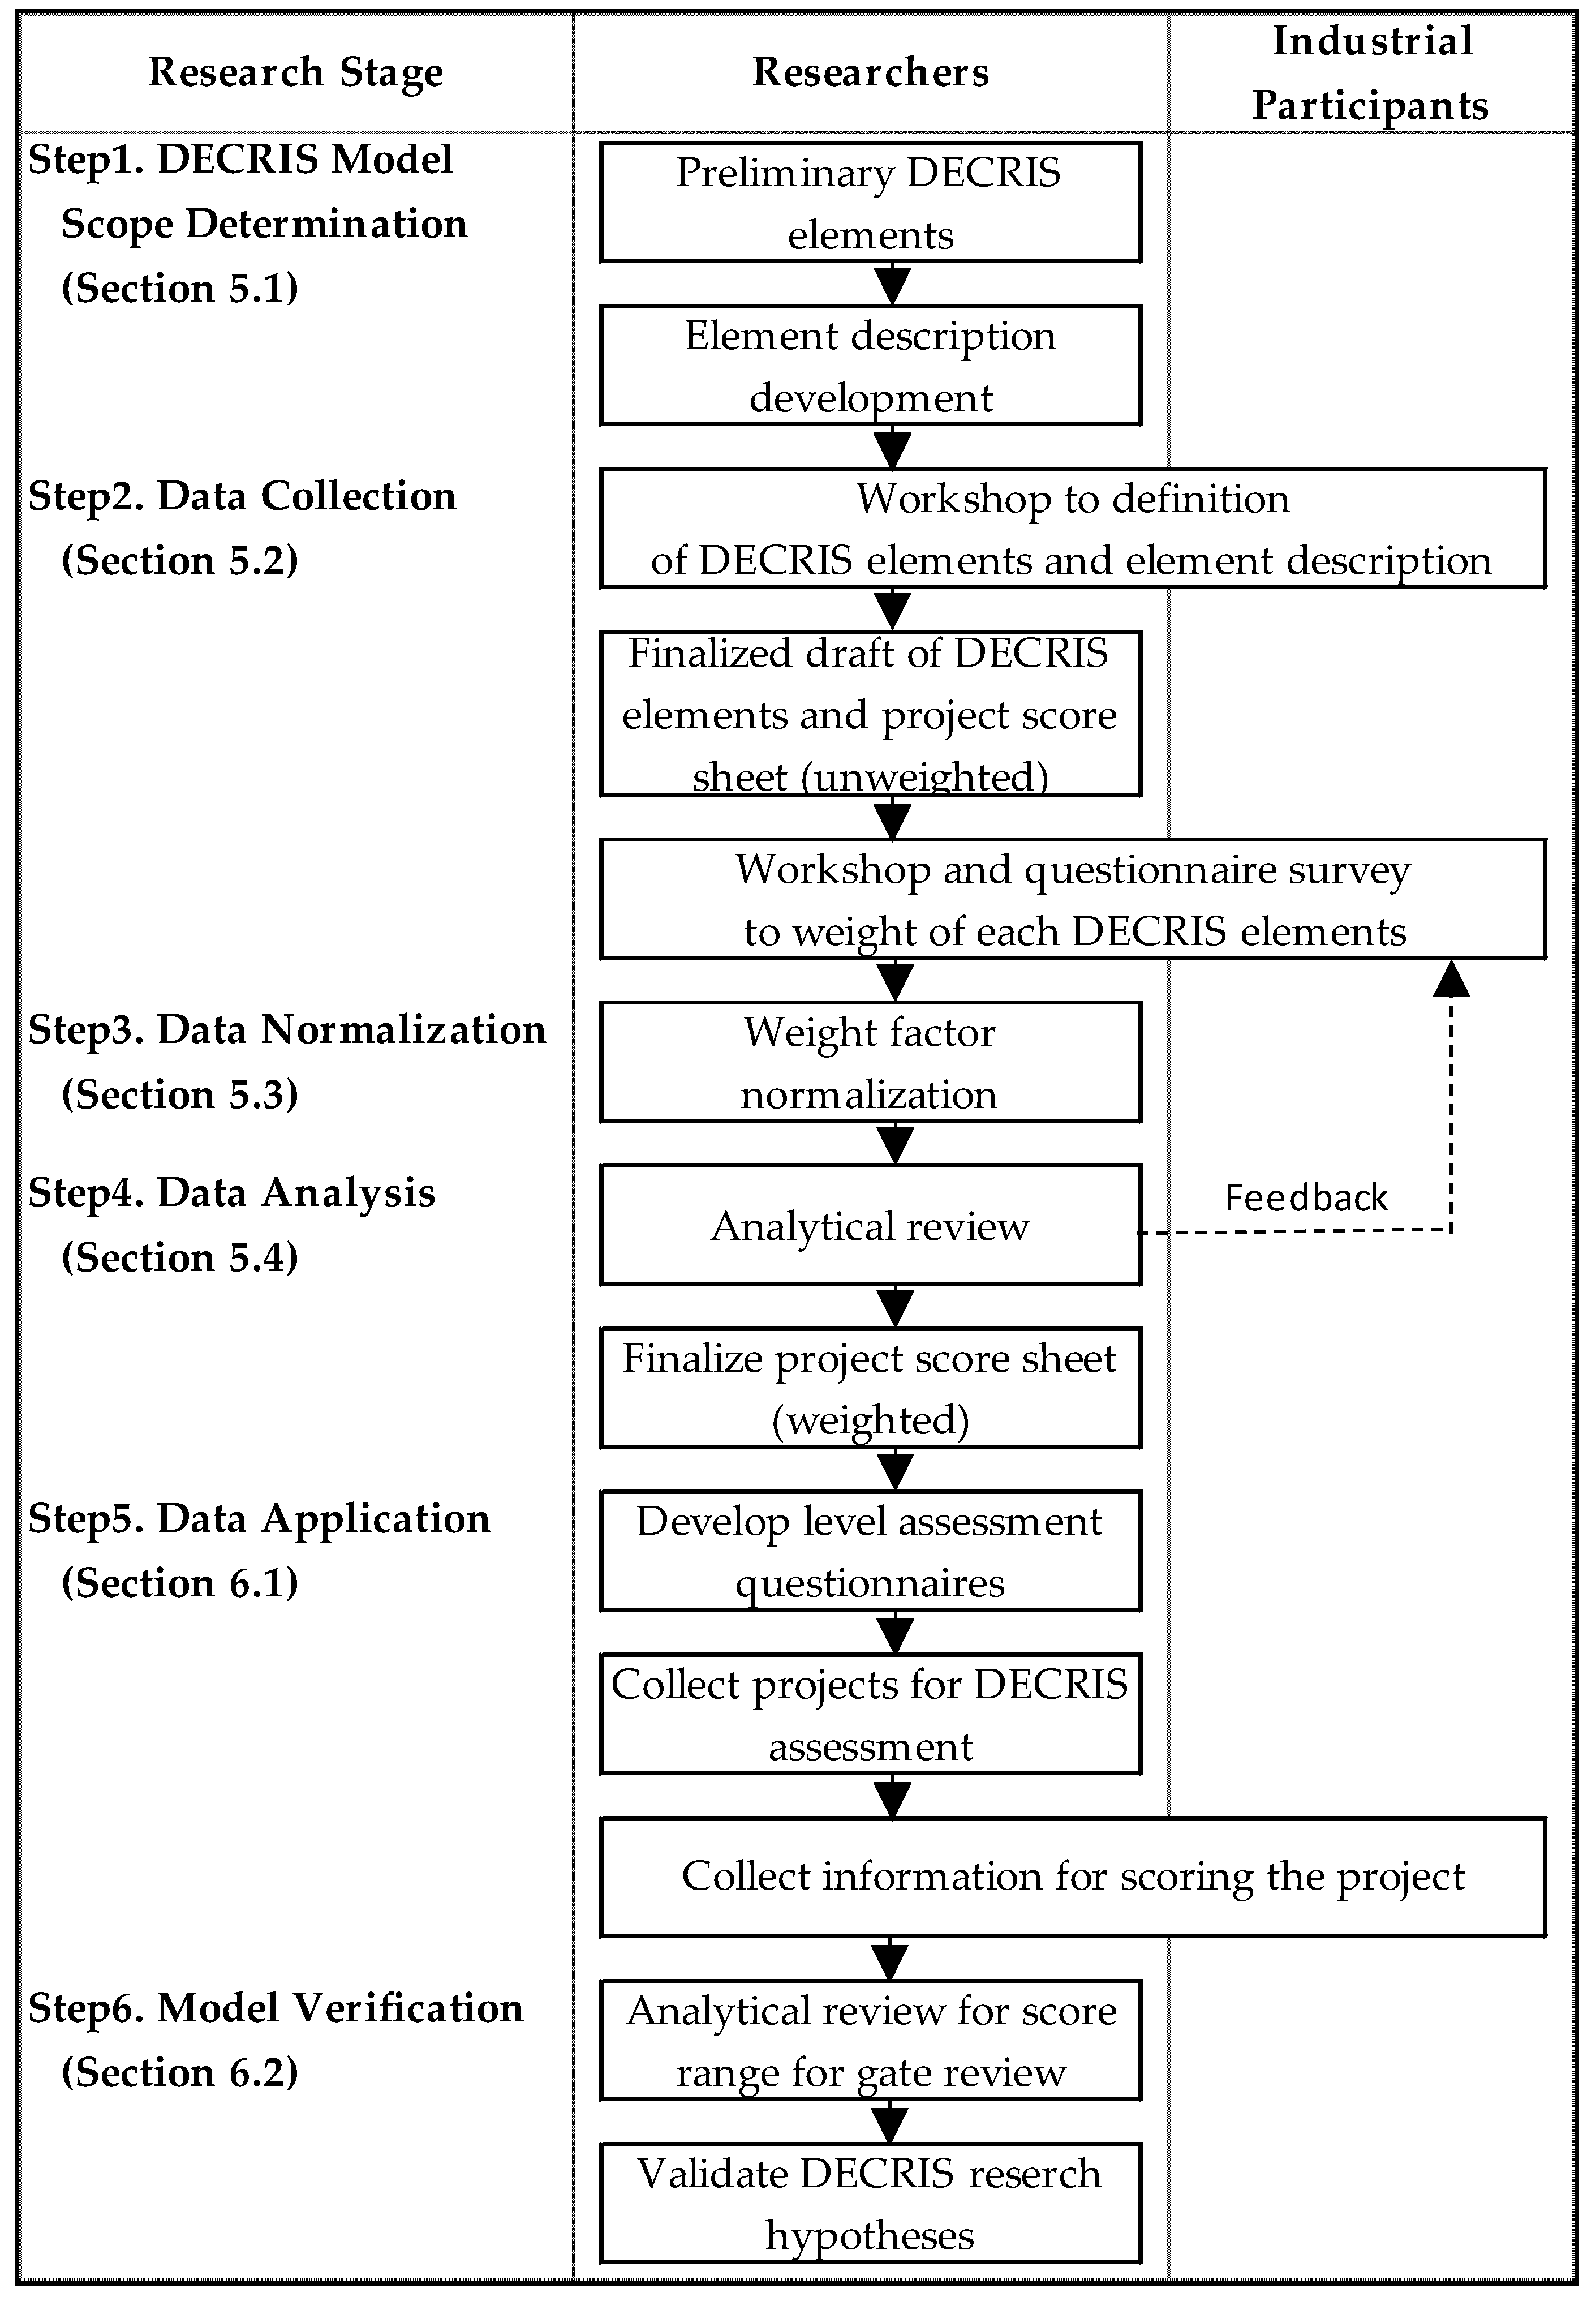
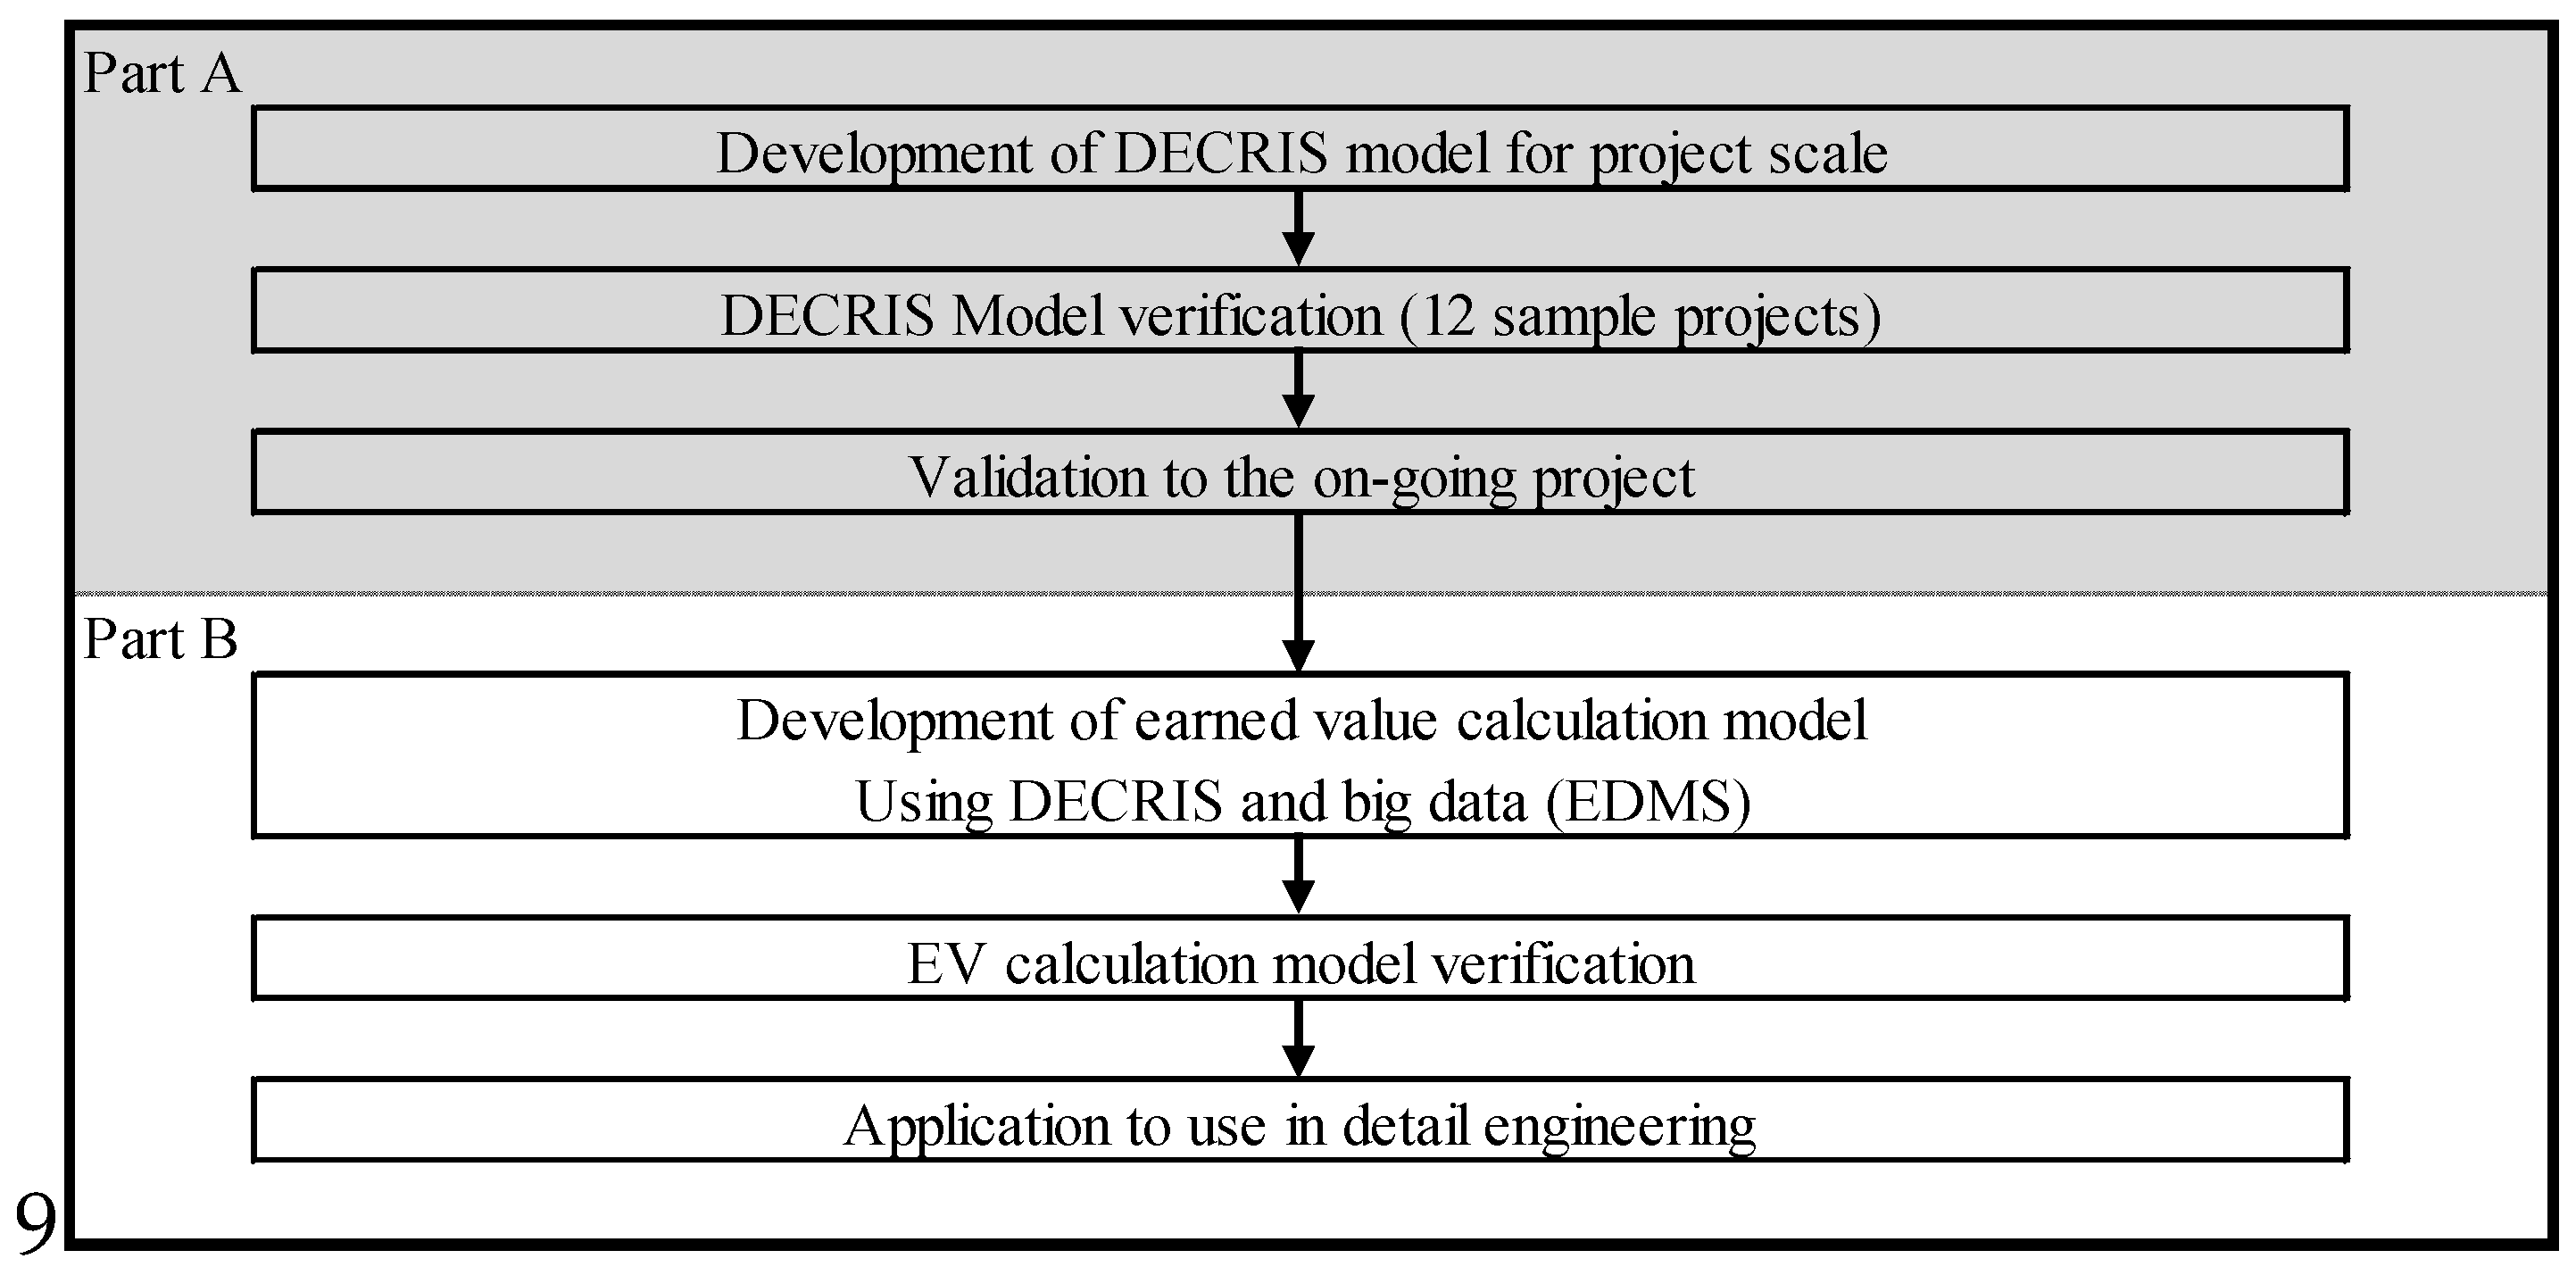
4. Research Methodology for the DECRIS Model

The DECRIS methodology follows the PDRI approaches in its development, which has been proven through existing literature to develop a simple assessment model to solve a complex project problem. The methodology used to develop the model of the DECRIS model is depicted in Figure 2.
It involves six steps:
(1)
DECRIS model scope determination: collect the preliminary elements from the existing literature and develop the element description
(2)
Data collection: a workshop was performed with industry experts to determine elements that affect the calculation of the detail engineering completion rating and to organize the identified elements in proper sections and categories. The expert survey was also used for data collection to calculate the relative importance of each element to engineering completion.
(3)
Data normalization: to determine the weight factor for each of the DECRIS elements using the data from the expert survey, data normalization, preliminary estimate, validation process, element average weight calculation, and interpolation were carried out.
(4)
Data analysis: one sample t-test is used to finalize the weight factor of each element. The weight factor of each element indicates the level of importance of the element’s contribution to the detail engineering completion rating index.
(5)
Data application: the DECRIS model developed through the previous research stages is verified by applying it to the 13 sample projects. Each project was assessed using the DECRIS level assessments.
(6)
Model verification: the score outputs were then compared with the project performances of each project (using statistical analyses) to see the level at which the model could predict project performance. A cutoff score was then developed based on the model and sample projects.

5. DECRIS Model Development

5.1. Step 1: DECRIS Model Scope Determination: Preliminary Elements

In this step, the authors collect preliminary elements (so-called draft of DECRIS elements) from existing literature. This acts as a starting point to define, roughly, the elements which affect detail engineering completion. The preliminary element list is the full set of the possible element items, discovered through a literature review, to determine the assessment scope of DECRIS. This is also used for step two when discussing and refining said exhaustive list of elements to be used in the final model.
The most important elements of pre-planning have been identified through existing PDRI and FEL literature and models. As such, the preliminary elements for the DECRIS model were taken from the PDRI-Industrial, PDRI-small industrial, PDRI-infrastructure, and front-end loading phase 2 and 3 models. To ensure the model fit EPC oil and gas projects, the authors also consulted the contractor’s information flow network for an oil and gas EPC project, and the oil and gas engineering guide. Through the content analysis, a data set of 98 preliminary DECRIS elements was initially developed. A part of preliminary element set which is related to engineering deliverables (18 elements shown in Figure 3 among the overall 98 elements collected from contents analysis) is shown in Figure 3.

5.2. Step 2: DECRIS Element Finalization

For the second step, a workshop and survey were performed. The focus group workshop was performed with nine industry experts with over 10 years of experience in detail engineering of offshore oil and gas projects. The goal of this workshop was to determine elements that affect the calculation of the detail engineering completion rating and to organize the identified elements in its proper section and category. Random sampling might be more efficient to increase the representativeness of the population [17]. However, because of the limit on the availability of knowledgeable experts (SME: subject matter expert) in the local industry from a practical point of view, judgmental and snowball sampling were used with various discipline experts invited in this research.
The 98 preliminary elements were reduced to 69 DECRIS key elements through brainstorming session in the focus group and individual interviews, and the sections and categories were structured as shown in Table 1. The number of elements and categories in each section are shown in Table 2. The overall hierarchy and its structure was benchmarked from the PDRI framework. However, each element for DECRIS was identified, defined, and customized for detail engineering for offshore oil and gas projects.
The first section, the basis of detail design, consists of three categories (project scope, project performance requirements, and design guidelines) and 12 elements that assist in understanding the project’s objectives. Completion rating of this section specifies how the project is sufficiently organized in line with the project objectives.
The second section, engineering deliverables, includes 46 elements that provide technical information to understand and assess the technical requirements for the detail design of a project. The elements included in this section are generally finalized in sequential submissions and revision control for engineering documents in the process of approval from the owners during the detail design stage including (a) the preliminary issue, (b) issue for approval (IFA), (c) approved for design (AFD) and (d) AFC. The terms can vary according to the specific project requirements or type of engineering deliverable. The seven categories in this section consist of process/mechanical/piping, equipment vendor, structural/architectural, instrument/electrical, material take-off, 3D modeling, and general facility requirement.
The third section, execution approach, consists of two categories and 11 elements that define the approach method for the contractor’s strategies and execution from engineering to construction. Categories of this section consist of engineering project management and project execution plan.
Each element selected through the expert group workshop is assigned a different weight to measure the detail engineering completion rating. To verify the importance of an element, a weight factor for each element was recalibrated through an expert survey and an additional statistical analysis. Prior to the expert survey, an unweighted project scoresheet and descriptions of the elements were provided to increase the survey participants’ understanding of each element.
The DECRIS element description Box 1. “E1. Equipment Procurement Status” is shown below as an example.
Box 1. E1. Equipment Procurement Status.
E1. Equipment Procurement Status
The equipment procurement status refers to all of the Vendor’s processes from material requisition to equipment (mechanical, electrical, etc.) delivery in line with the Required on Site (ROS). In a project, the overall processes for equipment procurement status should be managed without delay during the detail design and construction stages. The following items need to be considered.
❏ Material Requisition
❏ Bid Closing
❏ Technical Bid Evaluation/Tabulation
❏ Updated Material Requisition
❏ Purchase Order
❏ Vendor documentation
❏ Fabrication Work Commence
❏ Factory Acceptance Test
❏ Equipment Delivery along with ROS
The expert survey was also used for data collection to weigh each element. Thomson [18] studied the optimum sample size for surveys or interviews and concluded it to be 25, from a review of over 100 studies using grounded theory. In this research, 32 survey participants were assigned for data collection to weigh each element. To collect a meaningful sampling group with over cumulative 400 years of experience in offshore oil and gas EPC projects, judgmental sampling and snowball sampling methods were used. Once again, random sampling might be more efficient to increase the representativeness of the population [17]. However, because of the limit on the availability of knowledgeable experts in the local industry from a practical point of view, judgmental and snowball sampling were used with various discipline experts invited in this research. On average, each expert participant has over 13 years of experience in detail design engineering or project management for offshore oil and gas EPC projects or over 10 years of experience in project management consultancy. Most of the survey participants were selected from two major EPC contractors (H company and S company in South Korea). To increase survey reliability, the expert survey was carried out using only face-to-face interviews. The information on the experience of the survey participants is shown in Table 3.

5.3. Step 3: Data Normalization

To determine the weight factor for each of the DECRIS elements using the data from the expert survey, data normalization, preliminary estimate, validation process, element average weight calculation, and interpolation were carried out. Excel software was used for data input and weight calculation and Statistical Analysis Software (SASTM) was utilized for statistical analysis of the data set. Upon collecting the data set from the expert survey, data normalization was carried out to normalize each survey participant’s input data.
The maximum DECRIS score is defined as 1000 as equivalent to PDRI maximum index score, when all elements in the DECRIS scoresheet were marked as Level 5 (as with the PDRI, DECRIS has five definition levels for each element with Level 1 being complete and Level 5 being incomplete). The scoresheet summation for 69 elements by 32 participants ranged from 262 to 620. Each participant’s scoresheet was given a normalizing multiplier, calculated as the maximum DECRIS score of 1000 divided by the sum of the answered scores for 69 elements (i.e., if a participant’s summation of 69 elements equated to 250, the scoresheet would receive a normalizing multiplier of four). The weight factor of each element was pre-estimated as an average value of the normalized weights of the 32 participants. The value was preliminary because the validation process had not yet been performed.

5.4. Step 4: Data Analysis

When sampling data do not comply with normal distribution, the inaccuracies of the result of regression analysis or independent sampling t-test increase. To enhance the similarity between the sampling data set and the normal distribution, a data validation process was carried out with a boxplot.
Using a data set of normalized element weight factors, the smallest data point, 25th percentile, median, 75th percentile, and largest data point were calculated and specified on a boxplot. Appendix A (Figure A1, Figure A2 and Figure A3) illustrates the boxplots which indicates the distribution of participant response for the weight factor of each element including outliers for all 69 DECRIS elements. To secure reliability of the data set and similarity with normal distribution, number of extremes and outliers were collected from each participant, and the contribution score was calculated using Equation (1). The survey results with a high contribution score were eliminated [8].
Contribution score = 3 × (number of extremes) + 1 × (number of outlier)
Kline [19] suggested that, for a sampling data set which has an absolute value of skewness less than 3 and an absolute value of kurtosis less than 10, its population can be assumed to be distributed as normal distribution. To minimize the quantity of eliminated survey results while maintaining the normal distribution assumption, skewness and kurtosis calculation using SASTM was repeatedly conducted. Consequently, survey results with a contribution score of over 80 were removed. The remaining survey data set has a skewness value of 2.02 and kurtosis value of 7.34 as the maximum value among 69 elements; the statistical result thus shows that the population of all 69 elements can be assumed as having a normal distribution. Through one sample t-test, individual elements were shown to be in favor of alternative hypothesis (|t| < 0.0001) and were statistically verified as elements that affect the detail engineering rating.
The basic relationship for each element was reviewed in the focus group workshop. The purpose of one sample t-test for individual elements is to verify whether the weight factor as a survey result can be considered as zero or not. If the previous workshop was well conducted, then expert participants may give the weight factor higher than zero. Unless most experts judged that each element did not affect the detail engineering completion, one sample t-test with zero basis for that element can be passed.
In this research, the measurement range of DECRIS was defined as a minimum of 70 to a maximum of 1000. This means that the DECRIS score is 70 when the level of all elements is Level 1 (i.e., all detail engineering deliverables are completed thoroughly without further need for action), and 1000 when all elements are Level 5 (i.e., detail engineering is in the pre-matured status far from full completion yet). Simply speaking, similar to PDRI assessment trend, a lower DECRIS score means lower engineering deficiency and therefore less re-work and re-order at the fabrication starting session. The calculated weight factor for each element was at a Level 5 weight, while the Level 1 weight was calculated using another normalizing multiplier based on the minimum DECRIS score of 70. The weights of Levels 2, 3, and 4 for each element was also calculated using a linear interpolation formula. Through the aforementioned calculation, the weight of each element and its levels was assigned into the unweighted DECRIS scoresheet, which results in the development of the weighted DECRIS scoresheet (refer to Appendix B). A part of the weighted DECRIS scoresheet is shown in Figure 4.
The weight factor of each element indicates the level of importance of the element’s contribution to the detail engineering completion rating index. Then the relative importance of each section, category, and element is determined. Figure 5 shows the calculated relative importance of each section and category. The weight factor of section II, engineering deliverables, the most important section for the DECRIS of offshore oil and gas EPC projects, is 67.3% of the total weight. Figure 5 also specifies that the weight factor of the process/mechanical/piping category is the highest as 246 points; it is, therefore, the most important category in the DECRIS framework. To increase the detail engineering completion rating, it implies that the engineering manager and project manager need to focus on this category.
A DECRIS level assessment questionnaire was developed to inform assessment participants of a descriptive definition of each level. The main purpose of the level assignment questionnaire is to provide the assessment criteria for the definition level of each DECRIS element. The sample questionnaire included in Appendix C covers Section II—Category D. An individual questionnaire was prepared based on each element’s completion rating required to be achieved in each milestone. When a project is assessed, any element given Level 0 was considered not applicable. This means that the element will not be considered for measuring the engineering completion rating. The DECRIS level assessment questionnaires provide the information required to understand and assess technical requirements for the detail engineering stage. For example, in the case of elements in section II, engineering deliverables, the element level is assessed as the stage of repeated submissions of the documents during detail engineering.

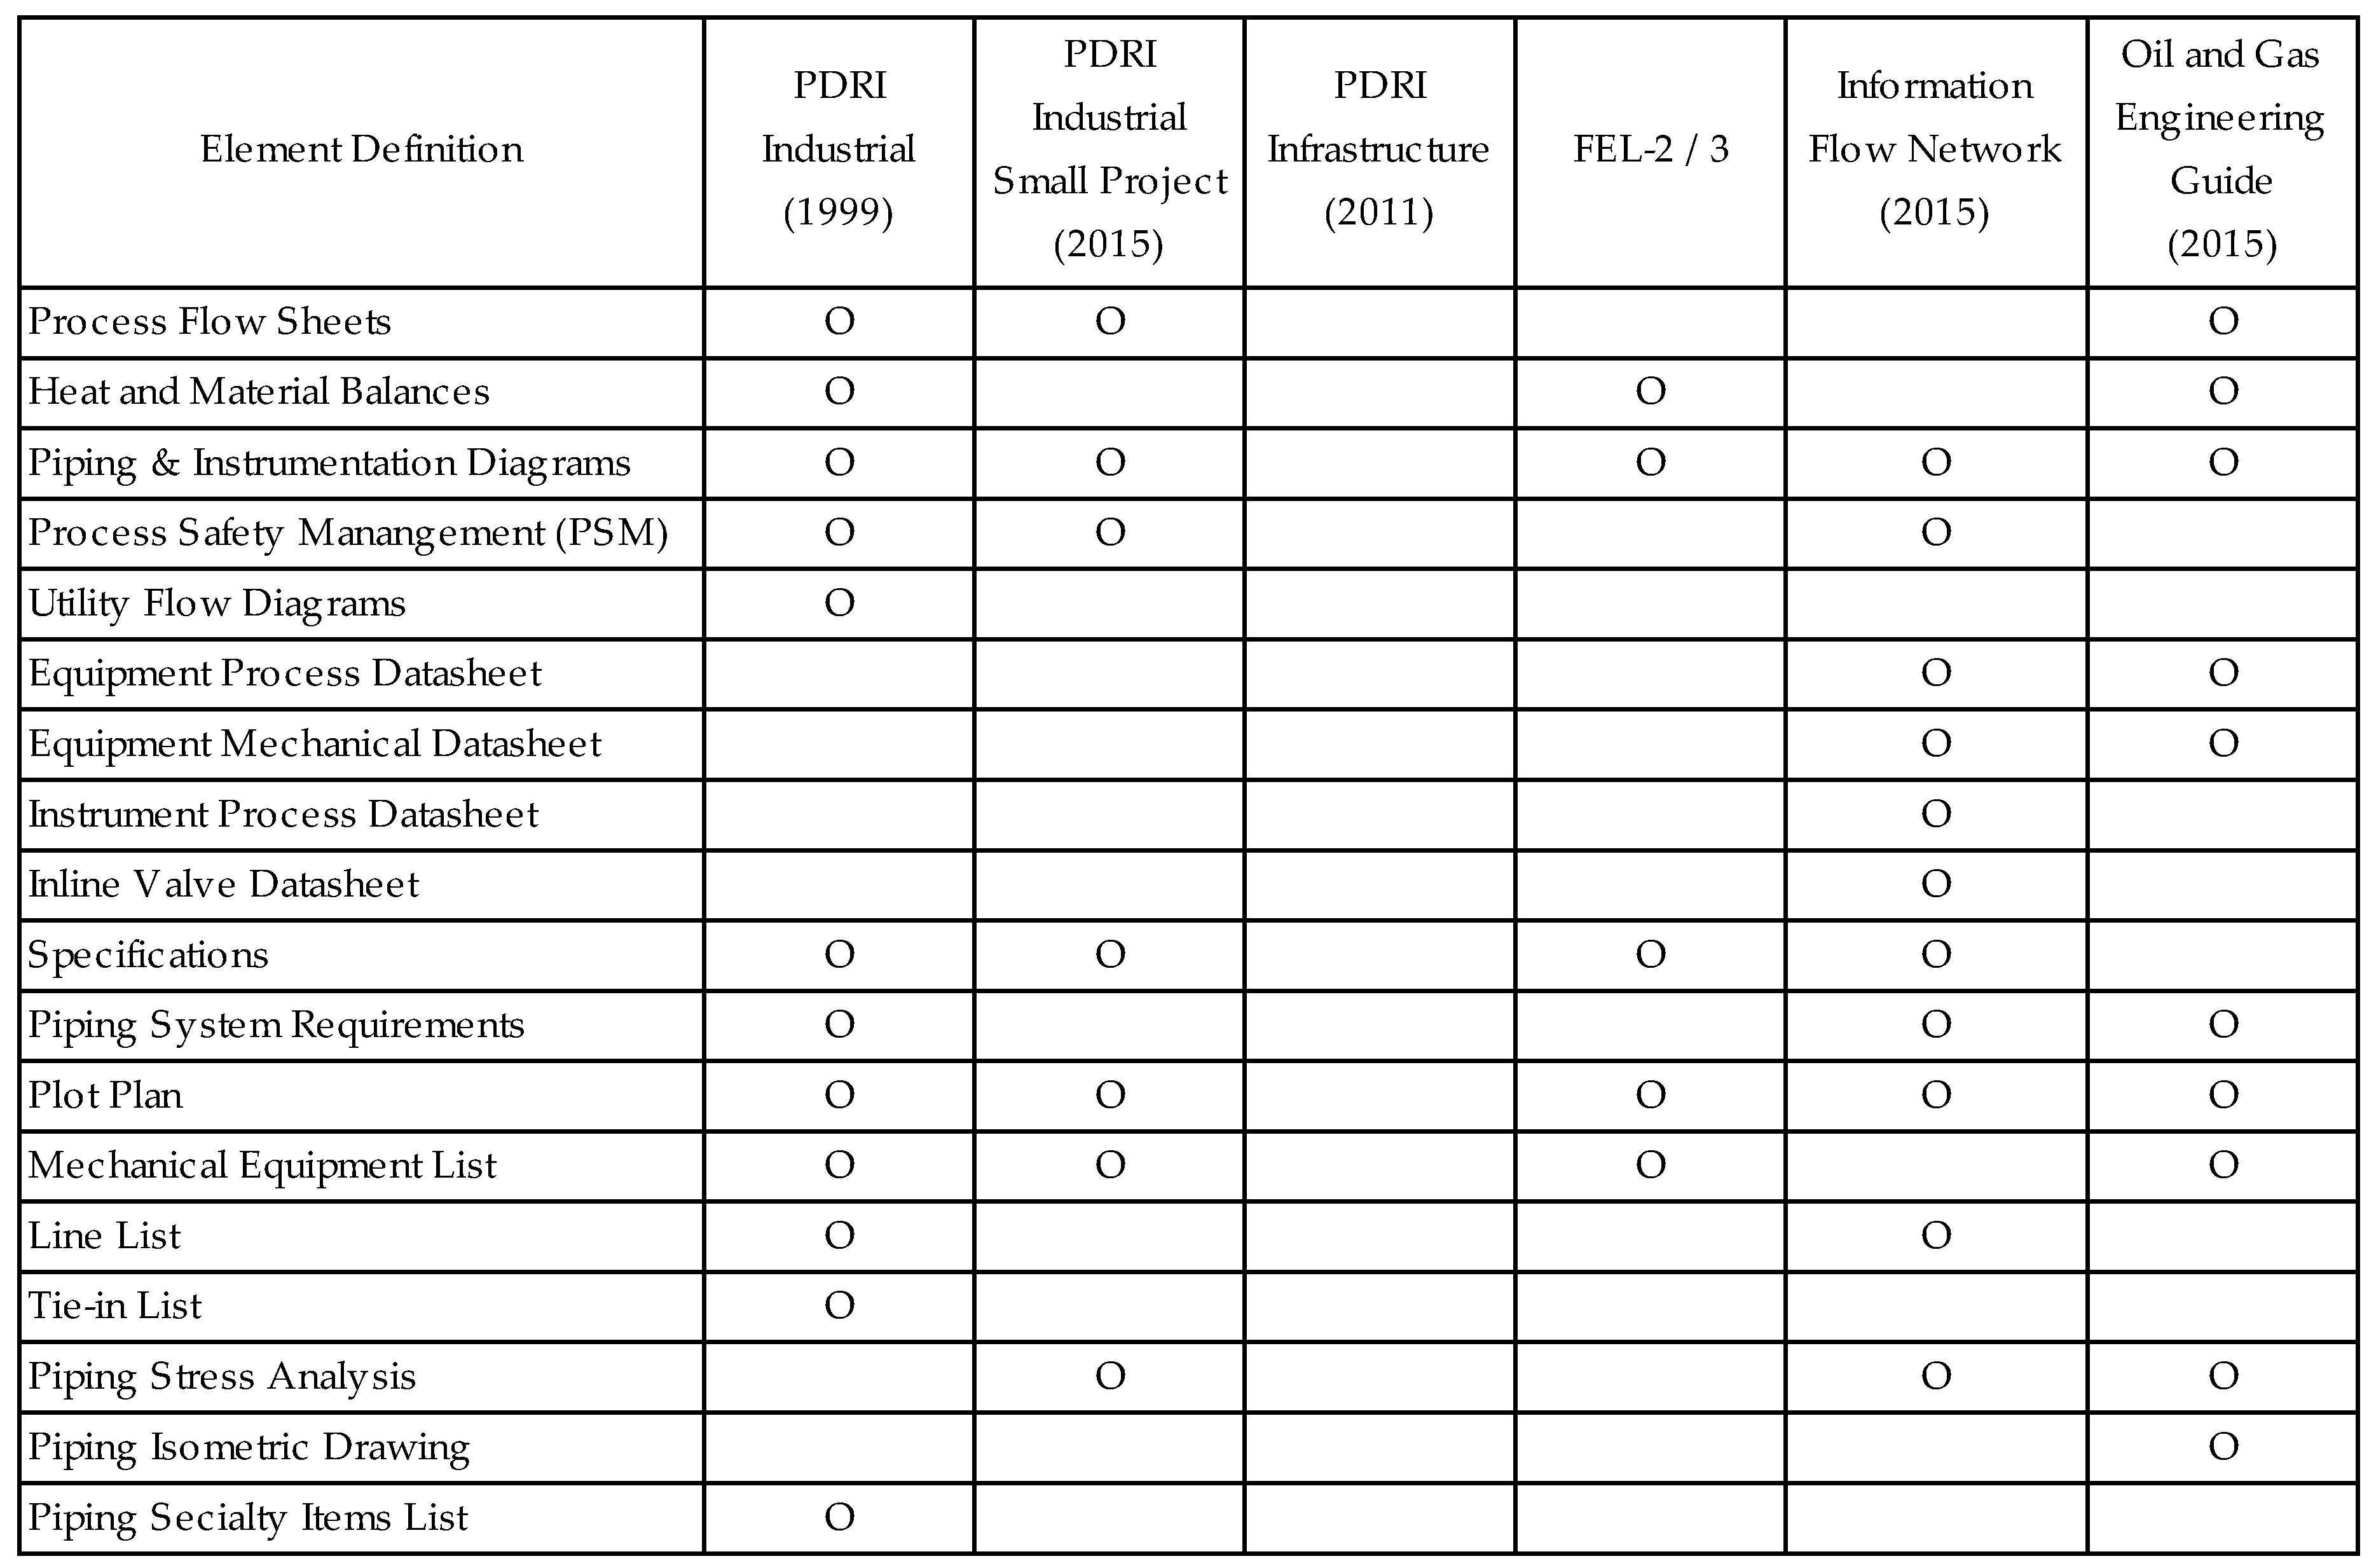
5.5. Comparison of DECRIS vs. Previous Engineering Assessment Tools Layout and Use

As with any research endeavor, it is required that said research be an advancement of the general body of knowledge. Although the PDRI and FEL are valid assessment tools, the PDRI was used by the authors of this paper more heavily in DECRIS development. As such, it is important to illustrate the differences between these models for reader understanding and as a basis of support for the DECRIS value-adding potential. Table 4 provides an illustration of the differences between the DECRIS, PDRI-Industrial, and PDRI-Infrastructure elements. The main distinctions between the DECRIS model and the previous assessment models is summarized as below.
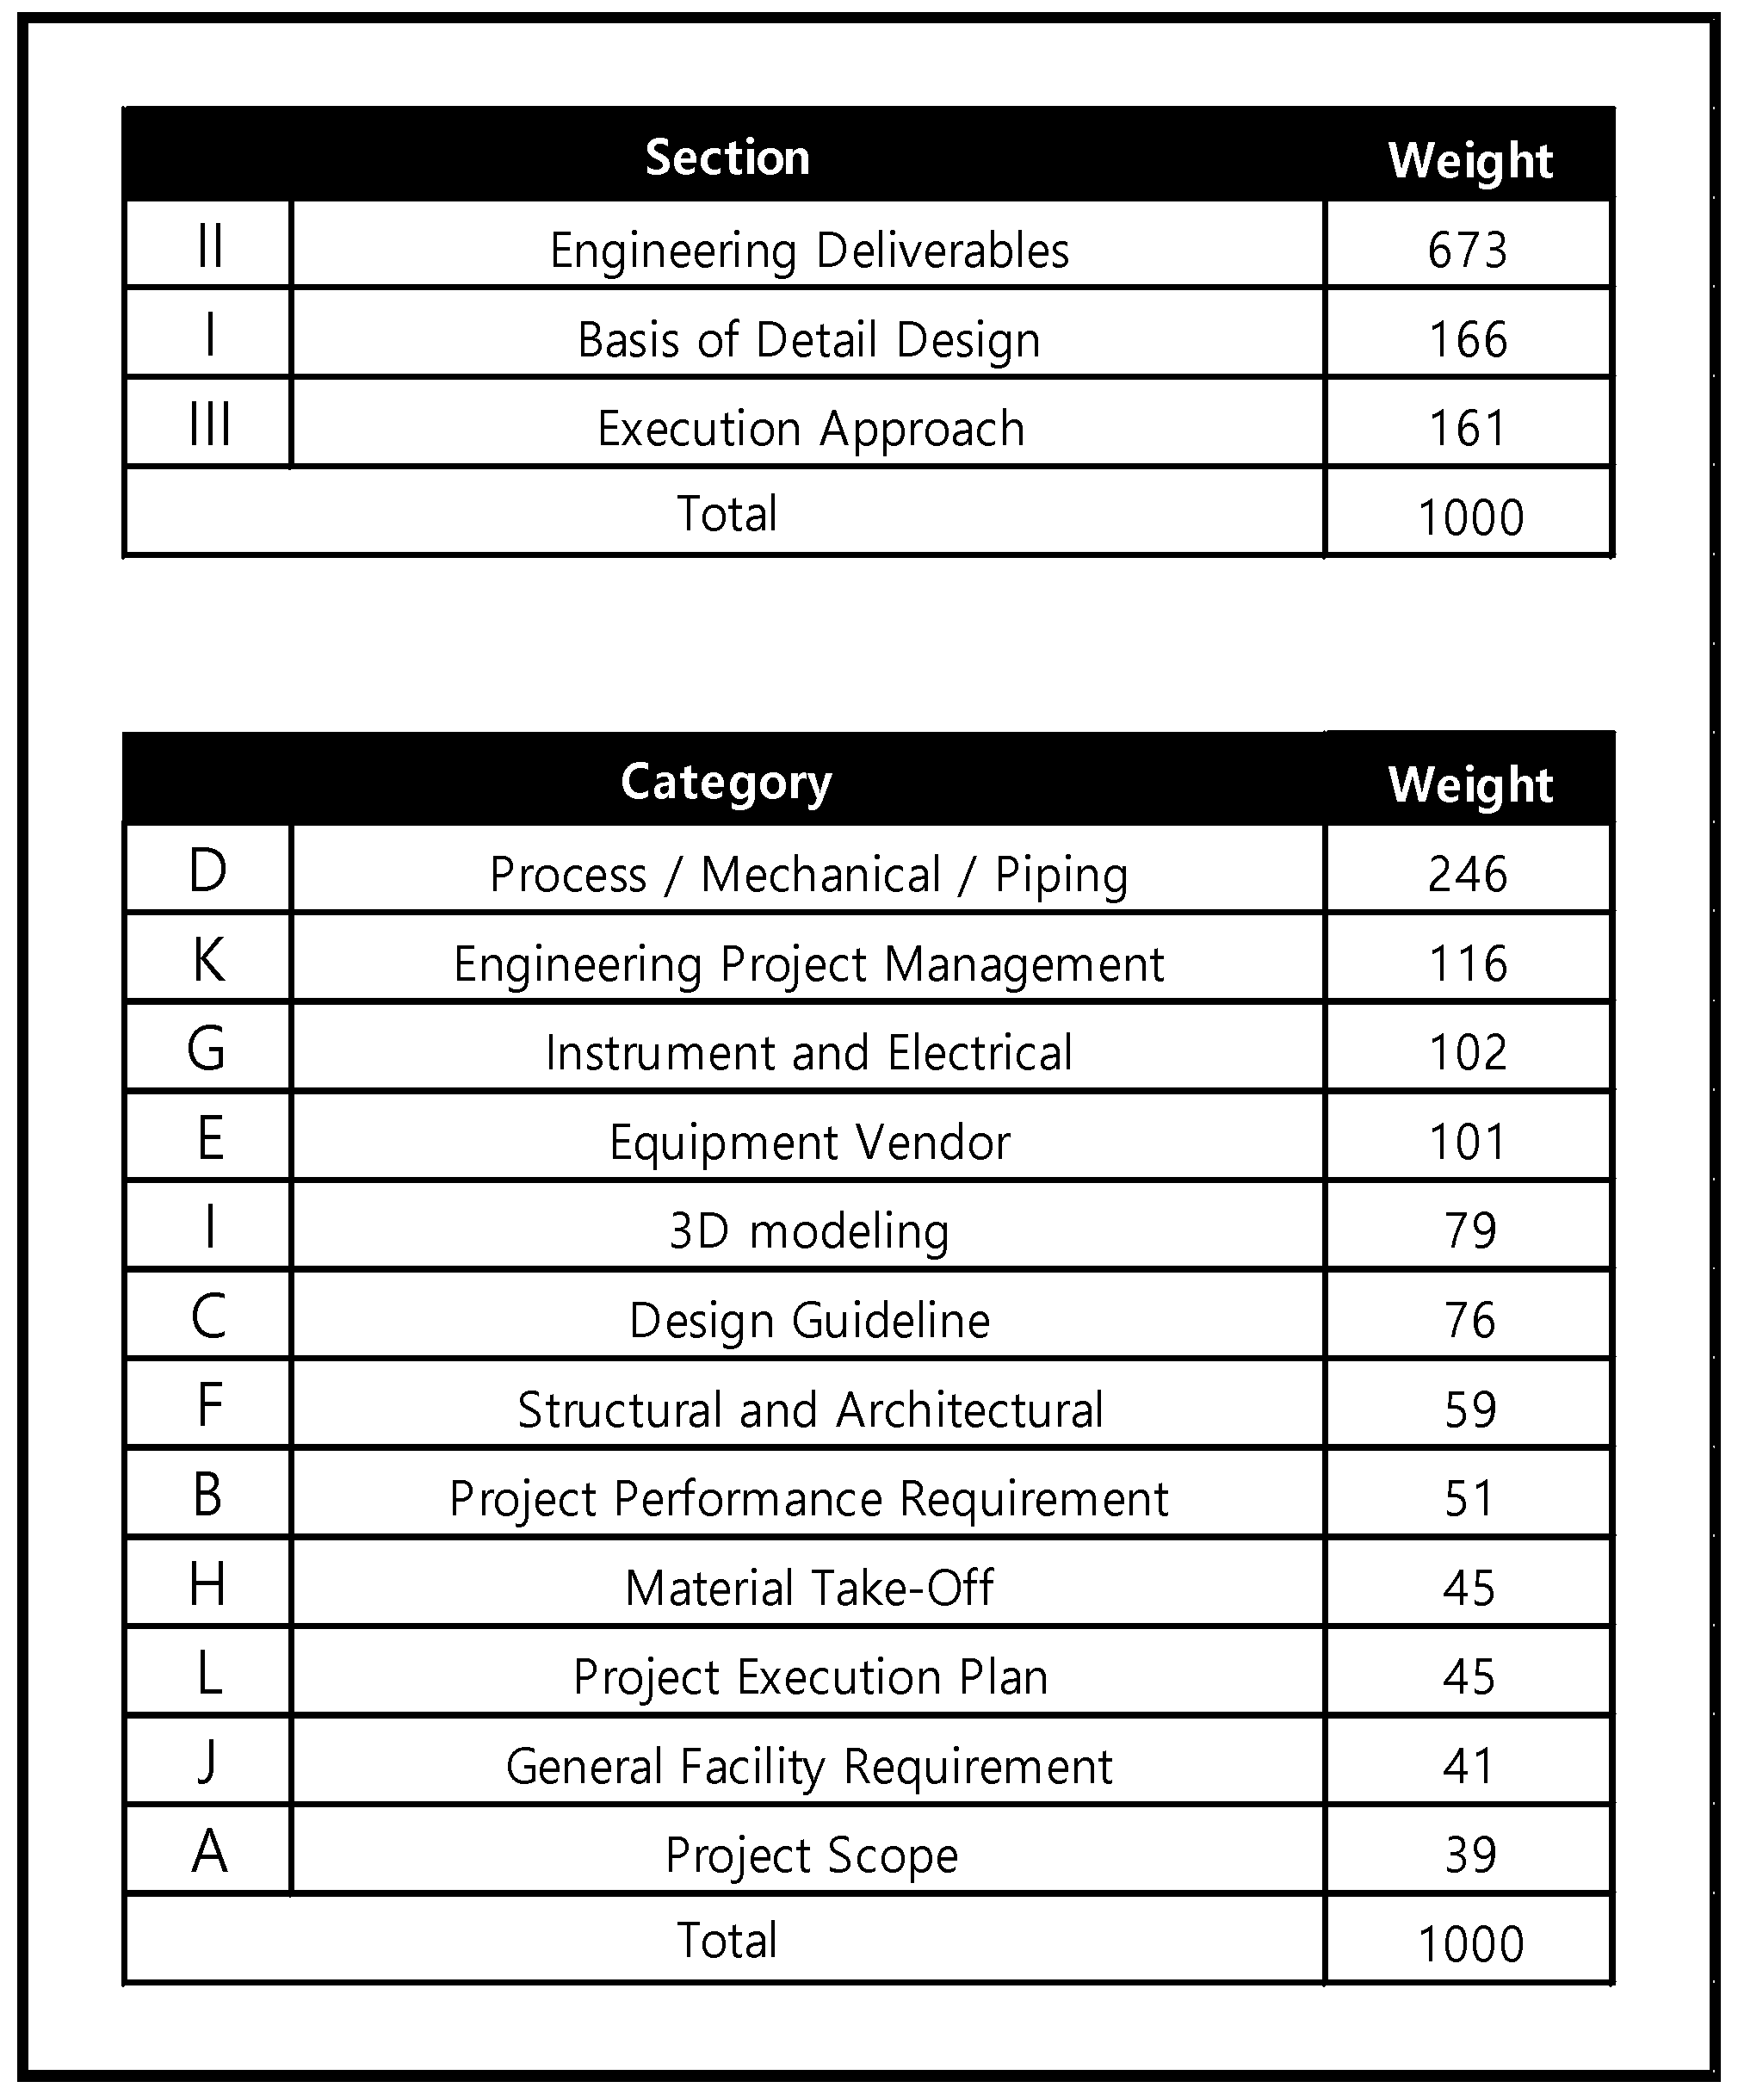
  • The sections, based on project decision and front-end definition, are thus major components of PDRI-Industrial (given a 922 score) [7] and PDRI-Infrastructure (given a 730 score) [8]. PDRI focuses on front-end planning and does not represent work packages in the detail engineering stage. The hierarchy overview of the PDRI-Industrial model is briefly outlined in Appendix D for reference purposes. As described in the introduction, the major target of DECRIS is the detail design conducted by the EPC contractor; it is thus reasonable that the engineering deliverables of detail engineering is the most important section.
  • From the project size point of view, PDRI-Industrial is for midsize industrial projects whereas the DECRIS is for oil and gas EPC megaprojects over US$ 500 m.
  • The Scope of detail engineering in PDRI-Infrastructure is basically the owner’s responsibility (whereas in case of EPC, it belongs to the EPC contractor, therefore the completion of the impact of detail engineering completion to the schedule and cost performance is less severe than the EPC case).
The next step in proving that DECRIS adds value to industry and academia alike is to show its superiority in predicting project performance. This is discussed in Section 6 below. This includes, in Section 6.3, an application of both the DECRIS model (developed to assess the correlation between a contractor’s detail engineering completion and the project cost/schedule performance at the at the fabrication start session) and the PDRI-Industrial model (primarily devised to assess the correlation between an owner’s FEED completion and the project cost/schedule performance) on the same sample offshore EPC projects. A discussion is presented on each model’s cost performance prediction accuracy on the ongoing verification project as well.

6. Applications and Verifications

6.1. Step 5: Data Application through Sample Projects

The DECRIS model developed through previous research stages was then verified by applying it to the 13 existing sample projects from H company. Each project was assessed using the DECRIS level assessments at the moment of fabrication start of each project (steel cutting date). The score outputs were then compared with the project performances of each project (using statistical analyses) to see the level at which the model could predict project performance. A cutoff score was then developed based on the model and sample projects. This score was the minimum score for the project to achieve to avoid project failure. Finally, using the DECRIS model and statistical analysis, the labor hours and construction duration were predicted for one of H company’s ongoing oil and gas EPC projects and compared to the actual results.
Sample projects for the verification of DECRIS model were assigned from oil and gas EPC projects with EPC contract price of over US$ 0.5 bn and below US$ 2.0 bn, which were completed over the last 6 years as representatives of oil and gas offshore EPC projects in Korean heavy industry. The total project value of the 13 sample projects is about US$ 12.7 bn and the average project duration was about 42 months. To verify the project status of the steel cutting session, data at the steel cutting and hand-over milestone were collected, and the sample projects were classified as fixed or floater.
Following the same methodology as the previous assessment tools such as PDRI and FEL, the retrospective project performance data of the 13 sample projects were assessed for DECRIS model verification. The historical project data review and DECRIS assessment at the fabrication start session were retrospectively conducted in accordance with history of the H company’s engineering document management system (EDMS), which can provide the traceability of the engineering deliverables and their revision controls, for the 13 sample projects. For section III, execution approach, which cannot be assessed through the EDMS review, the project management team assigned to the specific project assisted through face-to-face interviews. The individual DECRIS scores at the session of the steel cutting for the 13 sample projects are shown in Table 5 (a 14th project ‘X’ is also shown and will be used in Step 6). The DECRIS score range at the production starting stage was 246~446 and the average was 319. The average DECRIS score of 319 is about 6% higher than cutoff score 300, which is to be described at the later section on this paper. The result means that maturity of detail engineering on the construction starting session (steel cutting) is lower than the optimal point so that low schedule performance and cost overrun is expected.
As shown in Table 6, the construction labor hours increase rate which is the primary cause of cost overrun and construction duration delay of the sample projects were collected to validate the research goals, to apply the DECRIS model for the offshore oil and gas EPC projects. The verification with the sample projects is to assess the influence of the DECRIS score on the construction in the offshore oil and gas EPC project.
The following Equations (2) and (3) were used to calculate the construction labor hours increase rate (cost overrun) and construction duration delay.
CLIR = (Construction labor hours increase)/(Budgeted construction labor hours)
CDD = (Actual construction duration) − (Planned construction duration)
The calculated construction labor hours increase includes all design changes caused by a low detail engineering completion rating and detail engineer’s error and omission. Construction duration delay includes not only the design changes due to low detail engineering completion, but also other minor factors such as the owner’s change order, procurement impact and construction problems during fabrication. Considering industry practices and expert judgments, most of the cost overrun and schedule delay is caused by premature detail engineering and design change during construction phase. It should be noted here that a considerable number of factors have an impact on construction, performance, and the DECRIS model cannot explain all these factors.
In the case of conventional PDRI, the PDRI cutoff score was determined as 200 [7]. The DECRIS is not used for project definition of the FEED package but is used for demonstrating the detail engineering completion rating; it is thus considered in this study that the existing PDRI cutoff score cannot be used for DECRIS without further verification. To determine the DECRIS cutoff score, the independent t-test was repeatedly conducted with a 0.05 level of significance to review the statistical difference of average value between the two groups (high and low DECRIS score groups) of projects divided by the DECRIS scores of 280, 300, and 320. The statistical difference was found in the t-test to have a 95% level of confidence between the two groups of projects divided by 300. As shown in Table 7, the sample projects were grouped as high- and low-score groups based on the DECRIS score of 300.
If a project’s DECRIS score at the steel cutting session is higher than 300, the project was then included in the high-score group, otherwise it was included in the low-score group. The DECRIS score range of the six projects included in the high-score group was 304–446 and their construction labor hours increase rate (cost overrun) was from 3.4% to 17.1% with an average of 7.7%. For the low-score group, the DECRIS score range was from 258 to 299, with an increase rate of from 0.8% to 3.2% of construction labor hours, with an average increase rate of 2.2%. Through an independent sample t-test, the test statistic of project F was 33.60 and the significant probability for population variance and average difference was 0.0015 and 0.0475. An alternative hypothesis for both population variance and average difference were concluded with a 95% level of significance.
To verify that the DECRIS cutoff score is also applicable for project schedule performance, another independent sample t-test was performed. As shown in Table 7, the DECRIS score range of six projects included in the high-score group was 304–446 and their construction duration delay ranged from 102 to 411 days with an average of 255 days (significant delay). The low-score group shows a DECRIS score range of from 258 to 299 with -6 to 105 days of construction duration delay and an average of 47 days. The test statistic F-value was 4.45 and the significant probability for population variance and average difference was 0.127 and 0.0012, respectively. The null hypothesis for population variance and alternative hypothesis for average difference were thus concluded with a 95% level of significance. The results of two statistical reviews using project cost and schedule performance showed that the DECRIS cutoff score for the steel cutting session for offshore oil and gas EPC projects was 300.
From a theoretical point of view, this DECRIS cutoff score (300) is the most optimal fabrication starting session with some adjustment according to the project completion schedule requirement and resource availability of both engineering and construction.
Finally, the authors tested the DECRIS score’s ability to predict a project’s performance successfully. To test this, a regression analysis was conducted to determine the correlation between the DECRIS score and the construction labor hours increase rate with the sample projects. A scatter plot with the DECRIS score (X-axis) and project performance (Y-axis) was generated and simple linear regression was performed as shown in Figure 6. R-squared value was 0.7054; the regression function thus clearly represents the correlation of the population. Following the same method, regression analysis was conducted to realize the correlation between the DECRIS score and the construction duration delay applied to the sample projects. A scatter plot with the DECRIS score (X-axis) and project performance (Y-axis) was generated and simple linear regression was performed as shown in Figure 7. The project R-squared value was 0.8881, so that the regression function clearly represents the correlation of the population.
As highlighted in the literature review, other engineering assessment tools (such as FEL and PDRIs as they were developed to evaluate the project definition level and basic engineering (FEED) maturity in the initial project stage, prior to EPC contracts, by the project owner) were not adequate to apply to predict the influence of detail engineering completion on the construction re-work/re-order by the EPC contractor. On the other hand, DECRIS shows reliable indicators to predict the correlations between DECRIS score (i.e., detail engineering progress and maturity) at the fabrication start session and potential construction cost and schedule performance.

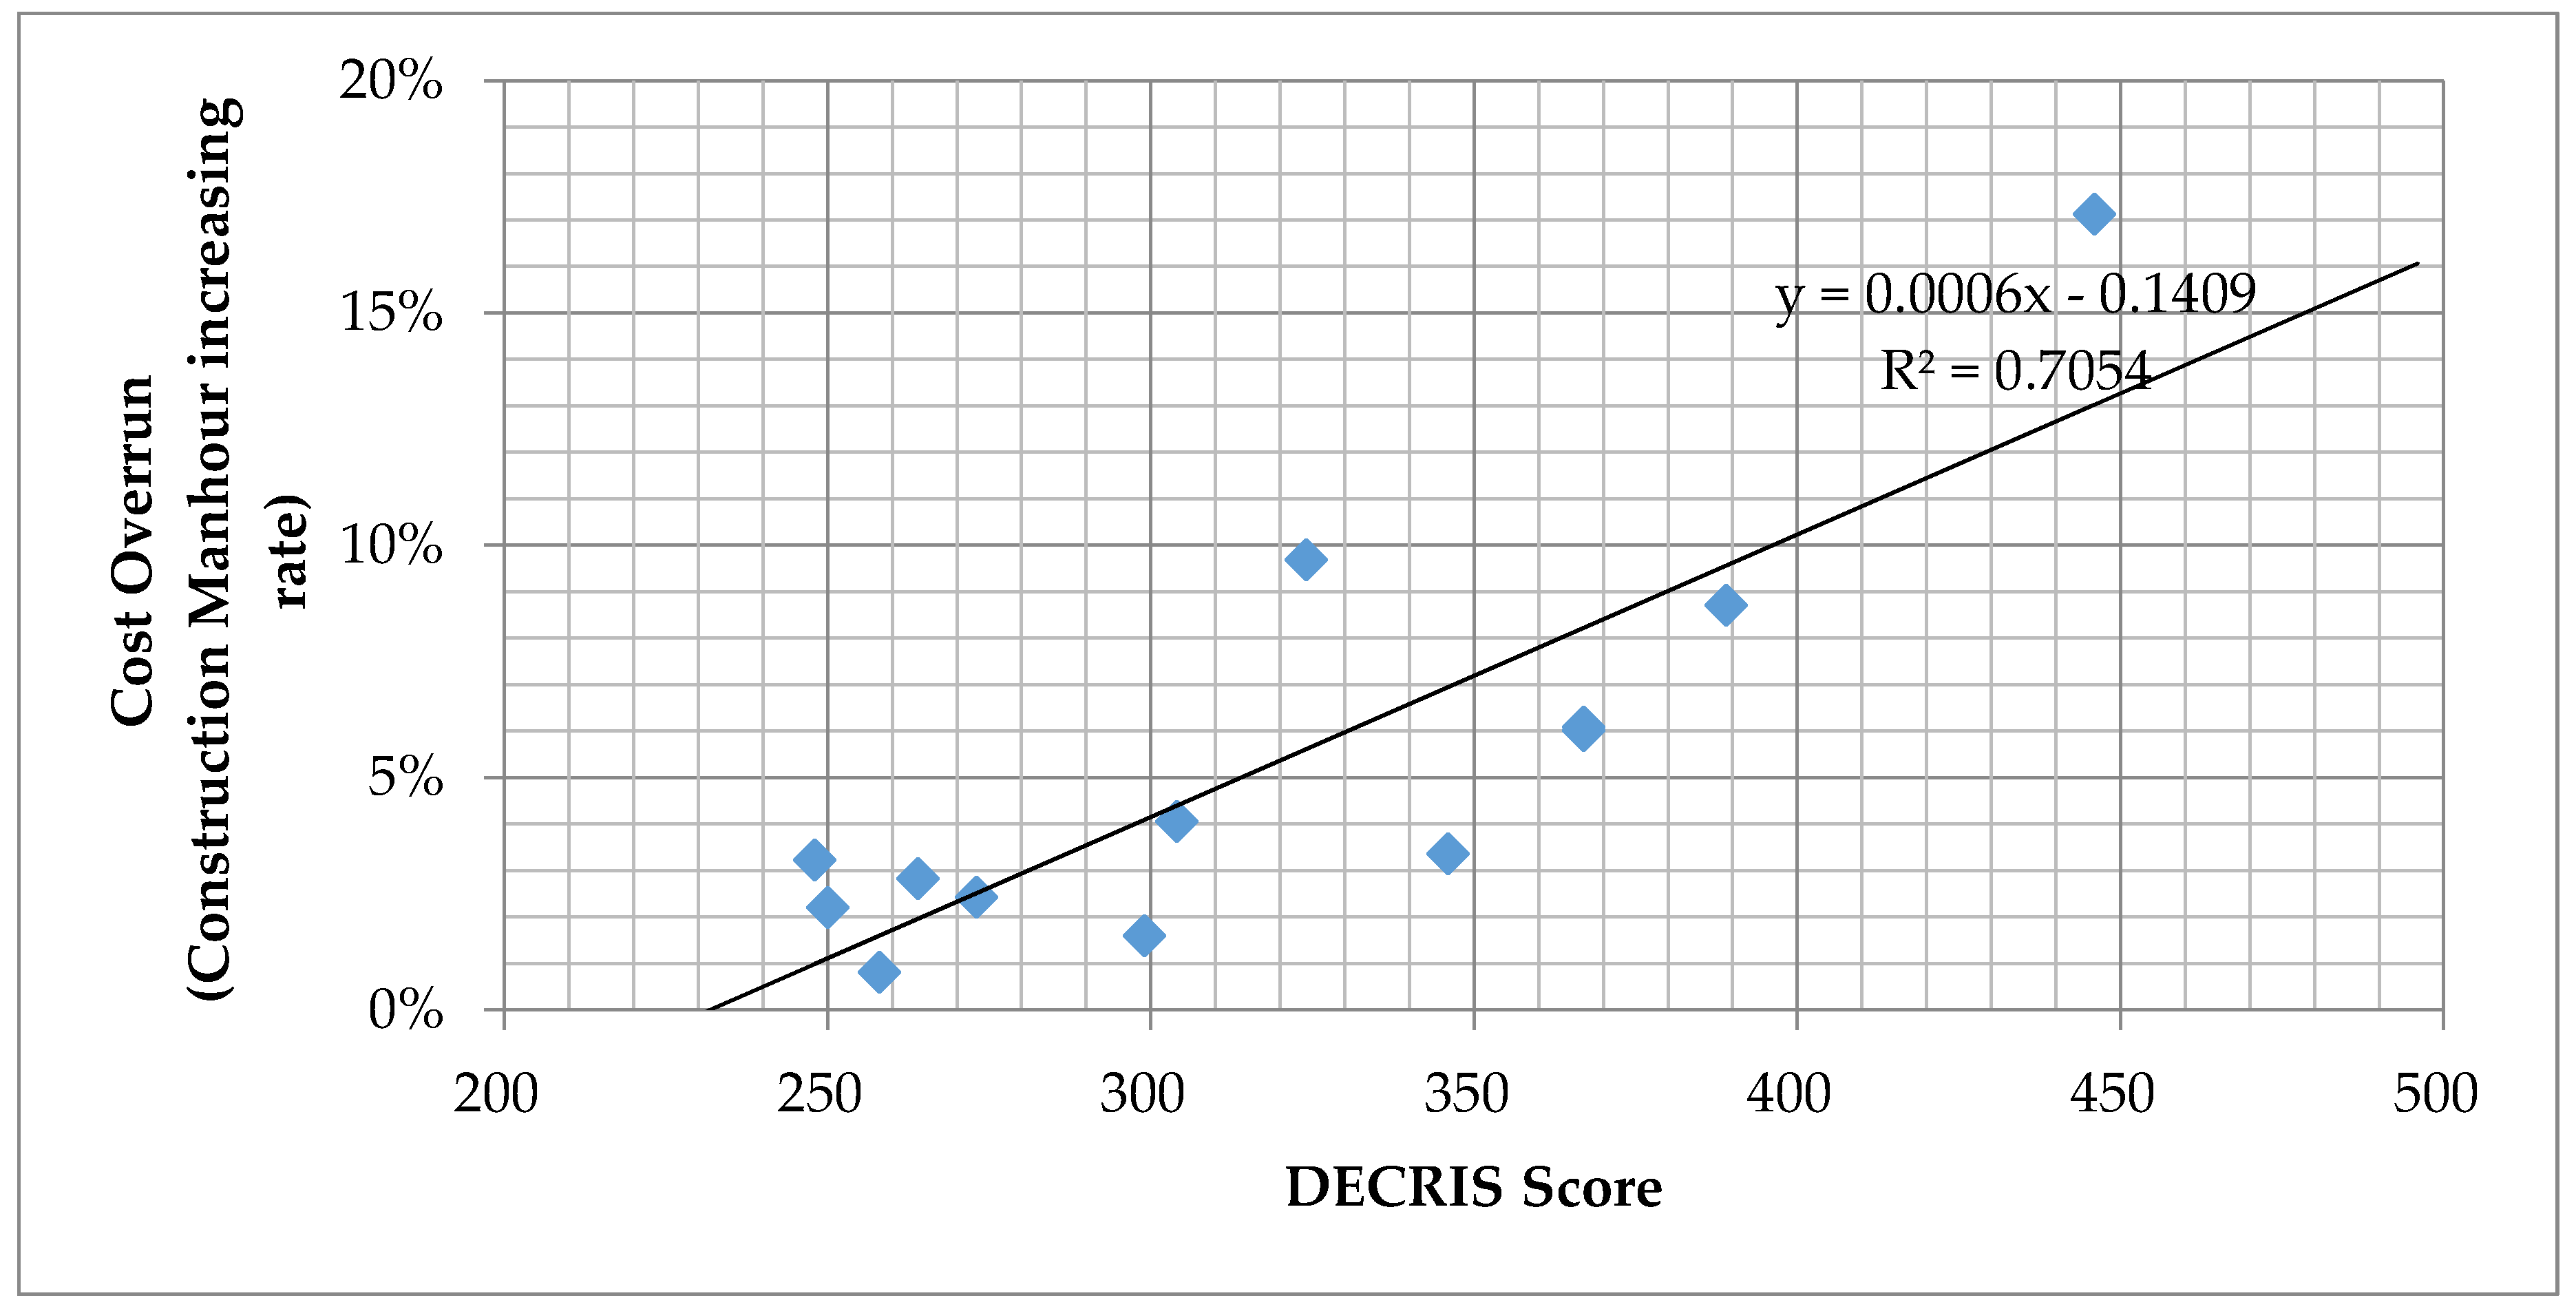
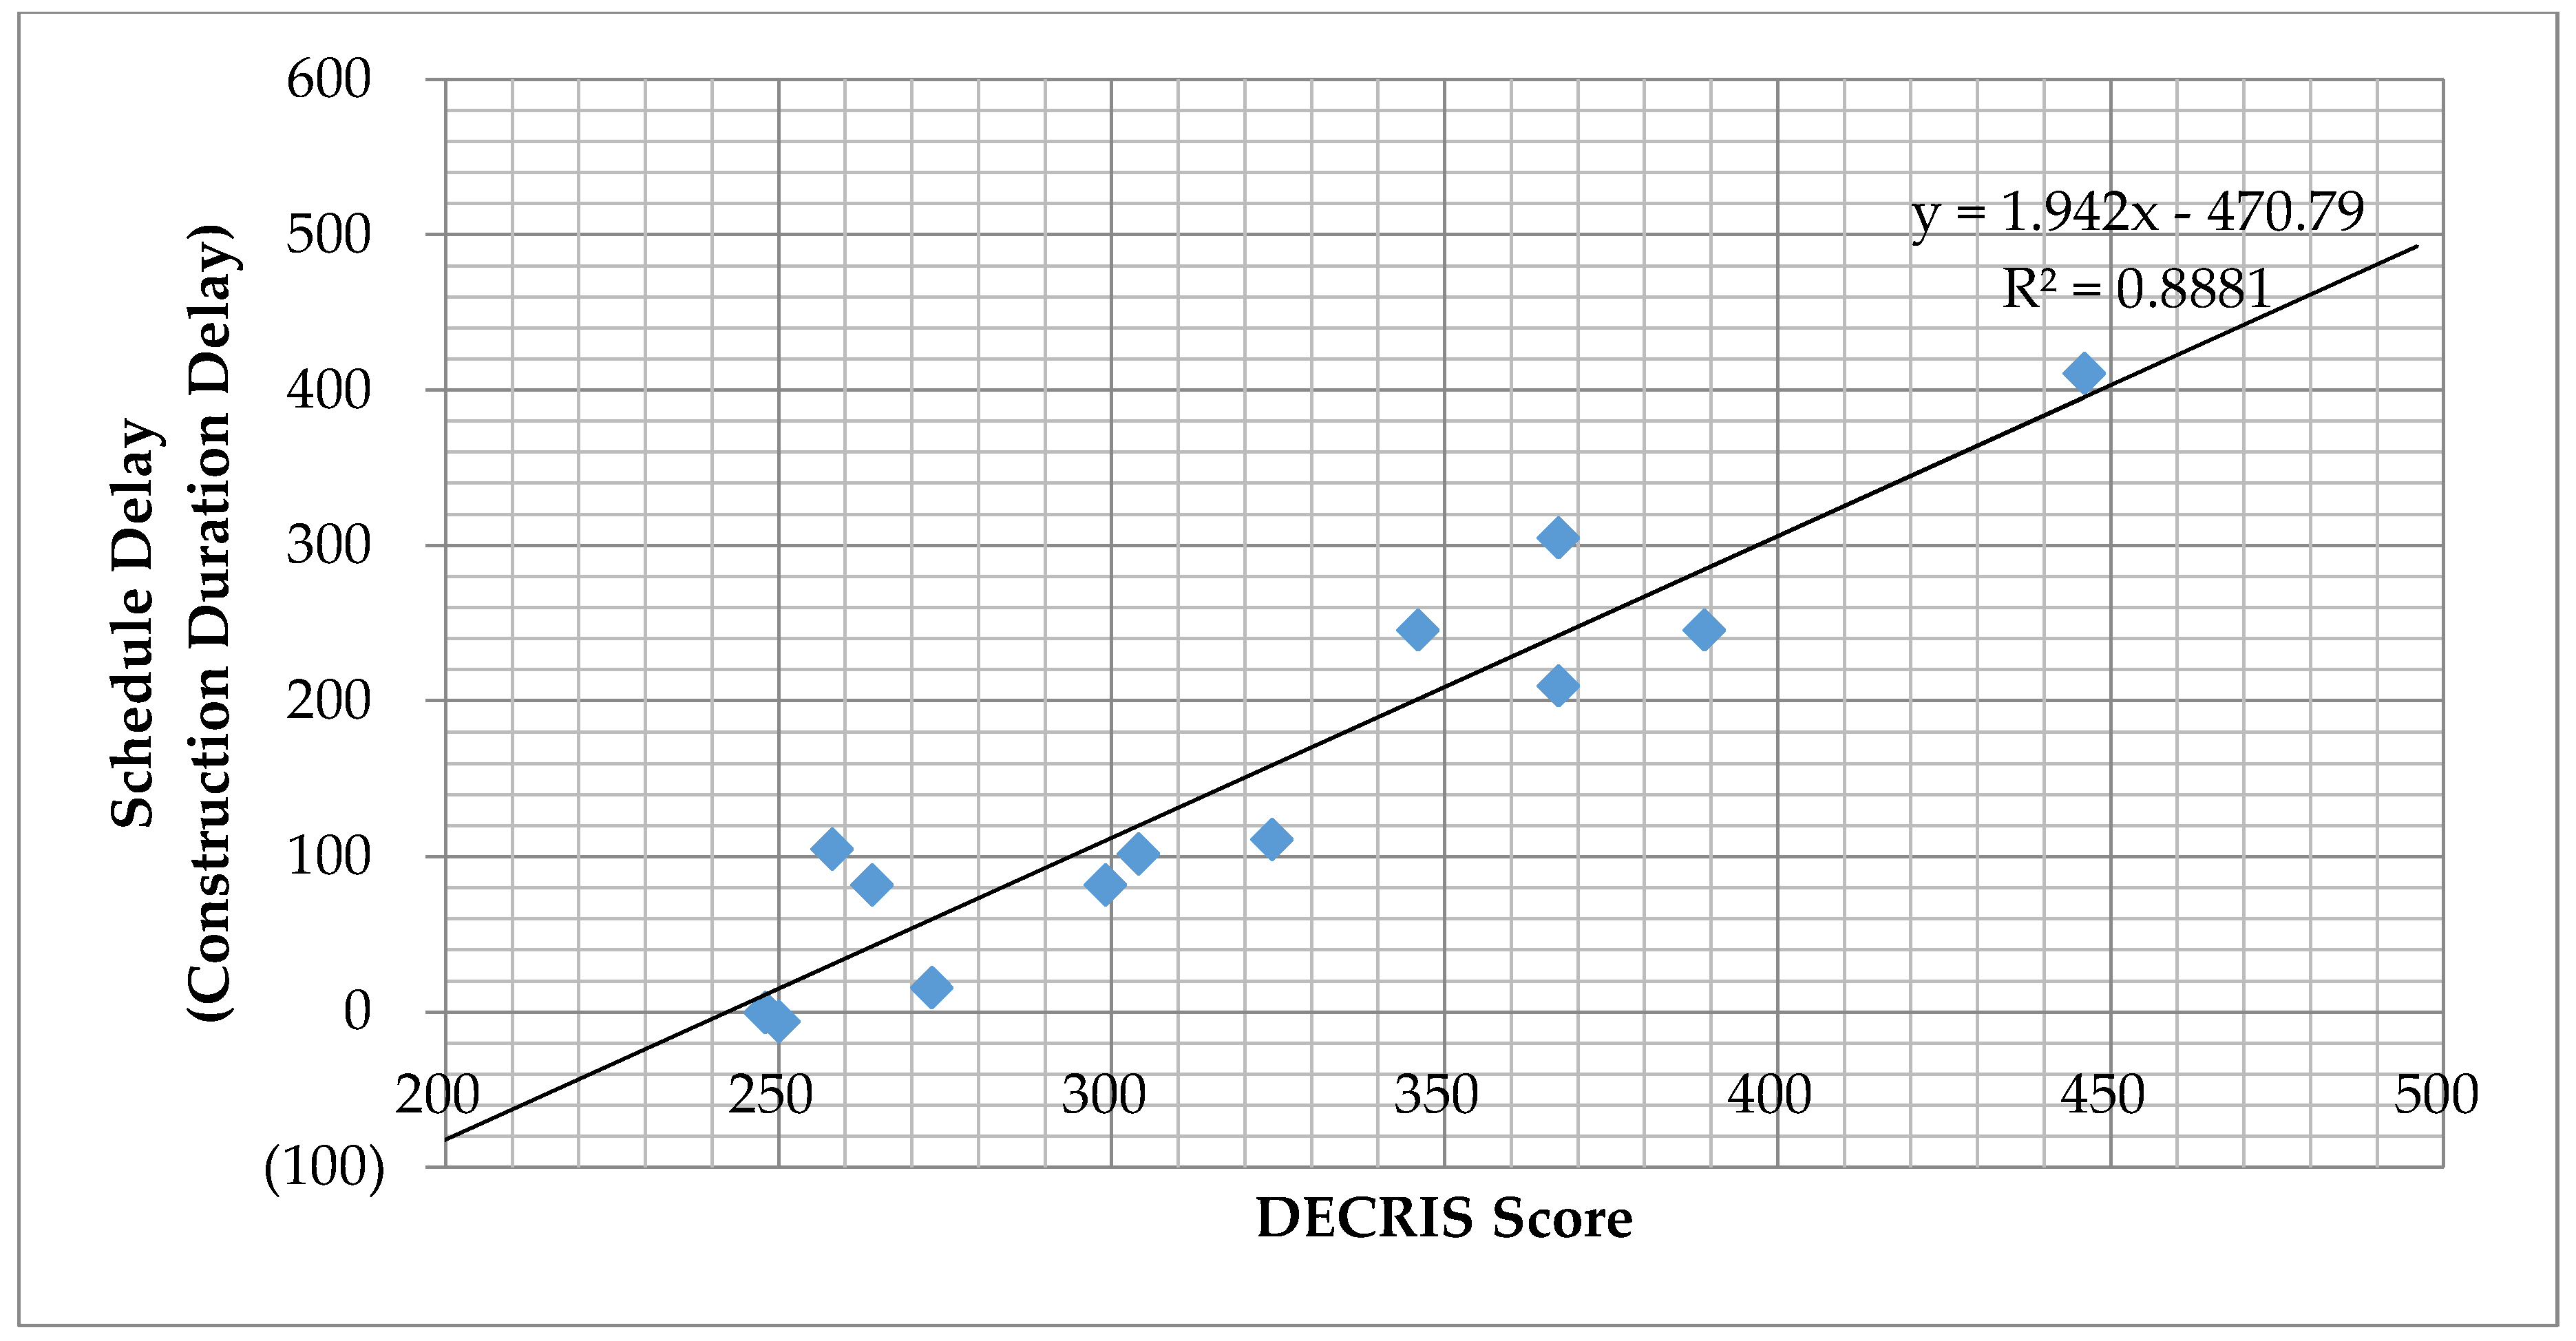
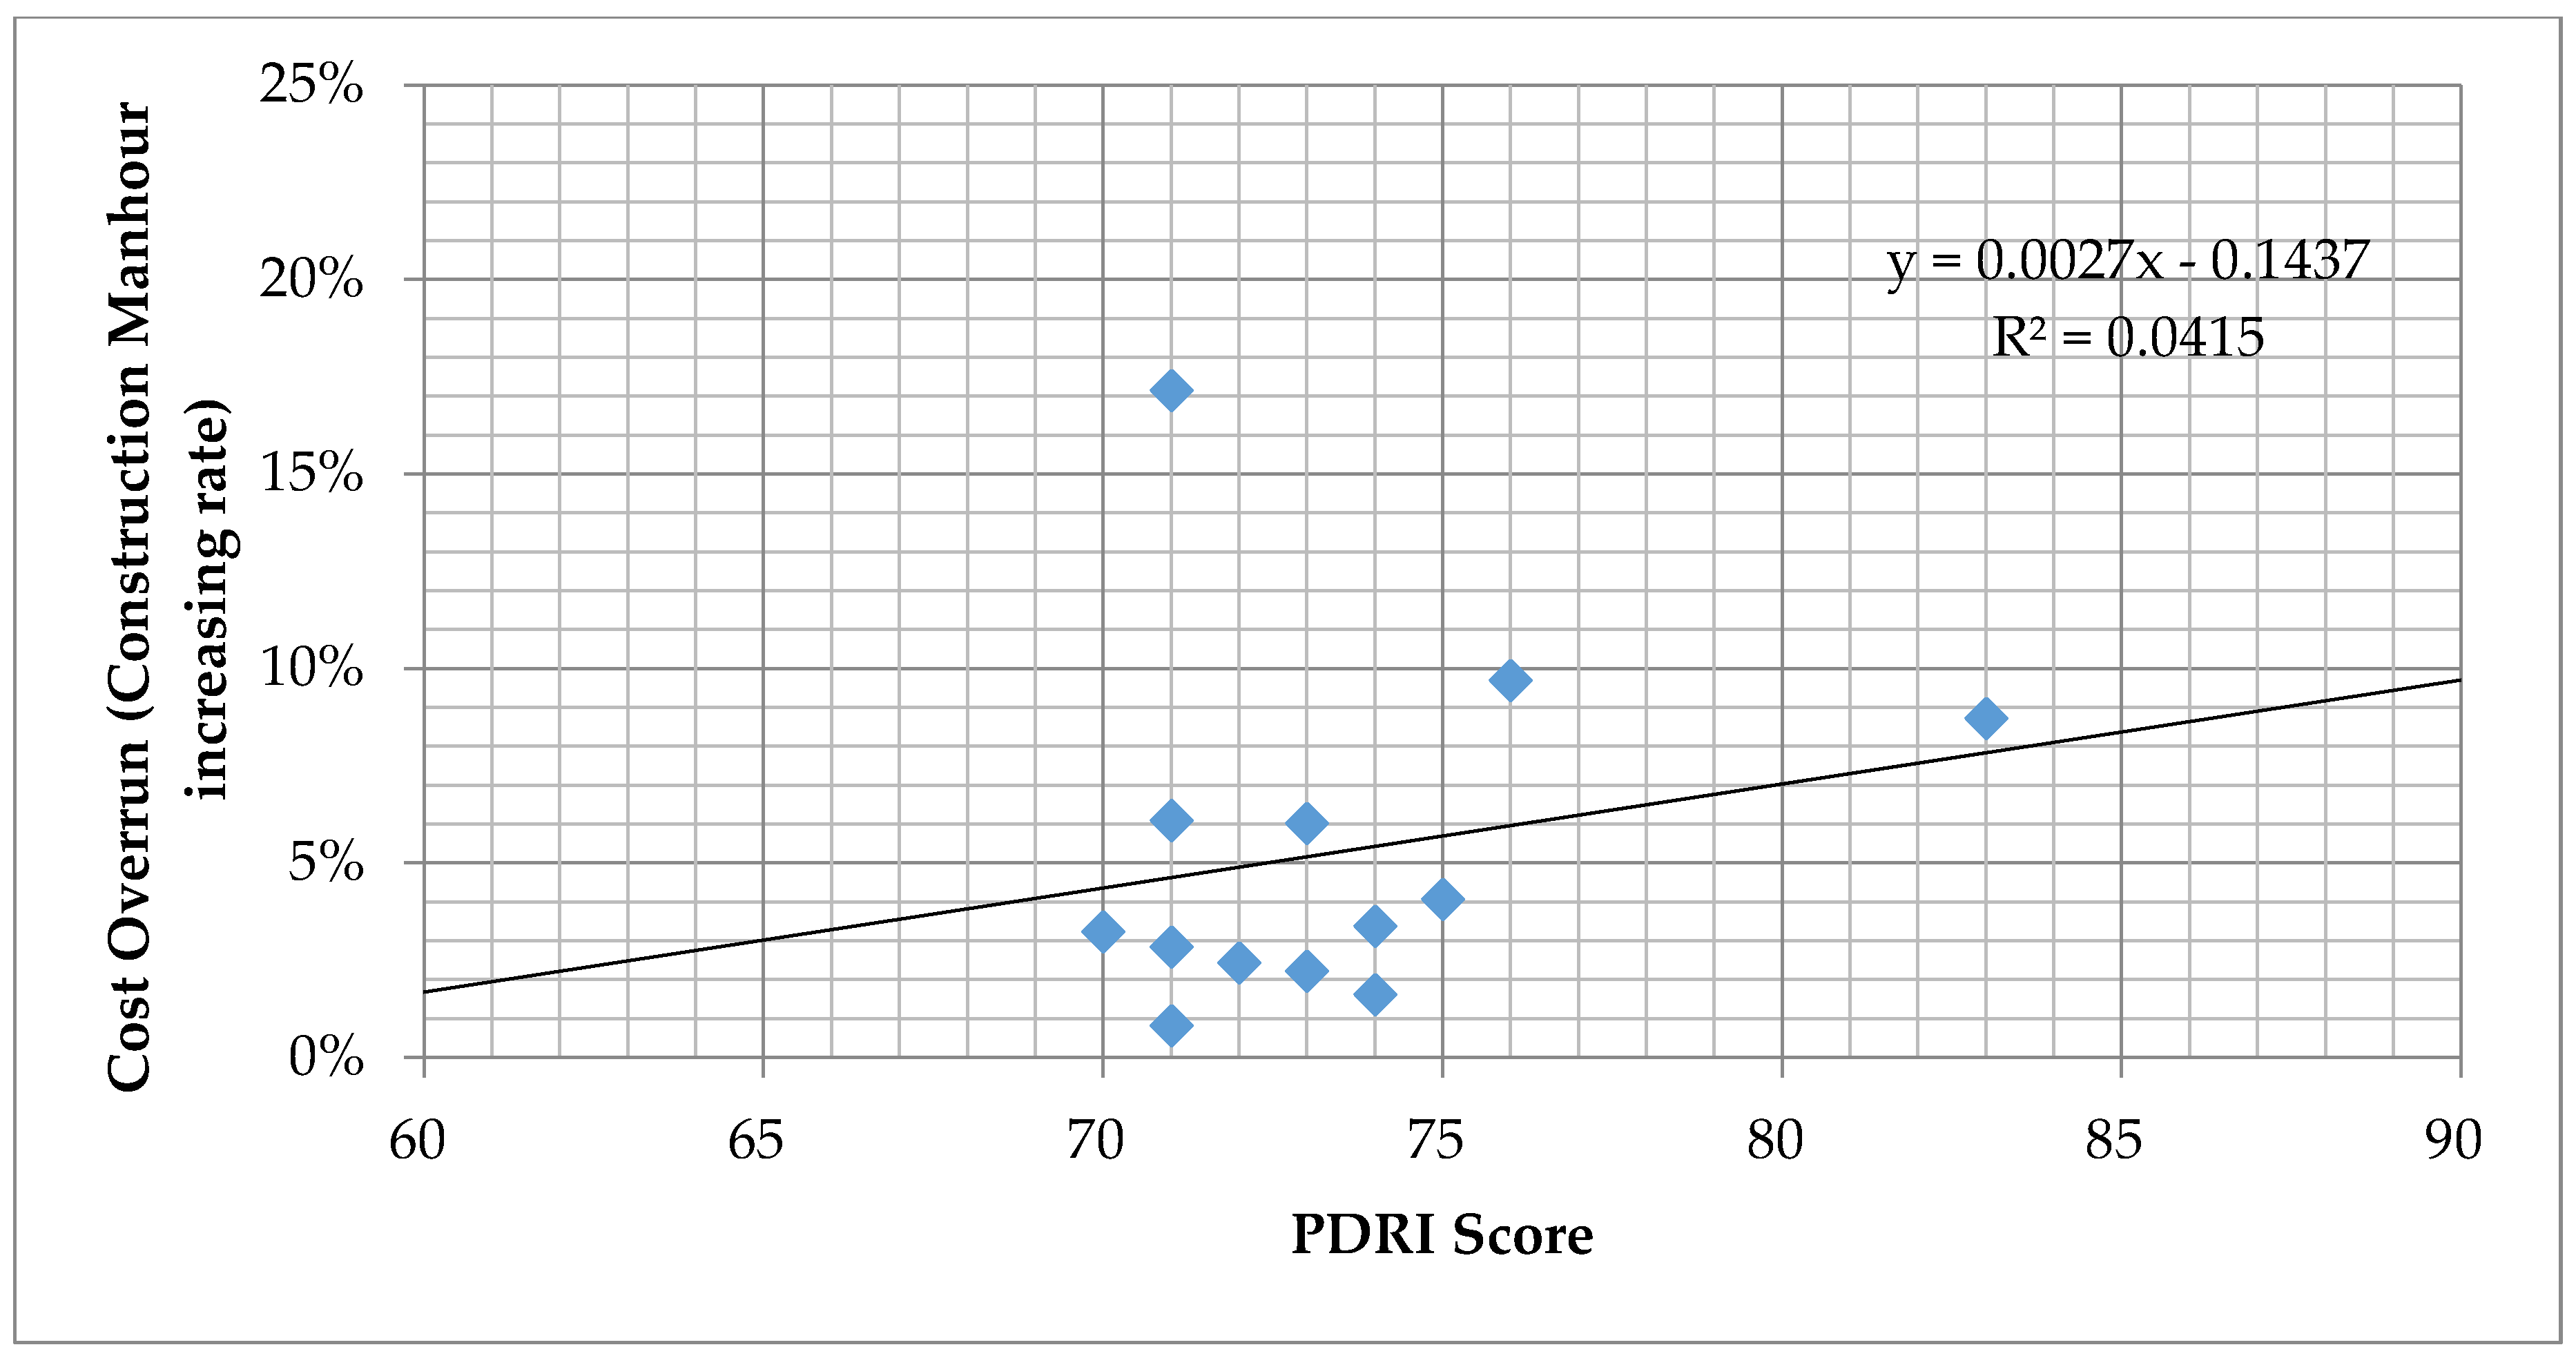
6.2. Step 6: Model Verification with a Case Study

Step 5 proves that the model works well for the thirteen sample projects. However, the goal is for the model to work on all EPC oil and gas projects. To review that the regression functions developed in this research are applicable to ongoing projects, the project performance data of ongoing Project X specified in Table 5 was collected.
As of November 2017, the forecasting cost and schedule performance were calculated using linear interpolation based on current construction labor hours and duration increase. According to interpolation results, a construction labor hours increase rate of 8.26% and a construction duration delay of 177 days are calculated.
The DECRIS score of Project X is assessed as 368 which is much higher than the average of the 13 sample offshore projects. Therefore, DECRIS model predicts that underperformance risks on the Project X are more severe than other projects.
Based on the DECRIS regression functions developed in this research, project performance of ongoing Project X was predicted with Equations (4) and (5).
y = 0.0006x − 0.1409 = 7.99%
z = 1.942x − 479.79 = 235 days
where
  • x = DECRIS score at steel cutting session in Project X = 368
  • y = Construction labor hours increase rate (cost overrun) as per design changes
  • z = Construction duration delay
The result means that the construction labor hours increase rate of 7.99% (about US$ 12 m) and 235 days construction duration delay are expected for the ongoing Project X. This cost estimation is only for construction labor hours; therefore, actual cost overrun including management cost, warehouse cost, engineering cost and subsequent liquidated damages will be much higher than the calculated cost.
According to the comparison between actual results and DECRIS prediction, researchers found that a construction labor hours increase rate of 8.26% and a construction duration delay of 177 days are similar with 7.99% and 235 days predicted in the DECRIS model.
This result indicates that the DECRIS model predicts the cost and schedule performance of the ongoing project. EPC contractors can use the DECRIS score at the steel cutting session to predict project performance using the aforementioned regression functions, Equations (4) and (5).
As the limitation of this research, the case study is just to forecast the cost and schedule impact of the project. As the continuation of the research, the DECRIS model will be continuously implemented further for the engineering progress control to incorporate the initiation of module fabrication start-time.

6.3. Comparison of DECRIS and PDRI (Existing Assessment Tool) Performance

As described in the previous section, the DECRIS model in this study is an evolution of the FEL and PDRI models, modified to work more accurately on offshore oil and gas EPC megaprojects. DECRIS was developed for offshore oil and gas by receiving assessments from both the owner’s FEED completion assessment and EPC contractor’s detail engineering completion assessment. Although the previous sections depict the DECRIS model’s accuracy, no comparison has been made with the existing processes. As such, below is a simple comparison between the DECRIS and previous assessment tools, with a focus on the PDRI-Industrial model as it most closely resembles the DECRIS model. This presentation demonstrates the uniqueness and value-addition potential of the DECRIS model for an EPC contractor’s project progress control, particularly for balancing between detail engineering, procurement, and construction.
Through the PDRI-Industrial assessments at the fabrication start stage of the 13 sample recently completed EPC offshore projects listed in Table 5 by the industrial experts and the project management team, the correlation between the PDRI score and the construction cost performances was analyzed using linear regression function. As a result of PDRI-Industrial assessment, PDRI score was calculated within the range of 70 to 83 and plotted with the construction cost performances using scatter plot, as shown in Figure 8.
In comparing the results of the DECRIS’s (Figure 7) and PDRI’s (Figure 8) abilities to accurately predict cost overrun on offshore oil and gas EPC megaprojects, the DECRIS is found to be significantly superior. This is depicted in comparing the correlation coefficient (R-squared) value for the PDRI model (0.04) and the DECRIS model (0.70). (Due to the significant difference is cost overrun-model score correlation, no schedule-model score analysis was performed for the PDRI). This regression analysis result means that the DECRIS model is a more precise and reliable tool to estimate the correlation between detail engineering assessment score and construction cost performance and to identify the optimal time point of fabrication start, compared to the previous assessment model (PDRI).
Furthermore, in using the linear regression function generated by PDRI model assessment and the 13 sample projects’ construction cost performance data, the cost performance (i.e., Construction Labor Hours Increase Rate) for the ongoing Project X (described in the previous Section 6.2), was predicted with the result of the cost overrun of about 6.96%. This cost overrun prediction value is less than the DECRIS model (7.99% of cost overrun) and actual measured cost performance (8.26% of cost overrun). In summary, from these analyses, the DECRIS model is more accurate in predicting cost/schedule performance and is therefore superior in aiding EPC contractors in their preconstruction processes.

7. Conclusions and Discussion

7.1. Summary and Contributions

The objective of this research is to develop a tool to calculate the engineering completion rating of offshore oil and gas EPC projects, and to validate research goals using regression analysis with the sample projects and comparison between the predicted project performances and actual performance of an ongoing project.
Preliminary DECRIS elements were collected using content analysis from the literature. Through an expert workshop, an expert survey, and statistical analysis, the individual elements, DECRIS hierarchy, and weight factor of each element were determined, and a DECRIS model for the steel cutting session for offshore oil and gas EPC projects was established.
Thirteen existing sample projects were selected for DECRIS review. The performance review of those thirteen projects using the DECRIS model resulted in six projects in the low DECRIS score group for the steel cutting session which were completed with an average construction labor hours increase rate of 2.2% and a construction duration delay of 47 days. In contrast, the other six projects in the high group were completed with an average construction labor hours increase rate of 7.7% and a construction duration delay of 255 days. When steel cutting is conducted with the DECRIS cutoff score (<300) achieved, the project cost and schedule performance of the project are statistically superior to other projects that failed to achieve the cutoff score. Through regression analysis with the 13 sample projects, the correlation and regression functions between the DECRIS score and project performance were found. Based on the regression functions developed in this research, the project performance for an ongoing project was predicted, and the predicted performance was well matched with the current project status.
The research results mean that early detail engineering completion prior to construction makes the EPC project successful and sustainable without considerable schedule delay and associated cost overrun. The DECRIS model contributes to EPC contractor as decision-making tools at the moment of fabrication start. EPC contractor can acknowledge the project risks with the predicted cost and schedule performance calculated by DECRIS, and they are able to find out mitigation plans such as additional workforce involvement on engineering or construction works or postpone the fabrication start after risk comparison.
The DECRIS model can contribute to the project success on the construction execution stage by forecasting project performance and potentially reducing the project underperformance risks. The on-time delivery within budget for offshore oil and gas EPC projects using the DECRIS model will also give a positive motivation for major oil companies who place a great deal of attention on project success.

7.2. Future Directions

In future research, the correlation between each DECRIS element and project performance can be evaluated using statistical tools and more offshore EPC project samples. Consequently, the benefits of further sample projects such as minimum 50 EPC projects in the long run, multivariate tools such as Fuzzy Set Qualitative Comparative Analysis (fsQCA), or Principal Component Analysis (PCA) might be applicable.
The DECRIS model in this research is focused on the fabrication start session. To improve the limitation of PDRI and DECRIS current approach of retroactive verification, proactive implementation of the DECRIS model to incorporate into engineering management control will be continued in the future. For the prospective check during the entire EPC stage, the DECRIS cutoff score for the other milestones such as contract award, FEED verification, major equipment procurement and engineering transfer should be set. With the set of DECRIS cutoff scores for each milestone, the EPC contractor can estimate the engineering performance in the project and find mitigation plans to reduce DECRIS score to reduce the project cost and schedule risks.
The DECRIS module “Part A” as reported in this paper is a part of overall research framework as shown in Figure 9. Currently the DECRIS module is in the process of further extension to “Part B” illustrated in Figure 9 to eventually develop a comprehensive application program to corporate with integrated project cost-schedule control such as earned value management systems (EVMS) based on some kind of artificial intelligence analytics and big data database for oil and gas offshore EPC projects.
If in future research, the engineering labor hours spent on each preparation and submission of engineering deliverables are collected from the historical database, and EDMS and its quantitative information are applied for the weight factor of each level, DECRIS can be used as a tool to calculate the earned value of the detail engineering activities. In this case, DECRIS can contribute as an engineering cost control tool to calculate the engineering progress during the detail engineering stage.

Author Contributions

M.H.K. developed the concept and drafted the manuscript. H.S.C. provided industry feedback on the study and E.-B.L. reviewed and revised the manuscript and supervised the overall work. All the authors read and approved the final manuscript.

Funding

The authors acknowledge that this research was sponsored by the Ministry of Trade Industry and Energy (MOTIE/KEIT) Korea through the Technology Innovation Program funding (Developing Intelligent Project Management Information Systems (i-PMIS) for Engineering Projects; Grant number = 10077606).

Acknowledgments

The authors of this study would like to thank Hyundai Heavy Industry Co for their informational support and technical cooperation. The authors would like to thank H. D. Jeong at Iowa State University and D. S. Alleman (a candidate in Univ. of Colorado at Boulder) for their academic inputs and feedback on this research.

Conflicts of Interest

The authors declare no conflicts of interest.

Abbreviations

AFCApproval for Construction
CDDConstruction Duration Delay
CLIRConstruction Labor hours Increase Rate
DECRISDetail engineering Completion Rating Index System
EDMSElectronic Document Management System
EPCEngineering, Procurement and Construction
FEEDFront-End Engineering and Design
FELFront-End Loading
FPSOFloating Production, Storage and Offloading
FLNGFloating LNG
PDRIProject Definition Rating Index
fsQCAFuzzy Set Qualitative Comparative Analysis
PCAPrincipal Component Analysis

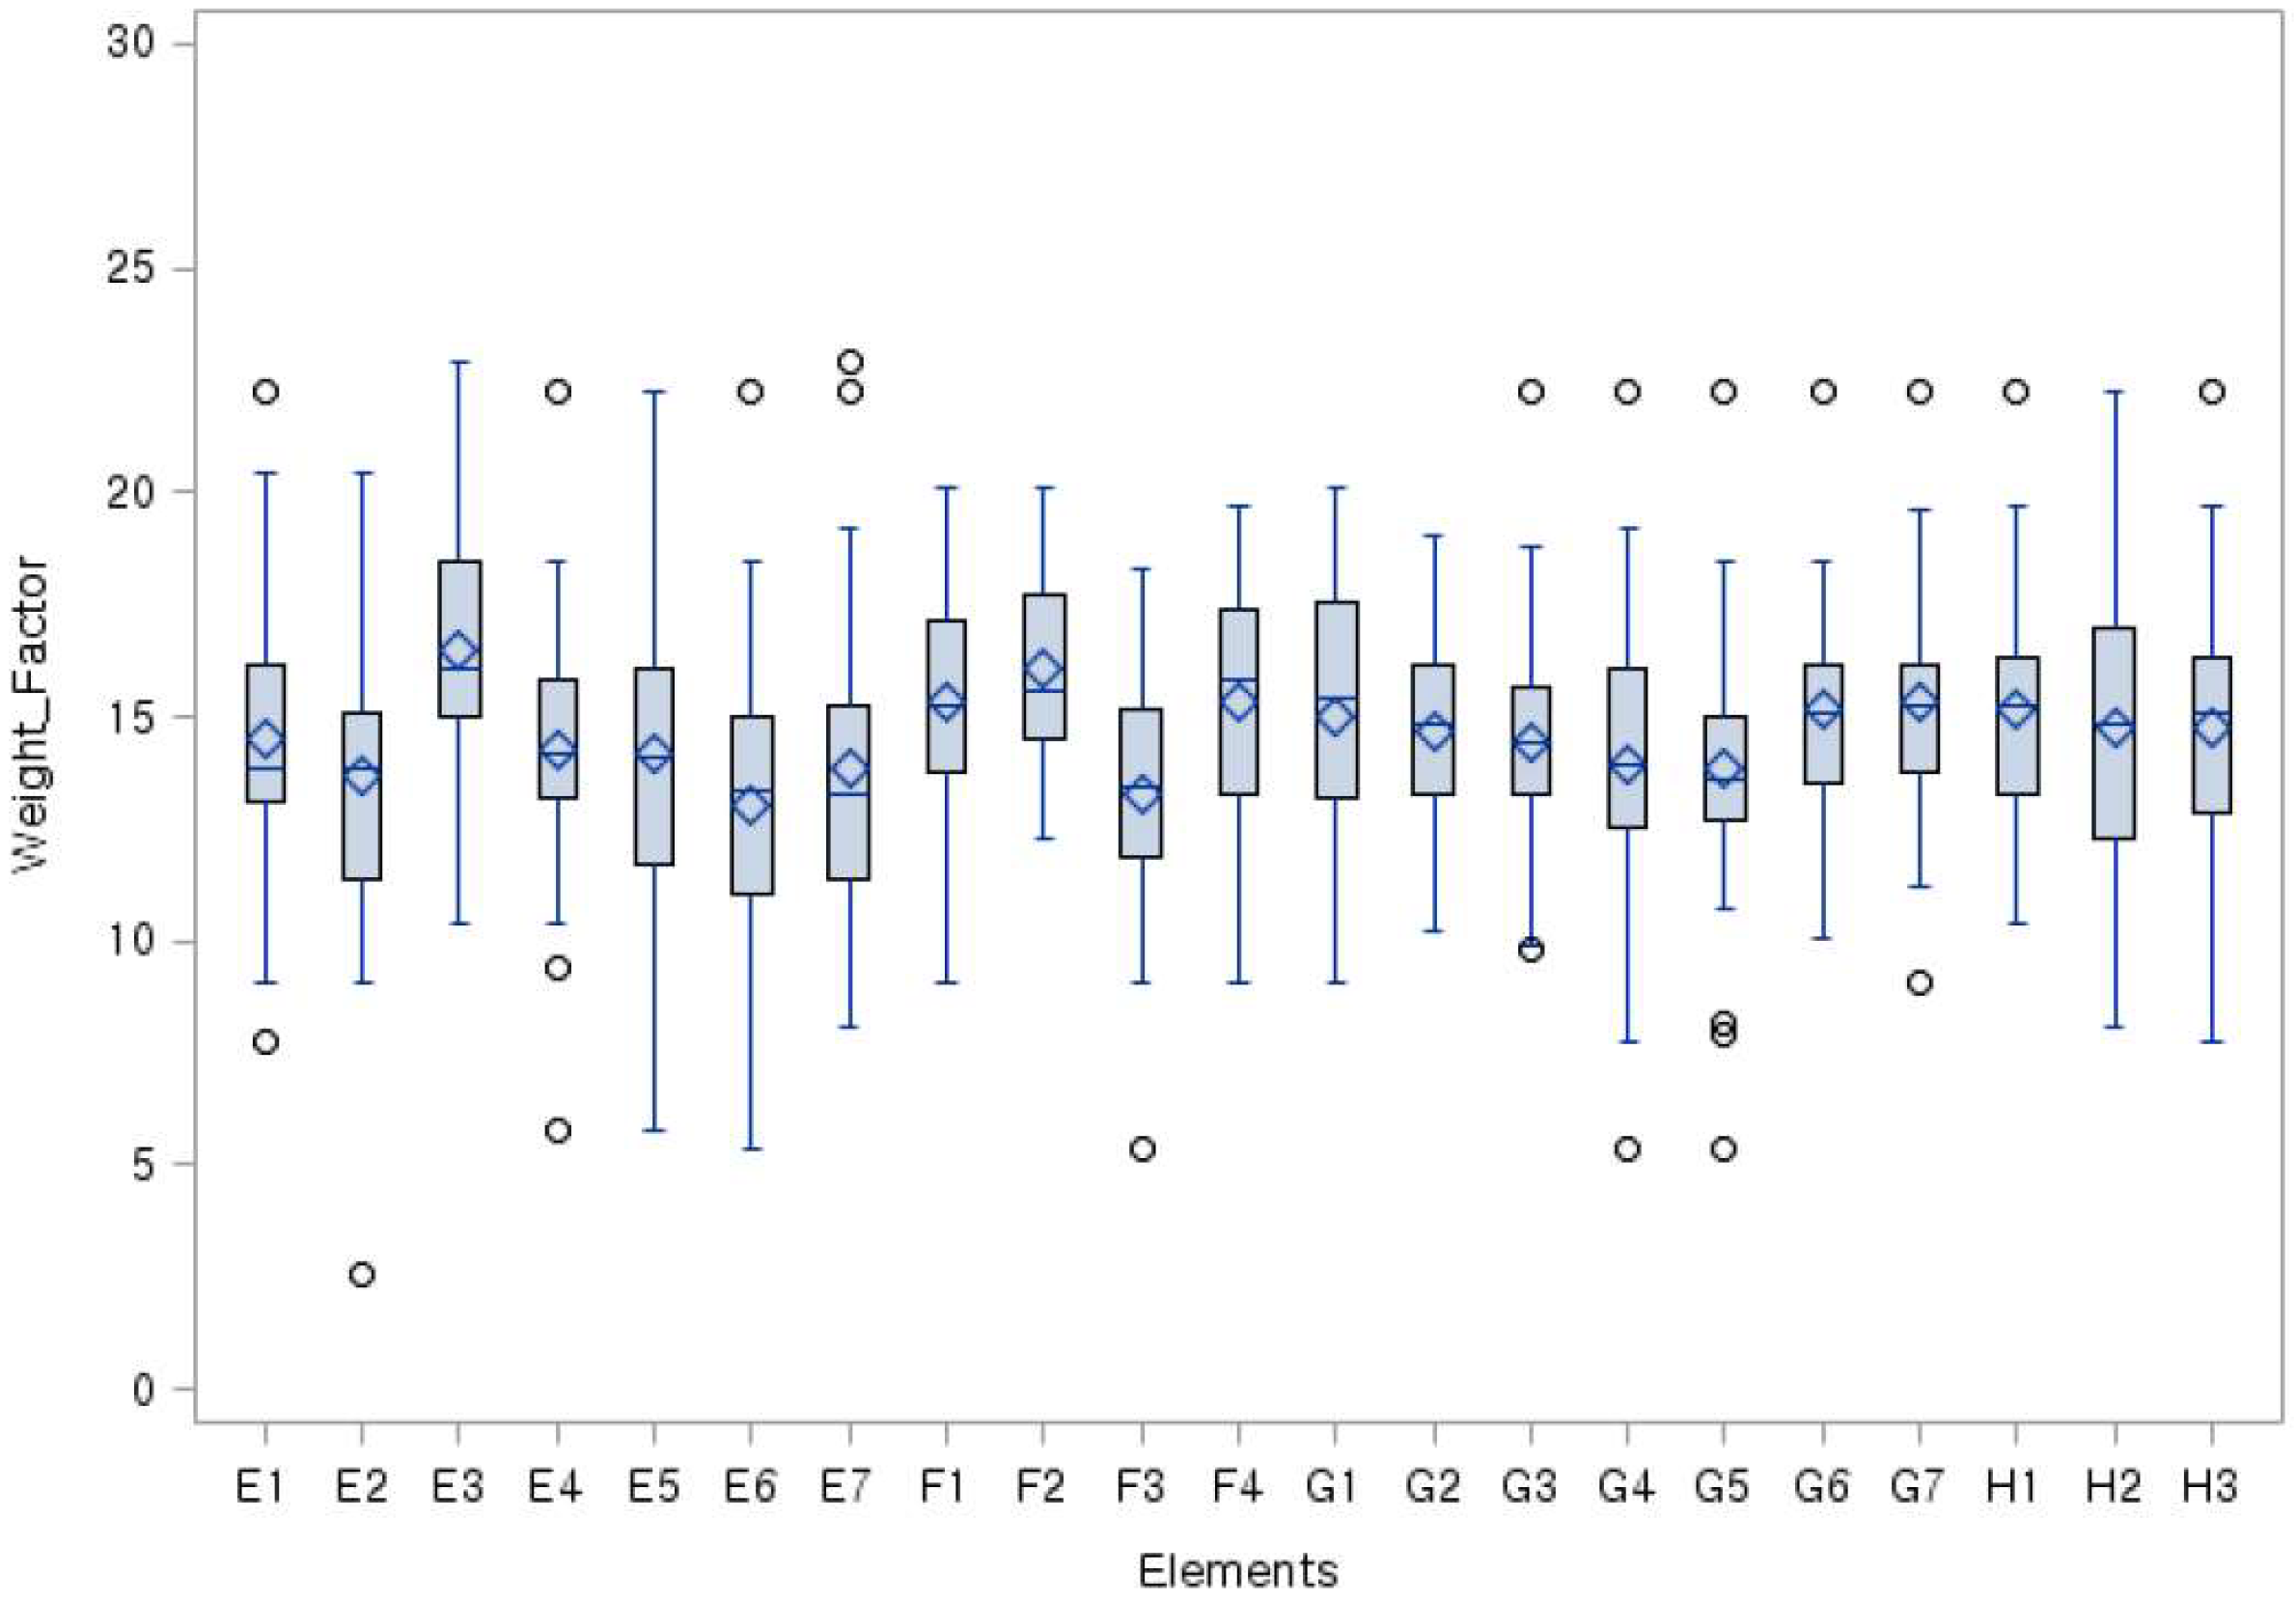
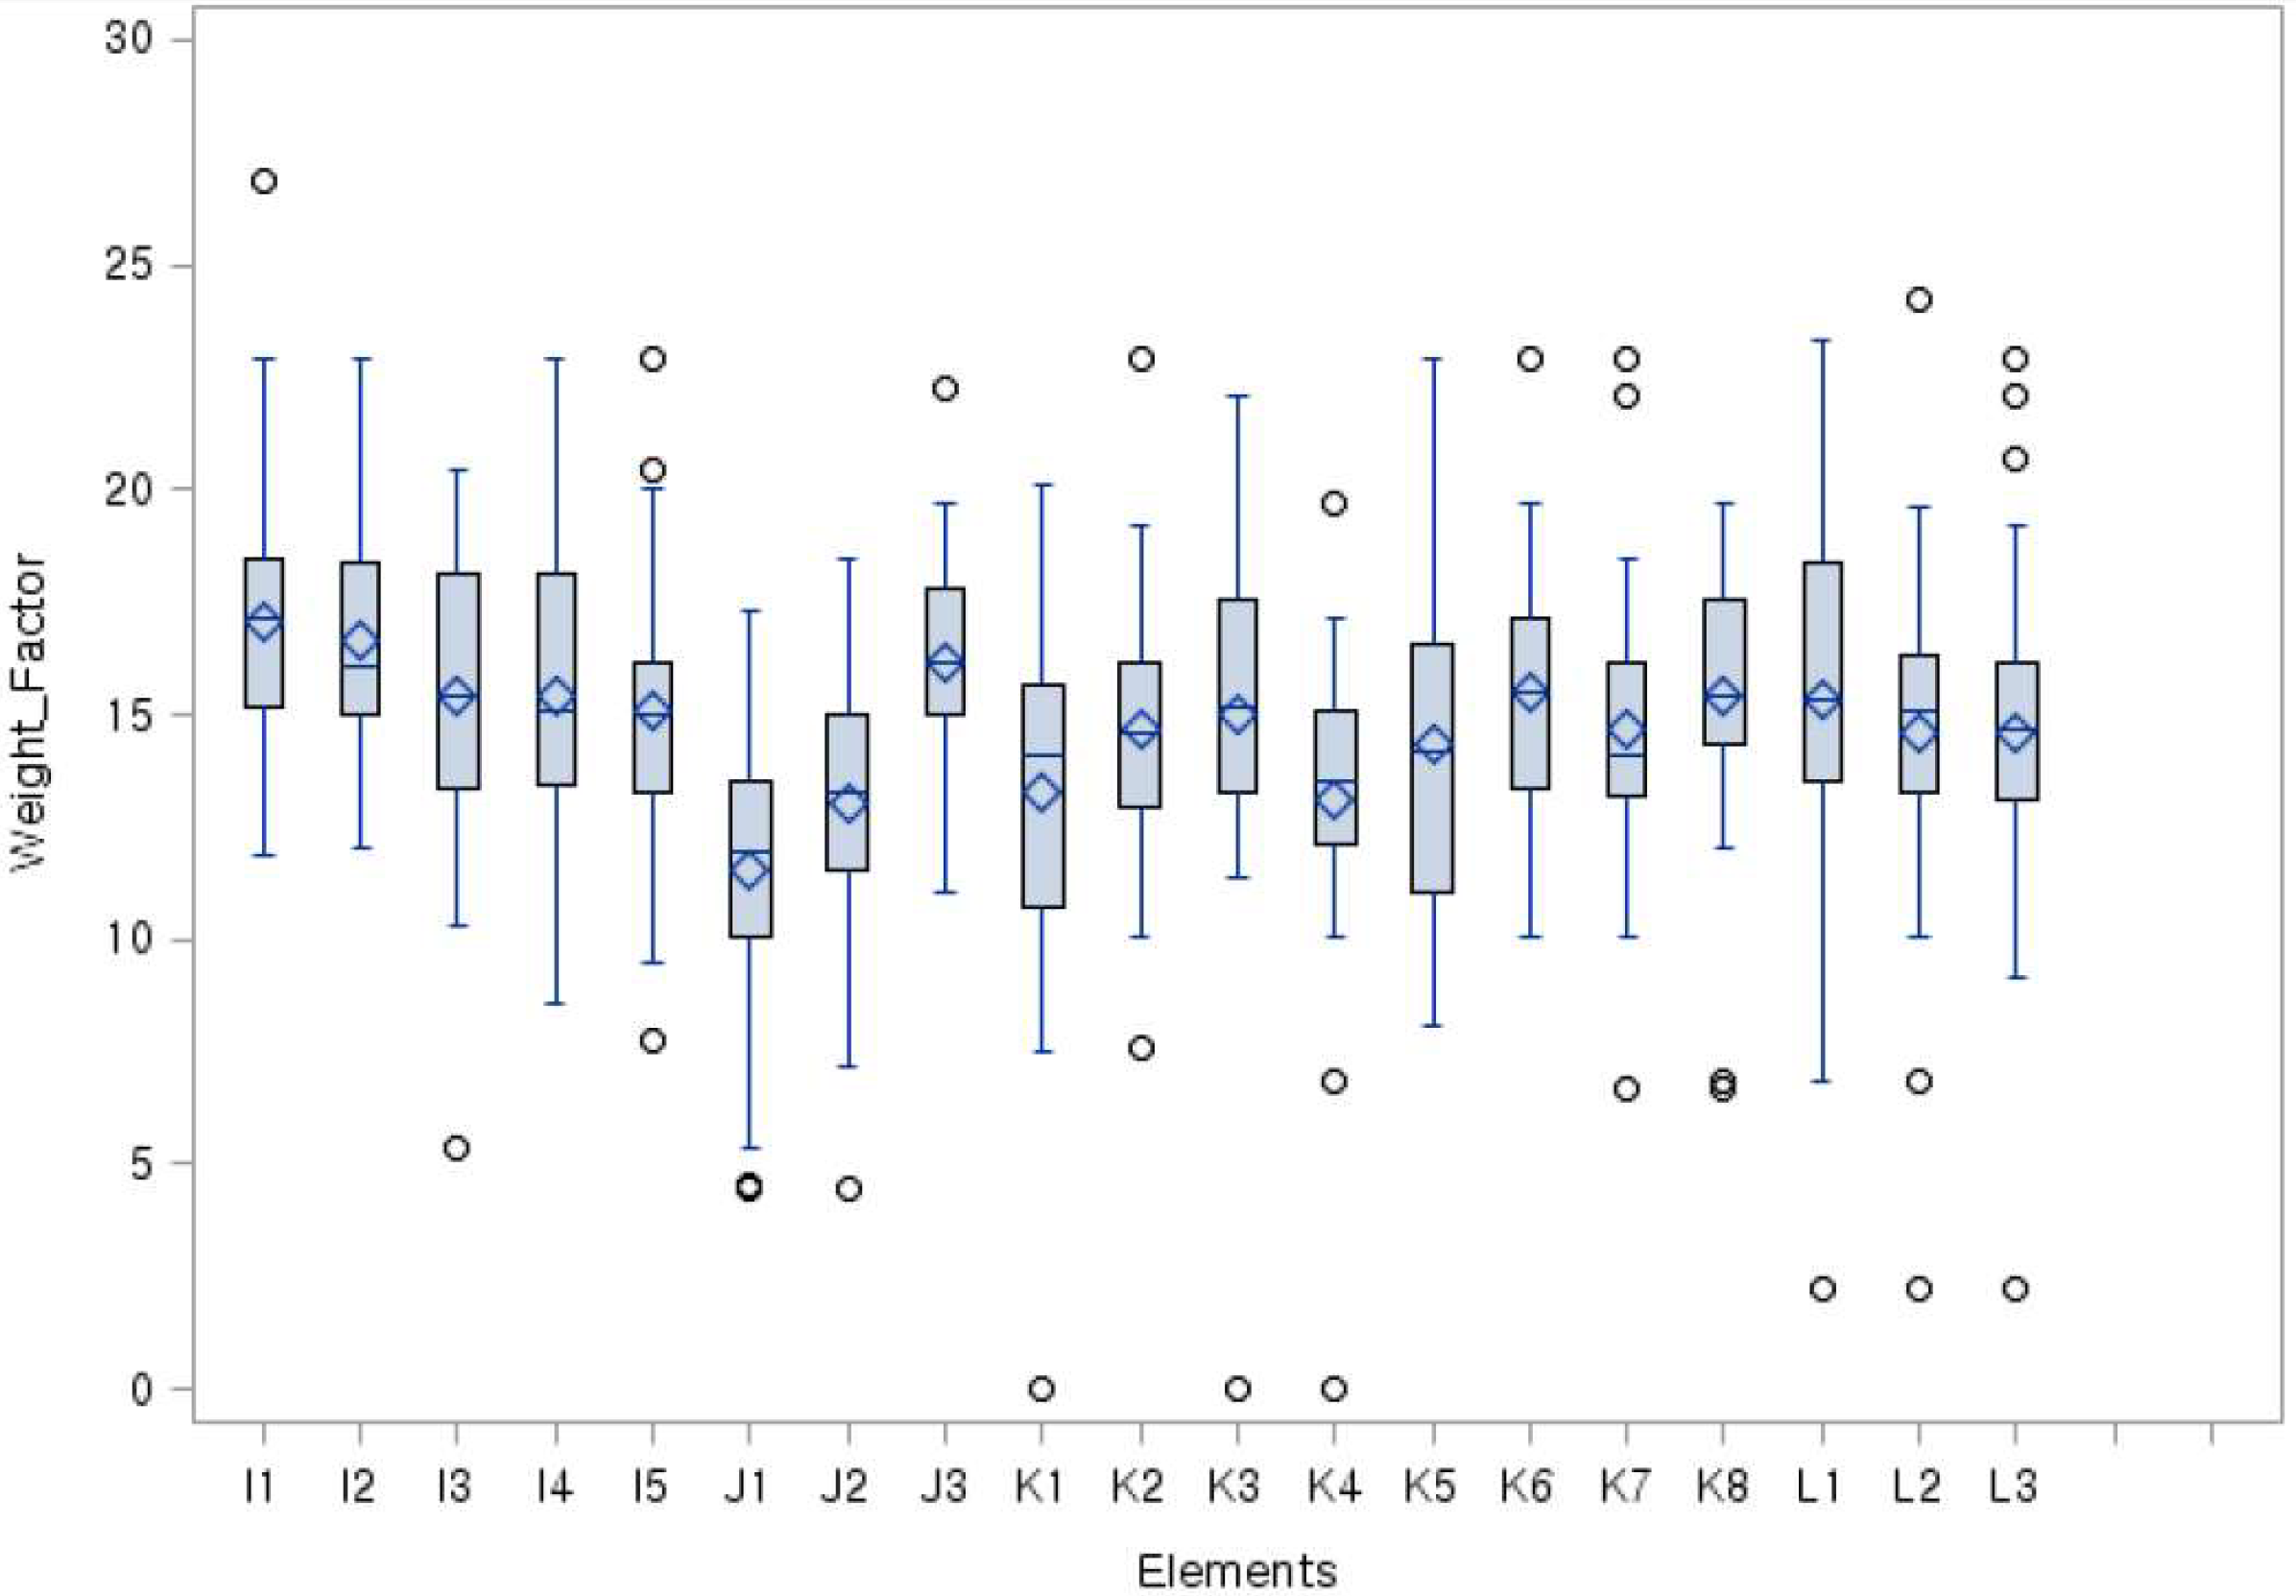
Appendix A. Boxplot of Weight Factor by Elements

* Note: The main purpose of the “boxplot” below is to secure reliability of the data set and similarity with normal distribution, number of extreme and outlier was collected from each participant, and the contribution score was calculated. The survey results with a high contribution score were eliminated.
Figure A1. The Boxplot for DECRIS Elements A1 to D9.
Sustainability 10 02469 g0a1
Figure A2. The Boxplot for DECRIS Elements E1 to H3.
Sustainability 10 02469 g0a2
Figure A3. The Boxplot for DECRIS Elements I1 to L3.
Sustainability 10 02469 g0a3

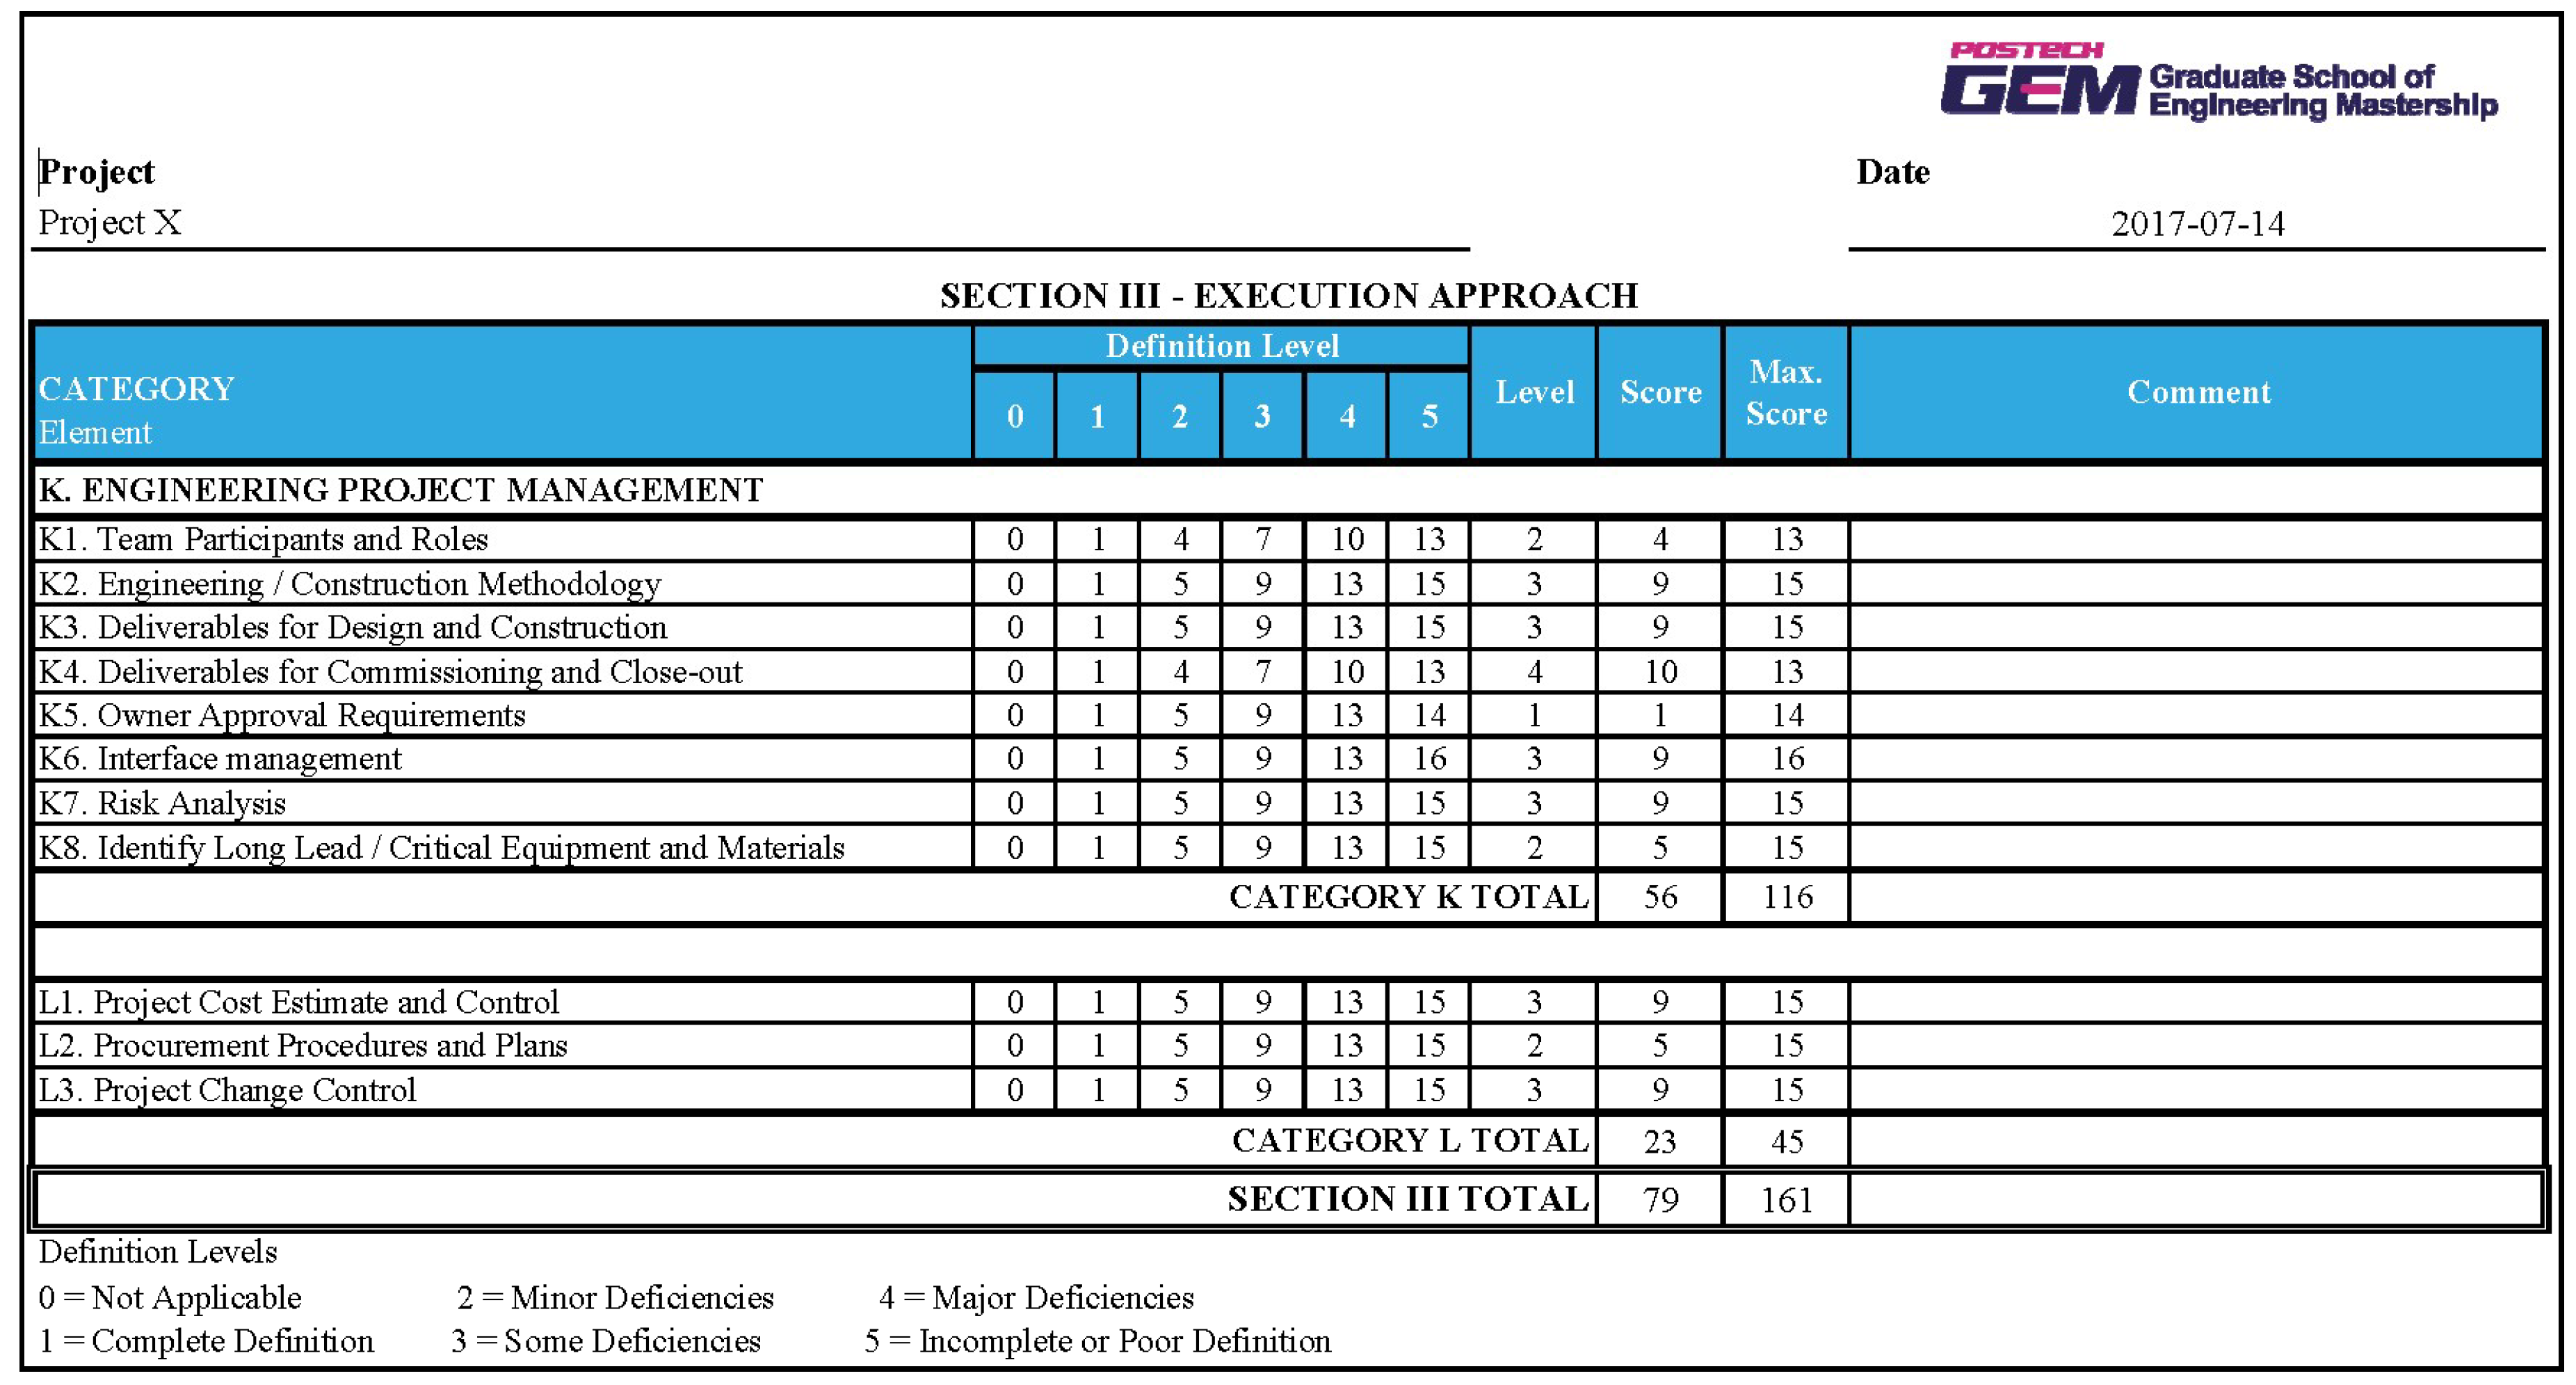
Appendix B. Weighted Scoresheet

* Note: The main purpose of the “Weighted Scoresheet” listed below is to assign weighted scores for mapping them to the “Definition Level” (scale 0~5) for each DECRIS element based on the experts’ practices collected from the workshops.
SECTION I-BASIS OF DETAIL DESIGN
CATEGORY ElementDefinition LevelScore
012345
A. PROJECT SCOPE
A1. Project Objectives Statement013579
A2. Project Scope of Work01591317
A3. Project Philosophies01471013
B. PROJECT PERFORMANCE REQUIREMENT
B1. Products01471012
B2. Capacities01471013
B3. Technology01471012
B4. Processes01591314
C. DESIGN GUIDELINE
C1. Process Design Criteria01591316
C2. Project Site Assessment01591314
C3. Lead Discipline Scope of Work01591314
C4. Project Schedule01591317
C5. Constructability Analysis01591315
SECTION II-ENGINEERING DELIVEABLES
D. PROCESS/MECHANICAL/PIPING
D1. Process Flow Diagrams01591315
D2. Heat and Material Balance01591315
D3. Piping & Instrumentation Diagrams027121718
D4. Process Safety Management (PSM)01591315
D5. Utility Flow Diagram01591314
D6. Process Datasheets01591315
D7. Equipment Mechanical Datasheets01591315
D8. Specifications01591316
D9. Piping System Requirements01591315
D10. Plot Plan01591316
D11. Project Equipment List01471013
D12. Line Lists01471013
D13. Tie-in Lists01471013
D14. Piping Stress Analysis01591315
D15. Piping Isometric Drawings01471013
D16. Piping Specialty Items Lists01471012
D17. Instrument Index01471013
E. EQUIPMENT VENDOR
E1. Equipment Procurement Status01591315
E2. In-line and Instrument Procurement Status01591314
E3. Equipment General Arrangement Drawings01591317
E4. Process and Mechanical Documents01591314
E5. Instrument and Electrical Documents01591314
E6. Structural and Architectural Documents01471013
E7. Equipment Utility Requirements01591314
F. STRUCTURAL AND ARCHITECTURAL
F1. Structural Specifications01591315
F2. Structural Analysis01591316
F3. Architectural Arrangement Drawing01471013
F4. Weight Control Report01591315
G. INSTRUMENT AND ELECTRICAL
G1. Control Philosophy01591315
G2. Logic Diagrams01591315
G3. Cable Schedule01591314
G4. Hook-up Diagram01591314
G5. Critical Electrical Item List01591314
G6. Electrical Single Line Diagrams01591315
G7. Instrument and Electrical Specifications01591315
H. MATERIAL TAKE-OFF
H1. Piping MTO01591315
H2. Structural and Architectural MTO01591315
H3. Instrument and Electrical Bulk Item MTO01591315
I. 3D MODELING
I1. 3D Modeling Review01591317
I2. 3D Modeling (Equipment/Piping)01591317
I3. 3D Modeling (Structural)01591315
I4. 3D Modeling (Architectural)01591315
I5. 3D Modeling (Instrument and Electrical)01591315
J. GENERAL FACILITY REQUIREMENT
J1. Preservation and Storage Requirement01471012
J2. Transportation Requirements01471013
J3. Welding Procedure Specification01591316
SECTION III-EXECUTION APPROACH
K. ENGINEERING PROJECT MANAGEMENT
K1. Team Participants and Roles01471013
K2. Engineering/Construction Methodology01591315
K3. Deliverables for Design and Construction01591315
K4. Deliverables for Commissioning and Close-out01471013
K5. Owner Approval Requirements01591314
K6. Interface Management01591316
K7. Risk Analysis01591315
K8. Identify Long Lead/Critical Equipment and Materials01591315
L. PROJECT EXECUTION PLAN
L1. Project Cost Estimate and Control01591315
L2. Procurement Procedures and Plans01591315
L3. Project Change Control01591315

Appendix C. DECSIS Level Assessment Questionnaires (Selected Samples)

* Note: The main purpose of the “Level Assignment Questionnaires” listed below is to provide the assessment criteria for the “Definition Level” of each DECRIS element. The sample “Questionnaires” included in this Appendix C is covering Section II—Category D only, which is about 25% of the total full questionnaires descriptions (17 elements in Category D among 69 total elements), due to the space limit. The full questionnaire descriptions will be available on the main author’s (M.H. Kim) doctoral thesis later.
  • Section II: Engineering Deliverables
  • Category D. Process/Mechanical/Piping
    D1. Process Flow Diagrams
    LevelDescription
    1Final Process Simulation was carried out and AFC stage Process Flow Diagram (PFD) was approved without comment. No further design change in Process Flow Diagram is foreseen.
    2Updated Process Simulation in detail engineering was performed according to project requirements, as well as Client comments from PFD and major design changes. Revised PFD (AFD) was issued. No further major design change in Process flow diagram is foreseen.
    3Process simulation in detail engineering was performed in line with Project Requirements, and its result including PFD (IFA, first revision) was updated and submitted to the Client.
    4There is no discrepancy between process simulation, PFD, and Heat and Material Balance in FEED. In addition, they comply with Basis of Design. No process simulation in detail engineering stage was performed.
    5There is no process simulation performed in FEED, or many discrepancies between process simulation, PFD and Heat and Material Balance were found. No process simulation in detail engineering was performed.
    D2. Heat and Material Balances
    LevelDescription
    1AFC Heat and Material Balance and Process Description were approved without comment. No further design change in Heat and Material Balance is foreseen.
    2Updated Heat and Material Balance and Process description in detail engineering were developed according to Project requirements, as well as Client comments from previous documents and major design changes. Revised Heat and Material Balance and Process description (AFD) were issued. No further major design change in Heat and Material Balance and Process Description is foreseen.
    3Heat and Material Balance and Process Description in detail engineering were developed in line with Project Requirements, and issued with IFA (first revision).
    4There is no discrepancy between PFD, Heat and Mass Balance and Process description in FEED. In addition, they comply with Basis of Design and design capacity margin. No Heat and Material Balance in detail engineering was developed.
    5Many discrepancies between PFD, Process Description and Heat and Material Balance were found. No PFD and Heat and Material Balance in detail engineering were issued.
    D3. Piping and Instrumentation Diagrams
    LevelDescription
    1AFC Piping and Instrumentation Diagram (P&ID) was issued with incorporated Final Equipment P&ID (Vendor) and In-line instrument Vendor data, and approved without comment. All Hazard and operability (HAZOP) recommendations were closed and incorporated in P&ID. No further design change in P&ID is foreseen.
    2Updated P&ID in detail engineering were developed according to Project Requirements, Client comments from previous P&ID and 30% Modeling Punch, and major design changes. Revised P&ID (AFD) was issued. Process HAZOP and Package Unit HAZOP were performed and Process Line List and Line diagram was issued. No further major change in P&ID is foreseen.
    3P&ID in detail engineering was developed in line with Project Requirements, and issued with IFA (first revision). Preliminary Vendor Documents or Value Improving Practices for major equipment was incorporated in IFA P&ID. Hazardous Identification (HAZID) recommendation was incorporated.
    4There is no discrepancy between PFD, Process description, Utility Flow Diagram (UFD), P&ID in FEED. In addition, it complies with Basis of Design and design capacity margin. No P&ID in detail engineering was developed.
    5Many discrepancies between PFD, Process Description, UFD and P&ID were found. No P&ID in detail engineering was issued.
    D4. Process Safety Management
    LevelDescription
    1All HAZOP/HAZID recommendations were concluded and approved by the client. In addition, the relevant engineering deliverables were properly documented and approved.
    2HAZOP for Vendor packaged unit and Contractor’s system were finished based on updated P&IDs. Major HAZOP/HAZID recommendations were concluded and approved by the client.
    3HAZOP has been performed for the Contractor’s system based on P&ID issued by Contractor. Major HAZID recommendations were concluded and approved by the client.
    4HAZID was performed during FEED stage. Environmental/Human/Process/Facility Operation hazards have been defined. HAZOP was not performed.
    5No HAZID was performed during FEED stage. Environmental/Human/Process/Facility Operation hazards have not been defined yet.
    D5. Utility Flow Diagrams
    LevelDescription
    1AFC stage UFD was approved without comment. No further design change in the UFD is foreseen.
    2From incorporating Client comments in UFD, Vendor information for utility consumption and major design changes, revised UFD (AFD) was issued. No further major design change in UFD is foreseen.
    3Heat and Material Balance and UFD in detail engineering were developed in line with Project Requirements, and issued with IFA (first revision).
    4There is no discrepancy between UFD and Heat and Material Balance in FEED. In addition, they comply with Basis of Design. Utility requirements for major consumer were defined through equipment information.
    5Many discrepancies between UFD and Heat and Material Balance in FEED were found. Utility requirements for consumer were estimated only with historical data and no equipment information was developed.
    D6. Process Datasheets
    LevelDescription
    1Final Process datasheets were approved without comment. No further design change in the process datasheet is foreseen.
    2From incorporating Client comments in process datasheet, Selected Vendor’s information and major design changes, the revised process datasheets were issued. No further major design change in process datasheet is foreseen.
    3Process datasheets in detail engineering were developed in line with Project Requirements, and issued with IFA (first revision). Value Improving Practices for major equipment were incorporated in the process datasheet.
    4All process datasheets for major equipment were developed during FEED stage. There is no major discrepancy between FEED P&ID and process datasheets. No process datasheet in detail engineering was developed.
    5No process datasheet was included in FEED packages, or process datasheets were developed for Long Lead Items (LLI) only during FEED stage. There are many discrepancies in FEED P&ID and process datasheets.
    D7. Equipment Mechanical Datasheets
    LevelDescription
    1AFC stage equipment mechanical datasheets were completed with Vendor’s firm information and approved without comment. No further design change in the equipment mechanical datasheet is foreseen.
    2From incorporating Client comments in equipment mechanical datasheet, Selected Vendor’s information and major design changes, the revised equipment mechanical datasheets were issued. No further major design change in equipment mechanical datasheet is foreseen.
    3Equipment mechanical datasheets in detail engineering were developed in line with Project Requirements, and issued with IFA (first revision). Value Improving Practices and applicable Code/Standard requirements for major equipment were incorporated in the equipment mechanical datasheet.
    4All equipment mechanical datasheets for major equipment were developed during FEED stage. There is no major discrepancy between FEED P&ID and equipment mechanical datasheets. No equipment mechanical datasheet in detail engineering was developed.
    5No equipment mechanical datasheet was included in FEED packages, or equipment mechanical datasheets were developed for LLI only during FEED stage. There are many discrepancies in FEED P&ID and equipment mechanical datasheets.
    D8. Specifications
    LevelDescription
    1AFC stage process, mechanical and piping specifications were approved without comment. No further design change in the specification is foreseen.
    2From incorporating Client comments in specification and major design changes, the revised specifications were issued. No further major design change in specification is foreseen.
    3Specifications in detail engineering were developed in line with Project Requirements, and issued with IFA (first revision). The specification includes equipment type, packaged units, piping specifications, protective coating and insulation.
    4All major specifications were developed during FEED stage. There is no major discrepancy between specifications. No specification in detail engineering was developed.
    5No specification was included in FEED packages, or there are many discrepancies in FEED specifications.
    D9. Piping System Requirements
    LevelDescription
    1AFC stage piping material classes were completed with Vendor’s firm information and approved without comment. No further design change in the piping material class is foreseen.
    2From incorporating Client comments in piping material class, additional piping materials and major design changes, the revised piping material class was issued. No further major design change in equipment mechanical datasheet is foreseen.
    3Piping material classes in detail engineering were developed in line with Project Requirements, and issued with IFA (first revision). Value Improving Practices and applicable Code/Standard requirements were incorporated in the piping material class.
    4All piping material classes were developed in line with material selection in FEED stage. All relevant devices including straight runs, elbows, tees, flanges, reducers, manual valves, gaskets, bolts and nuts were defined in the piping material classes.
    5No piping material class was developed during FEED stage, or piping material class was partially developed.
    D10. Plot Plan
    LevelDescription
    1AFC stage plot plan was completed with Vendor’s firm information, 60% and 90% modeling review punch and approved without comment. No further design change in the plot plan is foreseen.
    2From incorporating Client comments in plot plan, 30% modeling review punch and major design changes, the revised plot plan (AFD stage) was issued. No further major design change in plot plan is foreseen.
    3Plot plan in detail engineering was developed in line with Project Requirements and preliminary equipment Vendor documents, and issued with IFA (first revision). Value Improving Practices including process function group and interconnection optimization were incorporated in the plot plan.
    4Plot plan was developed with all equipment, evacuation path, access/handling volume, large diameter pipe (including flexibility requirement), and access way and hazard area risks.
    5Plot plan was developed with limited equipment and device information during FEED stage.
    D11. Project Equipment Lists
    LevelDescription
    1AFC stage project equipment list was completed with Vendor’s firm information and approved without comment.
    2From incorporating Client comments in project equipment datasheet, Vendor information and major design changes, the revised project equipment list was issued. All disciplines’ input was incorporated and no additional equipment in project equipment list is foreseen.
    3Project equipment list in detail engineering was developed in line with Project Requirements, and issued with IFA (first revision). Value Improving Practices and potential Vendor’s information for equipment were incorporated in the package equipment list. Additionally, equipment list includes Vendor name, equipment model, insulation and fire proofing requirements.
    4Project equipment list for all major equipment was developed during FEED stage. There is no major discrepancy between FEED P&ID and equipment list. Equipment list includes tag number, equipment description, equipment type, capacity/quantity, position/module/deck, assumed dimension/weight.
    5Project equipment list was developed for major equipment only during FEED stage. No auxiliary equipment was considered in the project equipment list. There are many discrepancies in project equipment list and P&ID.
    D12. Line Lists
    LevelDescription
    1AFC stage line list was completed with all pipelines and approved without comment.
    2From incorporating Client comments in line list and major design changes in P&IDs, the revised line list (AFD) was issued. All lines over 2” with insulation and Passive Fire Protection (PFP) requirements shall be included in the line list.
    3Line list in detail engineering was developed in line with IFA P&IDs, and issued with IFA (first revision). Line list should include large bore and exotic material lines for 1st MTO for piping materials.
    4Line list for all major pipe route was developed during FEED stage. There is no major discrepancy between FEED P&ID and line list. Line list includes tag number, operating and design condition, pipe specification, insulation/tracing and painting requirement.
    5No line list was developed during FEED stage.
    D13. Tie-in Lists
    LevelDescription
    1AFC stage tie-in list was completed with AFC P&ID, verified with Vendor documents and/or confirmations, and approved without comment.
    2From incorporating Client comments in tie-in list, Vendor documents (General Arrangement Drawing for Equipment) and major design change in P&IDs, the revised tie-in list (AFD) was issued. All lines over 2” with insulation and PFP requirements shall be included in the tie-in list.
    3Tie-in list in detail engineering were developed in line with IFA P&IDs, and issued with IFA (first revision). Tie-in list should crosscheck with preliminary Vendor information for major equipment. Structured process to validate tie-ins and tie-in strategy was documented.
    4Tie-in list for major pipe connections was developed during FEED stage. There is no major discrepancy between FEED P&ID and tie-in list. The tie-in list includes line tag number, reference drawings, pipe specification, and type and size of tie-in.
    5No tie-in list was developed during FEED stage.
    D14. Pipe Stress Analysis
    LevelDescription
    1AFC stage piping stress analysis was completed with AFC P&ID, verified with Vendor documents and/or confirmations, and approved without comment. All support and anchor locations were settled, and no further design change is expected.
    2From incorporating Client comments in piping stress analysis, Vendor information for boundary condition (allowable nozzle load) and major design changes in P&IDs, the revised piping stress analysis (AFD) was performed.
    3Piping stress analysis in detail engineering was conducted in line with IFA P&IDs, and issued with IFA (first revision). Support and anchor locations, and pipe wall thickness were updated as per the piping stress analysis.
    4Guidelines for piping stress analysis were developed in FEED package. Applications for high temperature, large diameter, and heavy wall thickness, upstream and downstream of rotating equipment were well defined.
    5No guidelines for piping stress analysis were developed during FEED stage. FEED package does not specify the extent of piping stress analysis.
    D15. Piping Isometric Drawings
    LevelDescription
    1AFC stage piping isometric drawings were completed with AFC P&ID, and approved without comment. All support and anchor locations were settled, and no further design change is expected.
    2From incorporating Client comments in piping isometric drawings and major design changes in P&IDs, the revised piping isometric drawing (AFD) was generated and submitted.
    3Methodology to generate piping isometric drawing was settled. Piping isometric drawings in detail engineering were generated from 3D modeling, and issued with IFA (first revision). Support and anchor locations, and pipe wall thickness were updated as per the piping stress analysis.
    4Guidelines for piping isometric drawing were developed in FEED package. Requirements for piping isometric drawings were well defined.
    5No guidelines for piping isometric drawing were developed during FEED stage.
    D16. Piping Specialty Items Lists
    LevelDescription
    1AFC stage piping specialty items list was completed with AFC P&ID, and approved without comment. Catalog for 3D modeling was settled, and no further design change is expected.
    2From incorporating Client comments in piping specialty items list and major design changes in P&IDs, the revised piping specialty items list (AFD) was generated and submitted.
    3Piping specialty items list in detail engineering was developed in line with IFA P&IDs, and issued with IFA (first revision). Scope of supply was defined and preliminary Vendor information was given.
    4Guidelines for piping specialty items were developed in FEED package. Types of piping specialty items including strainers, steam traps, flexible hoses, and expansion joints were defined.
    5No guidelines for piping specialty items were developed during FEED stage.
    D17. Instrument Index
    LevelDescription
    1AFC stage instrument index was completed with approved AFC P&ID, and approved without comment. All information on instrument index was settled, and no further design change is expected.
    2From incorporating Client comments in instrument index and major design changes in P&IDs, the revised instrument index (AFD) was generated and submitted. No major change on instrument index is foreseen.
    3Instrument index in detail engineering was developed in line with IFA P&IDs, and issued with IFA (first revision). Information of tag numbers, service conditions, instrument type, and signal output, material of construction, range and set point was provided.
    4Guidelines for instrument index were developed in FEED package. Requirement for instrument index was defined.
    5No guidelines for instrument index were developed during FEED stage.

Appendix D. PDRI-Industrial Hierarchy

* Note: The PDRI section grouping was referred in order to provide a comparison with DECRIS [7]. The sections, basis of project decision and front-end definition, are thus major components of PDRI-Industrial. PDRI focuses on front-end planning and does not represent work packages in the detail engineering stage. The major target of DECRIS is the detail design conducted by EPC contractor; it is thus reasonable that the engineering deliverables of detail engineering is the most important section.
  • Section I—Basis of Project Decision
  • Section II—Front-End Definition
  • Section III—Execution Approach
The Sub-section groupings are: (3 sub-sections and 70 elements—max score 1000)
  • Section I—Basis of Project Decision (5 sub-sections and 22 elements-max score 499)
    AManufacturing Objectives Criteria(3 elements—max score 45)
    BBusiness Objectives(8 elements—max score 213)
    CBasic data research & development(2 elements—max score 94)
    DProject scope(6 elements—max score 120)
    EValue engineering(3 elements—max score 27)
  • Section II—Front-End Definition (6 sub-sections and 33 elements—max score 423)
    FSite Information(6 elements—max score 104)
    GProcess/Mechanical(13 elements—max score 196)
    HEquipment Scope(3 elements—max score 33)
    ICivil, Structural, & Architectural(2 elements—max score 19)
    JInfrastructure(3 elements—max score 25)
    KInstrument & Electrical(6 elements—max score 46)
  • Section III—Execution Approach (4 sub-sections and 15 elements—max score 78)
    LProcurement strategy(3 elements—max score 16)
    MDeliverables(3 elements—max score 9)
    NProject Control(3 elements—max score 17)
    PProject Execution Plan(6 elements—max score 36)

References

  1. Leffler, W.L.; Pattarozzi, R.; Sterling, G. Deepwater Petroleum Exploration & Production: A Nontechnical Guide; PennWell Books: Houston, TX, USA, 2011. [Google Scholar]
  2. Tanmay. Oil & Gas EPC Market Perspective and Comprehensive Analysis to 2023. 2018. Available online: https://theexpertconsulting.com/oil-gas-epc-market-perspective-and-comprehensive-analysis-to-2023/ (accessed on 20 May 2018).
  3. Rijtema, S.; de Haas, R. Creating Sustainable Offshore Developments in the Ultra-Deep Water. In Proceedings of the Offshore Technology Conference, Houston, TX, USA, 4–7 May 2015. [Google Scholar]
  4. Merrow, E.W. Industrial Megaprojects: Concepts, Strategies, and Practices for Success; Wiley: Hoboken, NJ, USA, 2011; Volume 8. [Google Scholar]
  5. Edaily. Available online: http://www.edaily.co.kr/news/news_detail.asp?newsId=03332486612810296&mediaCodeNo=257 (accessed on 10 March 2018).
  6. Ahn, B. Managing the Efficiency of Foreign Engineering Contracts: A Study of a Norwegian and South Korean Project Interface; University of Stavanger: Stavanger, Norway, 2015. [Google Scholar]
  7. Gibson, G.; Dumont, P.R. Project Definition Rating Index (PDRI) for Industrial Projects; Construction Industry Institute Implementation Resource: Texas, Austin, 1996. [Google Scholar]
  8. Bingham, E. Development of the Project Definition Rating Index (PDRI) for Infrastructure Projects; Arizona State University: Tempe, AZ, USA, 2010. [Google Scholar]
  9. Collins, W.A. Development of the Project Definition Rating Index (PDRI) for Small Industrial Projects; Arizona State University: Tempe, AZ, USA, 2015. [Google Scholar]
  10. Collins, W.; Parrish, K.; Gibson, G.E., Jr. Development of a Project Scope Definition and Assessment Tool for Small Industrial Construction Projects. J. Manag. Eng. 2017, 33, 04017015. [Google Scholar] [CrossRef]
  11. Zaheer, S.H.; Fallows, C. Document Project Readiness by Estimate Class Using PDRI; EST. 604; AACE International Transactions: Morgantown, WV, USA, 2011. [Google Scholar]
  12. Bingham, E.; Gibson, G.E., Jr. Infrastructure project scope definition using project definition rating index. J. Manag. Eng. 2016, 33, 04016037. [Google Scholar] [CrossRef]
  13. Dumont, P.R.; Gibson, G.E., Jr.; Fish, J.R. Scope management using project definition rating index. J. Manag. Eng. 1997, 13, 54–60. [Google Scholar] [CrossRef]
  14. Tih-Ju, C.; An-Pi, C.; Chao-Lung, H.; Jyh-Dong, L. Intelligent Green Buildings Project Scope Definition Using Project Definition Rating Index (PDRI). Procedia Econ. Financ. 2014, 18, 17–24. [Google Scholar] [CrossRef]
  15. George, R.; Bell, L.C.; Back, W.E. Critical activities in the front-end planning process. J. Manag. Eng. 2008, 24, 66–74. [Google Scholar] [CrossRef]
  16. Pheng, L.S.; Chuan, Q.T. Environmental factors and work performance of project managers in the construction industry. Int. J. Proj. Manag. 2006, 24, 24–37. [Google Scholar] [CrossRef]
  17. Stenhouse, L. The study of samples and the study of cases. Br. Educ. Res. J. 1980, 6. [Google Scholar] [CrossRef]
  18. Thomson, S.B. Sample size and grounded theory. J. Adm. Gov. 2010, 5, 45–52. [Google Scholar]
  19. Kline, R.B. Principles and Practice of Structural Equation Modeling; Guilford Publications: New York, NY, USA, 2015. [Google Scholar]
Figure 1. Profit losses of EPC Contractor (Modified from Press Release [5]).
Sustainability 10 02469 g001
Figure 2. DECRIS Model Development Flowchart.
Sustainability 10 02469 g002
Figure 3. Sample of Preliminary Elements (Engineering Deliverable).
Sustainability 10 02469 g003
Figure 4. Sample of DECRIS Scoresheet for “Execution Approach” Section.
Sustainability 10 02469 g004
Figure 5. DECRIS Weight for each Section and Category.
Sustainability 10 02469 g005
Figure 6. Correlation between DECRIS Score and Construction Labor Hours Increase Rate (Cost overrun).
Sustainability 10 02469 g006
Figure 7. Correlation between DECRIS Score and Construction Duration Delay.
Sustainability 10 02469 g007
Figure 8. Correlation between PDRI Score and Construction Labor Hours Increase Rate.
Sustainability 10 02469 g008
Figure 9. Research Framework for DECRIS.
Sustainability 10 02469 g009
Table 1. DECRIS Sections, Categories and Elements.
CodeDescriptionCodeDescription
IBasis of Detail designFStructural and Architectural
AProject ScopeF1Structural Requirements
A1Project Objectives StatementF2Structural Analysis
A2Project Scope of WorkF3Structural and Architectural Arrangement Drawing
A3Project PhilosophiesF4Weight Control Report
BProject Performance RequirementGInstrument and Electrical
B1ProductsG1Control Philosophy
B2CapacitiesG2Logic Diagrams
B3TechnologyG3Cable Schedule
B4ProcessesG4Hook-up Diagram
CDesign GuidelineG5Critical Electrical Item lists
C1Process Design CriteriaG6Electrical Single Line Diagrams
C2Project Site AssessmentG7Instrument and electrical Specifications
C3Lead discipline Scope of WorkHMaterial Take-Off
C4Project ScheduleH1Piping MTO (Material Take Off)
C5Constructability AnalysisH2Structural and Architectural MTO
IIEngineering DeliverablesH3Instrument and Electrical Bulk Item MTO
DProcess/Mechanical/PipingI3D modeling
D1Process Flow DiagramsI13D Modeling Review
D2Heat and Material BalancesI23D Modeling Input (Equipment/Piping)
D3Piping and Instrumentation DiagramsI33D Modeling Input (Structural)
D4Process Safety Management (PSM)I43D Modeling Input (Architectural)
D5Utility Flow DiagramsI53D Modeling Input (Instrument and Electrical)
D6Process DatasheetsJGeneral Facility Requirement
D7Equipment Mechanical DatasheetsJ1Preservation and Storage Requirement
D8SpecificationsJ2Transportation Requirement
D9Piping System RequirementsJ3Welding Procedure Specification
D10Plot PlanIIIExecution Approach
D11Mechanical Equipment ListKEngineering Project Management
D12Line ListsK1Team Participants and Roles
D13Tie-in ListsK2Engineering/Construction Methodology
D14Piping Stress AnalysisK3Deliverables for Design and Construction
D15Piping Isometric DrawingsK4Deliverables for Commissioning and Close-out
D16Piping Specialty Items ListsK5Owner Approval Requirements
D17Instrument IndexK6Interface Management and Communication Plan
EEquipment VendorK7Risk Analysis
E1Equipment Procurement StatusK8Identify Long Lead/Critical Equipment and Materials
E2In-line and Instrument Procurement StatusLProject Execution Plan
E3Equipment General Arrangement DrawingsL1Project Cost Estimate and Control
E4Process and Mechanical DocumentsL2Procurement Procedures and Plans
E5Instrument and Electrical DocumentsL3Project Change Control
E6Structural and Architectural Documents
E7Equipment Utility Requirements
Table 2. Categories and Elements for each Section.
SectionNo of CategoryNo of Element
Basis of Detail Design312
Engineering Deliverables746
Execution Approach211
Total1269
Table 3. Experience Information of Participants for the DECRIS model.
DetailsNumber
Participant32 people
Overall Experience425 years
Over 10 years of Experience25 people
Director2 people
Team Leader/Department Head9 people
Project Management Professionals (PMPs)5 people
Table 4. Comparison between DECRIS, PDRI-Industrial and PDRI Infrastructure.
DECRISPDRI-IndustrialPDRI Infrastructure
SectorOffshore Oil and Gas
(>500M USD)
General Industrial
(>10M USD)
Infrastructure
Project phaseDetail DesignFront-End PlanningPlanning
No of section333
Section #1 aBasis of Detail Design(16.6%)Basis of Project Decision(49.9%)Basis of Project Decision(43.7%)
Section #2 aEngineering Deliverable(67.3%)Front-End Definition(42.3%)Basis of Design(29.3%)
Section #3 aExecution Approach(16.1%)Execution Approach(7.8%)Execution Approach(27.0%)
No of category121413
No of element697067
a The percent means each section’s portion of the overall score.
Table 5. Selection of Sample Offshore EPC Project.
ProjectTypeSteel CuttingHand-OverDECRIS Score
AFixed2012-07-132015-07-15346
BFloater2011-07-012015-02-14446
CFixed2012-04-022013-08-27250
DFloater2012-09-072015-12-17304
EFixed2013-09-162015-06-30299
FFloater2014-06-132017-07-15367
GFloater2013-10-042015-11-30367
HFloater2014-05-022016-10-03389
IFixed2015-03-032017-02-20264
JFixed2015-09-152016-11-28248
KFixed2016-01-252017-05-12273
LFixed2008-09-232013-11-14258
MFixed2011-03-042012-11-21324
XFixed2016-07-012020-05-08368
Table 6. Impact on Construction in the Sample Projects.
ProjectCLIR 1 (%)CDD 2 (days)ProjectCLIR (%)CDD (days)
B17.14%411L0.82%105
H8.71%246E1.61%82
F6.09%305K2.44%16
G6.02%210I2.84%82
A3.37%246C2.22%-6
D4.06%102J3.24%0
M9.70%111
1 CLIR = Construction labor hours increase rate; 2 CDD = Construction duration delay.
Table 7. Group of the Sample Projects based on DECRIS Score of 300.
ProjectGroupDECRIS ScoreCLIR (%)CDD (days)ProjectGroupDECRIS ScoreCLIR (%)CDD (days)
BHigh44617.14411Elow2991.6182
HHigh3898.71246Klow2732.4416
FHigh3676.09305Ilow2642.8482
GHigh3676.02210Clow2502.22−6
AHigh3463.37246Jlow2483.240
DHigh3044.06102LLow2580.82105
CLIR = Construction labor hours increase rate; CDD = Construction duration delay.

