Sustainable Land Management, Adaptive Silviculture, and New Forest Challenges: Evidence from a Latitudinal Gradient in Italy

 , ,
, ,  and
and
Abstract
:1. Introduction
2. Materials and Methods
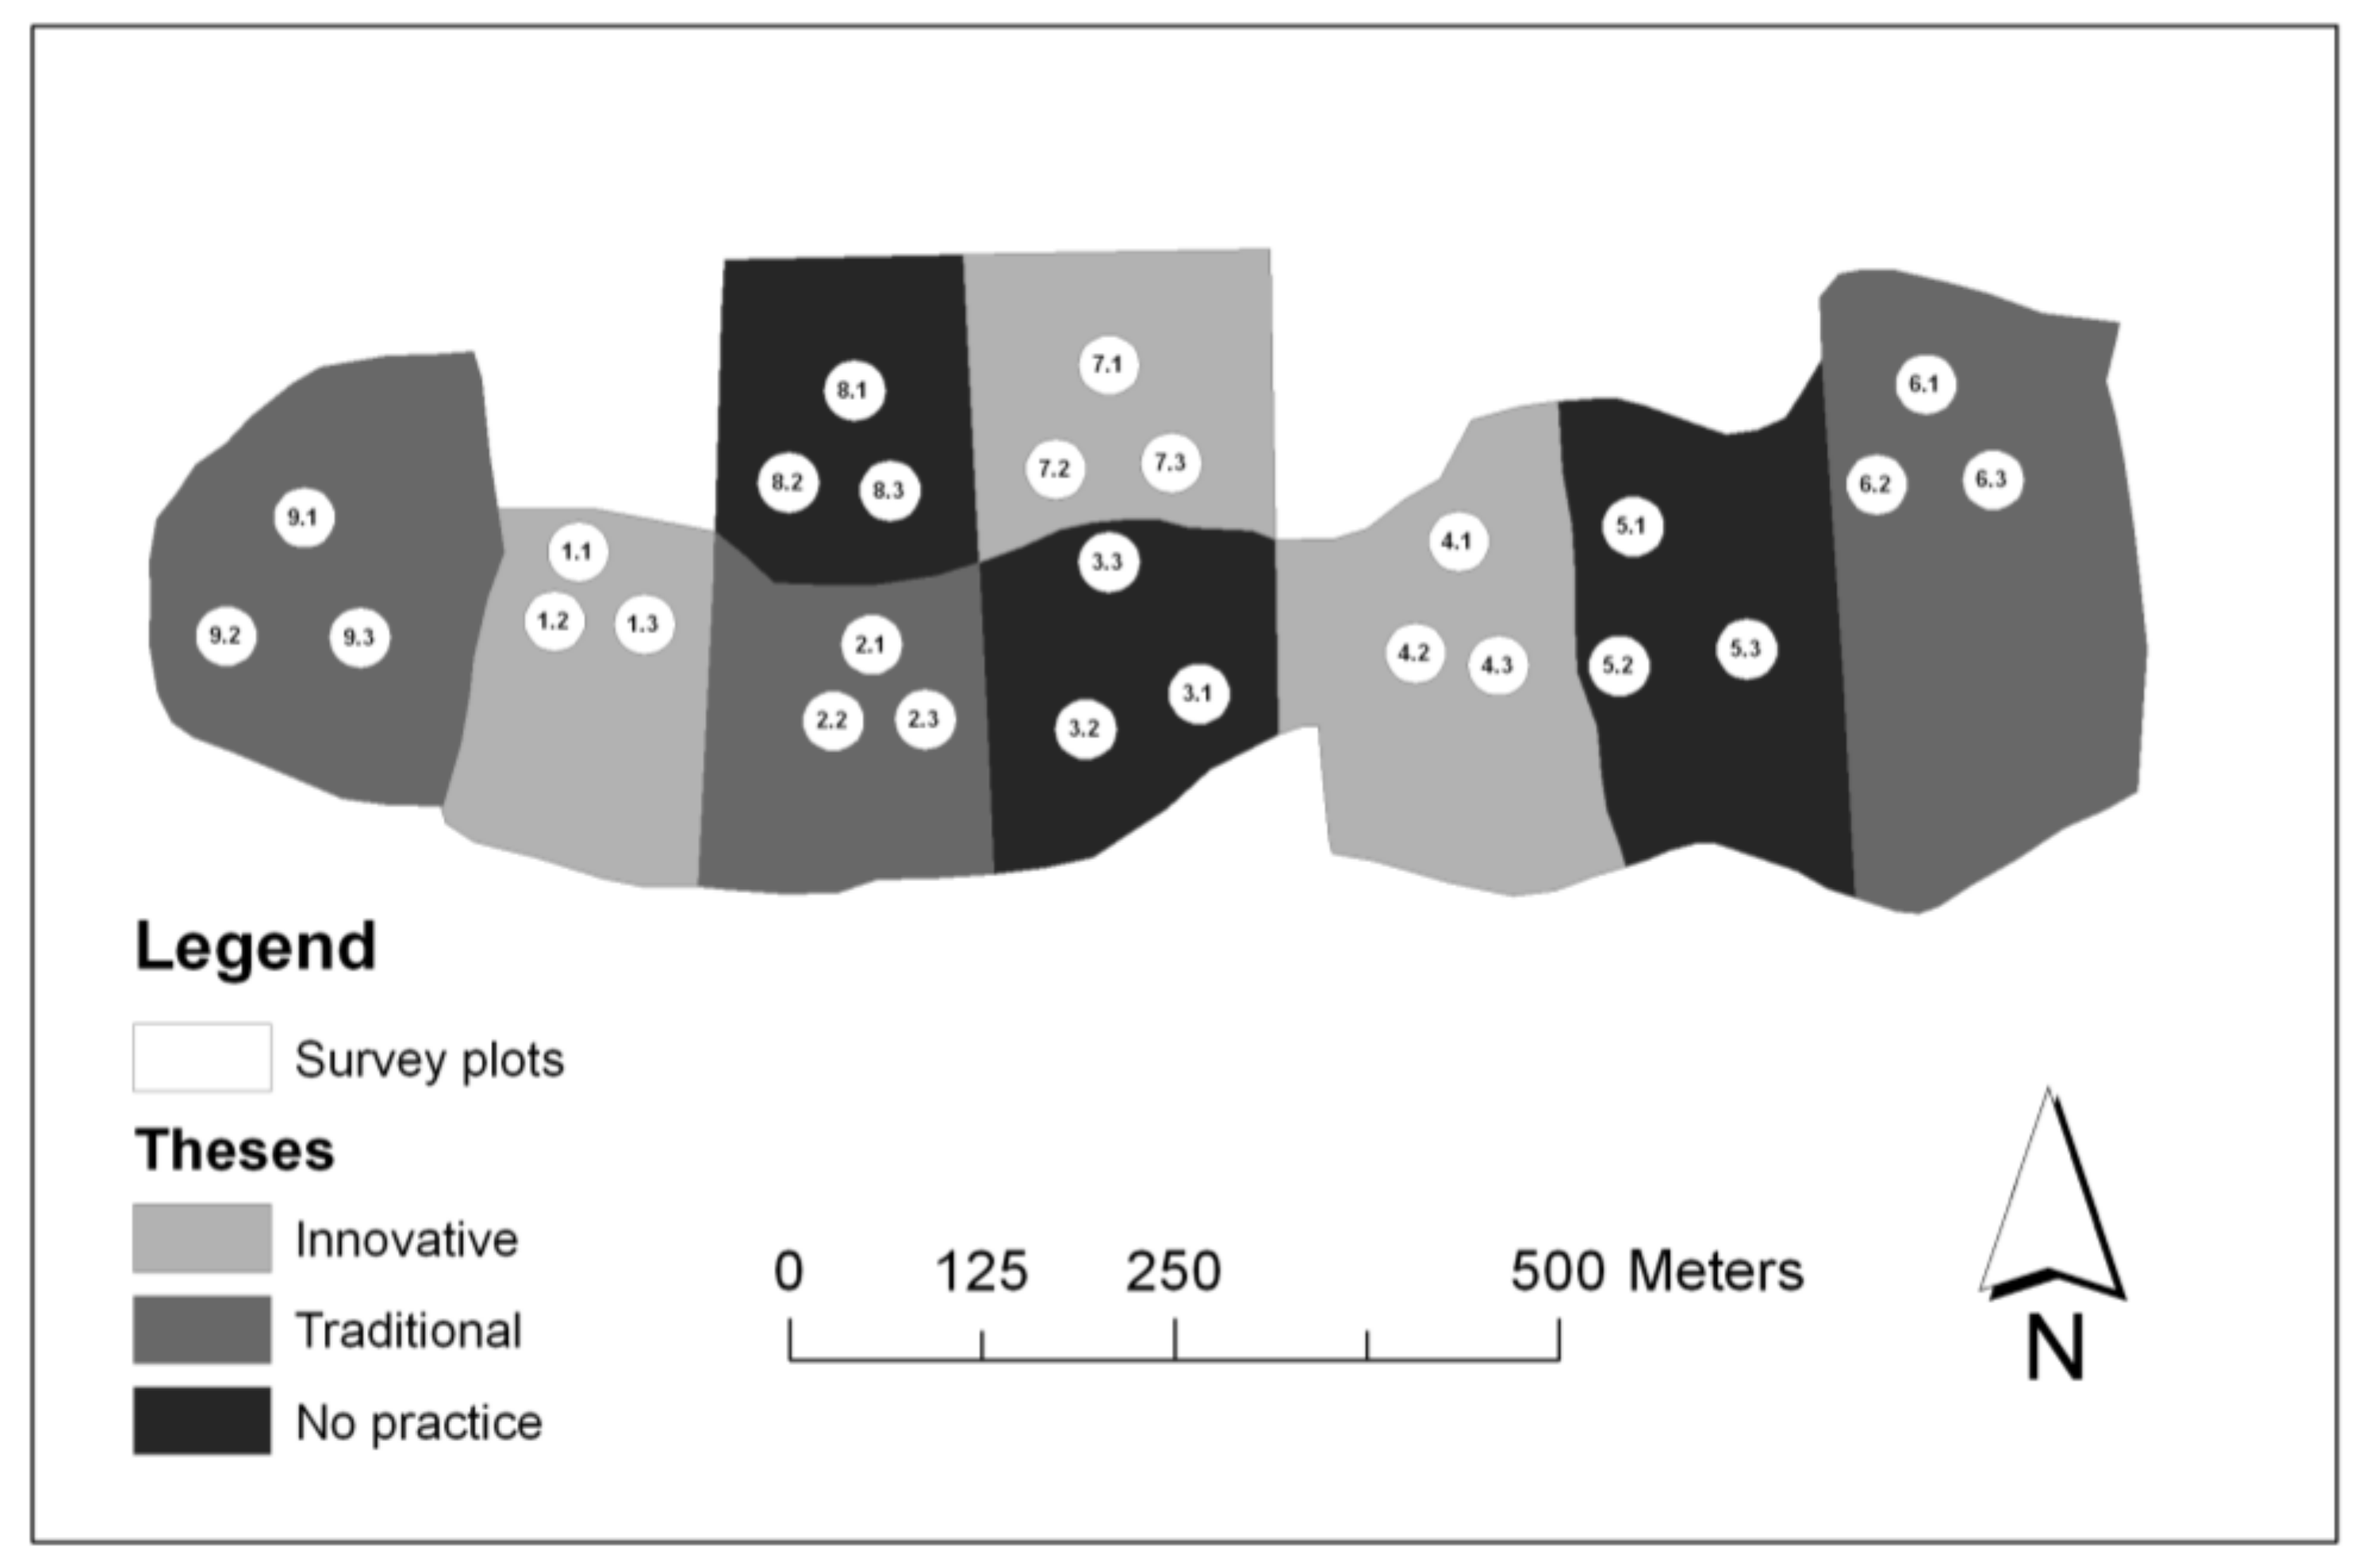
2.1. Study Area
2.2. Logical Framework
2.3. Statistical Analysis
3. Results
4. Discussion
5. Conclusions
Author Contributions
Funding
Acknowledgments
Conflicts of Interest
References
- Seppelt, R.; Dormann, C.F.; Eppink, F.V.; Lautenbach, S.; Schmidt, S. A quantitative review of ecosystem service studies: Approaches, shortcomings and the road ahead. J. Appl. Ecol. 2011, 48, 630–636. [Google Scholar] [CrossRef]
- Ray, D.; Petr, M.; Mullett, M.; Bathgate, S.; Marchi, M.; Beauchamp, K. A simulation-based approach to assess forest policy options under biotic and abiotic climate change impacts: A case study on Scotland’s National Forest Estate. For. Policy Econ. 2017. [Google Scholar] [CrossRef]
- Franklin, J.F.; Spies, T.A.; Van Pelt, R.; Carey, A.B.; Thornburgh, D.A.; Berg, D.R.; Lindenmayer, D.B.; Harmon, M.E.; Keeton, W.S.; Shaw, D.C.; et al. Disturbances and structural development of natural forest ecosystems with silvicultural implications, using Douglas-fir forests as an example. For. Ecol. Manag. 2002, 155, 399–423. [Google Scholar] [CrossRef]
- Mc Elhinny, C.; Gibbons, P.; Brack, C.; Bauhus, J. Forest and woodland stand structural complexity: Its definition and measurement. For. Ecol. Manag. 2005, 218, 1–24. [Google Scholar] [CrossRef]
- Spiecker, H. Overview of recent growth trends in European forests. Water Air Soil Pollut. 1999, 116, 33–46. [Google Scholar] [CrossRef]
- Pretzsch, H.; Biber, P.; Schütze, G.; Uhl, E.; Rötzer, T. Forest stand growth dynamics in Central Europe have accelerated since 1870. Nat. Commun. 2014, 5, 4967. [Google Scholar] [CrossRef] [PubMed] [Green Version]
- Schall, P.; Ammer, C. How to quantify forest management intensity in Central European forests. Eur. J. For. Res. 2013, 132, 379–396. [Google Scholar] [CrossRef] [Green Version]
- Marchi, M.; Paletto, A.; Cantiani, P.; Bianchetto, E.; De Meo, I. Comparing Thinning System Effects on Ecosystem Services Provision in Artificial Black Pine (Pinus nigra J. F. Arnold) Forests. Forests 2018, 9, 188. [Google Scholar] [CrossRef]
- Ferretti, M.; Marchetto, A.; Arisci, S.; Bussotti, F.; Calderisi, M.; Carnicelli, S.; Cecchini, G.; Fabbio, G.; Bertini, G.; Matteucci, G.; et al. On the tracks of Nitrogen deposition effects on temperate forests at their southern European range—An observational study from Italy. Glob. Chang. Biol. 2014, 20, 3423–3438. [Google Scholar] [CrossRef] [PubMed]
- Salvati, L.; Petitta, M.; Ceccarelli, T.; Perini, L.; Di Battista, F.; Scarascia, M.E.V. Italy’s renewable water resources as estimated on the basis of the monthly water balance. Irrig. Drain. 2008, 57, 507–515. [Google Scholar] [CrossRef]
- Grilli, G.; Nikodinoska, N.; Paletto, A.; De Meo, I. Stakeholders’ preferences and economic value of forest ecosystem services: An example in the Italian alps. Balt. For. 2015, 21, 298–307. [Google Scholar]
- Meeus, J.H.A.; Wijermans, M.P.; Vroom, M.J. Agricultural landscapes in Europe and their transformation. Landsc. Urban Plan. 1990, 18, 289–352. [Google Scholar] [CrossRef]
- Marchi, M.; Chiavetta, U.; Cantiani, P. Assessing the mechanical stability of trees in artificial plantations of Pinus nigra J. F. Arnold using the LWN tool under different site indexes. Ann. Silvic. Res. 2017, 41, 48–53. [Google Scholar] [CrossRef]
- Barbati, A.; Corona, P.; Salvati, L.; Gasparella, L. Natural forest expansion into suburban countryside: Gained ground for a green infrastructure? Urban For. Urban Green. 2013, 12, 36–43. [Google Scholar] [CrossRef] [Green Version]
- Corona, P.; Cutini, A.; Chiavetta, U.; Paoletti, E. Forest-food nexus: A topical opportunity for human well-being and silviculture. Ann. Silvic. Res. 2016, 40, 1–10. [Google Scholar] [CrossRef]
- Tomao, A.; Antonio, J.; Martínez, J.; Aragón, D. Is silviculture able to enhance wild forest mushroom resources? Current knowledge and future perspectives. For. Ecol. Manag. 2017, 402, 102–114. [Google Scholar] [CrossRef]
- Duncker, P.S.; Raulund-Rasmussen, K.; Gundersen, P.; Katzensteiner, K.; De Jong, J.; Ravn, H.P.; Smith, M.; Eckmüllner, O.; Spiecker, H. How forest management affects ecosystem services, including timber production and economic return: Synergies and trade-offs. Ecol. Soc. 2012, 17, 50. [Google Scholar] [CrossRef]
- Pretzsch, H. Forest Dynamics, Growth and Yield; Springer: Berlin/Heidelberg, Germany, 2009; ISBN 978-3-540-88306-7. [Google Scholar]
- Bertini, G.; Amoriello, T.; Fabbio, G.; Piovosi, M. Forest growth and climate change: Evidences from the ICP-Forests intensive monitoring in Italy. iForest-Biogeosci. For. 2011, 4, 262–267. [Google Scholar] [CrossRef]
- Marchi, M.; Ferrara, C.; Bertini, G.; Fares, S.; Salvati, L. A sampling design strategy to reduce survey costs in forest monitoring. Ecol. Indic. 2017, 81, 182–191. [Google Scholar] [CrossRef]
- O’Hara, K.L. What is close-to-nature silviculture in a changing world? Forestry 2016, 89, 1–6. [Google Scholar] [CrossRef]
- Fabbio, G.; Cantiani, P.; Ferretti, F.; Chiavetta, U.; Bertini, G.; Becagli, C.; Di Salvatore, U.; Bernardini, V.; Tomaiuolo, M.; Matteucci, G.; et al. Adaptive silviculture to face up to the new challenges: The ManForC.BD experience. In Proceedings of the 2nd International Congress of Silviculture, Florence, Italy, 26–29 November 2014; pp. 531–538. [Google Scholar]
- Bengtsson, J.; Nilsson, S.G.; Franc, A.; Menozzi, P. Biodiversity, disturbances, ecosystem function and management of European forests. For. Ecol. Manag. 2000, 132, 39–50. [Google Scholar] [CrossRef]
- Millar, C.I.; Stephenson, N.L.; Stephens, S.L. Climate change and forests of the future: Managing in the face of uncertainty. Ecol. Appl. 2007, 17, 2145–2151. [Google Scholar] [CrossRef] [PubMed]
- Milad, M.; Schaich, H.; Bürgi, M.; Konold, W. Climate change and nature conservation in Central European forests: A review of consequences, concepts and challenges. For. Ecol. Manag. 2011, 261, 829–843. [Google Scholar] [CrossRef]
- Nabuurs, G.J.; Lindner, M.; Verkerk, P.J.; Gunia, K.; Deda, P.; Michalak, R.; Grassi, G. First signs of carbon sink saturation in European forest biomass. Nat. Clim. Chang. 2013, 3, 792–796. [Google Scholar] [CrossRef] [Green Version]
- Seidl, R.; Schelhaas, M.J.; Rammer, W.; Verkerk, P.J. Increasing forest disturbances in Europe and their impact on carbon storage. Nat. Clim. Chang. 2014, 4, 806–810. [Google Scholar] [CrossRef] [PubMed] [Green Version]
- Magnani, F.; Mencuccini, M.; Borghetti, M.; Berbigier, P.; Berninger, F.; Delzon, S.; Grelle, A.; Hari, P.; Jarvis, P.G.; Kolari, P.; et al. The human footprint in the carbon cycle of temperate and boreal forests. Nature 2007, 447, 848–850. [Google Scholar] [CrossRef] [PubMed]
- De Vries, W.; Solberg, S.; Dobbertin, M.; Sterba, H.; Laubhahn, D.; Reinds, G.J.; Nabuurs, G.-J.; Gundersen, P.; Sutton, M.A. Ecologically implausible carbon response? Nature 2008, 451, E1–E3. [Google Scholar] [CrossRef] [PubMed]
- Ferrara, C.; Carlucci, M.; Grigoriadis, E.; Corona, P.; Salvati, L. A comprehensive insight into the geography of forest cover in Italy: Exploring the importance of socioeconomic local contexts. For. Policy Econ. 2017, 75, 12–22. [Google Scholar] [CrossRef]
- Solberg, S.; Dobbertin, M.; Reinds, G.J.; Lange, H.; Andreassen, K.; Fernandez, P.G.; Hildingsson, A.; de Vries, W. Analyses of the impact of changes in atmospheric deposition and climate on forest growth in European monitoring plots: A stand growth approach. For. Ecol. Manag. 2009, 258, 1735–1750. [Google Scholar] [CrossRef]
- Etzold, S.; Waldner, P.; Thimonier, A.; Schmitt, M.; Dobbertin, M. Tree growth in Swiss forests between 1995 and 2010 in relation to climate and stand conditions: Recent disturbances matter. For. Ecol. Manag. 2014, 311, 41–55. [Google Scholar] [CrossRef]
- Stephenson, N.L.; Das, A.J.; Condit, R.; Russo, S.E.; Baker, P.J.; Beckman, N.G.; Coomes, D.A.; Lines, E.R.; Morris, W.K.; Rüger, N.; et al. Rate of tree carbon accumulation increases continuously with tree size. Nature 2014, 507, 90–93. [Google Scholar] [CrossRef] [PubMed] [Green Version]
- Biasi, R.; Colantoni, A.; Ferrara, C.; Ranalli, F.; Salvati, L. In-between sprawl and fires: Long-term forest expansion and settlement dynamics at the wildland-urban interface in Rome, Italy. Int. J. Sustain. Dev. World Ecol. 2015, 22, 467–475. [Google Scholar] [CrossRef]
- Bajocco, S.; Ceccarelli, T.; Smiraglia, D.; Salvati, L.; Ricotta, C. Modeling the ecological niche of long-term land use changes: The role of biophysical factors. Ecol. Indic. 2016, 60, 231–236. [Google Scholar] [CrossRef]
- Fabbio, G.; Merlo, M.; Tosi, V. Silvicultural management in maintaining biodiversity and resistance of forests in Europe—the Mediterranean region. J. Environ. Manag. 2003, 67, 67–76. [Google Scholar] [CrossRef]
- Fares, S.; Mugnozza, G.S.; Corona, P.; Palahi, M. Five steps for managing Europe’s forests. Nature 2015, 519, 7–9. [Google Scholar] [CrossRef] [PubMed]
- Dobbertin, M. Tree growth as indicator of tree vitality and of tree reaction to environmental stress: A review. Eur. J. For. Res. 2005, 124, 319–333. [Google Scholar] [CrossRef]
- Lindner, M.; Maroschek, M.; Netherer, S.; Kremer, A.; Barbati, A.; Garcia-Gonzalo, J.; Seidl, R.; Delzon, S.; Corona, P.; Kolström, M.; et al. Climate change impacts, adaptive capacity, and vulnerability of European forest ecosystems. For. Ecol. Manag. 2010, 259, 698–709. [Google Scholar] [CrossRef]
- Colantoni, A.; Ferrara, C.; Perini, L.; Salvati, L. Assessing trends in climate aridity and vulnerability to soil degradation in Italy. Ecol. Indic. 2015, 48, 599–604. [Google Scholar] [CrossRef]
- Torras, O.; Saura, S. Effects of silvicultural treatments on forest biodiversity indicators in the Mediterranean. For. Ecol. Manag. 2008, 255, 3322–3330. [Google Scholar] [CrossRef]
- Levin, S.A. Ecosystems and the Biosphere as Complex Adaptive Systems. Ecosystems 1998, 1, 431–436. [Google Scholar] [CrossRef]
- Ringold, P.L.; Alegria, J.; Czaplewski, R.L.; Mulder, B.S.; Tolle, T.; Burnett, K. Adaptive monitoring design for ecosystem management. Ecol. Appl. 1996, 6, 745–747. [Google Scholar] [CrossRef]
- Kelly, C.; Ferrara, A.; Wilson, G.A.; Ripullone, F.; Nolè, A.; Harmer, N.; Salvati, L. Community resilience and land degradation in forest and shrubland socio-ecological systems: Evidence from Gorgoglione, Basilicata, Italy. Land Use Policy 2015, 46, 11–20. [Google Scholar] [CrossRef]
- Karamesouti, M.; Detsis, V.; Kounalaki, A.; Vasiliou, P.; Salvati, L.; Kosmas, C. Land-use and land degradation processes affecting soil resources: Evidence from a traditional Mediterranean cropland (Greece). Catena 2015, 132, 45–55. [Google Scholar] [CrossRef]
- Salvati, L.; Becagli, C.; Bertini, G.; Cantiani, P.; Ferrara, C.; Fabbio, G. Toward sustainable forest management indicators? A data mining approach to evaluate the impact of silvicultural practices on stand structure. Int. J. Sustain. Dev. World Ecol. 2016, 24, 372–382. [Google Scholar] [CrossRef]
- Latham, P.; Zuuring, H.; Coble, D. A Method for Quantifying Vertical Forest Structure. For. Ecol. Manag. 1998, 104, 157–170. [Google Scholar] [CrossRef]
- Neumann, M.; Starlinger, F. The significance of different indices for stand structure and diversity in forests. For. Ecol. Manag. 2001, 145, 91–106. [Google Scholar] [CrossRef]
- Fardusi, M.J.; Castaldi, C.; Chianucci, F.; Corona, P.; Mason, F.; Minari, E.; Puletti, N. A spatio-temporal dataset of forest mensuration for the analysis of tree species structure and diversity in semi-natural mixed floodplain forests. Ann. For. Sci. 2018, 75, 11. [Google Scholar] [CrossRef] [Green Version]
- Del Río, M.; Bravo-Oviedo, A.; Pretzsch, H.; Löf, M.; Ruiz-Peinado, R. A review of thinning effects on Scots pine stands: From growth and yield to new challenges under global change. For. Syst. 2017, 26, eR03S. [Google Scholar] [CrossRef]
- Becagli, C.; Puletti, N.; Chiavetta, U.; Cantiani, P.; Salvati, L.; Fabbio, G. Early impact of alternative thinning approaches on structure diversity and complexity at stand level in two beech forests in Italy. Ann. Silvic. Res. 2013, 37, 55–63. [Google Scholar] [CrossRef]
- Chiavetta, U.; Skudnik, M.; Becagli, C.; Bertini, G.; Ferretti, F.; Cantiani, P.; Di Salvatore, U.; Fabbio, G. Diversity of structure through silviculture. Ital. J. Agron. 2016, 11, 18–22. [Google Scholar]
- Tabacchi, G.; Di Cosmo, L.; Gasparini, P.; Morelli, S. Stima del Volume e della Fitomassa delle Principali Specie Forestali Italiane, Equazioni di Previsione, Tavole del Volume e Tavole della Fitomassa Arborea Epigea; Consiglio per la Ricerca e la Sperimentazione in Agricoltura, Unita di Ricerca per il Monitoraggio e la Pianificazione Forestale: Trento, Italy, 2011; ISBN 9788897081111. [Google Scholar]
- Cantiani, P.; Marchi, M. A spatial dataset of forest mensuration collected in black pine plantations in central Italy. Ann. For. Sci. 2017, 74, 50. [Google Scholar] [CrossRef]
- Chianucci, F.; Salvati, L.; Giannini, T.; Chiavetta, U.; Corona, P.; Cutini, A. Long-term response to thinning in a beech (Fagus sylvatica L.) coppice stand under conversion to high forest in central Italy. Silva Fenn. 2016, 50, 1549. [Google Scholar] [CrossRef]
- Cutini, A.; Chianucci, F.; Giannini, T.; Manetti, M.C.; Salvati, L. Is anticipated seed cutting an effective option to accelerate transition to high forest in European beech (Fagus sylvatica L.) coppice stands? Ann. For. Sci. 2015, 72, 631–640. [Google Scholar] [CrossRef]
- Zitti, M.; Ferrara, C.; Perini, L.; Carlucci, M.; Salvati, L. Long-Term Urban Growth and Land Use Efficiency in Southern Europe: Implications for Sustainable Land Management. Sustainability 2015, 7, 3359–3385. [Google Scholar] [CrossRef] [Green Version]
- Salvati, L.; Ferrara, A.; Mancino, G.; Kelly, C.; Chianucci, F.; Corona, P. A Multidimensional Statistical Framework to Explore Seasonal Profile, Severity and Land-Use Preferences of Wildfires in a Mediterranean Country. Int. For. Rev. 2015, 17, 485–497. [Google Scholar] [CrossRef]
- Salvati, L.; Carlucci, M. The economic and environmental performances of rural districts in Italy: Are competitiveness and sustainability compatible targets? Ecol. Econ. 2011, 70, 2446–2453. [Google Scholar] [CrossRef]
- Salvati, L.; Zitti, M. The Environmental “Risky” Region: Identifying Land Degradation Processes Through Integration of Socio-Economic and Ecological Indicators in a Multivariate Regionalization Model. Environ. Manag. 2009, 44, 888–898. [Google Scholar] [CrossRef] [PubMed]
- Pommerening, A.; Särkkä, A. What mark variograms tell about spatial plant interactions. Ecol. Model. 2013, 251, 64–72. [Google Scholar] [CrossRef]
- Zenner, E.K.; Hibbs, D.E. A new method for modeling the heterogeneity of forest structure. For. Ecol. Manag. 2000, 129, 75–87. [Google Scholar] [CrossRef]
- Staudhammer, C.L.; LeMay, V.M. Introduction and evaluation of possible indices of stand structural diversity. Can. J. For. Res. 2001, 31, 1105–1115. [Google Scholar] [CrossRef]
- Pretzsch, H. Canopy space filling and tree crown morphology in mixed-species stands compared with monocultures. For. Ecol. Manag. 2014, 327, 251–264. [Google Scholar] [CrossRef]
- Cabon, A.; Mouillot, F.; Lempereur, M.; Ourcival, J.-M.; Simioni, G.; Limousin, J.-M. Thinning increases tree growth by delaying drought-induced growth cessation in a Mediterranean evergreen oak coppice. For. Ecol. Manag. 2018, 409, 333–342. [Google Scholar] [CrossRef]
- Jonard, M.; Misson, L.; Ponette, Q. Long-term thinning effects on the forest floor and the foliar nutrient status of Norway spruce stands in the Belgian Ardennes. Can. J. For. Res. 2006, 36, 2684–2695. [Google Scholar] [CrossRef]
- Fichtner, A.; Sturm, K.; Rickert, C.; von Oheimb, G.; Härdtle, W. Crown size-growth relationships of European beech (Fagus sylvatica L.) are driven by the interplay of disturbance intensity and inter-specific competition. For. Ecol. Manag. 2013, 302, 178–184. [Google Scholar] [CrossRef]
- Winter, S.; Möller, G.C. Microhabitats in lowland beech forests as monitoring tool for nature conservation. For. Ecol. Manag. 2008, 255, 1251–1261. [Google Scholar] [CrossRef]
- Mathys, A.; Coops, N.C.; Waring, R.H. Soil water availability effects on the distribution of 20 tree species in western North America. For. Ecol. Manag. 2014, 313, 144–152. [Google Scholar] [CrossRef]
- Salvati, L.; Zitti, M.; Ceccarelli, T. Integrating economic and environmental indicators in the assessment of desertification risk: A case study. Appl. Ecol. Environ. Res. 2008, 6, 129–138. [Google Scholar] [CrossRef]
- Salvati, L.; Zitti, M. Land degradation in the Mediterranean basin: Linking bio-physical and economic factors into an ecological perspective. Biota 2005, 5, 67–77. [Google Scholar]
- Pommerening, A. Approaches to quantifying forest structures. Forestry 2002, 75, 305–324. [Google Scholar] [CrossRef] [Green Version]
- Recanatesi, F.; Clemente, M.; Grigoriadis, S.; Ranalli, F.; Zitti, M.; Salvati, L. A fifty-years sustainability assessment of Italian Agro-forest Districts. Sustainability 2016, 8, 32. [Google Scholar] [CrossRef]


| Variable | Site Characteristic | |
|---|---|---|
| Cansiglio | Vallombrosa | |
| Area (ha) | 30–35 | 30 |
| Geographical coordinates (UTM-WGS84) | 46°03′ N, 12°23′ E | 43°44′ N, 11°34′ E |
| Altitudinal range (m at sea level) | 1100–1200 | 470–1440 |
| Landscape morphology | Gently sloping mountainsides and plains | Gently sloping mountainsides |
| Bedrock | Limestone, marlstone (Cretaceous) | Sandstone (Chianti formation) |
| Mean Temp (°C) | 5.6 | 9.7 |
| Max. Temp (°C, average warmest month) | 14.8, August | 24.1, July |
| Min. Temp (°C, average coldest month) | −4.0, January | −0.8, January |
| Total Rainfall (mm) | 2004 | 1337 |
| Chiarano | Marchesale | |
| Area (ha) | 30 | 30 |
| Geographical coordinates (UTM-WGS84) | 41°51′ N, 13°57′ E | 38°30′ N, 16°14′ E |
| Elevation range (m a.s.l.) | 1700–1800 | 1100 |
| Landscape morphology | upper mountain slope range 22° ÷ 28.5° | uneven mountain terrain (slope up to 40%) |
| Bedrock | cretaceous limestone | granite (Serra and Sila formation) |
| Mean Temp (°C) | 8.5 | 10.1 |
| Max. Temp (°C, average warmest month) | 17.0, July | 18.4, July |
| Min. Temp (°C, average coldest month) | −0.2, January | 2.2, February |
| Total Rainfall (mm) | 1000 | 1808 |
| Acronym | Name | Short Description | Unit/Algorithm | Variable |
|---|---|---|---|---|
| Den | Tree density (M) | N ha−1 | ||
| Bas | Tree basal area (M) | m² ha−1 | ||
| Hei | Mean tree height (M) | m | ||
| Dia | Mean tree diameter (M) | cm | ||
| Bio | Tree biomass (M) | (dry weight) | Mg ha−1 | |
| CE | Clark Evans index 1(S) | Horizontal structure-index of aggregation | rA/rE | HDistij = Euclidean distance between ith tree and its nearest neighbor A = plot area N = plot tree number |
| W | Contagion index 2 (S) | Horizontal structure—index of neighborhood pattern | = 1 αj < α0 = 0 otherwise | |
| A | Species profile index 3 (S) | Vertical structure—index of specific abundance in the profile | S = number of different tree species B = number of height bands = 3 | |
| T | Diameter differentiation index 4 (S) | Dimensional structure—spatial distribution of tree sizes | ri = (thinner dbh)/(thicker dbh) of tree pair i n = number of measured tree pairs | |
| CVdbh | Diameter at breast height (dbh) coefficient of variation (S) | Dimensional structure—relative variability of tree size distribution | % |
| Variable | Cansiglio | Vallombrosa | Chiarano | Marchesale |
|---|---|---|---|---|
| Tree density | 323 ± 65.9 | 532 ± 117 | 1367 ± 353 | 510 ± 130 |
| Basal area (m2) | 40.9 ± 5.2 | 54.9 ± 3.5 | 38.8 ± 4.4 | 41.2 ± 7.3 |
| Mean height (m) | 26.6 ± 0.5 | 28.2 ± 1.6 | 14.3 ± 0.8 | 23.3 ± 1.5 |
| Mean dbh (cm) | 40.6 ± 3 | 37.3 ± 5.6 | 19.4 ± 2.4 | 32.9 ± 6.1 |
| Dominant dbh (cm) | 49 ± 3.6 | 50.5 ± 6.0 | 35.8 ± 4.6 | 54.0 ± 6.8 |
| Dominant height (m) | 27 ± 0.6 | 31.9 ± 1.2 | 18.0 ± 0.9 | 27.7 ± 1.2 |
| Standing volume (m3) | 543 ± 72 | 795 ± 80.3 | 183 ± 24.4 | 497 ± 110.8 |
| Variable | Cansiglio | Vallombrosa | ||||||||
|---|---|---|---|---|---|---|---|---|---|---|
| Before Thinning | After Thinning | Before Thinning | After Thinning | |||||||
| Innovative | Customary | Innov. | Custom. | Innov. | Custom. | Innov. | Custom. | |||
| Tree density | 320 | 326 | 187 | 235 | 511 | 598 | 316 | 567 | ||
| Basal area (m2) | 41.8 | 40.7 | 26.3 | 30.3 | 56.9 | 54.3 | 36.4 | 52.6 | ||
| Mean height (m) | 26.8 | 26.5 | 27.0 | 26.5 | 28.5 | 27.7 | 26.4 | 25.3 | ||
| Mean dbh (cm) | 40.3 | 40.1 | 43.7 | 40.5 | 38.5 | 34.5 | 30.0 | 27.0 | ||
| Dominant dbh (cm) | 49.6 | 47.8 | 48.1 | 46.9 | 61.0 | 50.1 | 58.9 | 50.1 | ||
| Dominant height (m) | 27.8 | 27.6 | 27.0 | 26.6 | 33.6 | 31.4 | 33.2 | 31.4 | ||
| Standing volume (m3) | 561 | 529 | 358 | 402 | 838 | 768 | 542 | 741 | ||
| Bio | 360.6 ± 35 | 342.6 ± 53 | 230.8 ± 43 | 287.8 ± 32 | 495.0 ± 87 | 472.5 ± 130 | 321.75 ± 17 | 496.13 ± 28 | ||
| CE | 1.25 ± 0.12 | 1.26 ± 0.1 | 1.4 ± 0.2 | 1.34 ± 0.1 | 1.33 ± 0.11 | 1.28 ± 0.10 | 1.38 ± 0.12 | 1.28 ± 0.1 | ||
| W | 0.63 ± 0.02 | 0.63 ± 0.03 | 0.65 ± 0.11 | 0.63 ± 0.12 | 0.63 ± 0.07 | 0.62 ± 0.03 | 0.67 ± 0.16 | 0.62 ± 0.13 | ||
| A | 0.40 ± 0.11 | 0.38 ± 0.12 | 0.39 ± 0.12 | 0.37 ± 0.15 | 0.85 ± 0.16 | 0.85 ± 0.13 | 0.84 ± 0.14 | 0.85 ± 0.16 | ||
| T | 0.17 ± 0.04 | 0.18 ±0.04 | 0.18 ± 0.04 | 0.17 ± 0.03 | 0.21 ± 0.04 | 0.23 ± 0.05 | 0.24 ± 0.04 | 0.23 ± 0.04 | ||
| CVdbh | 20.1 ± 5.0 | 19.3 ± 4.40 | 17.29 ± 3.7 | 20.84 ± 4.3 | 25.3 ± 4.6 | 22.7 ± 4.9 | 27.32 ± 4.2 | 22.7 ± 5.3 | ||
| Chiarano* | Marchesale | |||||||||
| Before Thinning | After Thinning | Before Thinning | After Thinning | |||||||
| I-80 | I-40 | Custom. | I-80 | I-40 | Custom. | Innov. | Custom. | Innov. | Custom. | |
| Tree density | 1293 | 1515 | 1293 | 684 | 655 | 613 | 528 | 479 | 409 | 408 |
| Basal area (m2) | 40.3 | 39.9 | 36.1 | 23.1 | 24.2 | 23.5 | 43.5 | 38.7 | 33.7 | 31.6 |
| Mean height (m) | 14.1 | 14.6 | 14.3 | 15.0 | 15.1 | 15.3 | 23.4 | 23.5 | 24.2 | 23.5 |
| Mean dbh (cm) | 20.3 | 18.6 | 19.3 | 22.8 | 21.7 | 21.7 | 32.3 | 32.5 | 33.0 | 33.4 |
| Dominant dbh (cm) | 36.5 | 35.5 | 36.2 | 36.0 | 35.1 | 36.1 | 42.7 | 55.8 | 54.2 | 48.8 |
| Dominant height (m) | 18.2 | 18.0 | 18.2 | 18.1 | 17.9 | 18.1 | 25.6 | 27.9 | 27.6 | 26.7 |
| Standing volume (m3) | 304 | 292 | 272 | 180 | 192 | 177 | 528 | 468 | 401 | 377 |
| Bio | 185.2 ± 21 | 180.0 ± 25 | 112.97 ± 12 | 117 ± 18 | 338.9 ± 97.1 | 278.1 ± 60.6 | 267.7 ± 45 | 239.2 ± 54 | ||
| CE | 1.13 ± 0.13 | 1.17 ± 0.11 | 1.19 ± 0.22 | 1.21 ± 0.14 | 1.17 ± 0.31 | 1.19 ± 0.13 | 1.26 ± 0.12 | 1.26 ± 0.15 | ||
| W | 0.62 ± 0.03 | 0.63±0.02 | 0.62 ± 0.15 | 0.64 ± 0.13 | 0.63 ± 0.02 | 0.62 ± 0.04 | 0.65 ± 0.17 | 0.62 ± 0.12 | ||
| A | 0.93 ± 0.09 | 0.91 ± 0.05 | 0.83 ± 0.15 | 0.82 ± 0.14 | 0.94 ± 0.12 | 0.89 ± 0.32 | 0.96 ± 0.12 | 0.85 ± 0.1 | ||
| T | 0.27 ± 0.03 | 0.24 ± 0.04 | 0.26 ± 0.03 | 0.18 ± 0.2 | 0.24 ± 0.03 | 0.25 ± 0.04 | 0.24 ± 0.01 | 0.26 ± 0.02 | ||
| CVdbh | 28.8 ± 4.9 | 26.5 ± 5.5 | 24.77 ± 4.9 | 19.35 ± 5.4 | 31.2 ± 6.9 | 31.2 ± 6.4 | 31.51 ± 4.5 | 31.82 ± 44.1 | ||
| Treatment | Tree Removal (%) | ||
|---|---|---|---|
| Number of Trees | Basal Area | Standing Volume | |
| CANSIGLIO | |||
| Innovative | 41 | 37 | 36 |
| Customary | 28 | 26 | 24 |
| VALLOMBROSA | |||
| Innovative | 38 | 36 | 35 |
| Customary | 3.6 | 3.1 | 3 |
| CHIARANO | |||
| Customary | 53 | 36 | 34 |
| Innovative-80 | 47 | 40 | 37 |
| Innovative-40 | 57 | 41 | 40 |
| MARCHESALE | |||
| Innovative | 22 | 21 | 24 |
| Customary | 15 | 19 | 20 |
| Variable | Kruskal-Wallis Analysis of Variance 1 | Mann-Whitney U Test 2 | ||||
|---|---|---|---|---|---|---|
| Statistic | p-Value | n | Statistic | p-Value | n | |
| Cansiglio | ||||||
| Den | 17.9 | 0.0004 | 27 | −2.6 | 0.010 | 18 |
| Bas | 21.1 | 0.0001 | 27 | −3.4 | 0.0006 | 18 |
| Bio | 22.9 | 0.0000 | 27 | −3.2 | 0.001 | 18 |
| Vallombrosa | ||||||
| Den | 15.8 | 0.0009 | 27 | 3.6 | 0.0003 | 18 |
| Bas | 18.1 | 0.0003 | 27 | 3.6 | 0.0003 | 18 |
| Bio | 18.9 | 0.0002 | 27 | 3.3 | 0.0009 | 18 |
| T | 15.6 | 0.001 | 27 | −3.7 | 0.0002 | 18 |
| CVdbh | 14.9 | 0.002 | 27 | −2.7 | 0.006 | 18 |
| Chiarano | ||||||
| Den | 18.4 | 0.0001 | 27 | 0.8 | 0.40 | 18 |
| Bas | 19.6 | 0.0001 | 27 | 1.8 | 0.07 | 18 |
| Dia | 14.3 | 0.0008 | 27 | 0.6 | 0.57 | 18 |
| Hei | 14.2 | 0.0008 | 27 | 0.3 | 0.76 | 18 |
| Bio | 19.1 | 0.0001 | 27 | 1.5 | 0.12 | 18 |
| CE | 9.3 | 0.0098 | 27 | 0.7 | 0.51 | 18 |
| T | 14.7 | 0.006 | 27 | −2.5 | 0.01 | 18 |
| CVdbh | 13.9 | 0.009 | 27 | −2.2 | 0.02 | 18 |
| Marchesale | ||||||
| Den | 19.4 | 0.0001 | 27 | −1.7 | 0.08 | 18 |
| Bas | 15.3 | 0.0005 | 27 | −1.1 | 0.29 | 18 |
| Hei | 18.0 | 0.0001 | 27 | 0.2 | 0.83 | 18 |
| Bio | 19.1 | 0.001 | 27 | −1.5 | 0.12 | 18 |
| CE | 11.6 | 0.0031 | 27 | 0.4 | 0.69 | 18 |
| Variable | Model Diagnostic | Mahalanobis’ Distance (* p < 0.001) | ||||||
|---|---|---|---|---|---|---|---|---|
| Wilks’ L | F-to-Remove | p-value | 1-Tolerance | Correct No. (%) | Treatment | Customary | Control | |
| Cansiglio: Wilks’ L = 0.038, F(4,46): 47.2, p < 0.0001 | ||||||||
| Bio | 0.19 | 46.6 | 0.00 | 0.20 | 96.3 | Innovative | 12.2 * | 95.2 * |
| Bas | 0.05 | 3.9 | 0.03 | 0.20 | Customary | 43.2 * | ||
| Den | 0.49 | 167.0 | 0.00 | 0.25 | 96.3 | Innovative | 56.3 * | 67.5 * |
| Hei | 0.06 | 11.4 | 0.0004 | 0.90 | Customary | 6.0* | ||
| Dia | 0.06 | 10.6 | 0.0006 | 0.90 | ||||
| Chiarano: Wilks’ L = 0.009, F(10,40): 54.4, p < 0.0001 | ||||||||
| Bas | 0.01 | 11.07 | 0.0006 | 0.95 | 88.9 | Innovative | 6.4 | 438.8 * |
| T | 0.01 | 6.77 | 0.006 | 0.08 | Customary | 391.1 * | ||
| Den | 0.02 | 24.97 | 0.00001 | 0.99 | ||||
| Dia | 0.01 | 3.70 | 0.042 | 0.98 | ||||
| Hei | 0.01 | 3.50 | 0.049 | 0.99 | ||||
| Marchesale: Wilks’ L = 0.03, F(10,40): 18.2, p < 0.0001 | ||||||||
| Hei | 0.20 | 53.10 | 0.00000 | 0.57 | 77.8 | Innovative | 2.89 | 86.6 * |
| Den | 0.10 | 21.77 | 0.00001 | 0.40 | Customary | 74.8 * | ||
| A | 0.05 | 6.34 | 0.007 | 0.30 | ||||
| Dia | 0.05 | 6.13 | 0.008 | 0.40 | ||||
© 2018 by the authors. Licensee MDPI, Basel, Switzerland. This article is an open access article distributed under the terms and conditions of the Creative Commons Attribution (CC BY) license (http://creativecommons.org/licenses/by/4.0/).
Share and Cite
Fabbio, G.; Cantiani, P.; Ferretti, F.; Di Salvatore, U.; Bertini, G.; Becagli, C.; Chiavetta, U.; Marchi, M.; Salvati, L. Sustainable Land Management, Adaptive Silviculture, and New Forest Challenges: Evidence from a Latitudinal Gradient in Italy. Sustainability 2018, 10, 2520. https://0-doi-org.brum.beds.ac.uk/10.3390/su10072520
Fabbio G, Cantiani P, Ferretti F, Di Salvatore U, Bertini G, Becagli C, Chiavetta U, Marchi M, Salvati L. Sustainable Land Management, Adaptive Silviculture, and New Forest Challenges: Evidence from a Latitudinal Gradient in Italy. Sustainability. 2018; 10(7):2520. https://0-doi-org.brum.beds.ac.uk/10.3390/su10072520
Chicago/Turabian StyleFabbio, Gianfranco, Paolo Cantiani, Fabrizio Ferretti, Umberto Di Salvatore, Giada Bertini, Claudia Becagli, Ugo Chiavetta, Maurizio Marchi, and Luca Salvati. 2018. "Sustainable Land Management, Adaptive Silviculture, and New Forest Challenges: Evidence from a Latitudinal Gradient in Italy" Sustainability 10, no. 7: 2520. https://0-doi-org.brum.beds.ac.uk/10.3390/su10072520