Green Payment and Perceived Rural Landscape Quality: A Cost-Benefit Analysis in Central Italy


DAFNE, Università degli Studi della Tuscia, 01100 Viterbo, Italy
*
Author to whom correspondence should be addressed.
Sustainability 2018, 10(8), 2910; https://0-doi-org.brum.beds.ac.uk/10.3390/su10082910
Submission received: 22 June 2018
/
Revised: 14 August 2018
/
Accepted: 15 August 2018
/
Published: 16 August 2018
(This article belongs to the Special Issue Sustainable Land Uses and Rural Governance)
Abstract
:The conservation of perceived scenery of traditional extensive and diversified landscapes is a valuable aim for reaching sustainable rural development. Considering the financial budget assigned and the application rules of European Union agricultural policy (Common Agricultural Policy—CAP), the relationship between perceived landscape benefits and CAP first pillar payments is an interesting aspect to analyze. In this study, a cost-benefit analysis has been carried out in a rural area of Central Italy that represents typical Italian conditions of hilly territories. Greening payment, a mechanism aimed to boost public goods, including landscapes and their ecological functionality, was selected as a proxy for policy cost of preserving traditional extensive landscapes. The benefits of greening have been evaluated through the analysis of the people’s willingness to pay for the maintenance of extensive and diversified landscapes. The analysis conducted does not explicitly consider the full range of environmental benefits determined by greening, even if some interviewees may have perceived them in addition to the visual perception of the rural landscape. The present study can contribute to the debate on the agricultural policy post-2020, especially for a future definition of long-lasting and cost-effective sustainable interventions in hilly and extensive rural landscapes.
1. Introduction
Agriculture shapes landscapes and rural areas are one of the most important geographic zones for the functionality of social-ecological systems. Indeed, rural areas provide numerous ecosystem services for both citizen and rural inhabitants, from the provision of food and habitat for species to the aesthetic value and the environmental amenity characters that are able to satisfy the psychological and health needs of people [1]. Moreover, historical and cultural heritages as well as sense of place [2] are strictly linked with the perceived landscape. As stated in the Florence European Convention on Landscape (2000), perceived beautiful and harmonic landscapes are a result of the integration between human activities and nature. Some anthropogenic activities, such as urbanization and intensive agriculture, can strongly affect the landscape’s ecological functionality by altering the complex pattern of ecological key features (i.e., hedges, woodlands, pastures) that support the biodiversity and the local and regional natural capital [3,4]. Consequently, fragmentation and ecological connectivity represent important factors related to sustainable development, the biodiversity preservation and the production of high quality landscapes [5,6]. Besides the embedded naturalistic value, traditional extensive farming landscapes are found to be more attractive than modern intensive ones because of greater diversity, colour contrast and cultural identity [7]. In consequence, above all, in Italy, the aesthetic and scenery proprieties are very important for rural areas because they are a source of touristic attraction and consequential income for residents and local entrepreneurs.
The conservation of perceived scenery of traditional extensive and diversified landscapes is therefore a valuable aim for reaching sustainable rural development, allowing both socio-cultural values and ecological functionality to be preserved. However, preserving and maintaining landscapes is challenging. Economic, political, and social drivers play a relevant role in affecting the agricultural landscape and land use. In the last decades, agricultural changes were also driven by the EU reforms of the Common Agricultural Policy (CAP) at farm level and, consequently, at landscape scale [8]. In particular, changes in the CAP first pillar (see Section 2) have influenced farmers’ choices in terms of cropping patterns and consequently, rural landscapes. In the first phase of the CAP, support had purely productive and economic objectives. With the various reforms (since 1992), the interest in the environment and the secondary functions of the agricultural sector have become increasingly important. In regards to the landscape, the high price support has led to the specialization and simplification of cropping systems, with the diffusion of monoculture in some areas. The reduction in price support first and then the total decoupling of payments led to greater diversification and more extensive farming landscapes.
The last reform introduced a new payment mechanism (greening) aiming to favour public goods, including landscapes and their ecological functionality. The weakening of greening practices during negotiations leads to minor changes for farms and in many territories these practices are already respected and serve to maintain the observed conditions. In particular, in inner and hilly territories, the greening maintains the pre-reform characteristics (such as the simultaneous presence of different crops, including pasture, forest and landscape features) and then positive outcomes in many ecological aspects but also aesthetical characters of rural landscapes can be obtained. The greening has been partially financed (30%) from direct payment and the novelty of this approach lies in its attempt to define and fund EU-wide mandatory green standards through Pillar 1 direct payments [9]. In a context of severe pressures to reduce levels of public expenditure, there is considerable scope to allocate funds more cost-effectively in support of the environment, including the diversified and extensive farm landscapes [10].
Although many studies have analysed the impact of greening on different economic and environmental aspects (see Section 2), there is a gap in the monetary evaluation of public goods, including landscapes and their ecological functionality, provided by greening. This issue is challenging because of the subjectivity of landscape aesthetic value due to spatial variability of different geographic contexts and economic and societal differences among countries and communities. However, the people’s willingness to pay (WTP) for a perceived valuable landscape can be considered a justification for public policy aimed at its protection [11] and is useful to evaluate the efficiency of public spending.
This study aims at contributing to the debate on agricultural policy efficiency in terms of aesthetic and scenery values of a typical agroforestry system of central Italy. The potential willingness to pay (WTP) for the maintaining of diversified and extensive landscape has been estimated using the Contingent Valuation Method (CVM) and several factors driving the individual WTP have been pointed out. Finally, the WTP for landscapes is compared with the CAP direct payments for the farmers (greening and total decoupled payments).
The next paragraph describes the main changes that CAP first pillar has undergone since 1962 until today, and the greening practices description; moreover, a literature overview on the greening impact assessment is shown. The following paragraphs regard the methodology (i.e., the study area description, the survey and sample characteristics, and the used estimation model) and the obtained results. The paper ends with some discussions and final considerations for policy makers.
2. Common Agricultural Policy: First Pillar History and Greening
2.1. Main Charatteristics of CAP First Pillar
From the beginning of the CAP until today, the first pillar has been affected by various changes (Table 1). Before the early 1990s, agricultural product prices were kept high to support farmers’ income and to obtain large quantities of products. This system initially achieved its objectives, but the passing of the years has shown several drawbacks including surpluses of agricultural products and pollution. The various reforms have modified the typology and amount of support for farmers, moving from high price support to decoupled payments, and providing payments coupled for some products. All these changes have greatly influenced farmers’ choices in terms of crop systems and consequently the rural landscapes have changed. In general, we moved from intensive and banal landscapes to more diversified, extensive landscapes with various characteristic elements.
The last reform mainly provides decoupled payments and some coupled payments. The convergence of the basic payment determines a homogenization of the decoupled payments level between the various farms; this means that, at the extremes, farms that have the highest decoupled payments lose 30% of their payments, and farms that do not have decoupled payments will take a minimum value. Compliance with environmental rules is necessary in order to fully benefit from decoupled payments and not incur administrative sanctions. This mechanism tries to justify the payment given to farmers who, respecting the environmental rules, are producers of public environmental goods. Currently, two types of environmental tools are planned: cross-compliance and greening. Cross-compliance requires compliance with various mandatory environmental rules (mandatory management criteria) and good environmental agronomic conditions. Greening requires compliance with three practices concerning crop diversification, maintenance of permanent grassland and the presence of an Ecological Focus Areas (EFA). Crop diversification requires the presence of more crops in farms where the arable land exceeds 10 hectares: the main crop cannot exceed 75% of the arable land; at least three crops for farms that exceed 30 hectares and the third crop must be at least equal to 5% of the arable land. The maintenance of permanent grassland is required at national level and, considering a reference period, these areas cannot be subject to a reduction of more than 5%. Finally, the third practice requires that in farms where the arable land exceeds 15 hectares, at least 5% must be EFA. Various elements and crops are recognized as EFA, including the landscape features (hedges or wooded strips, isolated trees, trees in line, trees in groups and field copses, traditional stone walls, ...).
2.2. Literature Review on Greening
Economic analyses on greening are mainly ex-ante evaluations of possible impacts using the mathematical programming methodology.
As for the Italian territory, Solazzo et al. (2015) argues that the impact of greening in Emilia-Romagna (Northern Italy) is very limited and the larger economic impact is due to convergence of direct payments [12]. Cortignani and Dono (2015) conclude that the greening should restrict the use of nitrogen in Southern Italy in the more intensive farms [13]. Solazzo and Pierangeli (2016) show that the related payments and sanctions are strong incentives for farmers to fully comply with these practices [14]. Solazzo et al. (2016) argues that the greening constraints produce a modest abatement of the total emission of greenhouse gases in four regions of North Italy [15]. They also conclude that the process of “lightening” that affected the greening during the CAP negotiation has inevitably resulted in a missed opportunity to introduce a significant positive change in line with the expectations and needs of society for EU agriculture as a provider of public goods. The results of Cortignani et al. (2017) show that while the impact of the greening practice is limited in terms of land use, there are positive effects on environmental indicators. Coupled payments, along with greening practices, have a large impact and are effective in achieving environmental goals [16].
At UE-level, Gocht et al. (2017) analysed the economic and environmental impacts of CAP greening introduced by the 2013 CAP reform using the CAPRI model. Their results show that the environmental impacts of greening are small, although greater effects can be pointed out in the regions with a larger percentage of intensive farms [17]. Louhichi et al. (2017), using an EU-wide individual farm level model, show that the effects of the crop diversification practice on the EU farming sector are rather small. At the aggregate EU level, the proportion of the area that was reallocated due to the diversification measure represents less than 1% of the total agricultural area, and the crop production and income declines by less than 0.5%. At the individual farm level, the impacts could be more pronounced, although the number of farms affected by the measure remains small [18]. Finally, Hart et al. (2017) evaluated the observed data regarding the payment for agricultural practices beneficial for the climate and the environment at European level. In particular, the authors show the limited environmental impacts of greening observed for the 2015 and 2016 agricultural years [19].
These studies, and others, show that the impact of greening is very limited and that most farms are already compliant with greening practices. In many cases, the choice of the study areas involved farms specialized in the cultivation of one or few crops in order to show the impacts only on these types of farms. Moreover, these specialized farms are located especially in plain areas and represent a small percentage of the total farms. In almost all areas, including ours, greening practices are already respected and do not result in changes for farms.
3. Materials and Methods
To define the Willingness to Pay (WTP) for maintaining diversified and extensive landscapes, a significant sample of residential population was interviewed, and a contingent valuation applied. Then, the cost/benefit analysis of greening was realized comparing the WTP with two levels of Italian average cost within Pillar I: The greening component and the whole direct payment cost. The following three sections describing the study area (Section 3.1), the survey and the sample characteristics (Section 3.2) and the evaluation method (Section 3.3).
3.1. Study Area
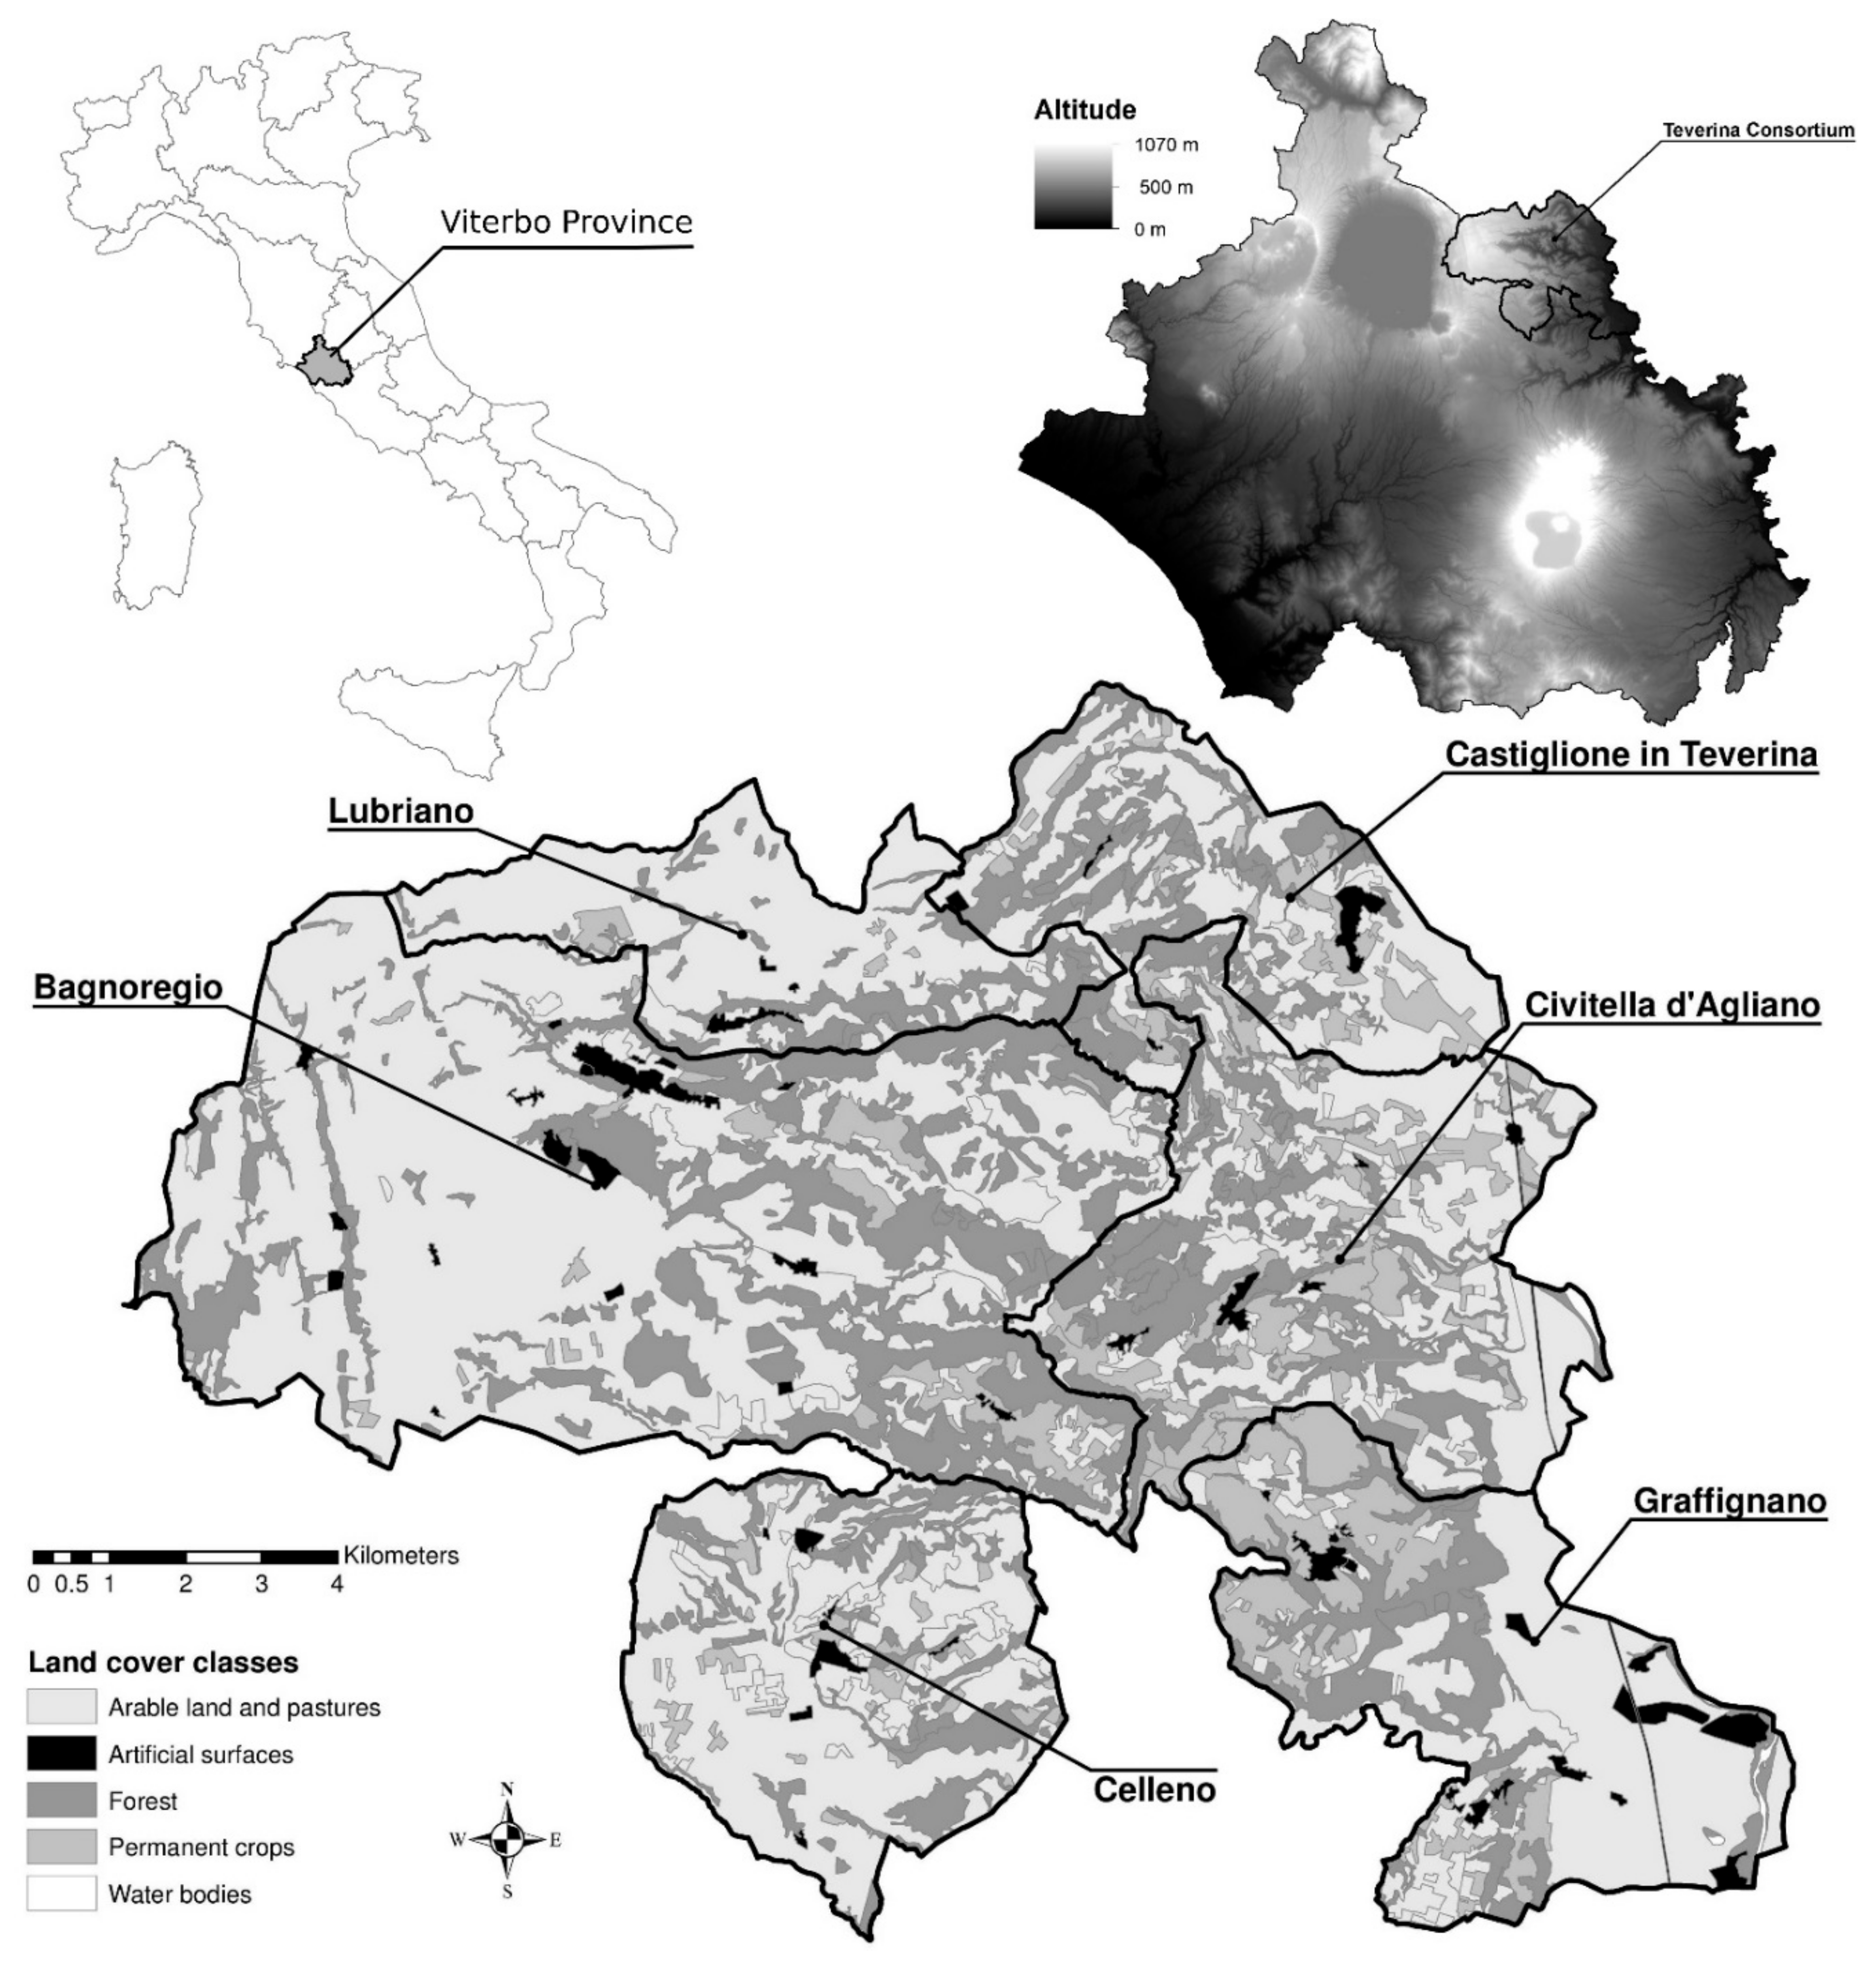
The territory of Teverina Consortium (around 196 km2) is a supra-municipal body localized at the north-eastern part of the Province of Viterbo, also known as Tuscia area (Italy) with a population of about 13,000 inhabitants (Figure 1). Teverina consortium is composed of six municipalities: Bagnoregio, Castiglione in Teverina, Celleno, Civitella d’Agliano, Graffignano, and Lubriano. The present landscape shows a mutual relationship between natural (vulcanic) environment and human presence, that started from the stone age and continued in the Etruscan and Middle Age periods to now. Areas of great natural and historical interest, such as the Site of Community Interest and Special Protection Area (SCI–SPA) “Calanchi di Civita di Bagnoregio” and the SCI–SPA “Monti Vulsini” and the tuff towns of Civita di Bagnoregio, Celleno, Civitella D’agliano and Roccalvecce are located in the Teverina Consortium, leading to a very attractive cultural landscape. The naturalistic, historical and cultural assets, as well as the quality of its agricultural products and of the rural sceneries, make Teverina territory a fascinating rural area, with a potential for attracting tourism as great as that in Tuscany Region [1]. Indeed, the landscape offers history, semi-natural environments and typical products that still define the identity of the landscapes and the communities [1,20,21].
Teverina consortium has a strong rural character and the agricultural system is very diversified with the simultaneous presence of extensive annual and permanent crops, grassland and forest area (Table 2 and Table 3). The difference between Total and Utilized Agricultural Area is mainly due to the forest and uncultivated areas. Around 10% of population is employed in the agricultural sector with a prevalence of small family farms. Table 4 provides useful information on how many farms and agricultural areas are subject to greening: Most farms (80.6%) are exempt from greening practices with a UAA below 10 ha, but in terms of agricultural area, the 82% is affected by compliance with greening practices (Table 4).
Considering the strong and homogeneous rural characteristics of the territory, in 2012, a Local Action Group (LAG) was constituted within the LEADER program covering the six municipalities of the Teverina Consortium [1].
3.2. Survey and Main Sample Characteristics
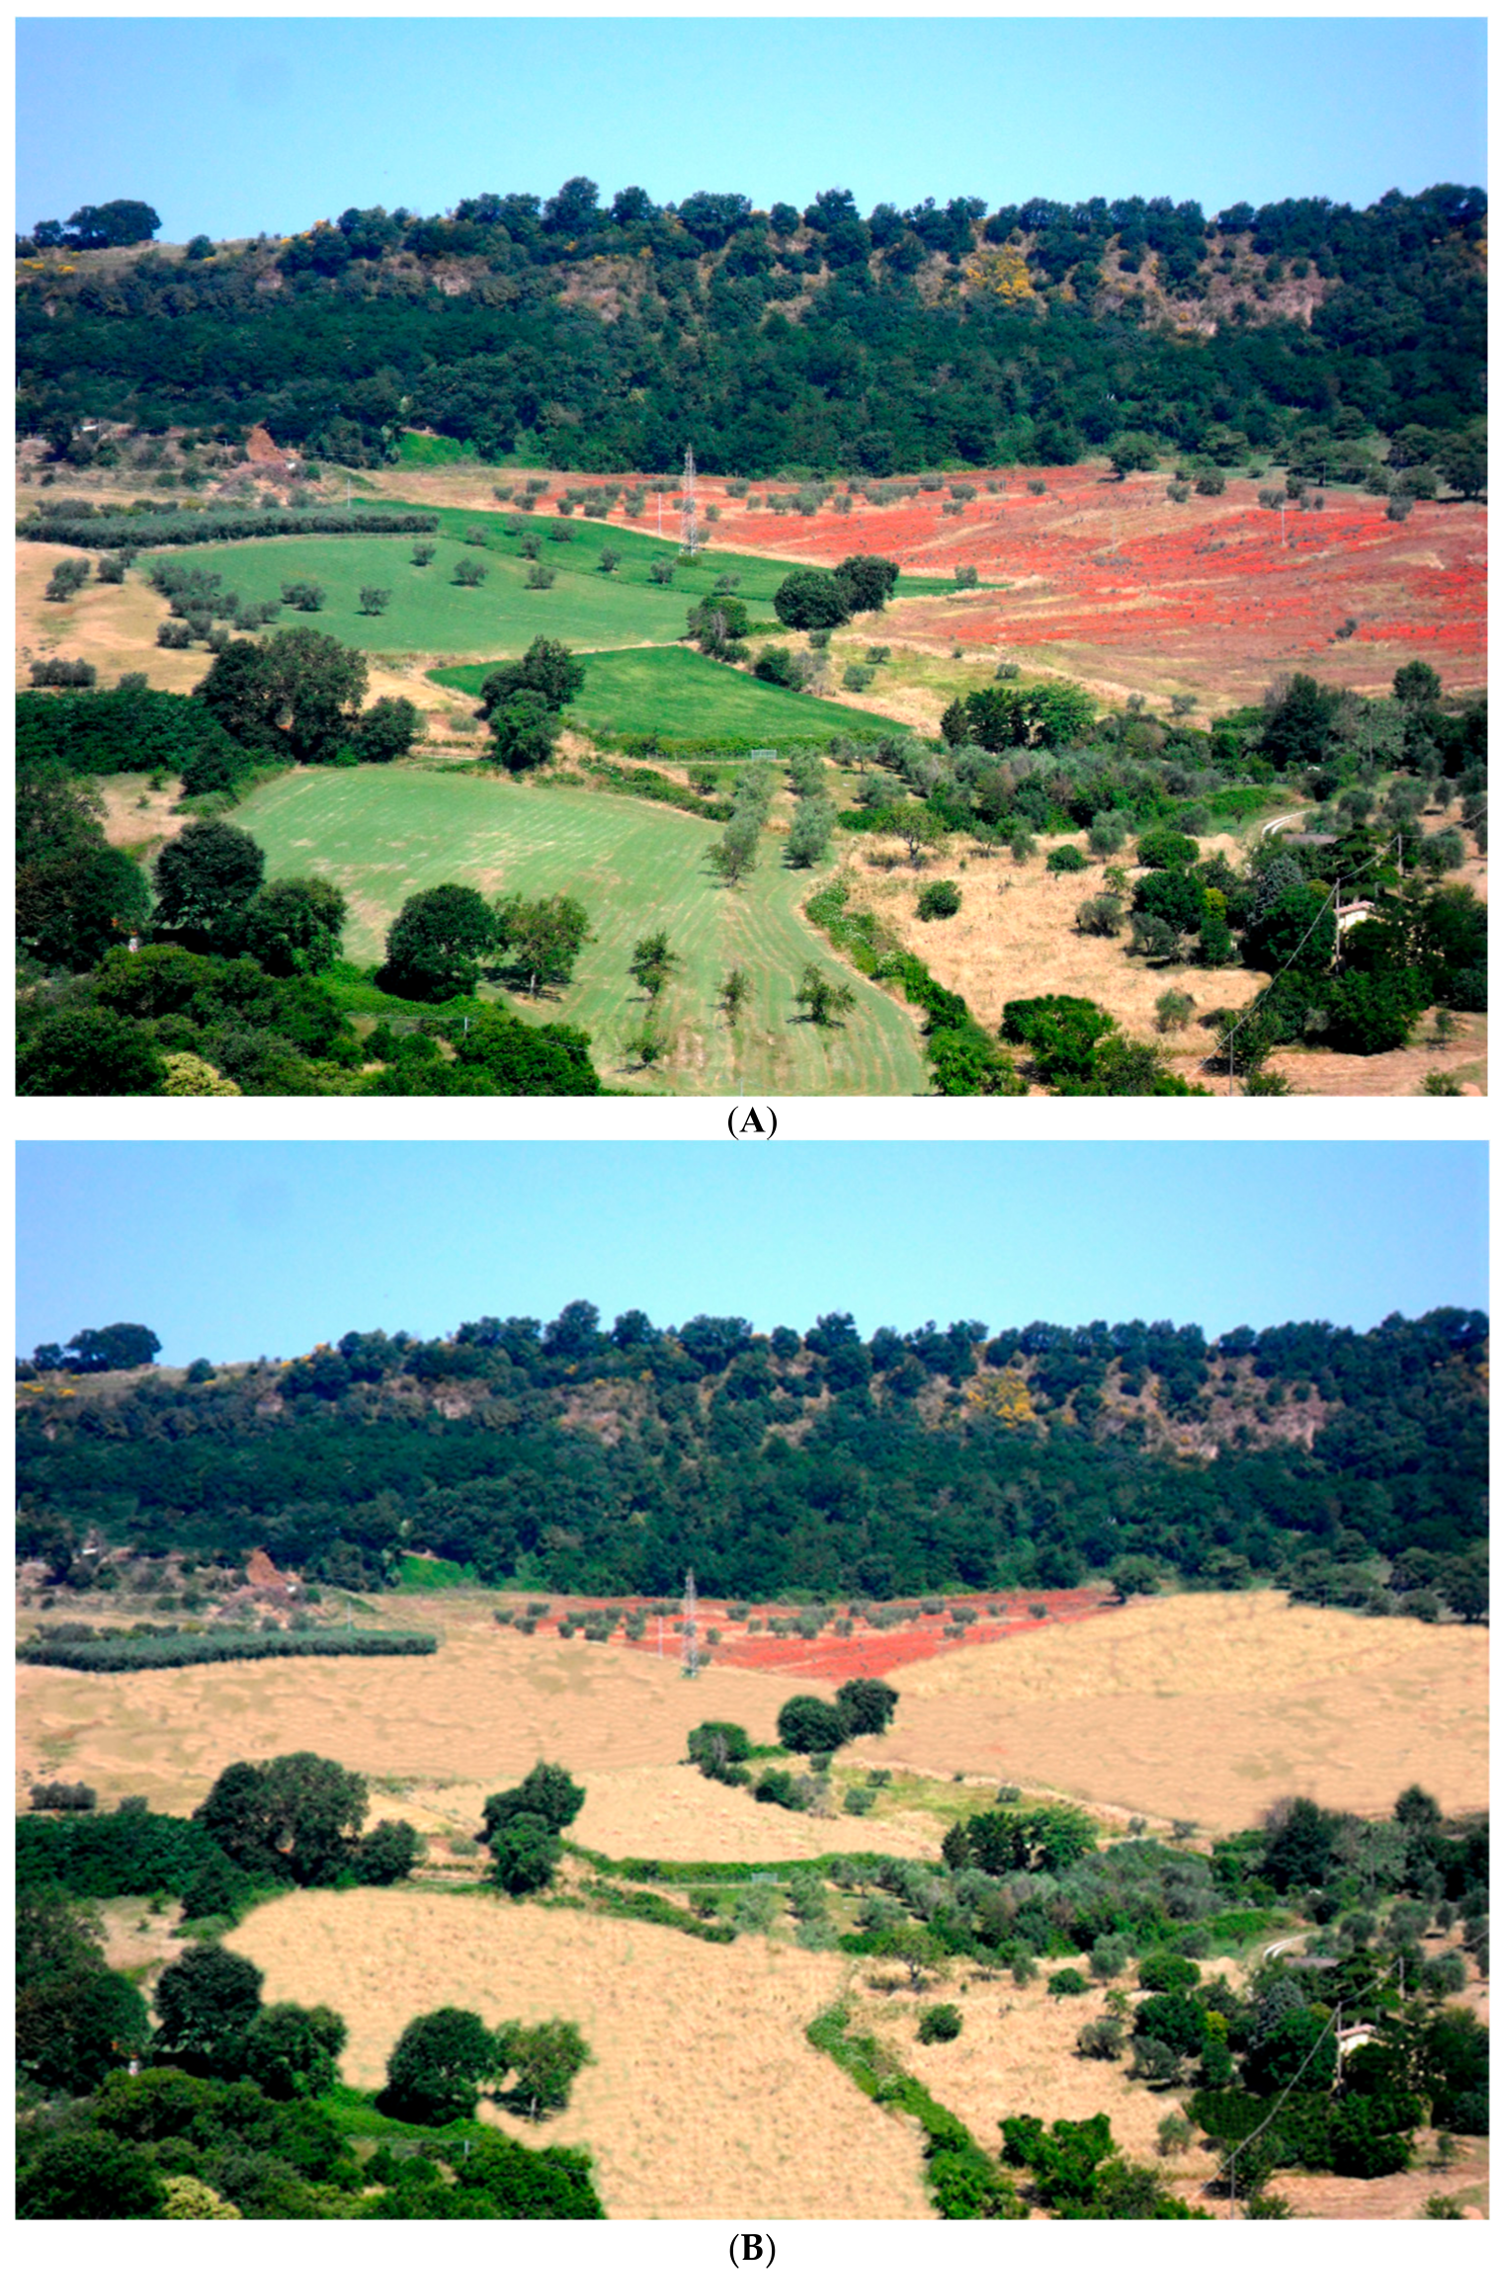
A paper questionnaire was prepared in order to investigate the willingness to pay (WTP) of residents for the maintenance of the diversified and extensive farm landscape. The questionnaire was built taking into account a previous survey [1] and current literature on contingent valuation to identify the socio-economic variables, as well as people’s attitudes and behaviours towards the environment, landscapes and public participation, that could affect the WTP. The questionnaires were filled by direct interview and 150 were valid; the interviews were conducted from July to December 2014. Photos of a 2014 landscape in the study area and the possible alternative, have been included in the survey (Figure 2). Considering that greening came into force in 2015, the situation observed in 2014 is that of pre-reform.
The 2014 landscape has a diversified pattern, with the presence of several crops, permanent grassland and EFA elements as hedges, forests and isolated trees. The greening could maintain this kind of landscape until 2020. The alternative landscape, with hypothetical no greening practices, was created modifying the original photo with the GIMP software. This landscape shows the prevalence of a single autumn-winter cereal (soft wheat), reduced EFA elements and permanent grasslands. Therefore, the alternative scenario displays a typical landscape of intensive agriculture realizable in the Italian hill areas. The alternative landscape was particularly observed in the past when the CAP support was oriented on price and market intervention. The various reforms of the CAP first pillar, shown previously, have significantly changed the land use to a more rational and sustainable type of agriculture, also changing rural landscapes: Especially the reduction in price support first (1992) and then the total decoupling of payments (2005) led to greater diversification and more extensive farming landscapes. For these reasons and considering the light greening rules, the 2014 landscape of the study area is in line with greening practices and it can be assumed that the relative payment is given to maintain the pre-reform situation.
Comparing these two types of landscapes, the interviewee was asked about their willingness to pay a certain annual amount to maintain the 2014 landscape. The payment instrument was an annual tax in Euro per family and five different values were randomly subjected to various residents equal to 30, 50, 90, 150 and 230 Euro. These values were chosen on the basis of surveys carried out during the pre-test phase.
Table 5 shows the main sample characteristics.
3.3. Estimation Model
The Contingent Valuation (CV) method is a widely used nonmarket valuation method, especially in the areas of environmental cost–benefit analysis and environmental impact assessment [22,23]. Its application in environmental economics includes the estimation of non-use values, nonmarket use values or both of environmental resources [24]. Several CV were found also in the ecosystem services evaluations where the consumer surplus (willingness to pay, WTP) is measured for management options of a landscape or an ecosystem and the services it delivers [5,25,26,27,28,29,30,31].
The conceptual paradigm of the CV is based on Hahnemann model [32], where a response function due to the utility concept of the neoclassical theory is formulated. The basic assumption is that the individual utility derives from both the environmental good and the income.
A utility function u(j,Y,s) is associated with each individual, where j is a binary variable representing the environmental good, Y is income and s is a vector of socioeconomic characteristics.
The determination of each function is not easy, so a stochastic function is assumed
where ej is the stochastic error.
u(j,Y,s) = v(j,Y,s) + ej (j = 0;1)
By the formulation of the question YES/NO, the interviewee answers YES only if:
where xi is the bid subjected to the interviewee.
v(1,Y-xi,s) + ei ≥ v(0,Y,s) + e0
The answer YES or NO is to be understood as a random variable whose probability distribution is equal to:
Prob(YES|xi) = Prob[v(1,Y-xi,s)+ e1 ≥ v(0,Y,s) + e0]
Assuming η = e1 − e0, the previous formulation, with respect to the utility variation, can be specified such as:
where Fη (∙) is the function of η and the argument (∆v) is equal to the difference
Prob(YES|xi) = Fη (∆v)
∆v = v(1,Y-xi,s) − v(0,Y,s)
Parametric estimation requires the specification of the stochastic component distribution, Fη (∙), and of the deterministic component, ∆v.
Regarding the specification of the stochastic component distribution, the most adopted solution in the literature is a logistics function, and then:
Regarding the specification of the deterministic component, following the example of Hahnemann [32], a linear model with respect to income has been used, and then the final formulation is the following:
Finally, the Willingness to Pay (WTP) can be calculated in the following way
where is the estimated coefficient relative to the intercept and is that relating to the bid variable.
4. Results
4.1. Model Estimations and WTP
Table 6 reports the description of the independent variables used in the econometric model, and the Table 7 reports the estimation results.
The most significant variables in addition to the BID, are OCC and AWAR. The occupation with fixed monthly income leads to a higher probability of affirmative response (i.e., High WTP) as the importance of people’s awareness in sustainable rural development concepts. Indeed, people’s awareness (AWAR) has been framed with three aspects: (1) knowledge of environmental and landscape policies and actions; (2) participation in the processes of planning and land management for the social and economic development of the territory; (3) strengthening the tradition, culture and local products for the social and economic development of the territory.
After that, there are other variables that influence positively the affirmative response on the willingness to pay: People’s inclination for farm activity (FARM) and the recognition of crop diversification as the most relevant aspect for the landscape quality (CROP).
Other less significant variables are FAM, FEM and HISTC. Considering the coefficients signs, less willing to pay can be associated with a larger number of family members, with female gender and with the identification of the historical center as the main element to be protected. Land ownership (LAND), knowledge of product and territory brands (BRAND) and age of interviewees (AGE) are not significant variables in defining the WTP for extensive and diversified landscapes.
Once and parameters were estimated, the sample WTP can be calculated as 94.8 €/family/annual.
Assuming the theoretical conditions at the base of the perfectly competitive market, this value can be considered as the marginal benefit of the various users of the landscape.
4.2. Cost-Benefit Analysis of the Greening
Perceived people’s benefits provided by the diversified and extensive landscape can be deduced from the people’ WTP to maintain it. To obtain the total benefits resulting from the 2014 rural landscape of Teverina Consortium, the median WTP (€/family/year) was multiplied by the number of resident households. The benefits for hectares was then obtained dividing the total benefit of Teverina Consortium by the total agricultural area (Table 8).
The perceived landscape benefits were compared with two types of CAP costs, which concern the first pillar: The first refers to the greening payments and the second to the total decoupled payments. The unitary values refer to last available data with regard to basic payments, greening payments and total decoupled payments; they are equal to 109 €/ha for greening and 327 €/ha for decoupled payments. These unitary values have been multiplied by the total agricultural area of Teverina Consortium to obtain the relative total costs within the area (Table 9).
Comparing benefits and costs, ratios of about 35% and 12% are obtained for the greening and decoupled payments, respectively (Table 5). In both, the perceived benefits of preserving landscape result lower than policy costs.
5. Discussion and Conclusions
The relationship between perceived landscape benefits and CAP first pillar payments is an interesting aspect to analyse, considering the financial budget assigned and the application rules of greening.
In terms of the political costs, the monetary quantification appears to be less problematic, benefits require the use of specific methods that can quantify them in terms of the monetary value of the goods that have no market. Among these, one of the most applied is certainly the contingent valuation.
From the methodological point of view, the application of this method seems appropriate and the conducted estimate is robust and significant in statistic terms. At our knowledge, no studies have analysed the cost/benefit ratio of the greening for the maintenance of extensive and diversified landscapes as perceived by the local population. This work, therefore, adds further knowledge in this direction; investigating a hilly rural area of central Italy: We argue that a relation exists between the WTP for extensive and diversified landscapes and people’s inclination to participate (actively or passively) in the sustainable development of their territory. However, some limits of the conducted analysis must be highlighted. CAP greening and decoupling policies are not only aiming to preserve landscape but also have other objectives. More generally, greening seeks to preserve biodiversity and mitigate climate change. The three practices, however, have a strong impact on the landscape as they require the presence of more crops and elements characteristic of the landscape, as well as the maintenance of permanent grassland. So, the comparison between benefits and costs can give an important indication on the efficiency of this instrument with regards to the landscape. The decoupled payments as a whole have the main objective of supporting farmers’ income. However, in the CAP post 2020, decoupled payments could be reviewed and allocated on the basis of sustainability targets, including those environmental, and therefore, also relate to the landscape. So, in conclusion, the relationship between benefits and the two types of costs can give some indications on the perspective of the discussion on the CAP post 2020.
Cost-benefit analysis shows that in our study case, the perceived benefits of preserving landscape are lower than policy costs. Moreover, the econometric model shows that the perceived benefits depend on several cultural and socio-economic factors related with the territory. Regarding the estimated benefits, some considerations must be made. The alternative landscape chosen is an agricultural landscape where some typical characteristics determined by greening practices have been lightened (less diversification, elimination of some characteristic elements of the landscape and permanent grassland). A more homogeneous landscape (monoculture, and no presence of characteristic elements and permanent grassland) in the alternative no greening scenario would have determined a larger willingness to pay. However, in the study area examined, in the past, even when the prices of agricultural products were high, monoculture was never practiced and, therefore, it would have been an unrealistic comparison. Similarly, to consider that the interviewees are all residents and therefore have a lower willingness to pay than tourists and others. So, in conclusion, a higher value of the benefits might have been obtained with starker scenarios and an extension of the analysis to non-residents.
Although the analysis conducted does not explicitly consider other environmental benefits (such as biodiversity), some interviewees may have perceived them in addition to the visual perception of the rural landscape. Namely, among the variables that most influence the likelihood of an affirmative answer, there is that relating to the sustainable rural development (AWAR). A citizen that is sensible and expert of environmental policies is willing to pay more to maintain the landscape and therefore information, dissemination and awareness-raising activities on issues regarding the environment and the landscape seem needed. Another important variable in statistical terms and in the current social context is related to occupation with fixed monthly income (OCC): Those who have more certainty of a fixed monthly salary are willing to allocate their own income to public goods. Future development strategies should then aim to increase economic stability of communities and farmers to be effective in preserving landscape quality. The crop diversification practice (CROPS) is seen as a positive and beneficial factor for the rural landscape; even if this practice does not determine relevant benefits for the ecological quality of soil and landscape, it can be a fundamental element that positively influences the visual perception of the rural landscape; indeed, the more homogeneous a rural landscape, the lower its perceived quality [33]. This finding adds value to crop diversification, that is a practice largely discussed in terms of effectiveness within the agro-environmental schemes [8].
As Gobattoni et al. (2015) reported, a long term sustainable rural development can be reached only by strategies accepted by farmers and fitted for the context the farmers live in [1]. Rural communities’ perceptions about landscape help to really identify the potential values of the rural areas and the best actions for maintaining their natural, social and cultural capitals. However, actual policies for rural development are mainly based on CAP interventions and they have a fundamental role in the sustainable driving of landscape management. Future rural development strategies under the new CAP can embed local and regional specificities allowing people to promote and fund actions aimed to start virtuous mechanisms to initiate rural communities into a more economically and socially sustainable development focusing on the combination of different kinds of knowledge and by changing unsustainable behaviours [1]. As our model results show, a very important variable (AWAR) for increasing landscape quality maintenance (i.e., WTP for diversified and extensive landscape) is related to people awareness factors as: (1) level of knowledge in environmental and landscape policies and actions; (2) the demand for participation in the processes of planning and land management; and (3) the request for development strategies aimed at strengthening the tradition, the culture and the local products. In this view, new rural development strategies (also CAP and LEADER programmes) in the Teverina consortium could focus part of their financial efforts towards environmental education courses for farmers and rural communities. These formation activities should aim to increase the environmental awareness, the sense of place for the territory and cultural heritages of the participants to allow green strategies to be realised also without the CAP sustain or other regulated and normative top-down financial instruments. These educational efforts should support a change in the people’s behaviour (above all in farmers), triggering self-regulating socio-ecological systems able to survive adapting themselves to the external socio-economic forces. Indeed, counteracting the loss of biodiversity and landscape quality requires an enduring change in farmers’ motivation and habits towards more sustainable actions [34]. This means to pass from a driving (economic) rule system based on a globalised top-down view to a new one based on a new ecological mindset (i.e., a paradigm shift) of local people, the second most effective leveraging point defined by Meadows (2009) to reach sustainable changes in complex systems [35]. Making the systemic and ecological view of the landscape economically sustainable is then essential, and future studies should aim to define effective modalities for local, or at least regional, rural development strategies aimed at embedding them into the people’s mindset.
The conducted cost-benefit analysis highlights that the justification for public spending to obtain public goods is complicated to achieve if the environmental rules are not very restrictive and based on uniform mechanisms for all territories. On the opposite side, more restrictive rules could lead to excessive costs for farms and the decoupled payment would no longer be a fundamental income support with possible larger environmental damage (e.g., land abandonment). The proposed post-2020 regulation, recently formulated by the European Commission [36] seeks to consider these issues. Indeed, an annual area-based decoupled payment should be established as the type of intervention ‘basic income support for sustainability’. This payment can be differentiated by groups of territories based on socio-economic and/or agronomic conditions in order to obtain major economic, social and environmental objectives. Moreover, in view of avoiding disruptive effects for farmers’ income, member states may choose to implement the basic income support for sustainability based on payment entitlements.
Author Contributions
All authors contributed equally to this work.
Funding
This research received no external funding.
Conflicts of Interest
The authors declare no conflict of interest.
References
- Gobattoni, F.; Pelorosso, R.; Leone, A.; Ripa, M.N. Sustainable rural development: The role of traditional activities in Central Italy. Land Use Policy 2015, 48, 412–427. [Google Scholar] [CrossRef]
- Jorgensen, B.S.; Stedman, R.C. Sense of Place as an Attitude: Lakeshore Owners Attitudes toward Their Properties. J. Environ. Psychol. 2011, 21, 233–248. [Google Scholar] [CrossRef]
- Forman, R.T.T. Land Mosaics—The Ecology of Landscape and Regions; Cambridge University Press: Cambridge, UK, 1995; 632p. [Google Scholar]
- Turner, M.G.; Gardner, H.; O’Neill, R.V. Landscape Ecology in Theory and Practice, Pattern and Process; Springer: New York, NY, USA, 2001. [Google Scholar]
- Gobattoni, F.; Groppi, M.; Monaco, R.; Pelorosso, R. New Developments and Results for Mathematical Models in Environment Evaluations. Acta Appl. Math. 2014, 132, 321–331. [Google Scholar] [CrossRef]
- Raffaele, P.; Gobattoni, F.; Geri, F.; Leone, A. PANDORA 3.0 Plugin: A New Biodiversity Ecosystem Service Assessment Tool for Urban Green Infrastructure Connectivity Planning. Ecosyst. Serv. 2017, 26, 476–482. [Google Scholar]
- Howley, P.; Donoghue, C.O.; Hynes, S. Exploring public preferences for traditional farming landscapes. Landsc. Urban Plan. 2012, 104, 66–74. [Google Scholar] [CrossRef]
- Monteleone, M.; Cammerino, A.R.B.; Libutti, A. Agricultural “greening” and cropland diversification trends: Potential contribution of agroenergy crops in Capitanata (South Italy). Land Use Policy 2018, 70, 591–600. [Google Scholar] [CrossRef]
- Erjavec, K.; Erjavec, E. “Greening the CAP”—Just a fashionable justification? A discourse analysis of the 2014–2020 CAP reform documents. Food Policy 2015, 51, 53–62. [Google Scholar] [CrossRef]
- Hodge, I. Agri-environment policy in an era of lower government expenditure: CAP reform and conservation payments. J. Environ. Plan. Manag. 2009, 56, 254–270. [Google Scholar] [CrossRef]
- Howley, P.; Hynes, S.; Donoghue, C.O. Countryside preferences: Exploring individuals’ WTP for the conservation of the traditional farm landscape. Landsc. Res. 2012, 37, 703–719. [Google Scholar] [CrossRef]
- Solazzo, R.; Donati, M.; Arfini, F. Cap towards 2020 and the cost of political choices: The case of Emilia-romagna region. Land Use Policy 2015, 48, 575–587. [Google Scholar] [CrossRef]
- Cortignani, R.; Dono, G. Simulation of the impact of greening measures in an agricultural area of the southern Italy. Land Use Policy 2015, 48, 525–533. [Google Scholar] [CrossRef]
- Solazzo, R.; Pierangeli, F. How does greening affect farm behaviour? Trade-off between commitments and santionc in the Northern Italy. Agric. Syst. 2016, 149, 88–98. [Google Scholar] [CrossRef]
- Solazzo, R.; Donati, M.; Tomasi, L.; Arfini, F. How effective is greening policy in reducing GHG emissions from agriculture? Evidence from Italy. Sci. Total Environ. 2016, 573, 1115–1124. [Google Scholar] [CrossRef] [PubMed]
- Cortignani, R.; Severini, S.; Dono, G. Complying with greening practices in the new CAP direct payments: An application on Italian specialized arable farms. Land Use Policy 2017, 61, 265–275. [Google Scholar] [CrossRef]
- Gocht, A.; Ciaian, P.; Bielza, M.; Terres, J.M.; Röder, N.; Himics, M.; Salputra, G. EU-wide Economic and Environmental Impacts of CAP Greening with High Spatial and Farm-type Detail. J. Agric. Econ. 2017, 68, 651–681. [Google Scholar] [CrossRef] [Green Version]
- Louhichi, K.; Ciaian, P.; Espinosa, M.; Liesbeth, C.; Perni, A.; Gomez y Paloma, S. Does the crop diversification measure impact EU farmers’ decisions? An assessment using an Individual Farm Model for CAP Analysis (IFM-CAP). Land Use Policy 2017, 66, 250–264. [Google Scholar] [CrossRef]
- Evaluation Study of the Payment for Agricultural Practices Beneficial for the Climate and the Environment—Final Report; Report Presented by the European Economic Interest Grouping “Alliance Environnement” in Collaboration with the Thünen Institute. Available online: https://ec.europa.eu/agriculture/sites/agriculture/files/fullrep_en.pdf (accessed on 15 August 2018).
- Gobattoni, F.; Pelorosso, R.; Ripa, M.N.; Leone, A. Percezione e Identità Paesaggistica: Un’opportunità di Sviluppo per I Territori Rurali. Italian J. Reg. Sci. 2015, 14, 49–70. [Google Scholar] [CrossRef]
- Panin, B.; Cortignani, R. Rural development approach in Italy: Example on area of Teverina as a possibility for Danube region. Econ. Agric. (Ekon. Poljopr.) 2011, 42, 365–372. [Google Scholar]
- Mitchell, R.C.; Carson, R.T. Using Surveys to Value Public goods: The Contingent Valuation Method; Resource for the Future: Washington, DC, USA, 1989. [Google Scholar]
- Cummings, R.G.; Brookshire, D.S.; Schulze, W.D. Valuing Environmental Goods: A State of the Arts Assessment of the Contingent Valuation Method; Roweman and Allanheld: Totowa, NJ, USA, 1996. [Google Scholar]
- Venkatachalam, L. The contingent valuation method: A review. Environ. Impact Assess. Rev. 2004, 24, 89–124. [Google Scholar] [CrossRef]
- Hermann, A.; Schleifer, S.; Wrbka, T. The Concept of Ecosystem Services Regarding Landscape Research: A Review. Living Rev. Landsc. Res. 2011, 5, 1–37. [Google Scholar] [CrossRef]
- Zanten, B.T.; Verburg, P.H.; Espinosa, M.; Gomez-y-Paloma, S.; Galimberti, G.; Kantelhardt, J.; Viaggi, D. European agricultural landscapes, common agricultural policy and ecosystem services: A review. Agron. Sustain. Dev. 2013, 34, 309–325. [Google Scholar] [CrossRef]
- Tempesta, T.; Thiene, M. The willingness to pay for the conservation of mountain landscape in Cortina D’Ampezzo (Italy). In Proceedings of the 90th EAAE Seminar “Multifunctional Agriculture, Policies and Markets: Understanding the Critical Linkages”, Rennes, France, 28–29 October 2004. [Google Scholar]
- Marangon, F.; Tempesta, T. L’impatto paesaggistico della viticoltura collinare. In Una Valutazione Economica in Zone Doc Del Friuli Venezia Giulia; La Valutazione Dei Beni Ambientali Come Supporto Alle Decisioni Pubbliche, Una Riflessione Alla Luce Della Normativa Comunitaria e Nazionale, Marangon, F., Tempesta, T., Eds.; Forume: Udine, Italy, 2001; pp. 115–133. [Google Scholar]
- Tempesta, T. People’s preferences and landscape evaluation in Italy: A review. New Medit. 2014, 13, 50–59. [Google Scholar]
- Idda, L.; Pulina, P.; Madau, F.A.; Sini, P.M.; Orru, E.; Benedetto, G. Il paesaggio nelle politiche di sviluppo rurale della Sardegna. In Gli Interventi Paesaggistico-Ambientali Nelle Politiche Regionali di Sviluppo Rurale; Marangon, F., Ed.; Franco Angeli: Milano, Italy, 2006; pp. 321–340. [Google Scholar]
- Torquati, B.; Giacchè, G.; Venanzi, S. Economic analysis of the traditional cultural vineyard landscapes in Italy. J. Rural Stud. 2015, 39, 122–132. [Google Scholar] [CrossRef]
- Hanemann, W.M. Welfare evaluations in contingent valuation experiments whit discrete responses: Reply. Am. J. Agric. Econ. 1989, 71, 1057–1061. [Google Scholar] [CrossRef]
- Arriaza, M.; Canas-Ortega, J.F.; Canas-Madueno, J.A.; Ruiz-Aviles, P. Assessing the visual quality of rural landscapes. Landsc. Urban Plan. 2004, 69, 115–125. [Google Scholar] [CrossRef]
- De Snoo, G.R.; Herzon, I.; Staats, H.; Burton, R.J.F.; Schindler, S.; van Dijk, J.; Lokhorst, A.M.; Bullock, J.M.; Lobley, M.; Wrbka, T.; et al. Toward effective nature conservation on farmland: Making farmers matter. Conserv. Lett. 2013, 6, 66–72. [Google Scholar] [CrossRef]
- Meadows, D. Thinking in Systems—A Primer; Earthscan: London, UK, 2009. [Google Scholar]
- European Commission. Proposal for a Regulation of the European Parliament and of the Council; COM (2018) 392 Final; European Commission: Brussels, Belgium, 1 June 2018. [Google Scholar]
Figure 1.
Study area. The Teverina Consortium (source: [1]).
Figure 1.
Study area. The Teverina Consortium (source: [1]).

Figure 2.
The photos shown to the interviewees. (A) Traditional extensive farm landscape of Teverina Consortium (2014); (B) The same landscape without greening practices (modified scenario).
Figure 2.
The photos shown to the interviewees. (A) Traditional extensive farm landscape of Teverina Consortium (2014); (B) The same landscape without greening practices (modified scenario).


Table 1.
Summary scheme of the first pillar of the CAP.
| 1962–1991 First phase | • price support of agricultural products |
| 1992–1999 MacSharry reform | • reduction of price support |
| • coupled payments | |
| 2000–2004 Agenda 2000 | • further reduction of price support |
| • increase of coupled payments | |
| 2005–2013 Fischler reform and Health check | • decoupled and coupled payments |
| • cross-compliance: mandatory management criteria and good agronomic and environmental condition | |
| • reduction of decoupled payments, and penalties in case of non-compliance of cross-compliance rules | |
| 2014–2020 CAP 2020 | • decoupled (basic, greening) and coupled payments |
| • cross-compliance: mandatory management criteria and good agronomic and environmental condition | |
| • convergence of basic payments | |
| • greening practices: diversifying cultivation, maintenance of permanent grassland and maintenance of the Ecological Focus Areas | |
| • reduction of decoupled payments, and penalties in case of non-compliance of cross-compliance rules and of greening practices |
Table 2.
Total Agricultural Area in hectares and the relative percentage of various components for each municipality and the whole Teverina Consortium.
Table 2.
Total Agricultural Area in hectares and the relative percentage of various components for each municipality and the whole Teverina Consortium.
| Municipalities | Total Agricultural Area | Utilised Agricultural Area | Arboriculture Area | Forest Area | Other Agricultural Area |
|---|---|---|---|---|---|
| ha | % | ||||
| Bagnoregio | 5758 | 70.4 | 1.4 | 20.4 | 7.8 |
| Castiglione in Teverina | 1422 | 77.3 | 1.0 | 10.7 | 11.0 |
| Celleno | 1916 | 82.0 | 0.7 | 9.0 | 8.2 |
| Civitella d’Agliano | 2113 | 74.4 | 1.1 | 13.1 | 11.4 |
| Graffignano | 1494 | 74.5 | 0.2 | 18.6 | 6.7 |
| Lubriano | 898 | 82.9 | 0.2 | 9.5 | 7.4 |
| Total | 13,601 | 74.7 | 1.0 | 15.7 | 8.6 |
Source: Own elaboration on 2010 Agricultural Census.
Table 3.
Utilised Agricultural Area in hectares and the relative percentage of various components for each municipality and the whole Teverina Consortium.
Table 3.
Utilised Agricultural Area in hectares and the relative percentage of various components for each municipality and the whole Teverina Consortium.
| Municipalities | Utilised Agricultural Area | Arable Land | Vine | Permanent Crops | Vegetable | Permanent Grassland and Pasture |
|---|---|---|---|---|---|---|
| ha | % | |||||
| Bagnoregio | 4054 | 72.0 | 0.5 | 5.5 | 0.4 | 21.6 |
| Castiglione in Teverina | 1100 | 64.6 | 15 | 9.3 | 0.0 | 11.0 |
| Celleno | 1572 | 72.4 | 0.6 | 8.1 | 0.4 | 18.5 |
| Civitella d’Agliano | 1572 | 57.5 | 15.8 | 12.7 | 0.2 | 13.7 |
| Graffignano | 1112 | 77.4 | 3.0 | 15.5 | 0.4 | 3.7 |
| Lubriano | 745 | 74.9 | 1.7 | 6.4 | 0.4 | 16.6 |
| Total | 10,155 | 69.8 | 4.8 | 8.6 | 0.3 | 16.4 |
Source: Own elaboration on 2010 Agricultural Census.
Table 4.
Percentage of farms number and Utilised Agricultural Area for different farm size for each municipality and the whole Teverina Consortium.
Table 4.
Percentage of farms number and Utilised Agricultural Area for different farm size for each municipality and the whole Teverina Consortium.
| Farms Number | UAA | |||
|---|---|---|---|---|
| <10 ha | >10 ha | <10 ha | >10 ha | |
| Bagnoregio | 75.0 | 25.0 | 13.8 | 86.2 |
| Castiglione in Teverina | 80.2 | 19.8 | 16.0 | 84.0 |
| Celleno | 72.3 | 27.7 | 12.6 | 87.4 |
| Civitella d’Agliano | 84.3 | 15.7 | 22.7 | 77.3 |
| Graffignano | 92.8 | 7.2 | 47.5 | 52.5 |
| Lubriano | 71.1 | 28.9 | 16.7 | 83.3 |
| Total | 80.6 | 19.4 | 18.0 | 82.0 |
Source: Own elaboration on 2010 Agricultural Census.
Table 5.
Main sample characteristics (n = 150).
| Age | % |
|---|---|
| <30 | 24.7 |
| 31–50 | 36.0 |
| 51–70 | 28.0 |
| >70 | 11.3 |
| Educational level | % |
| Degree (first and second level) | 28.7 |
| others | 71.3 |
| Gender | % |
| male | 53.3 |
| female | 46.7 |
| Household income | % |
| 0–15,000 | 24.7 |
| 15,000–30,000 | 37.3 |
| 30,000–45,000 | 24.0 |
| 45,000–60,000 | 9.3 |
| >60,000 | 4.7 |
Source: Own elaboration on survey data.
Table 6.
Description of the independent variables.
| Variable | Type | Characteristics |
|---|---|---|
| BID | discrete | proposed amount |
| OCC | dichotomous | 1: occupation with fixed monthly income |
| 0: otherwise | ||
| FAM | discrete | family members number |
| FEM | dichotomous | 1: female |
| 0: otherwise | ||
| AGE | continuous | age |
| FARM | dichotomous | 1: who see farming as a source of future income |
| 0: otherwise | ||
| LAND | dichotomous | 1: owners of agricultural land |
| 0: otherwise | ||
| BRAND | dichotomous | 1: deep knowledge of product and territory brands |
| 0: otherwise | ||
| AWAR | dichotomous | 1: importance of people awareness for the sustainable rural development |
| 0: otherwise | ||
| CROPS | dichotomous | 1: presence of more crops such as most relevant aspect for the landscape |
| 0: otherwise | ||
| HISTC | dichotomous | 1: historical center as the main element to be protected |
| 0: otherwise |
Table 7.
Estimation results.
| Variable | Coefficient | Std. Error | Prob. | Effects |
|---|---|---|---|---|
| C | 1.71 | 0.88 | 0.05 ** | |
| BID | −0.02 | 0.01 | 0.00 *** | − |
| OCC | 2.29 | 0.68 | 0.00 *** | + |
| FAM | −0.86 | 0.51 | 0.09 * | − |
| FEM | −0.89 | 0.47 | 0.06 * | − |
| AGE | −0.01 | 0.01 | 0.35 | |
| FARM | 1.12 | 0.46 | 0.02 ** | + |
| LAND | −0.43 | 0.45 | 0.34 | |
| BRAND | 0.29 | 0.60 | 0.63 | |
| AWAR | 2.63 | 0.74 | 0.00 *** | + |
| CROPS | 0.94 | 0.44 | 0.03 ** | + |
| HISTC | −0.89 | 0.48 | 0.06 * | − |
| McFadden R-squared | 0.30 | |||
| Obs with Dep = 0 | 77 | Obs with Dep = 1 | 73 | |
Statistical significance: *** high; ** medium; * low.
Table 8.
Calculation of perceived landscape benefits.
| median WTP | €94.76 |
| number of resident households | 5507 |
| perceived landscape benefits—total | €521,834 |
| Total agricultural area—hectares | 13,601 |
| perceived landscape benefits—hectare | €/ha 38.4 |
Table 9.
Cost-benefit analysis of the Greening.
| Benefits | Costs | Benefits/Costs | Costs | Benefits/Costs |
|---|---|---|---|---|
| on Greening Payments | on Decoupled Payments | |||
| €521,834 | €1,482,509 | 35.2% | €4,447,527 | 11.7% |
| €/ha 38.4 | €/ha 109.0 | 35.2% | €/ha 327.0 | 11.7% |
© 2018 by the authors. Licensee MDPI, Basel, Switzerland. This article is an open access article distributed under the terms and conditions of the Creative Commons Attribution (CC BY) license (http://creativecommons.org/licenses/by/4.0/).
Share and Cite
MDPI and ACS Style
Cortignani, R.; Gobattoni, F.; Pelorosso, R.; Ripa, M.N. Green Payment and Perceived Rural Landscape Quality: A Cost-Benefit Analysis in Central Italy. Sustainability 2018, 10, 2910. https://0-doi-org.brum.beds.ac.uk/10.3390/su10082910
AMA Style
Cortignani R, Gobattoni F, Pelorosso R, Ripa MN. Green Payment and Perceived Rural Landscape Quality: A Cost-Benefit Analysis in Central Italy. Sustainability. 2018; 10(8):2910. https://0-doi-org.brum.beds.ac.uk/10.3390/su10082910
Chicago/Turabian StyleCortignani, Raffaele, Federica Gobattoni, Raffaele Pelorosso, and Maria Nicolina Ripa. 2018. "Green Payment and Perceived Rural Landscape Quality: A Cost-Benefit Analysis in Central Italy" Sustainability 10, no. 8: 2910. https://0-doi-org.brum.beds.ac.uk/10.3390/su10082910
Note that from the first issue of 2016, this journal uses article numbers instead of page numbers. See further details here.