Susceptibility Assessments of Landslides in Hulu Kelang Area Using a Geographic Information System-Based Prediction Model


Abstract
:1. Introduction
2. Methodology and Materials
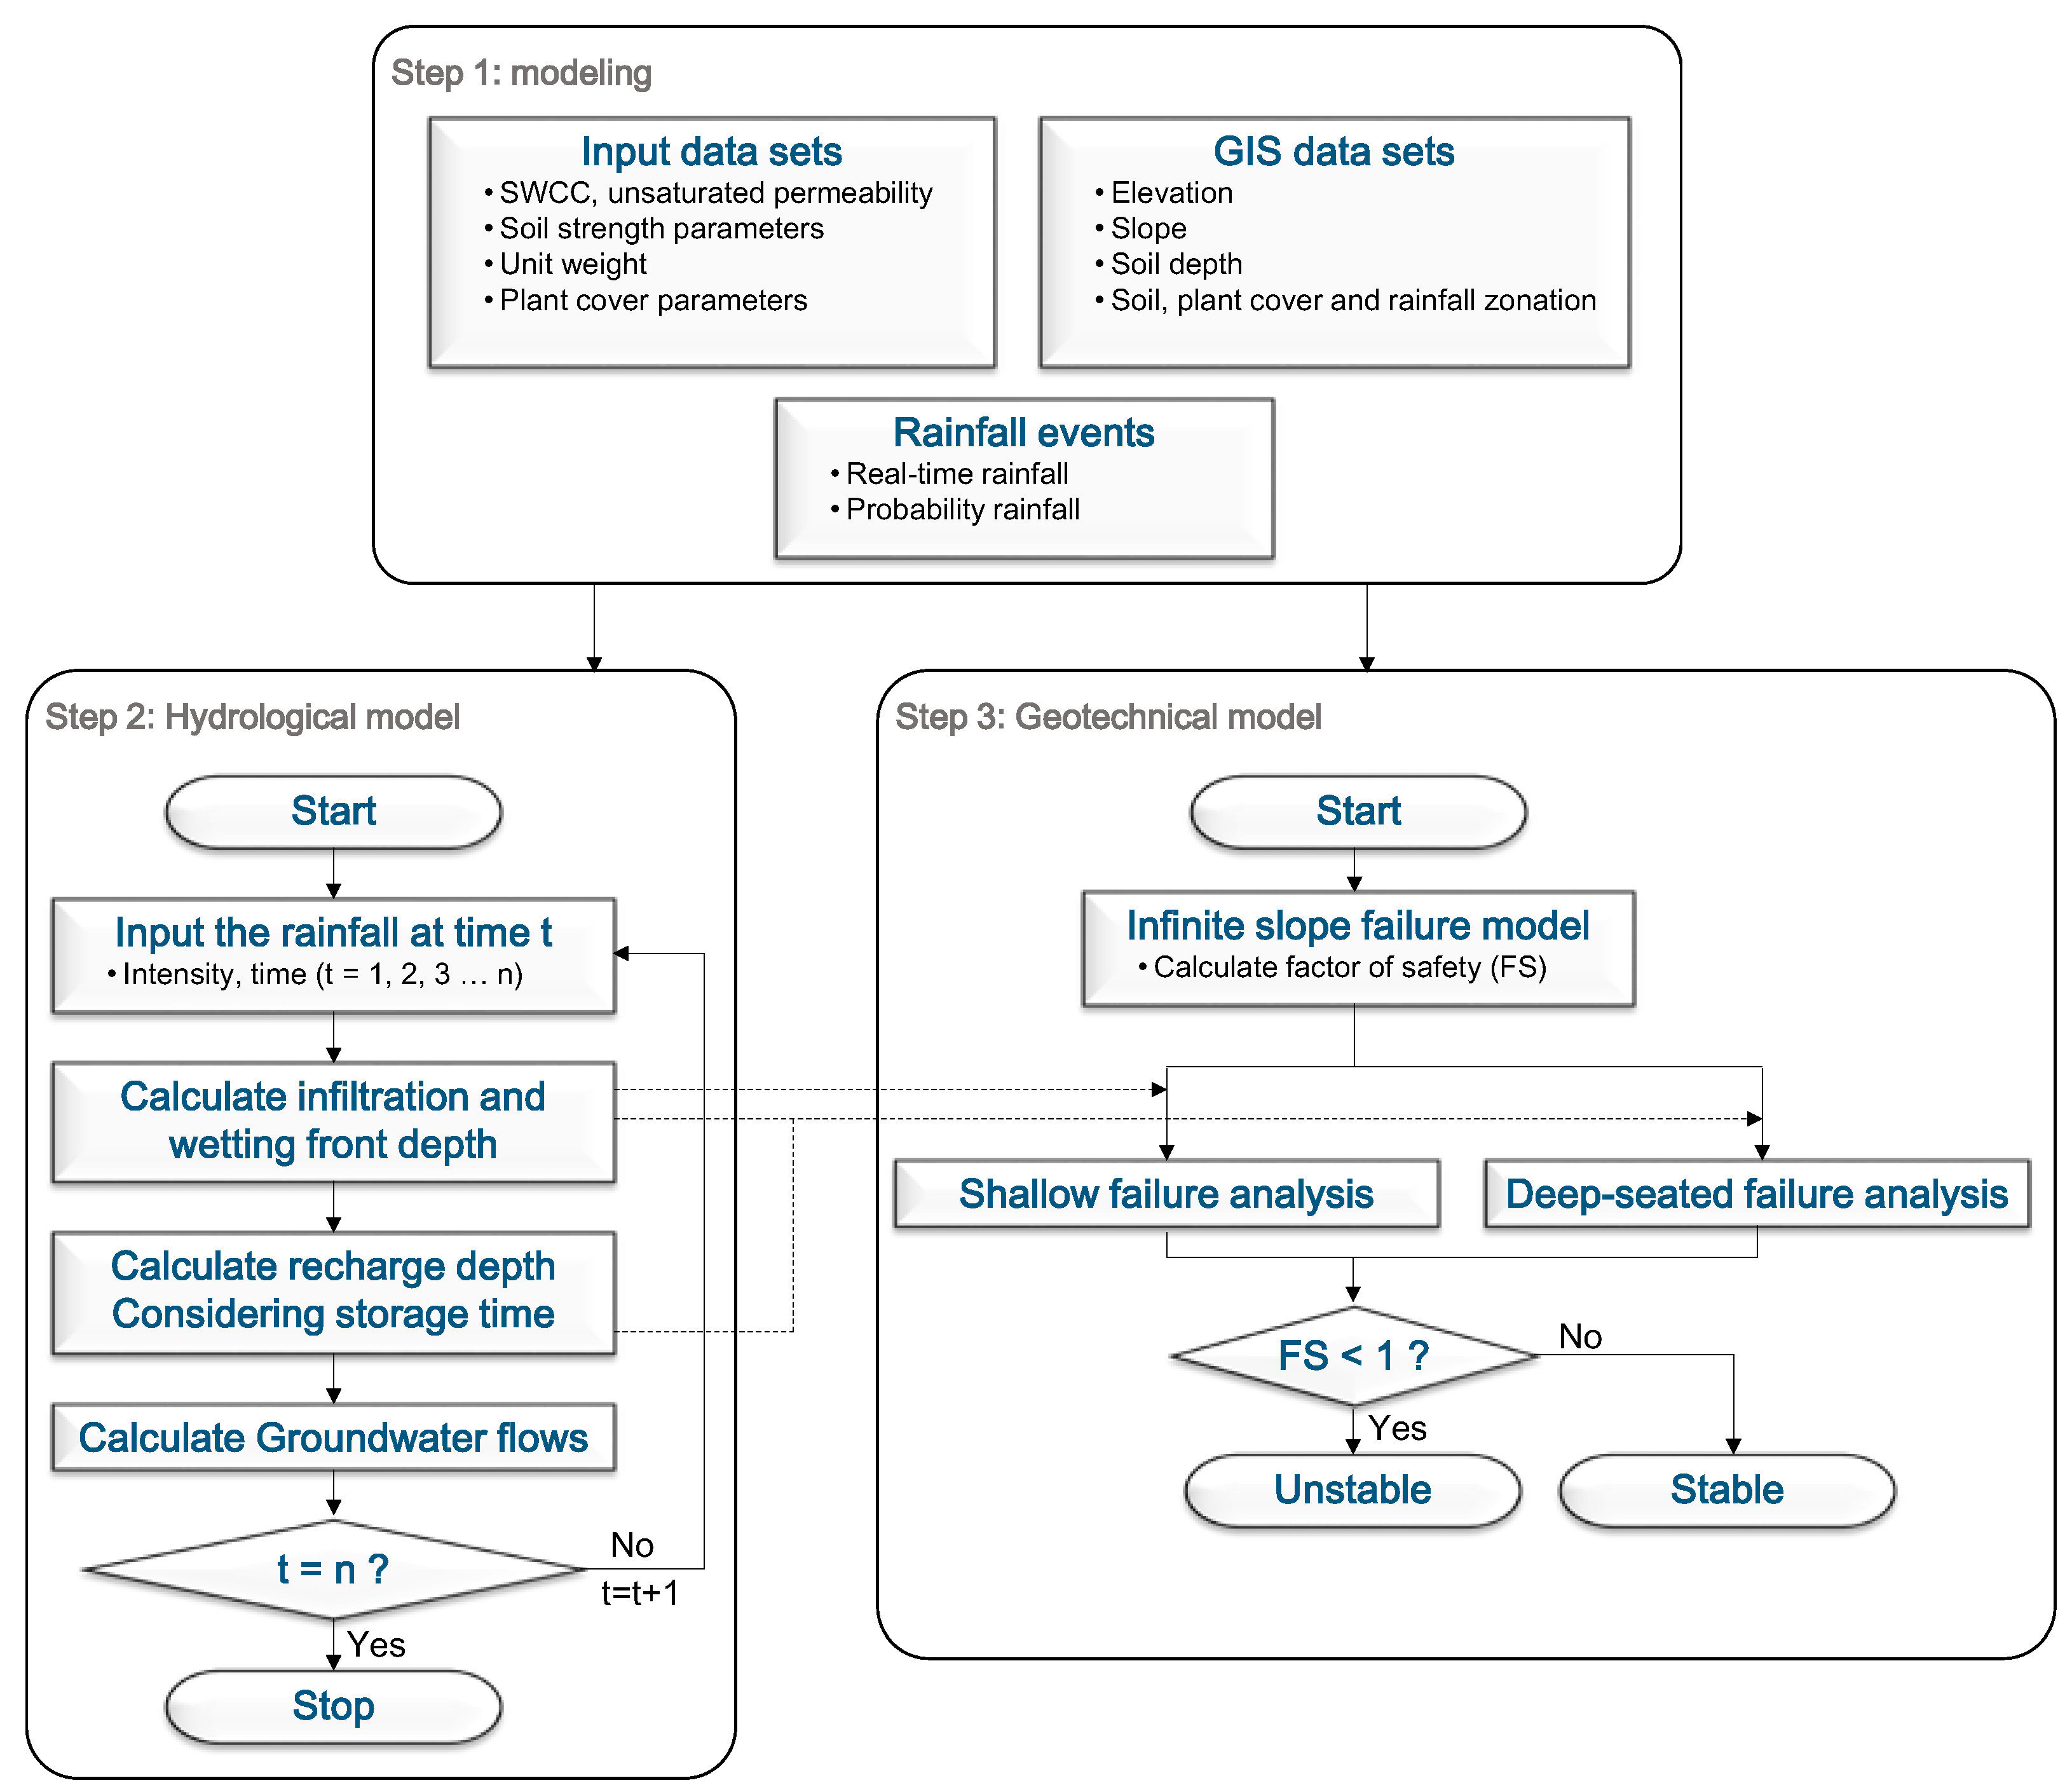
2.1. YS-Slope Model
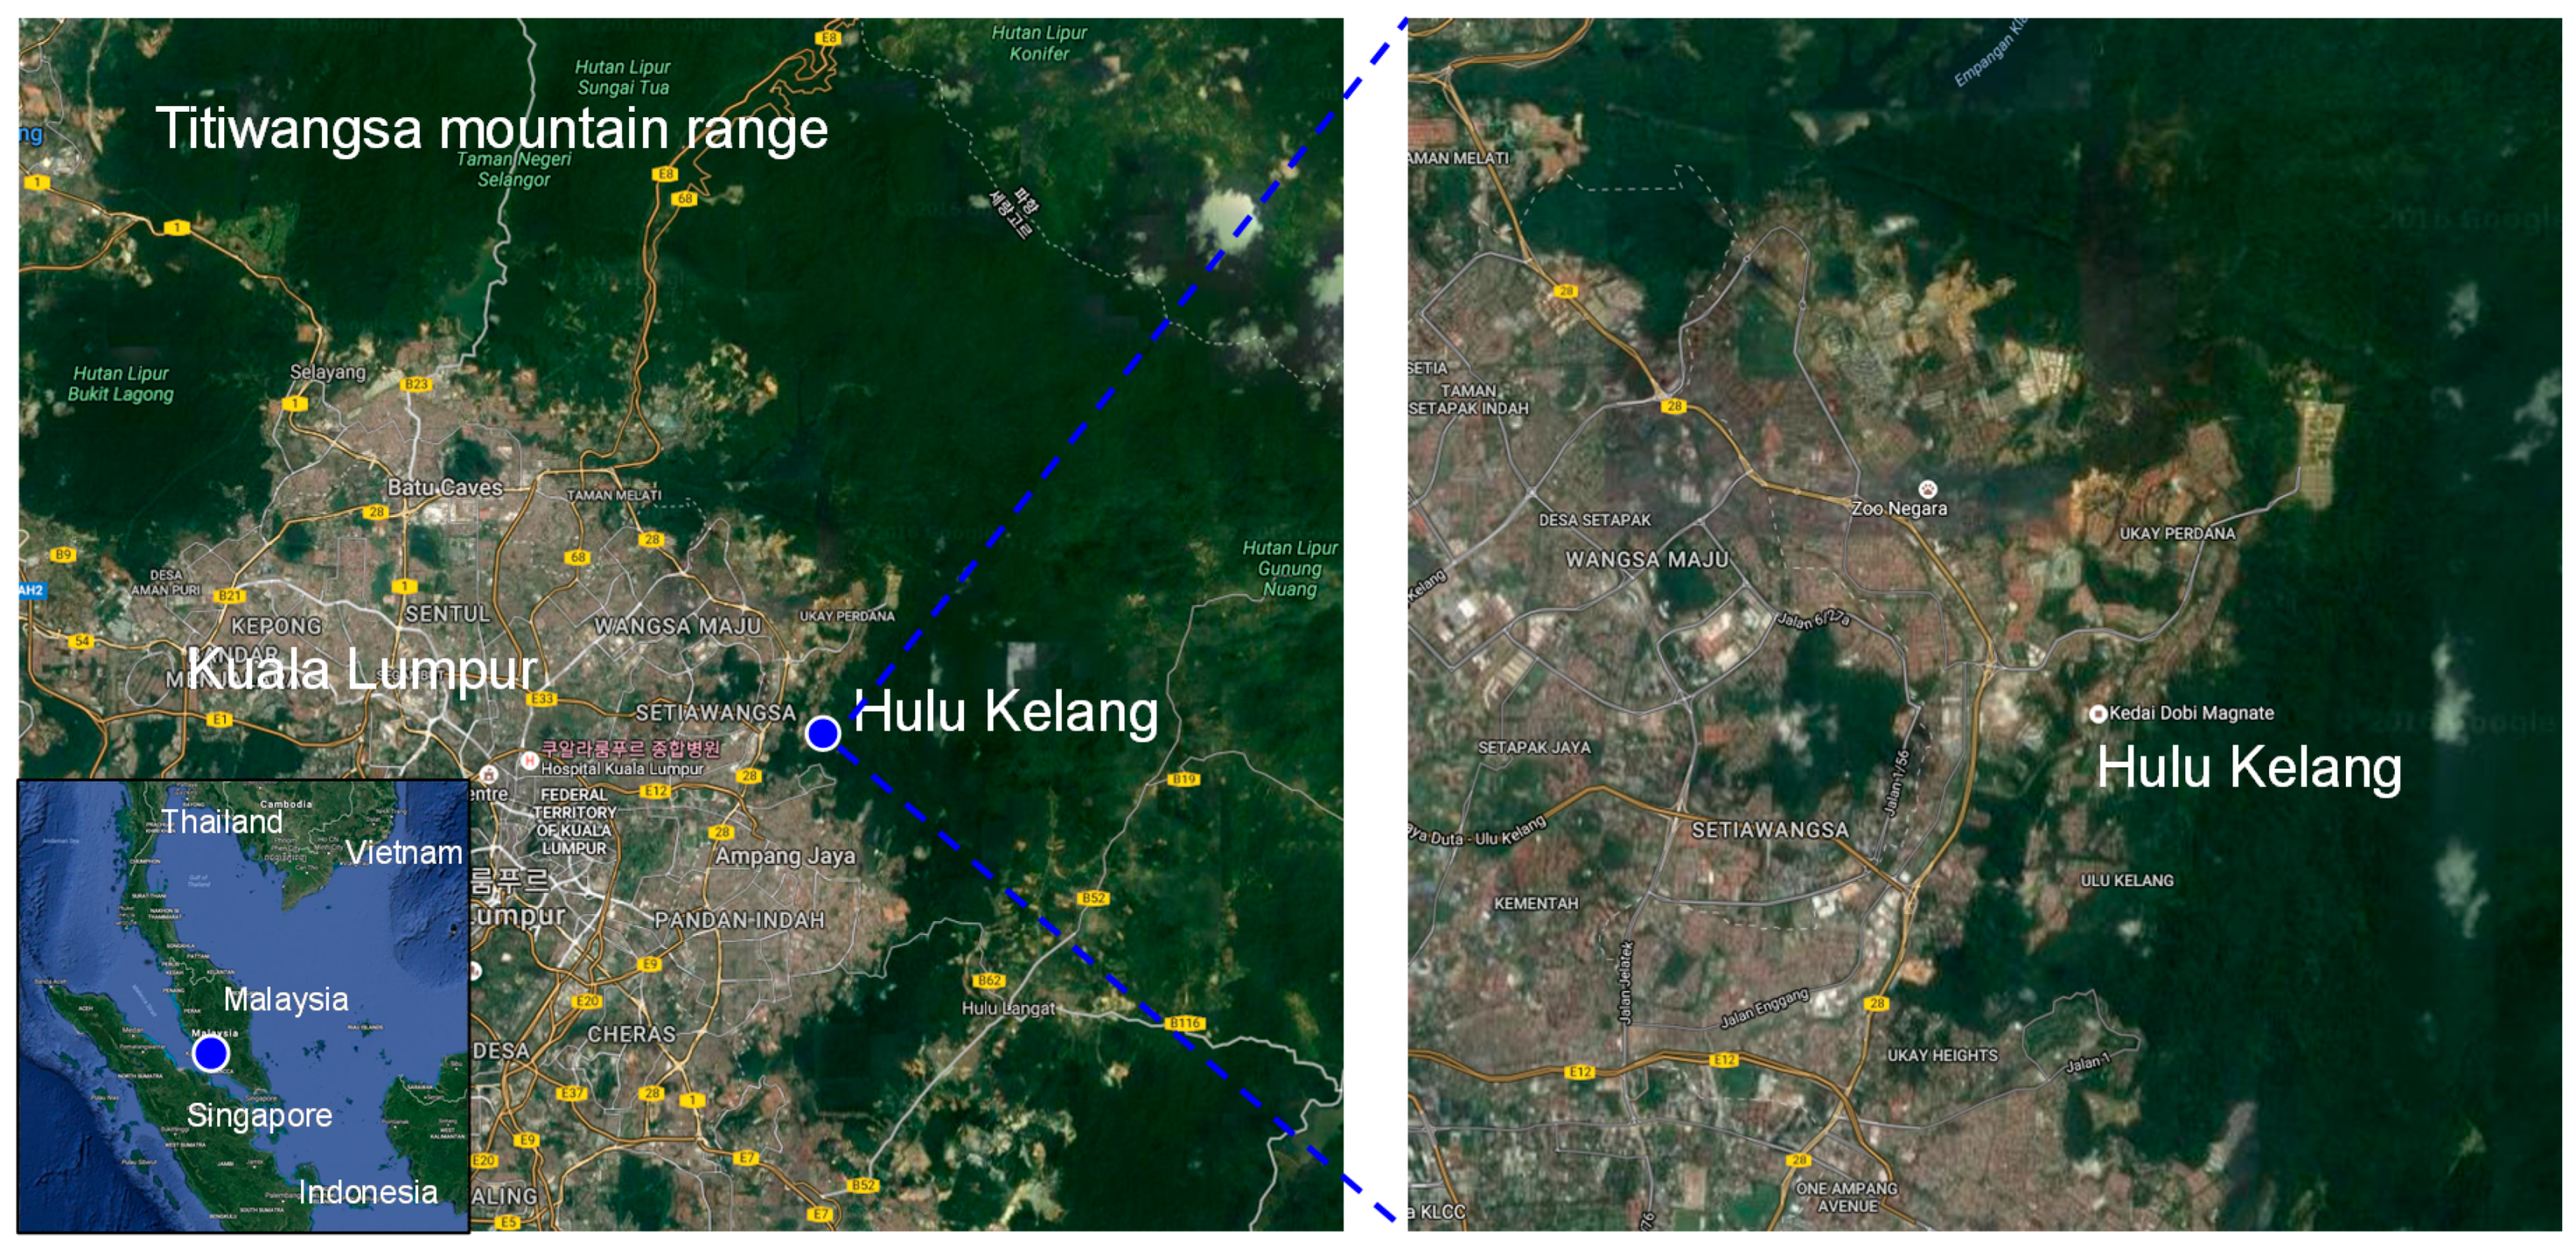
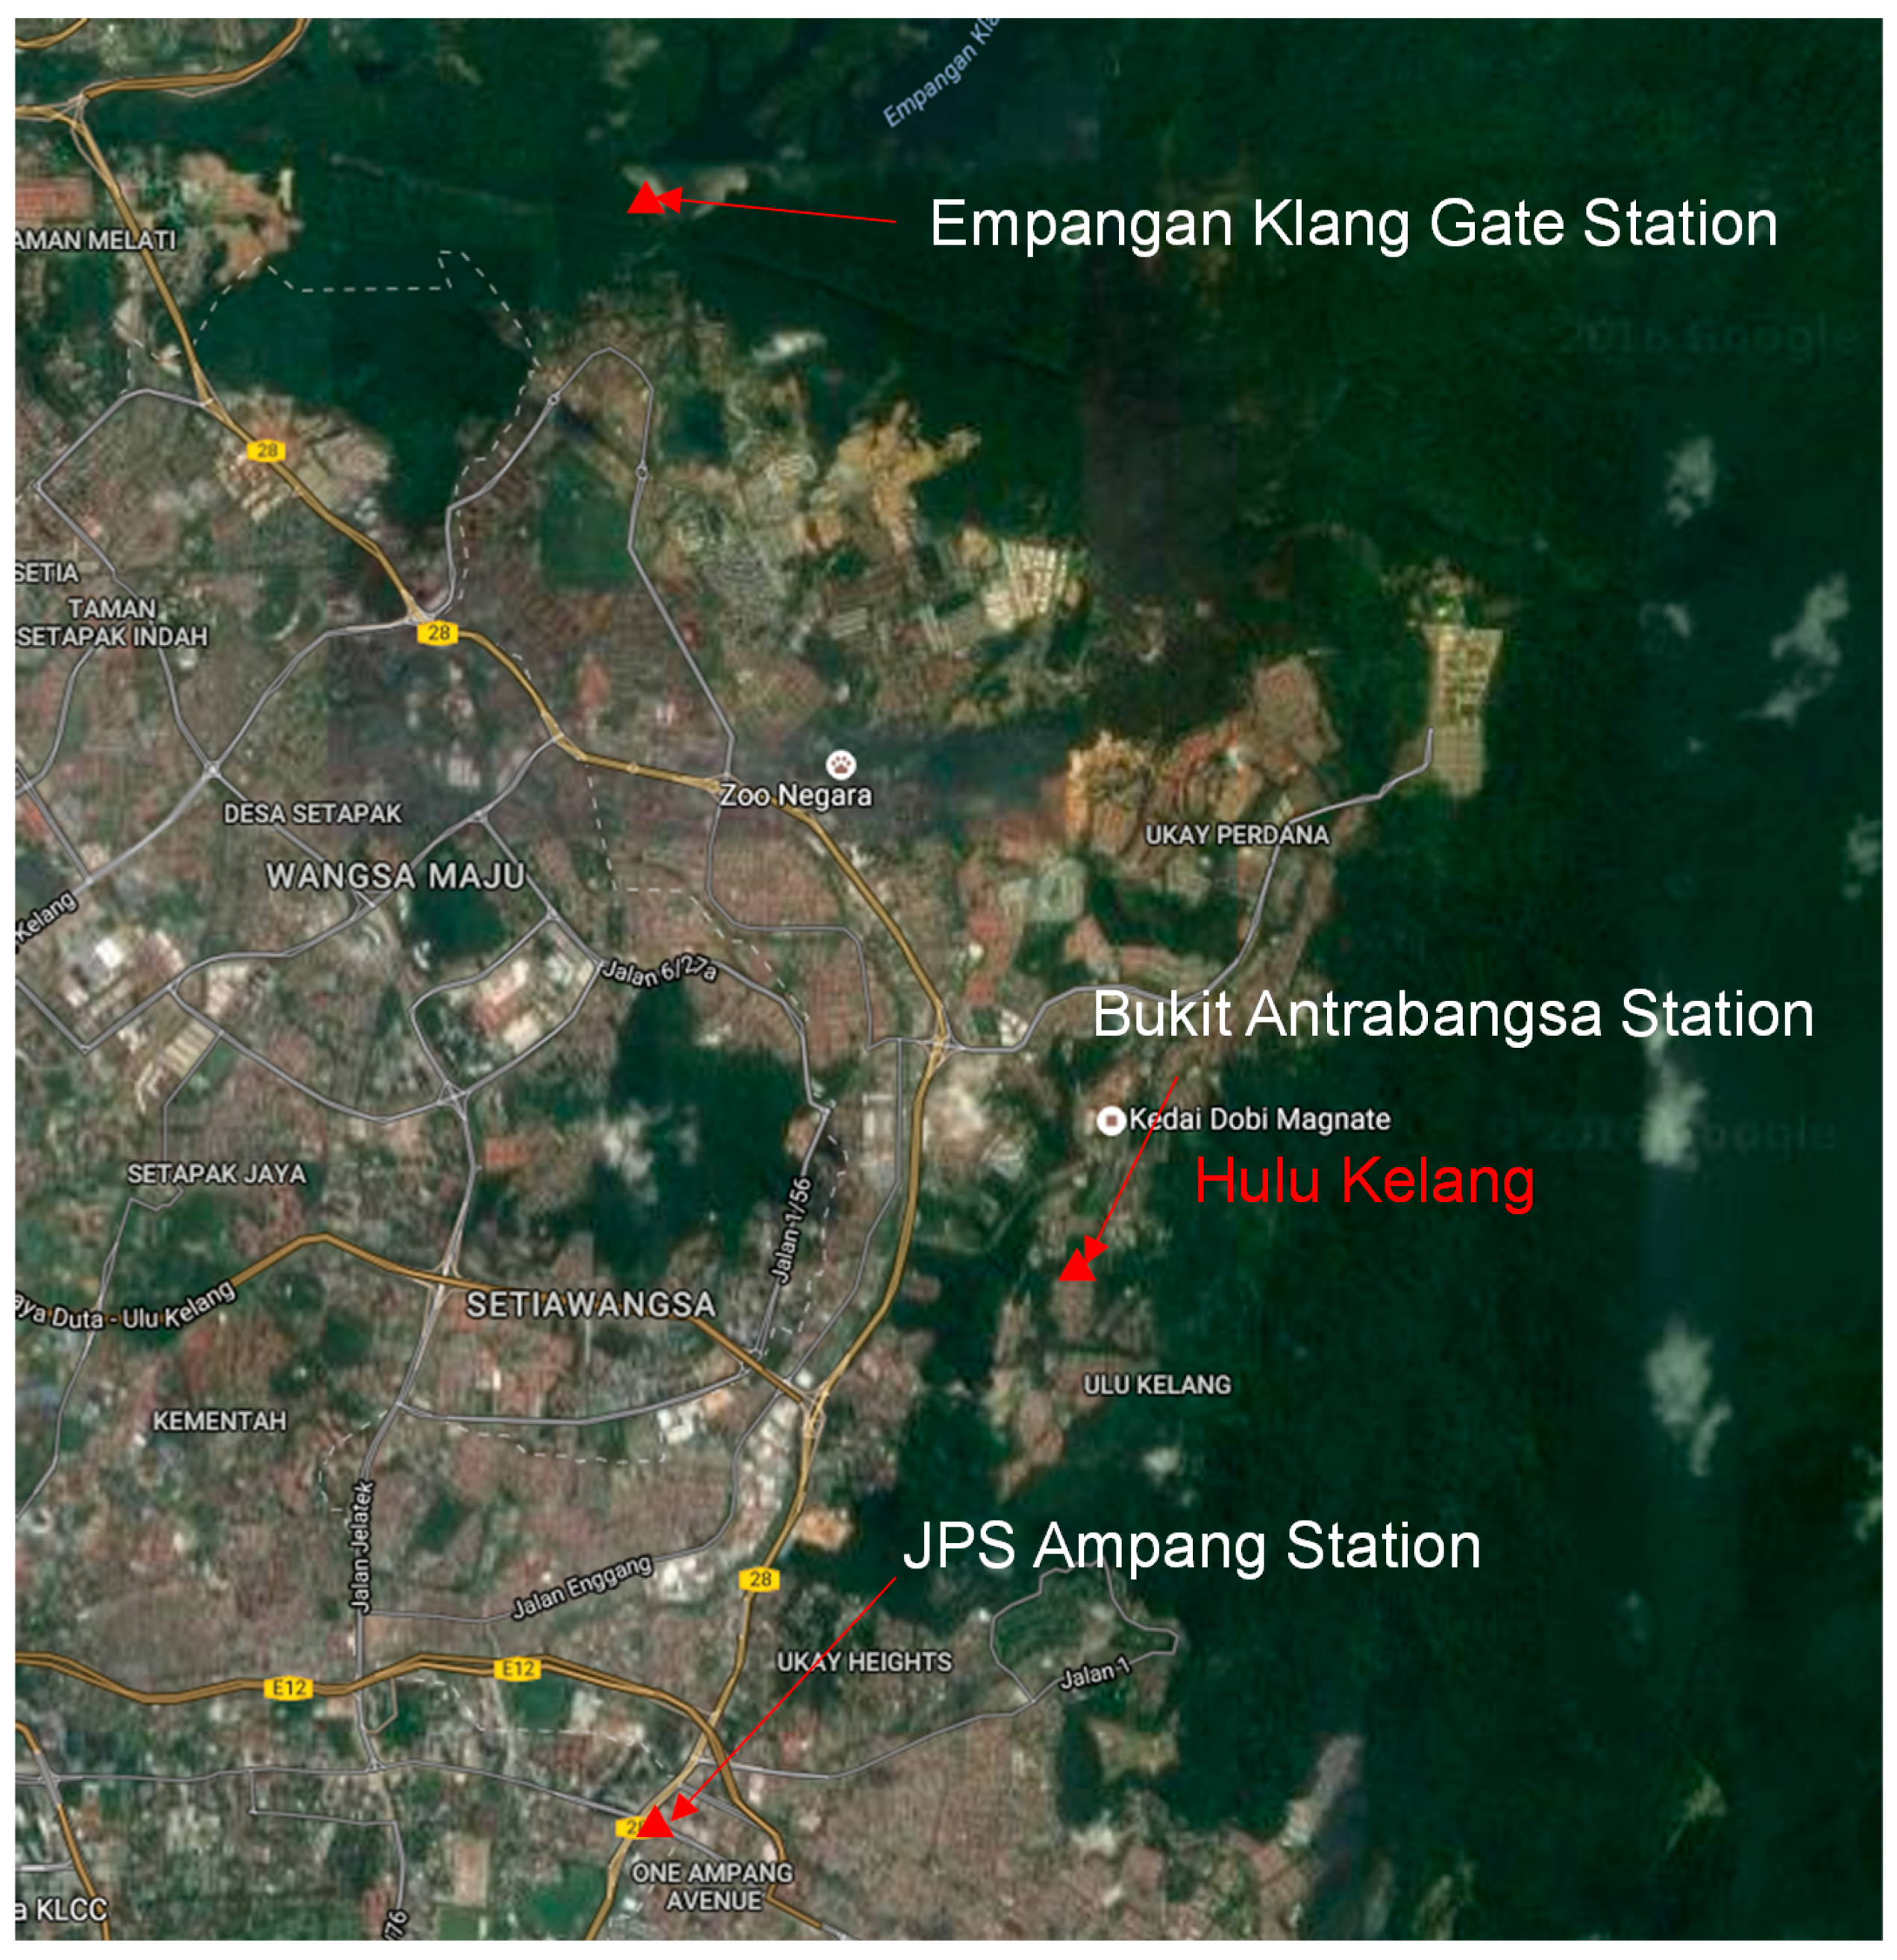
2.2. Study Area
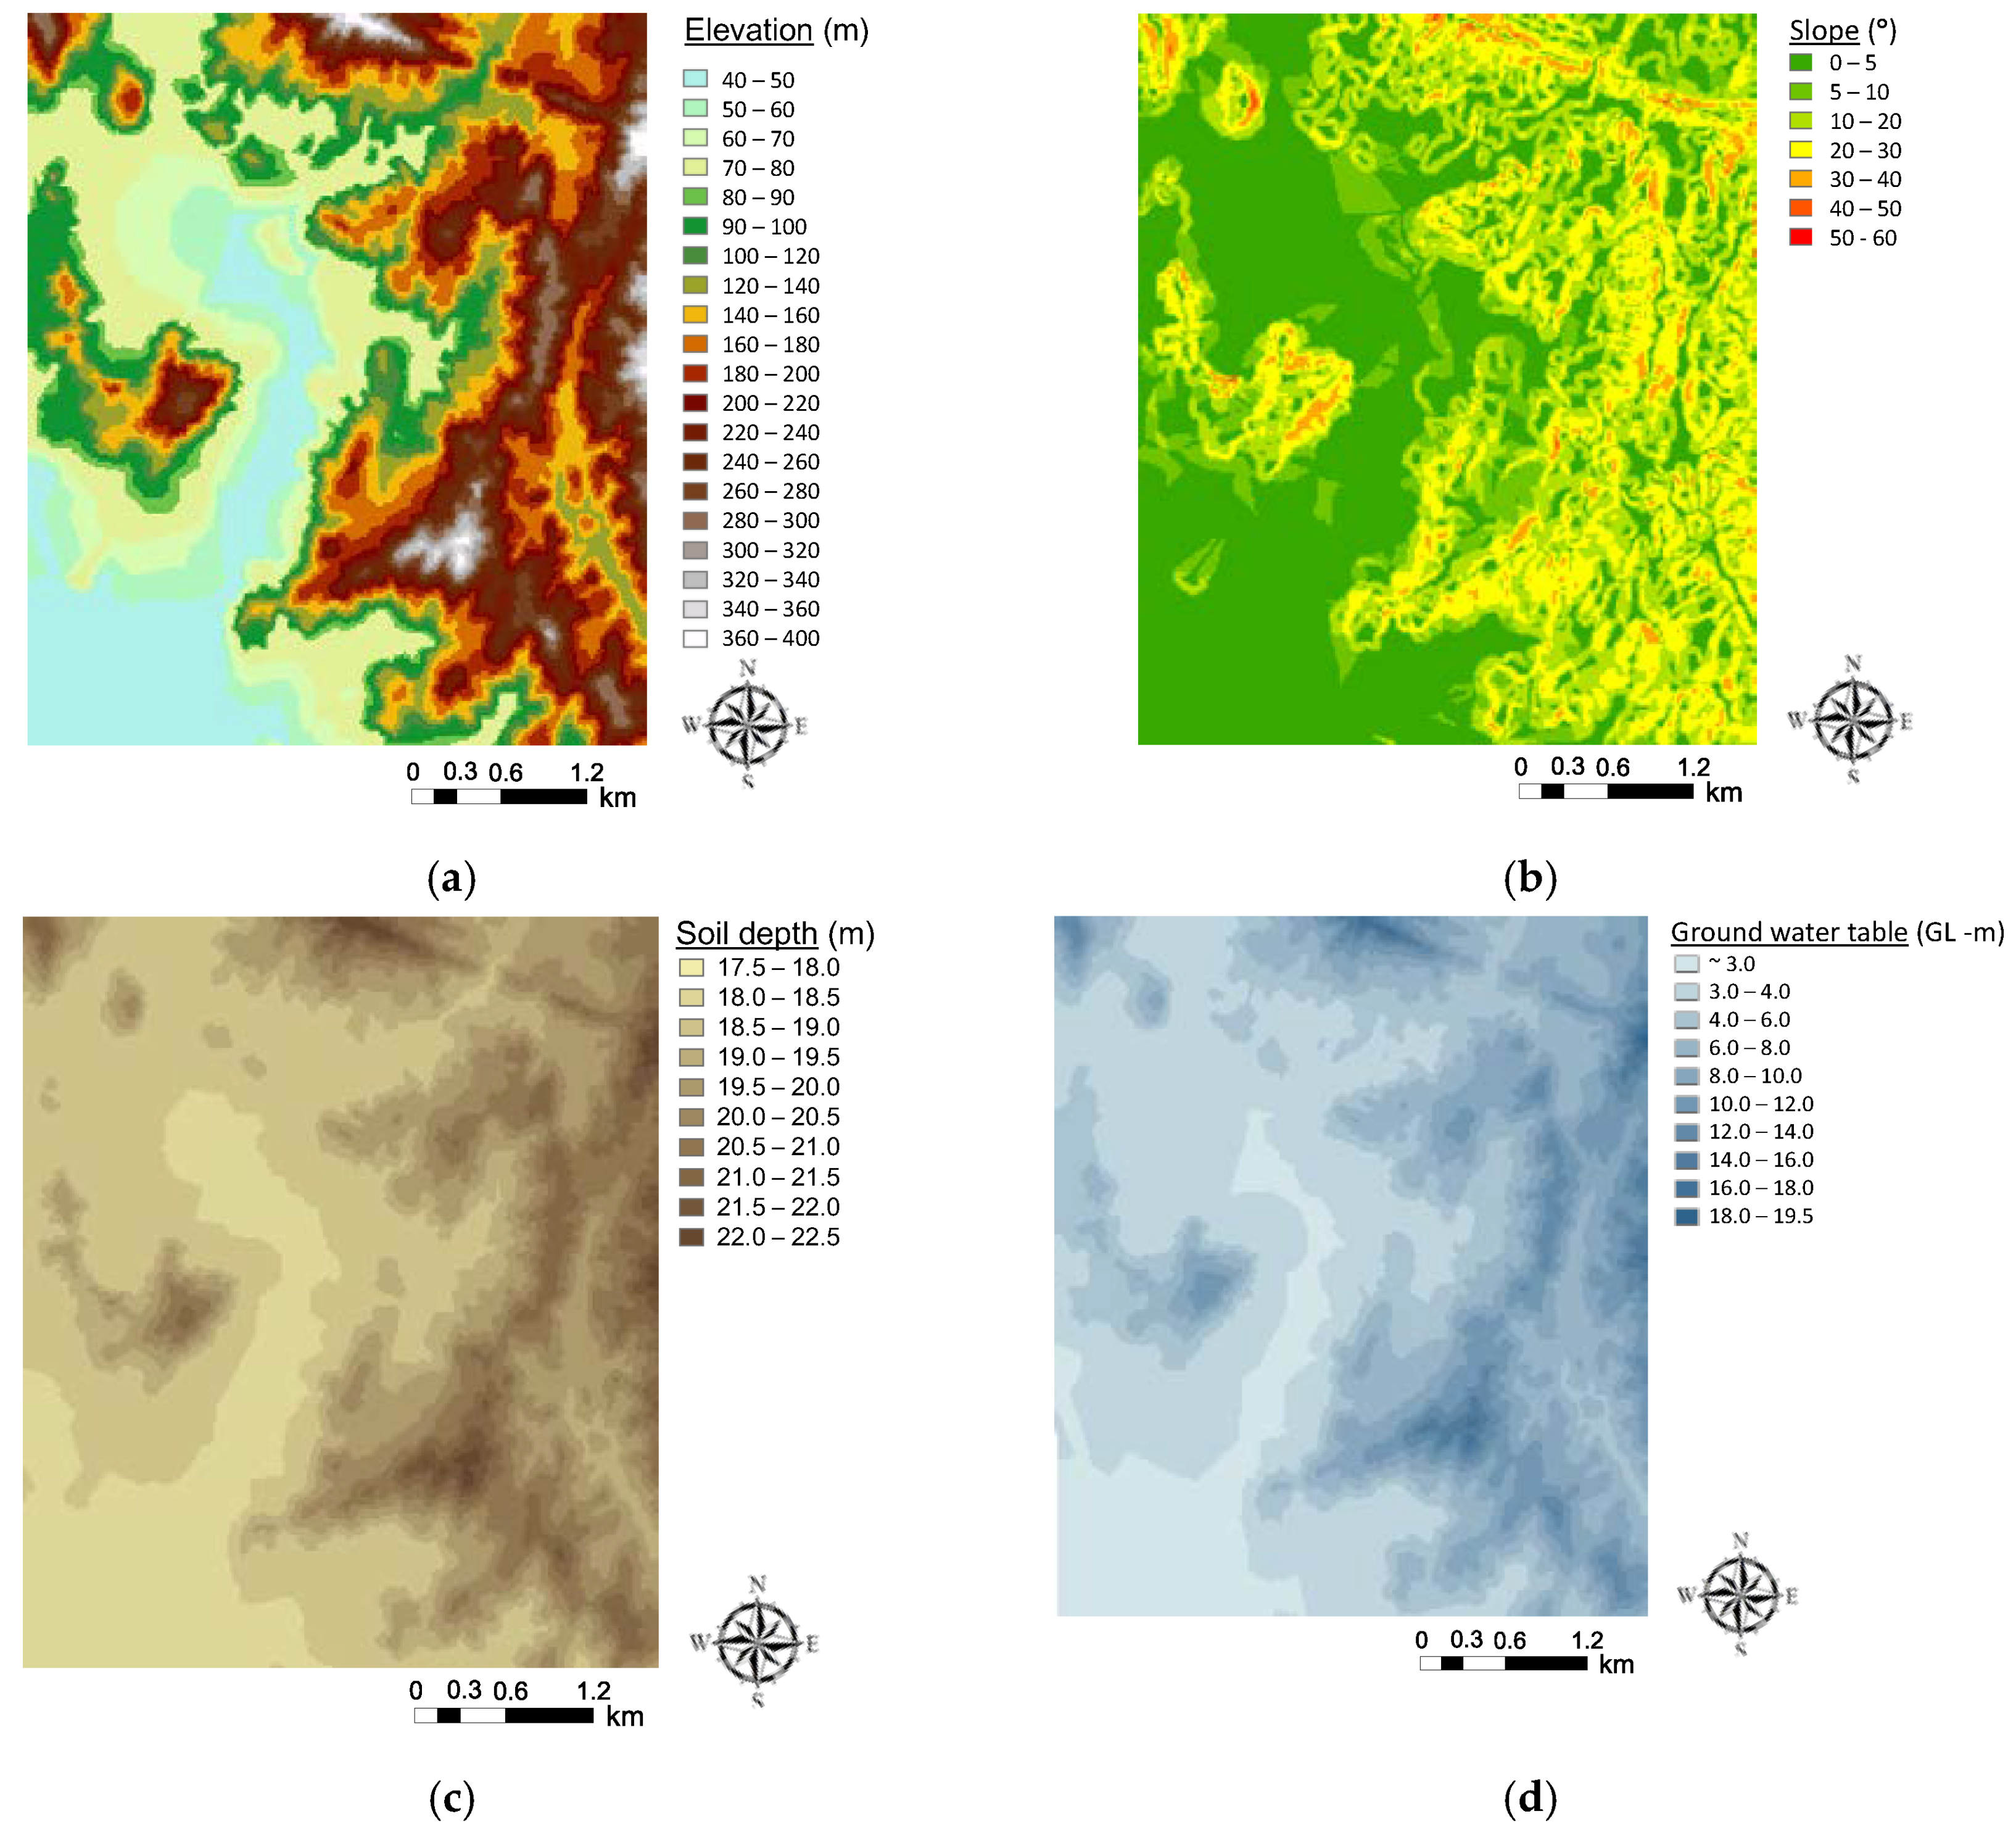
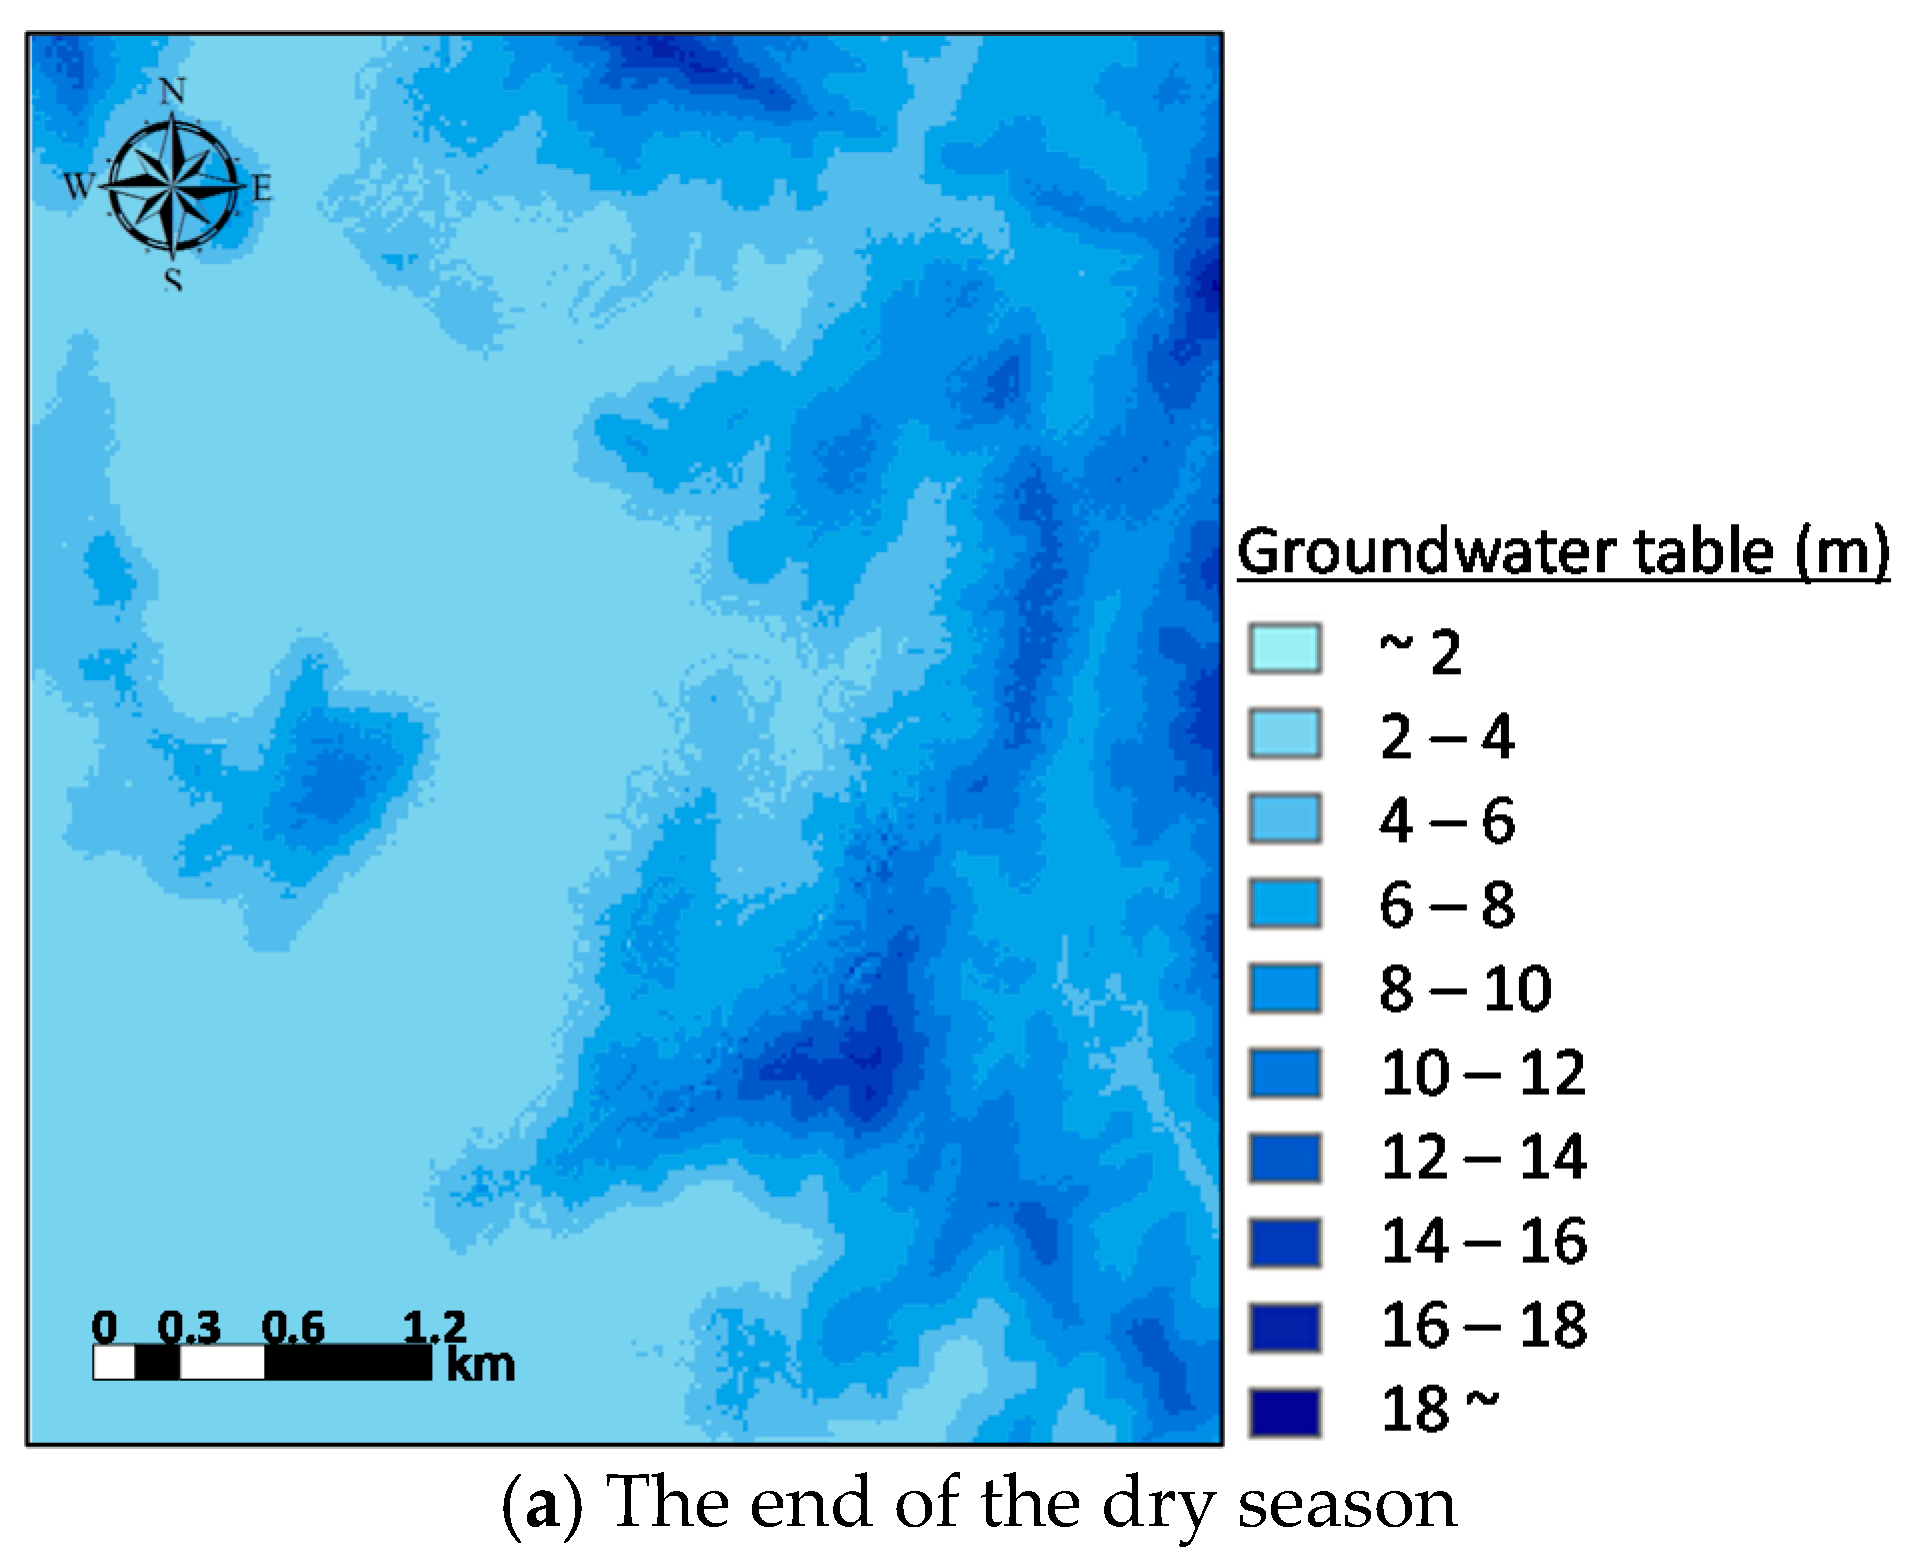
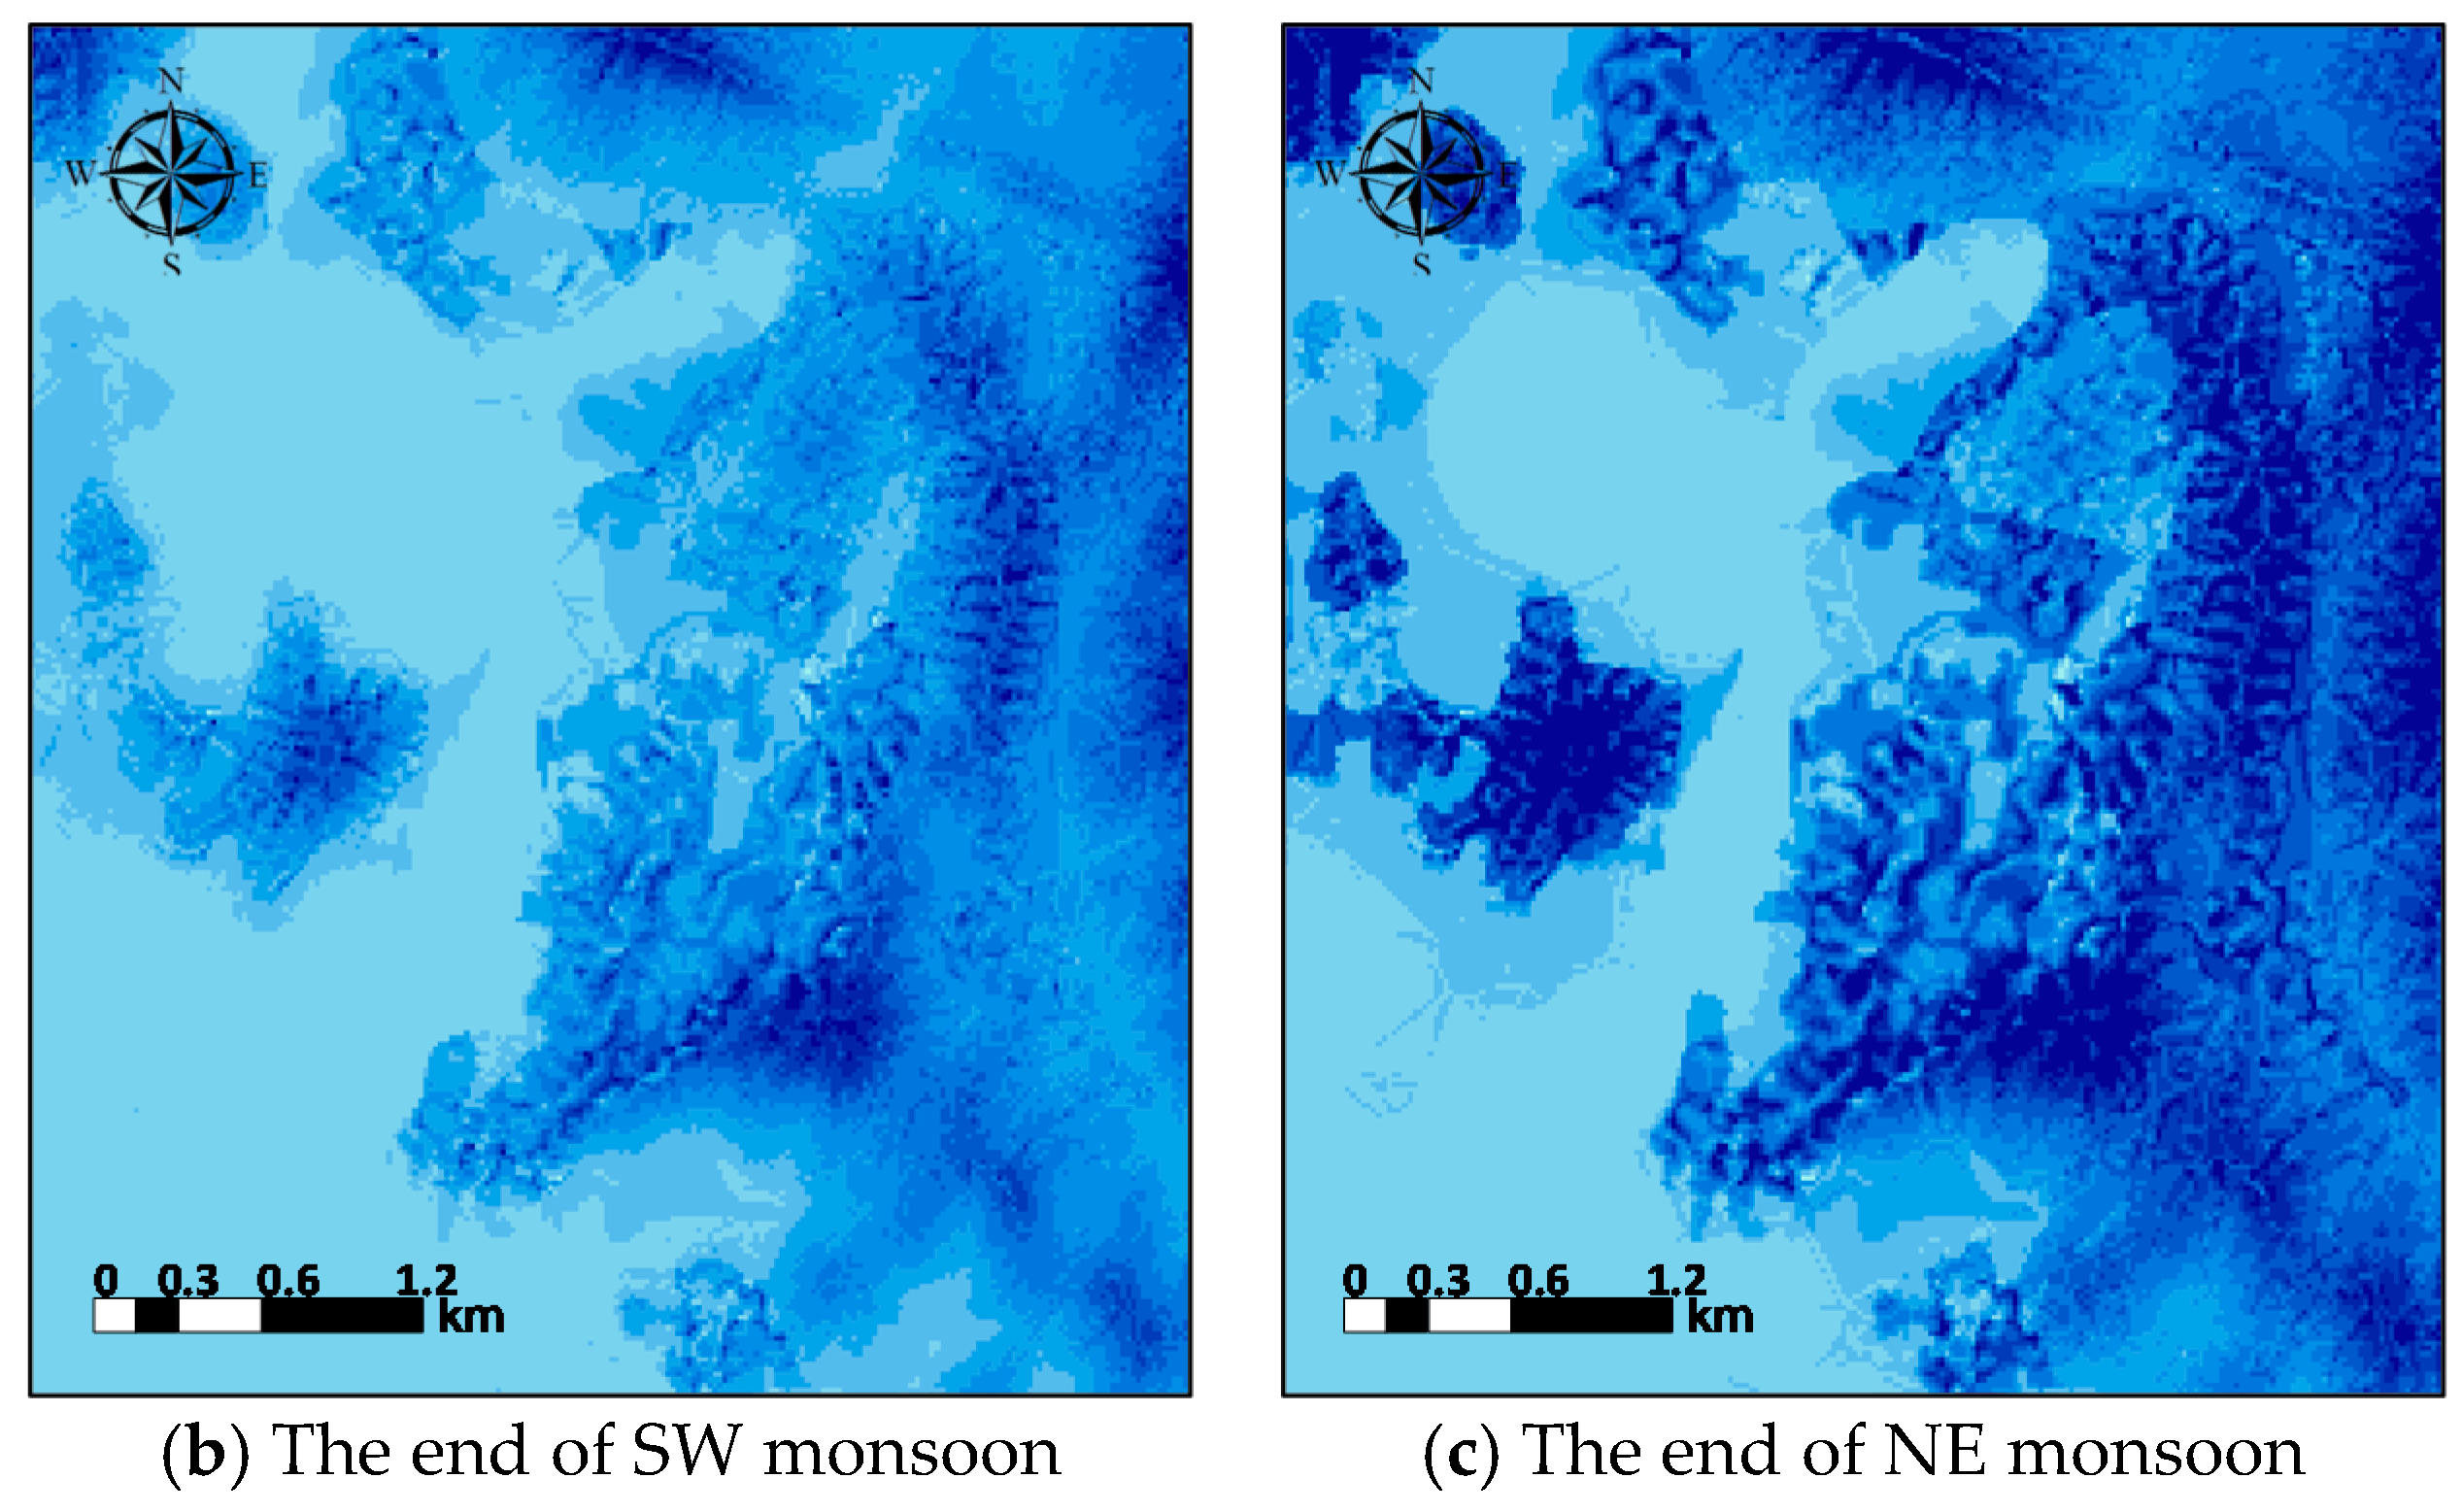
2.2.1. Digital Elevation Model (DEM), Slope, Soil Depth and Groundwater Table
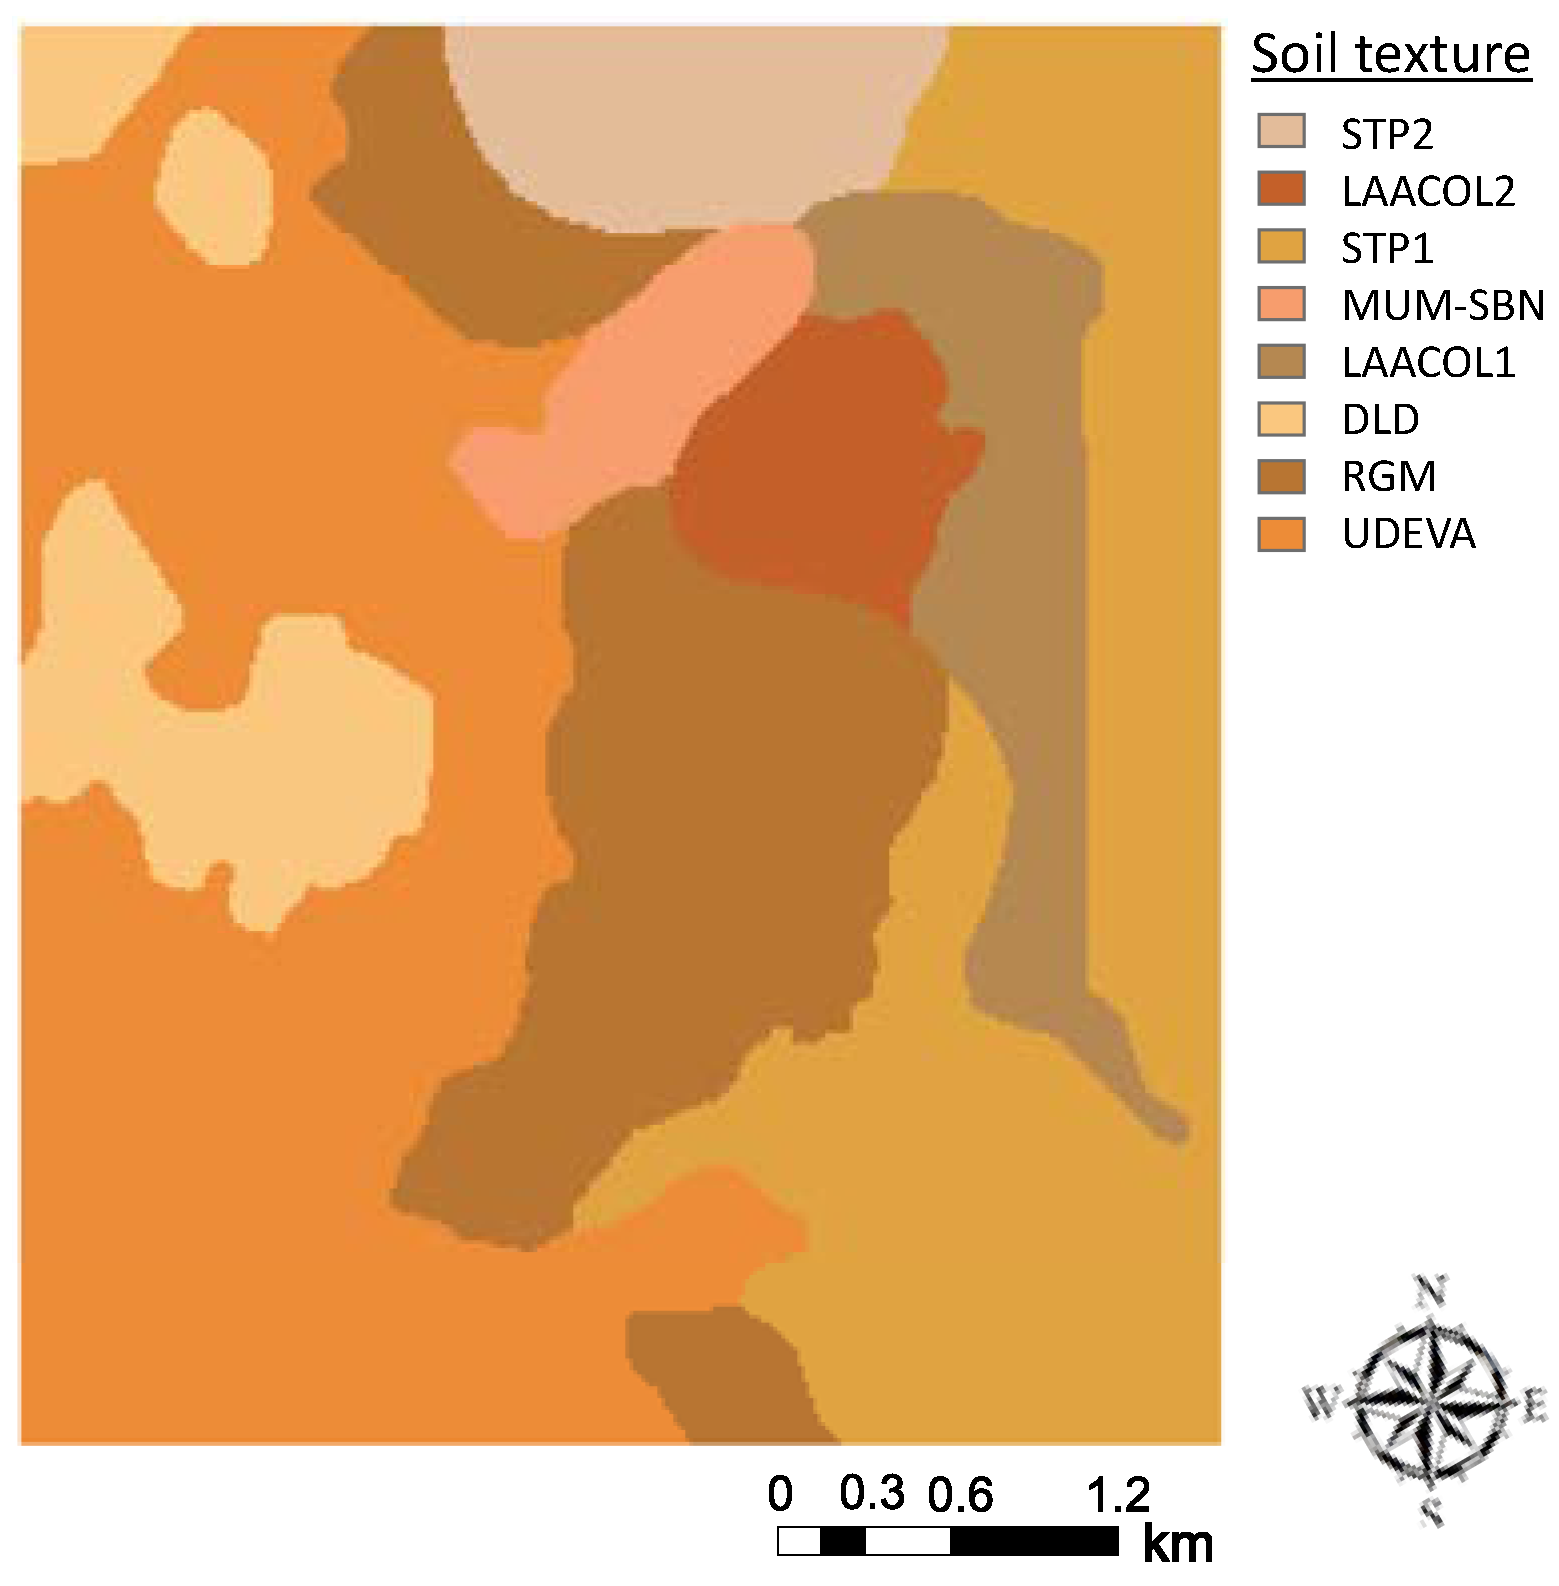
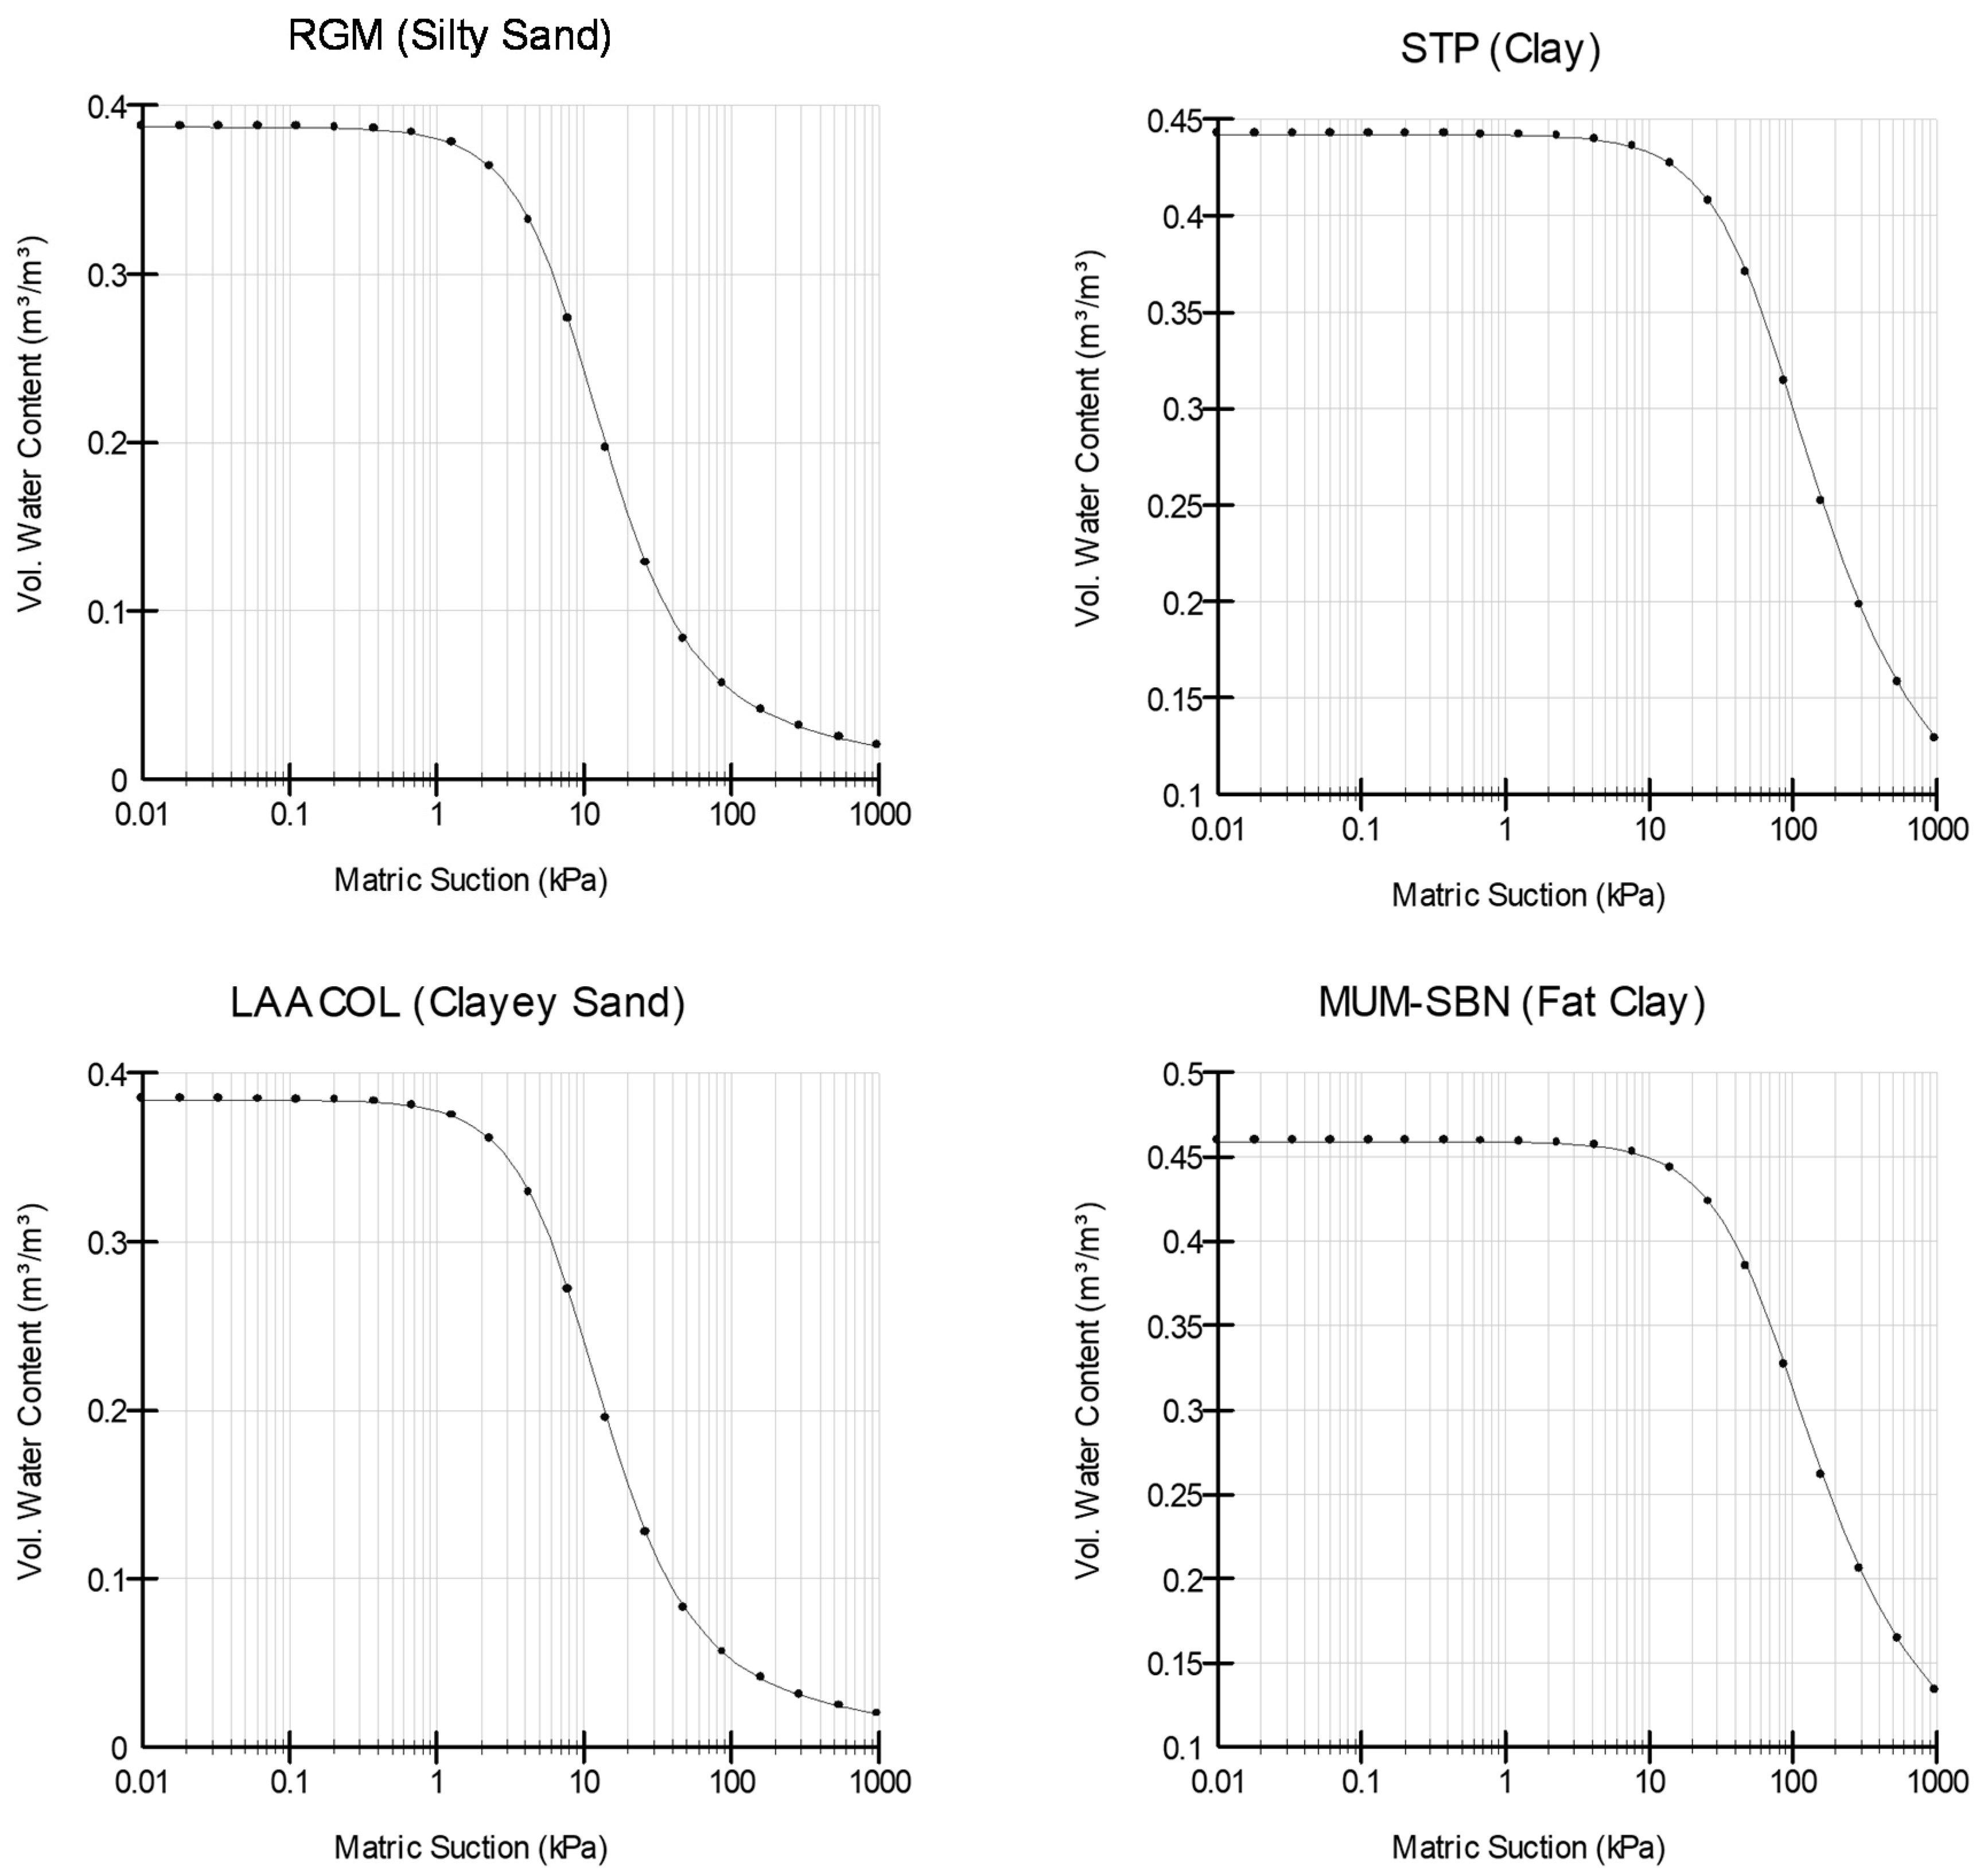
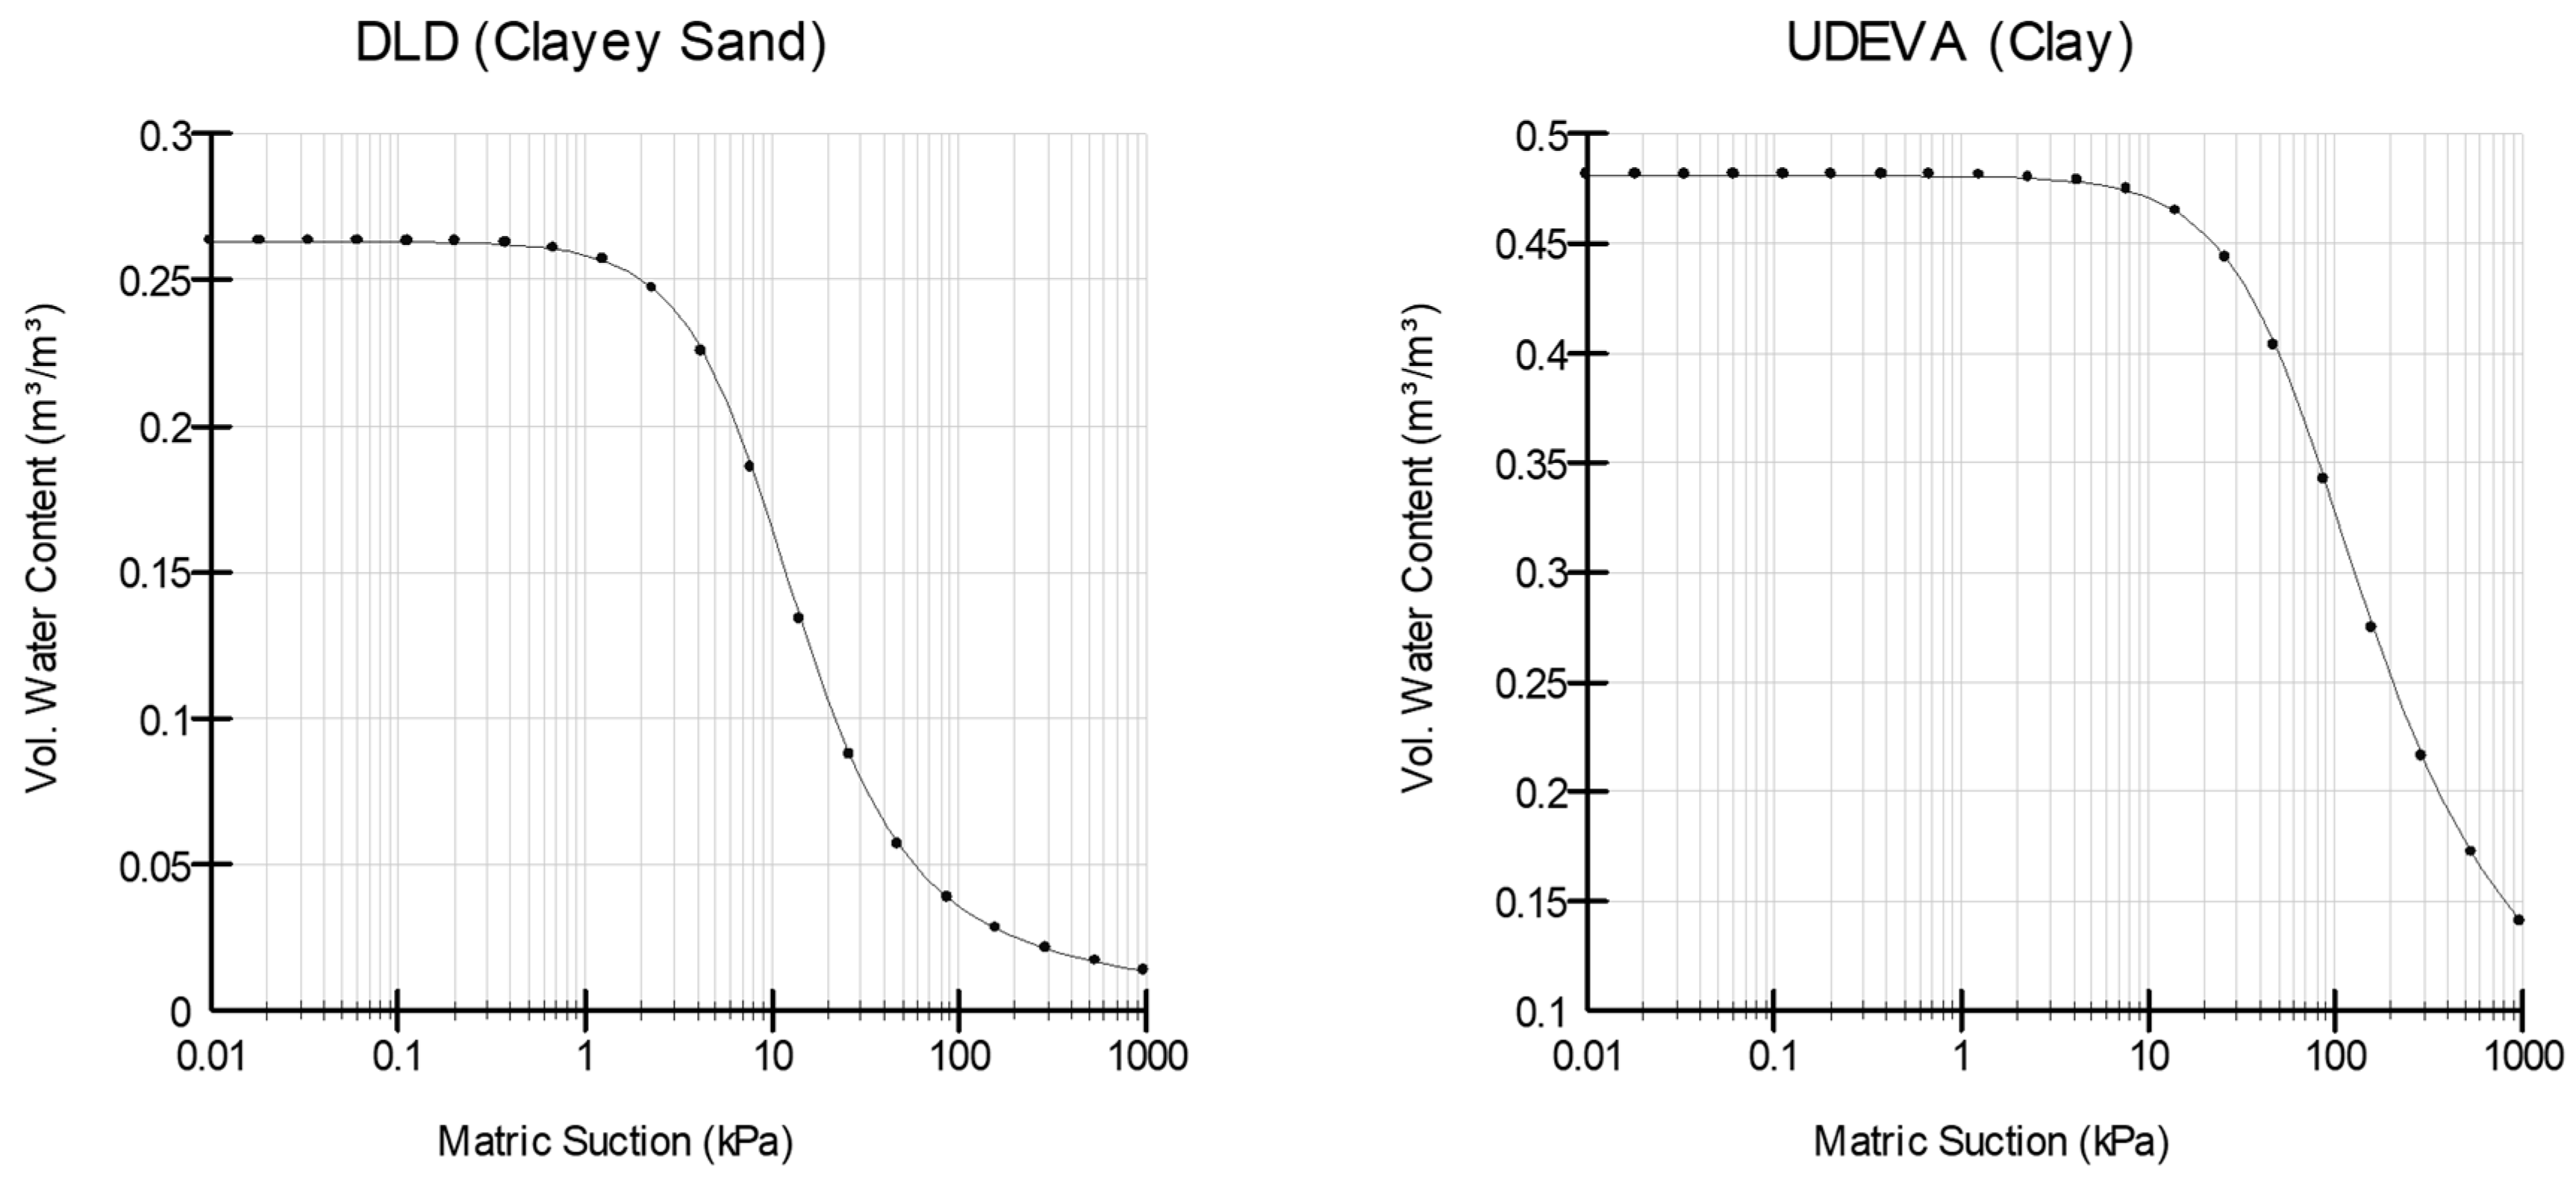
2.2.2. Soil Properties and Zonation
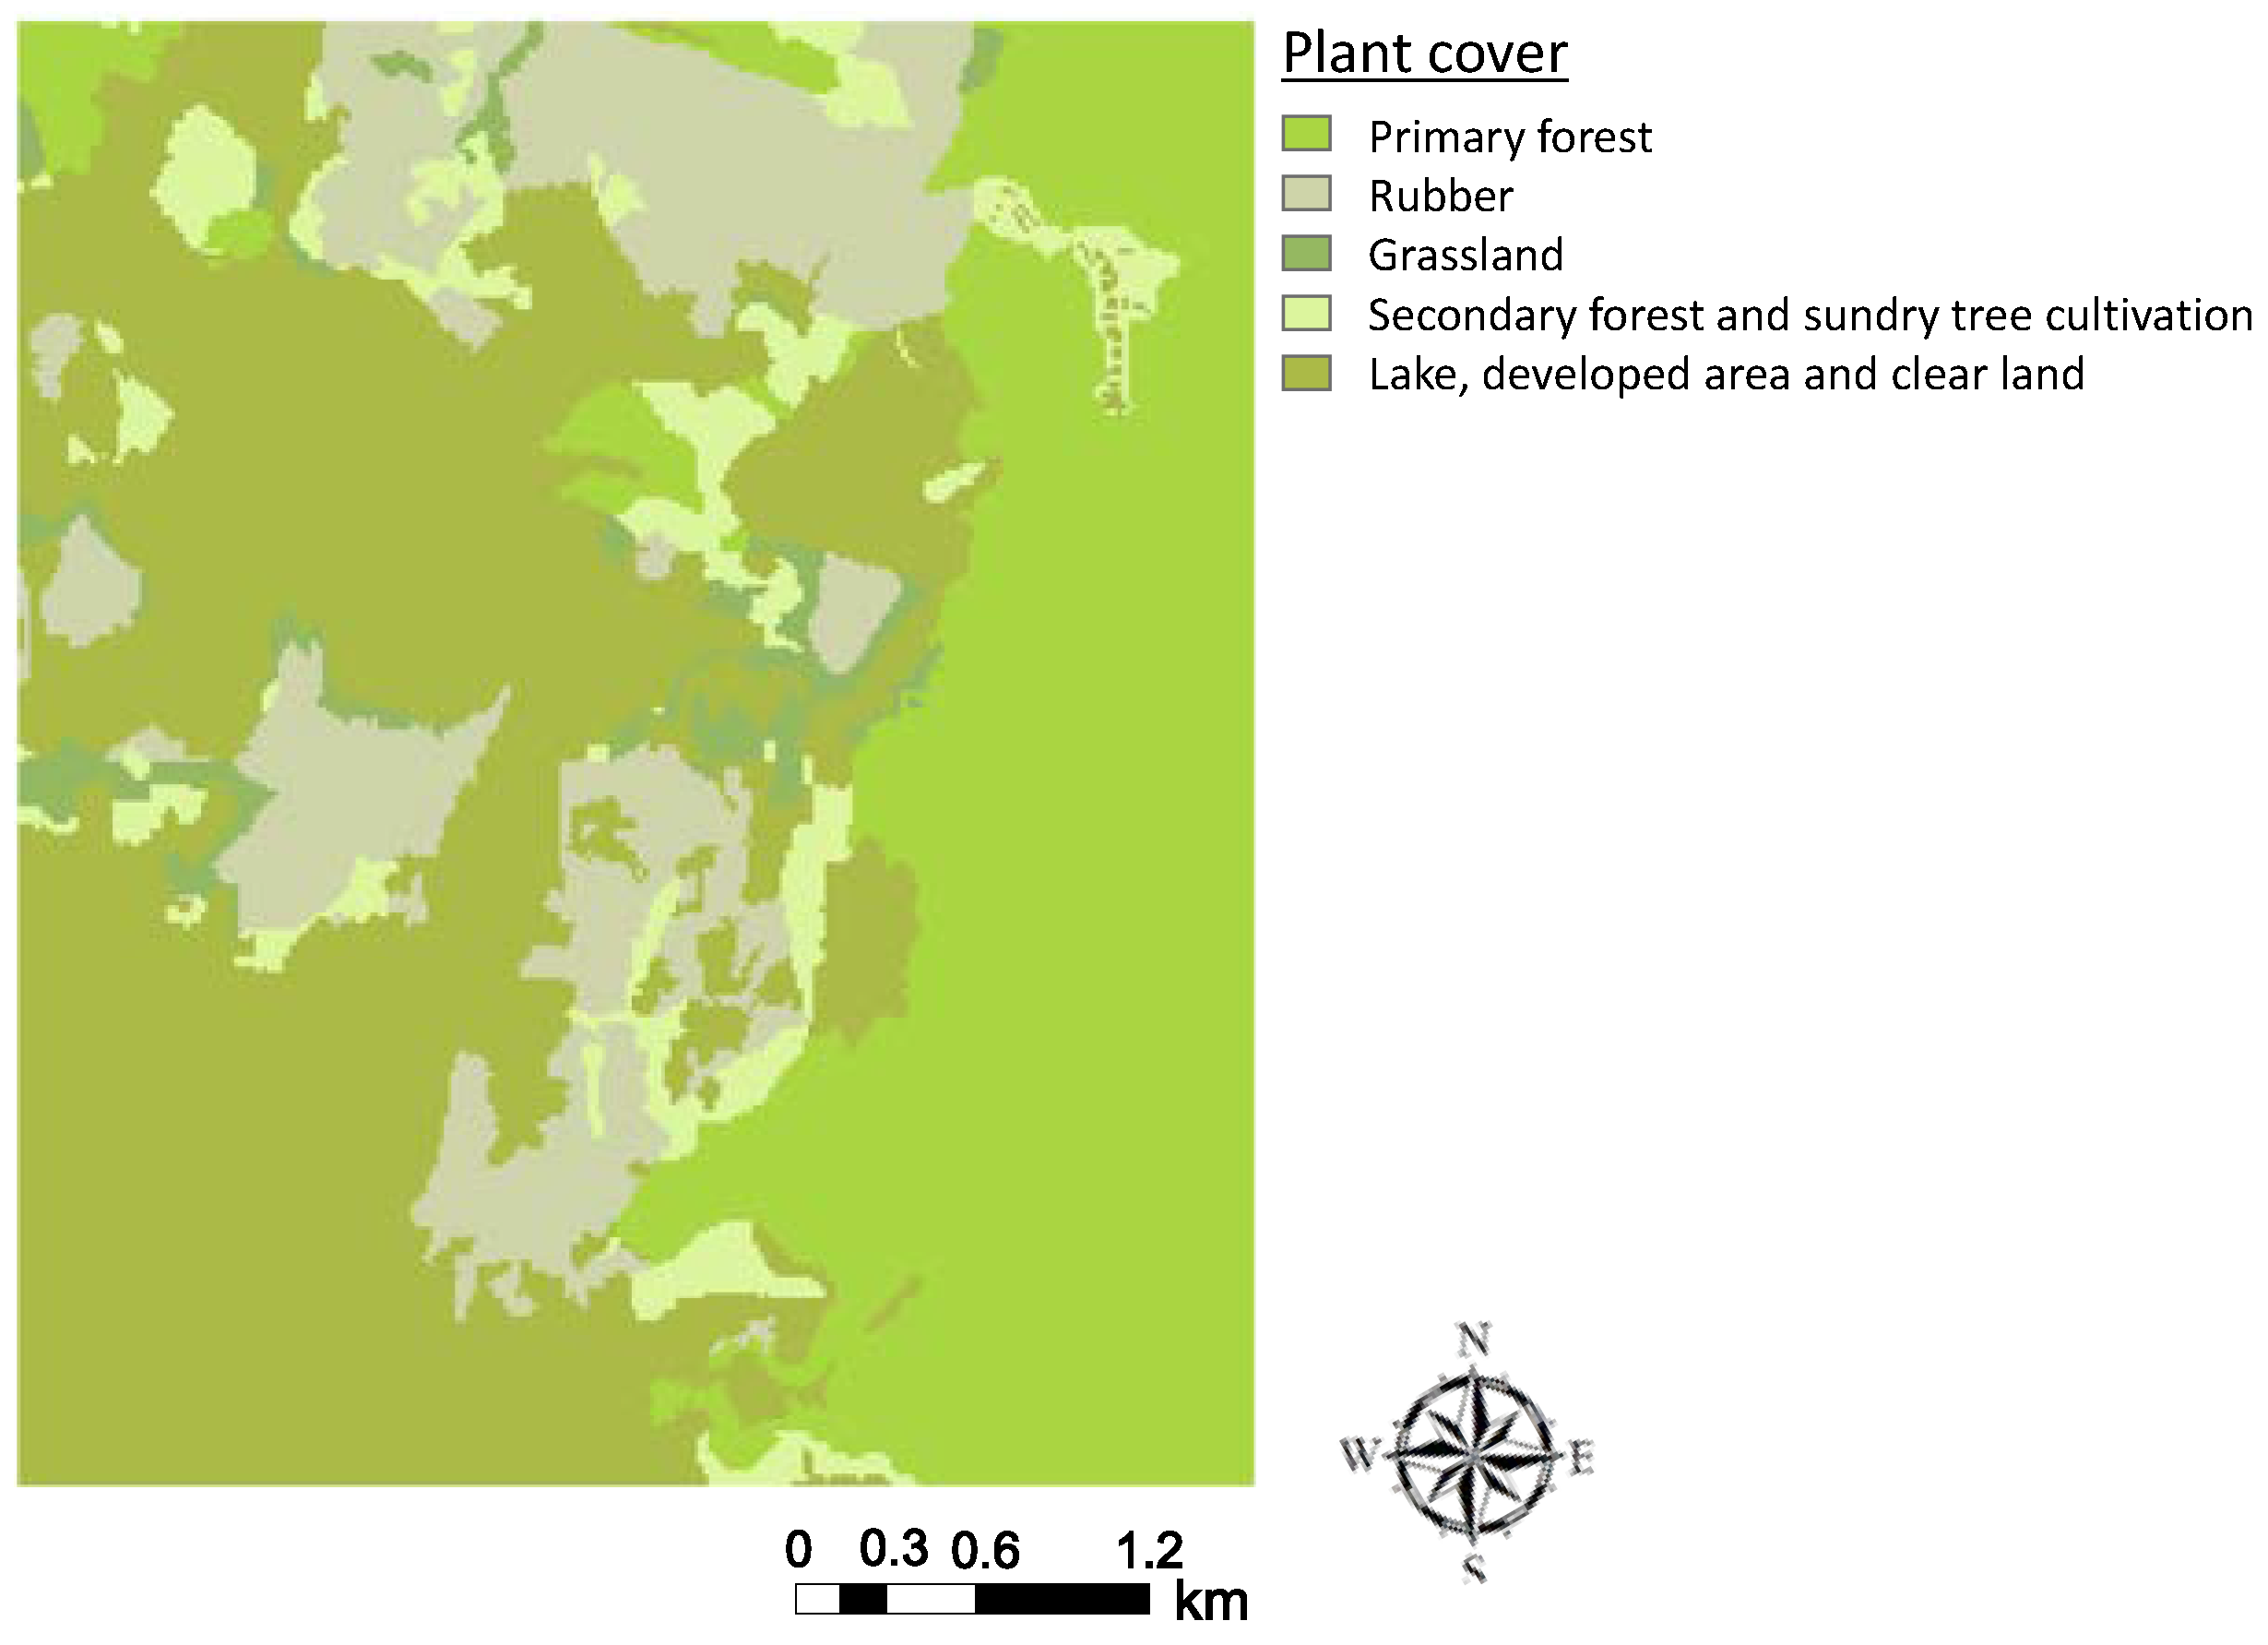
2.2.3. Plant Cover
2.2.4. Rainfall Data
3. Results of Landslide Susceptibility Assessment
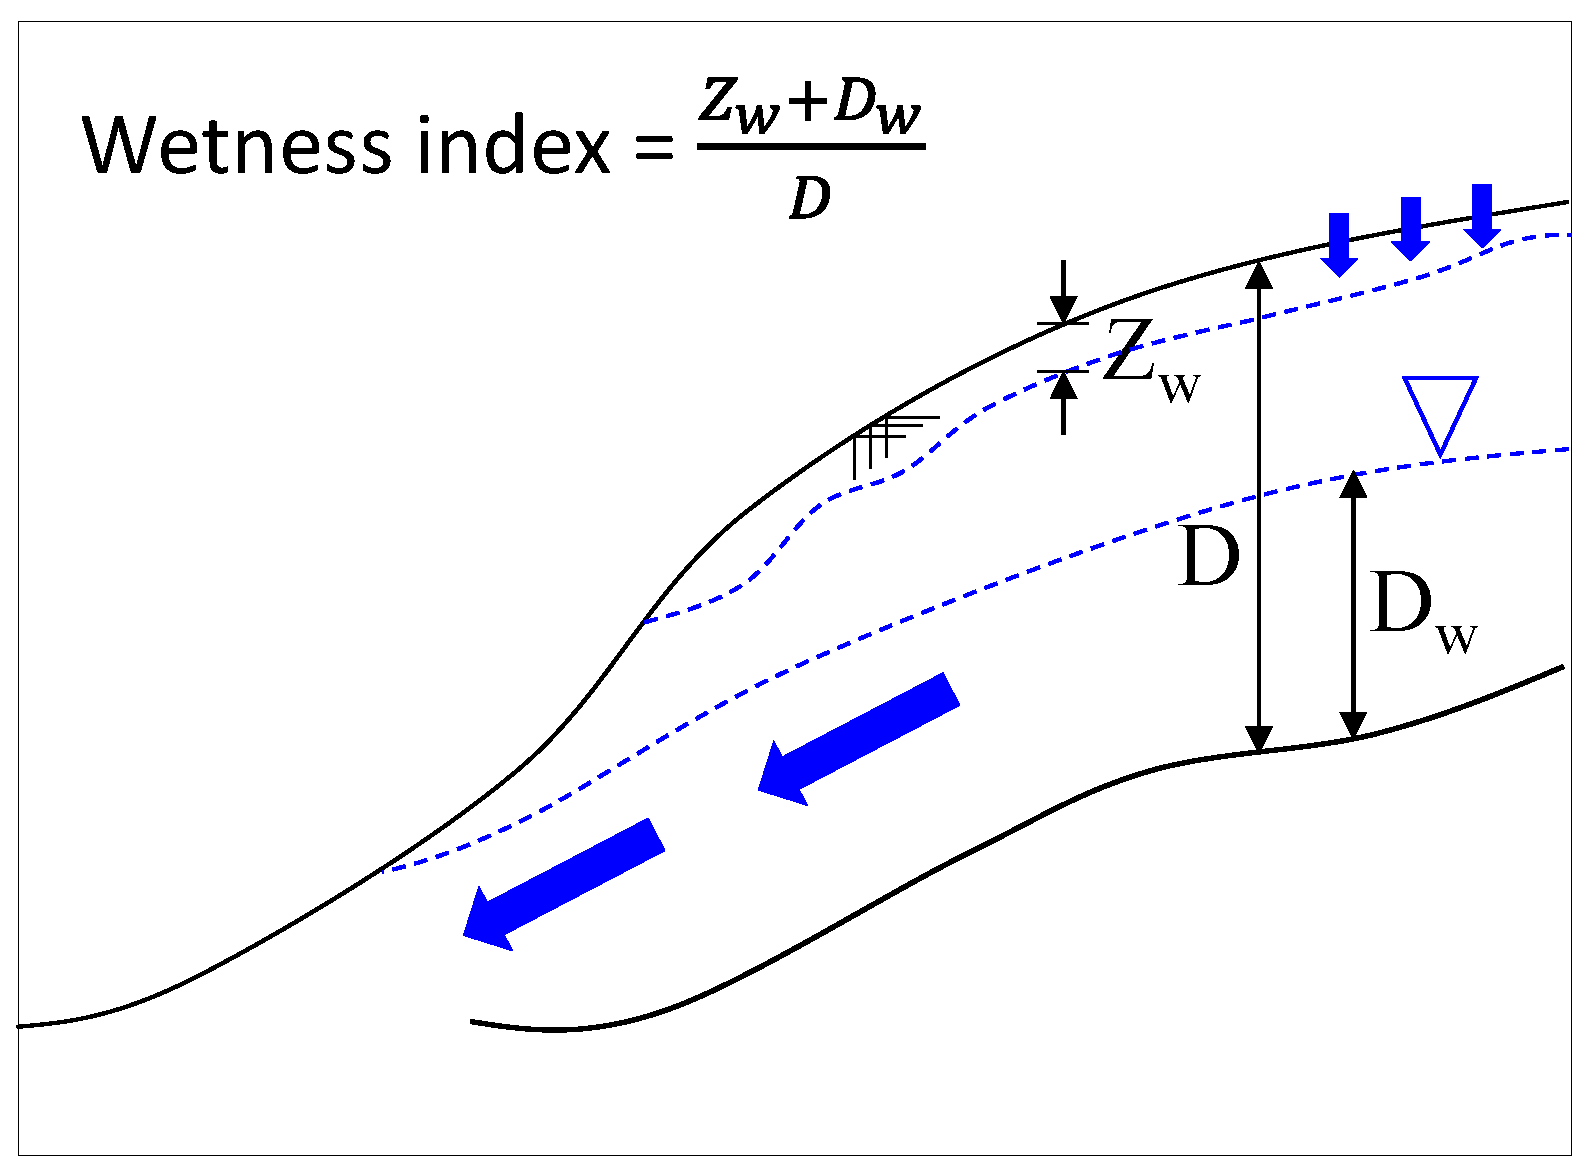
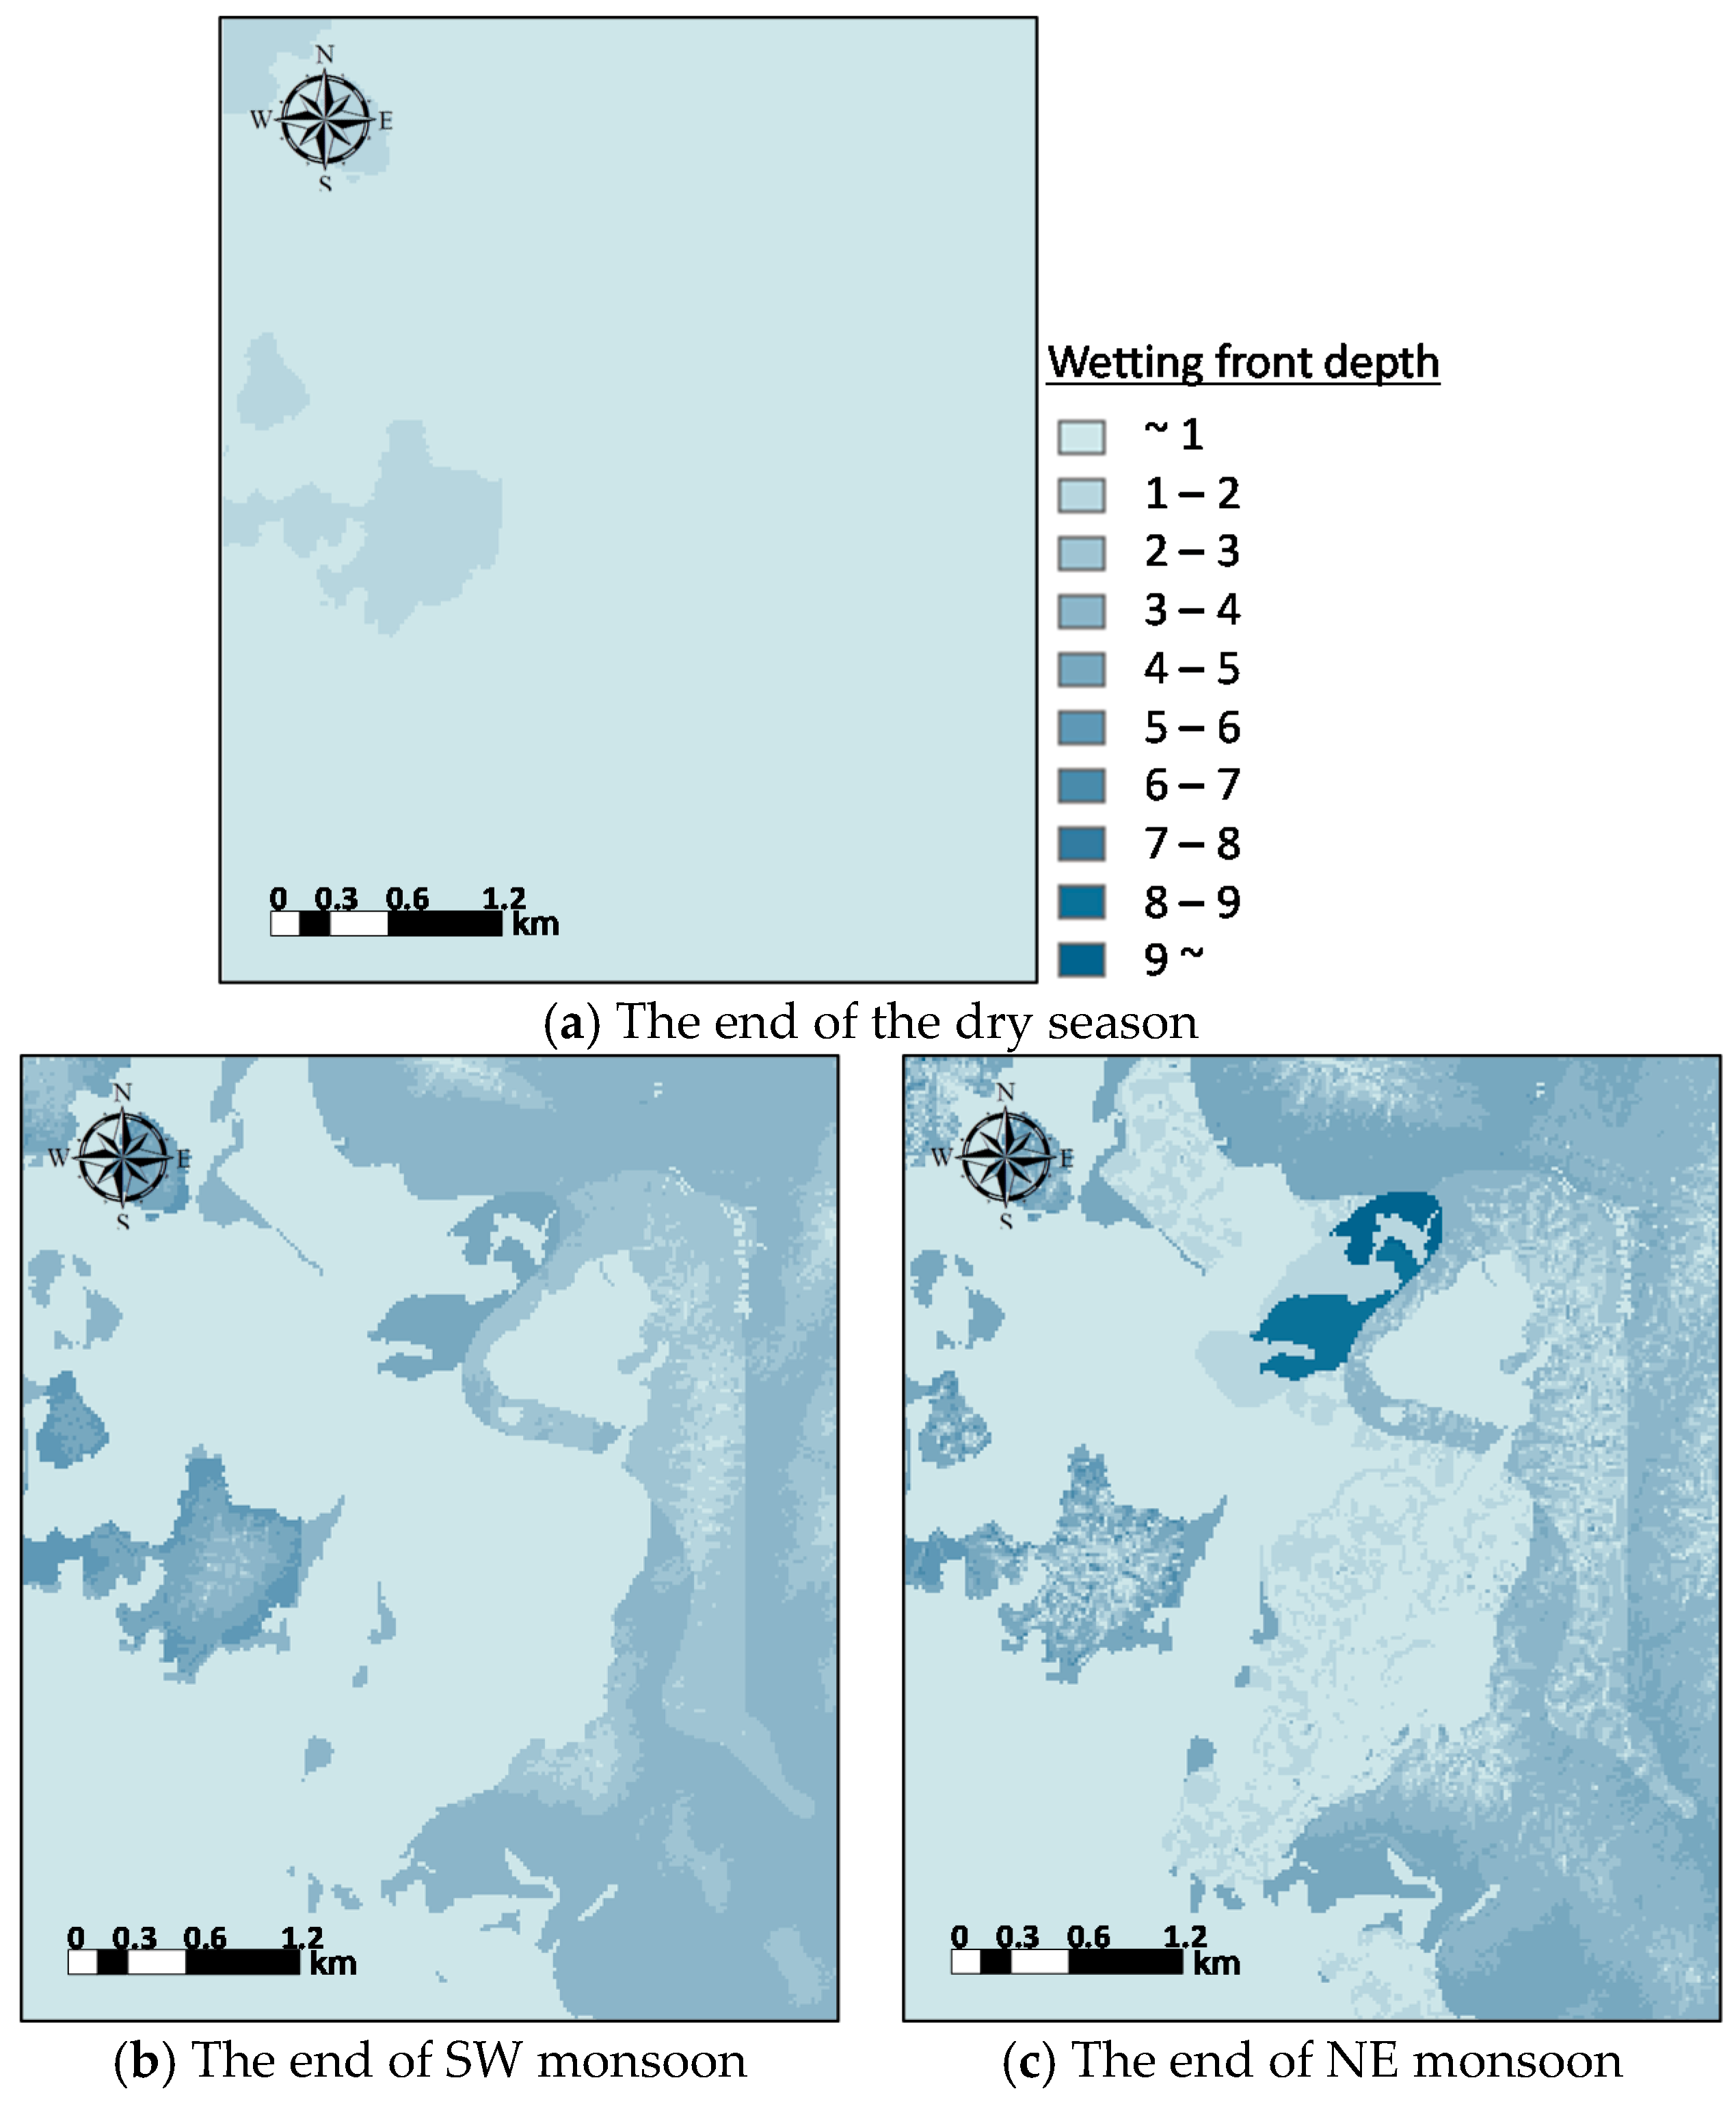
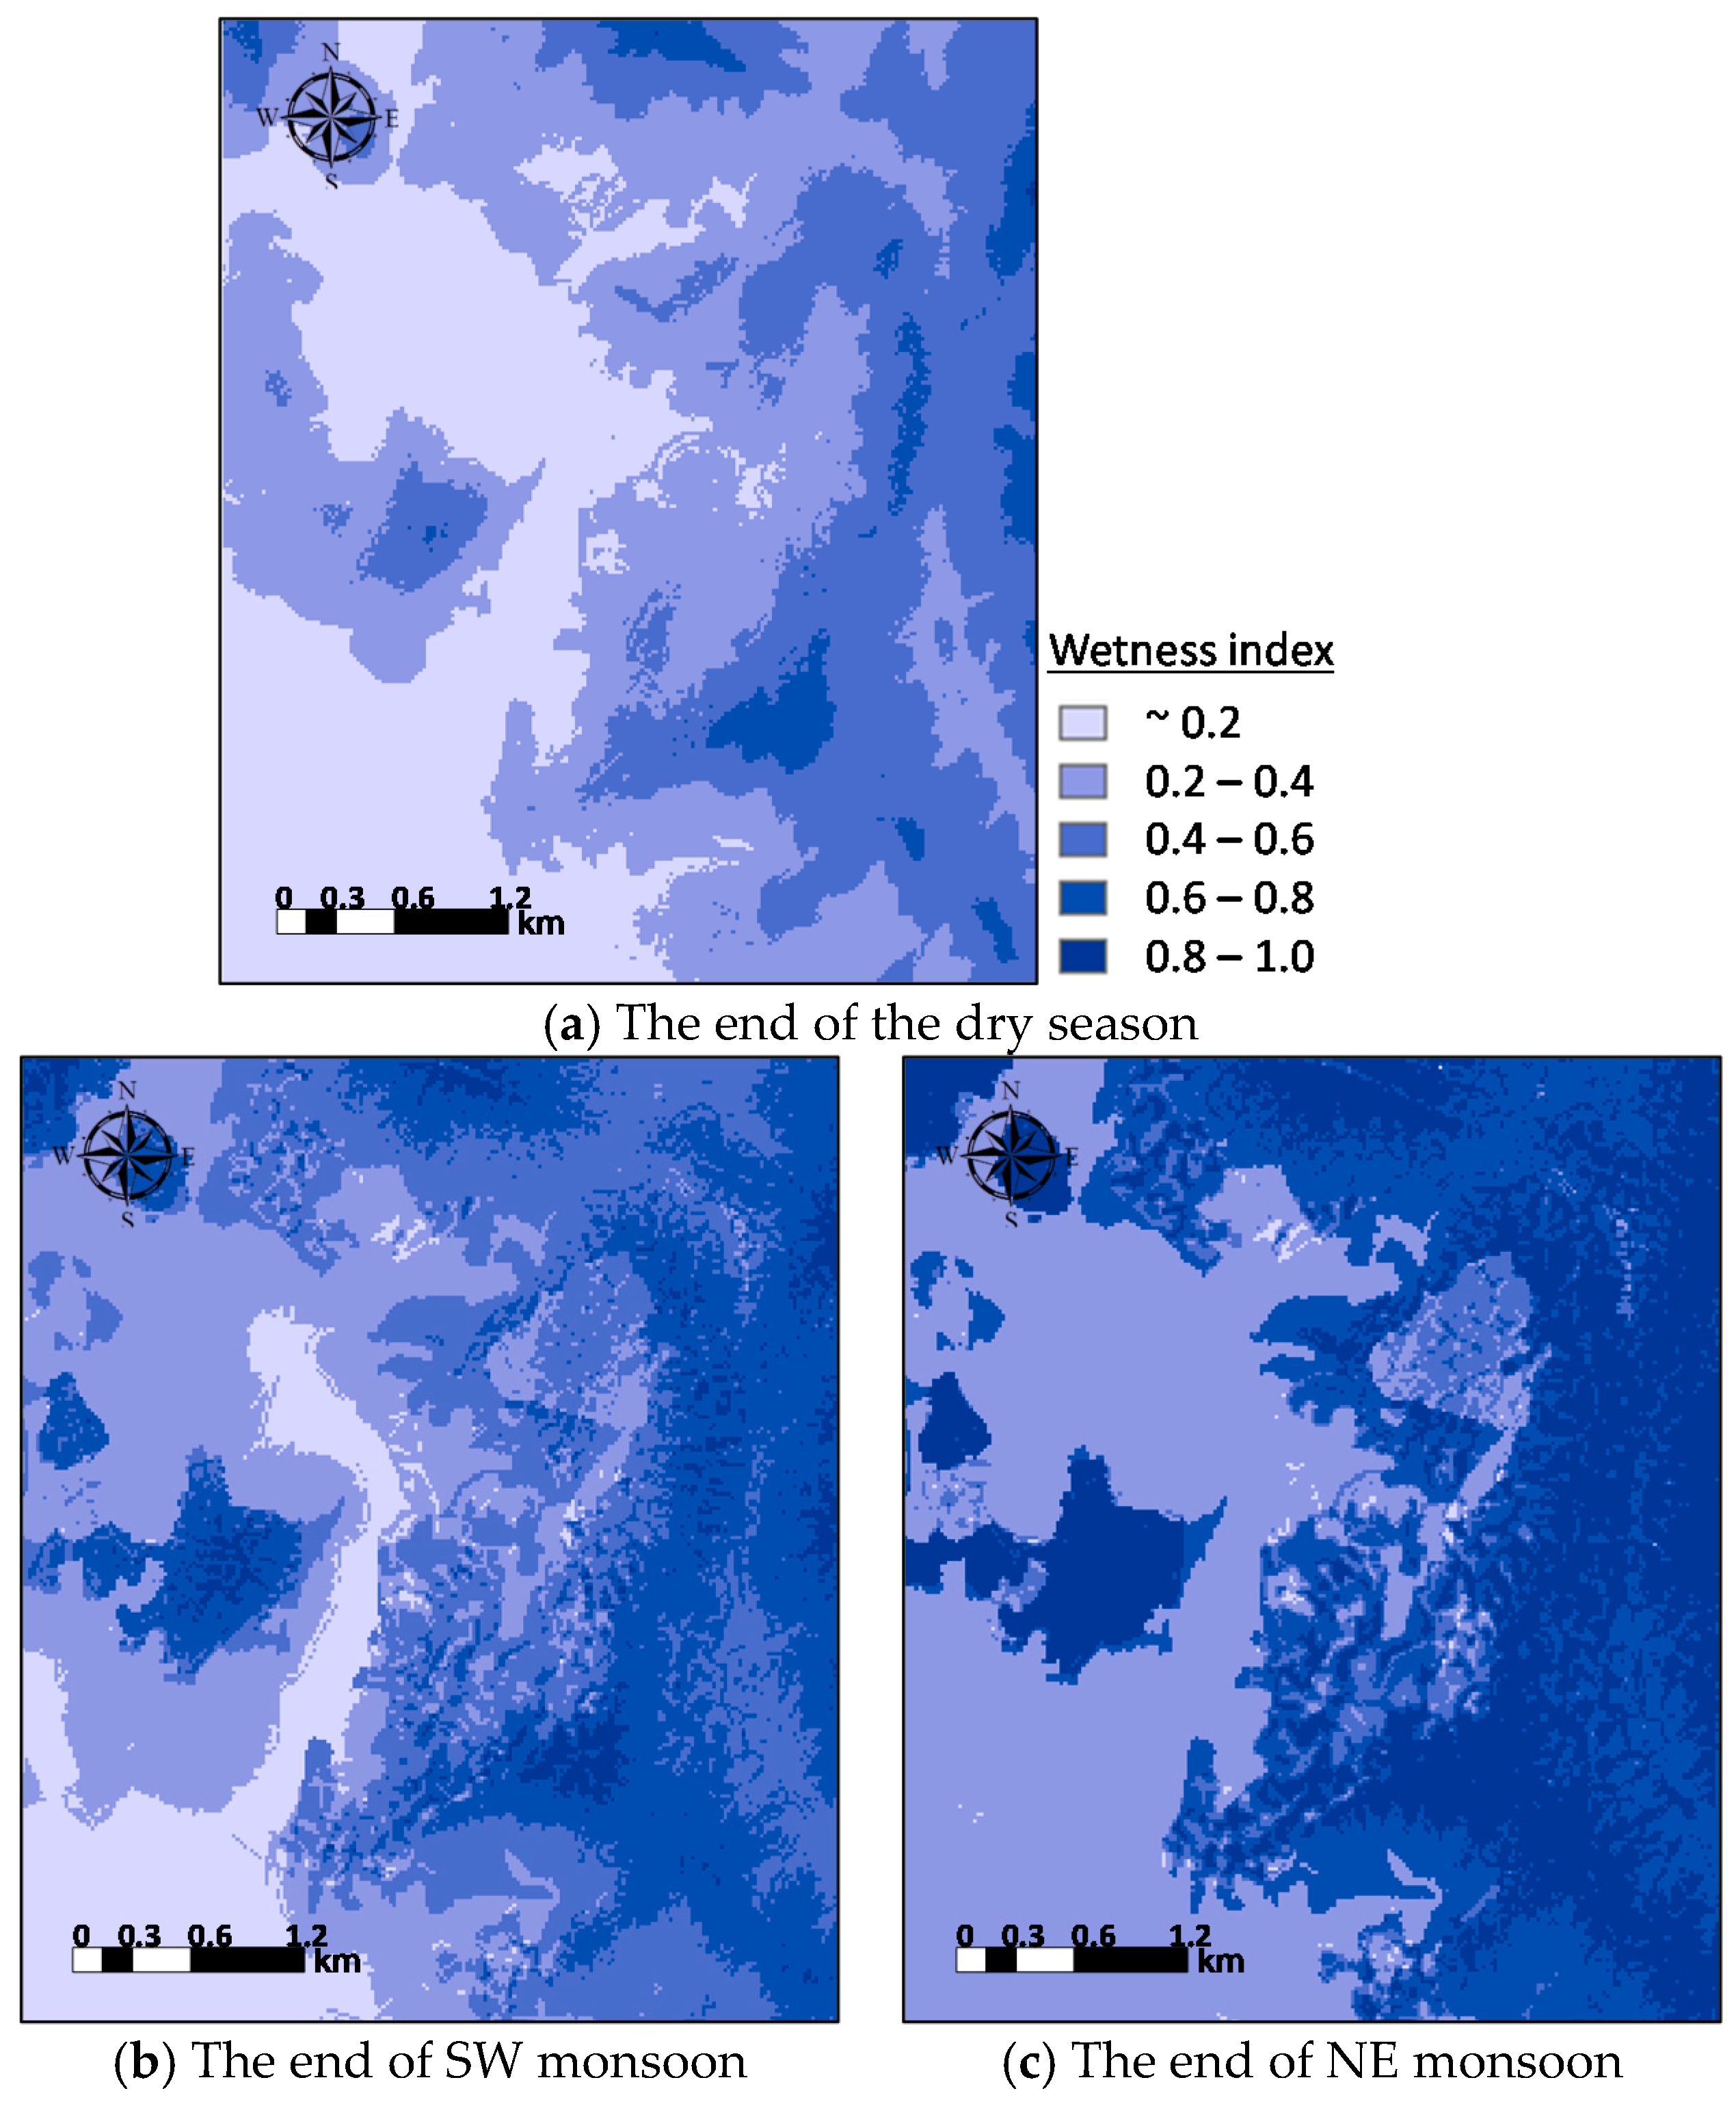
3.1. Wetness Index
3.2. Landslide Susceptibility Analysis
4. Conclusions
- All raster maps of DEM, soil depth, initial groundwater table and slope were used to analyze the susceptibility of landslides in Hulu Kelang area and soil hydrological and mechanical characteristic and plant covers were applied as important factors in calculating the factor of safety. One year precipitation from Bukit Antrabangsa station which located closest to Hulu Kelang area was used as the rainfall input data.
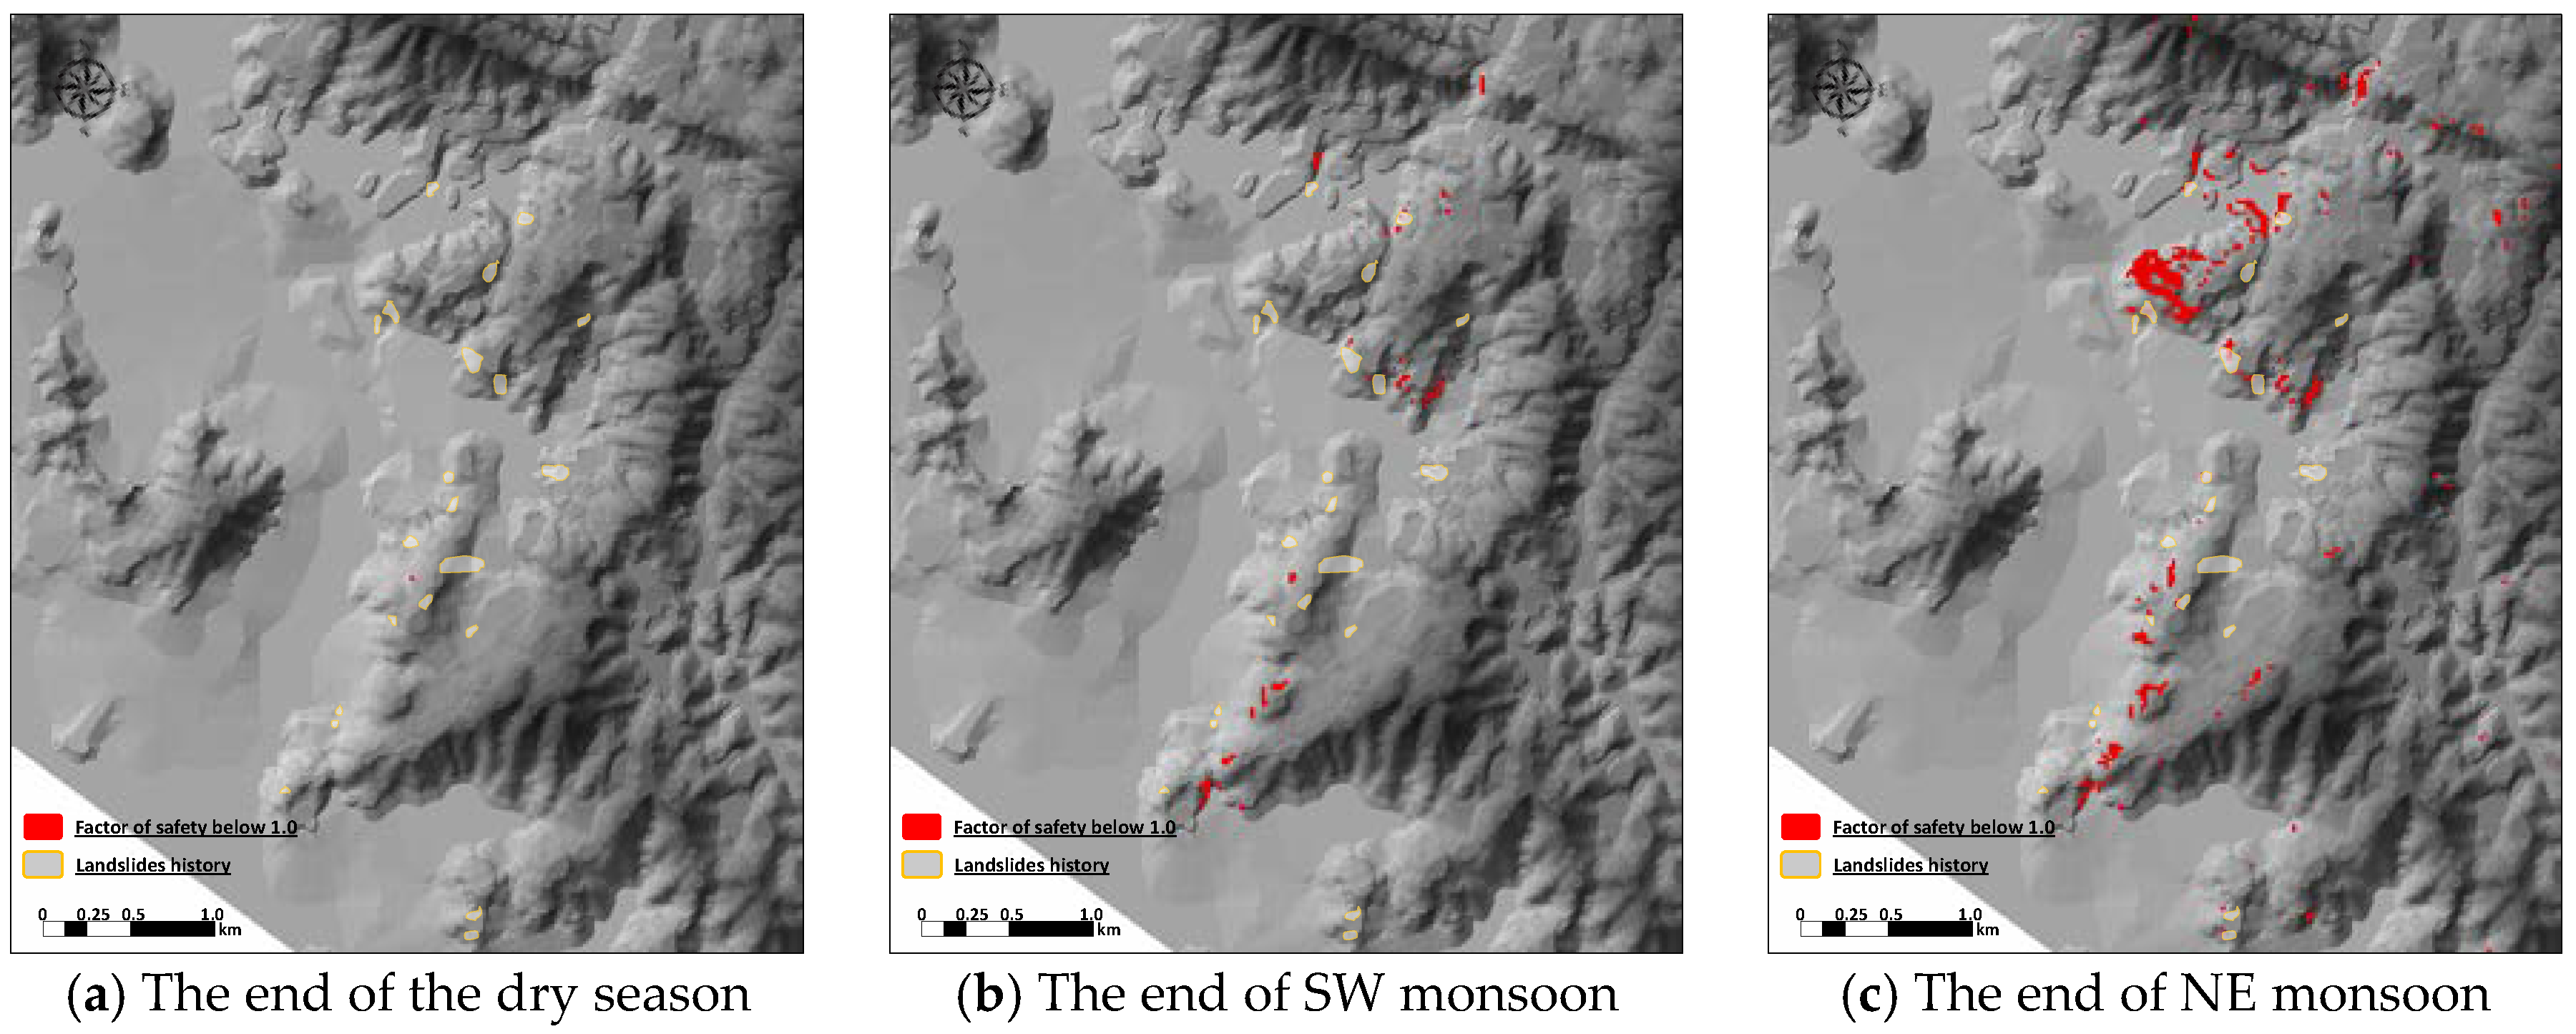
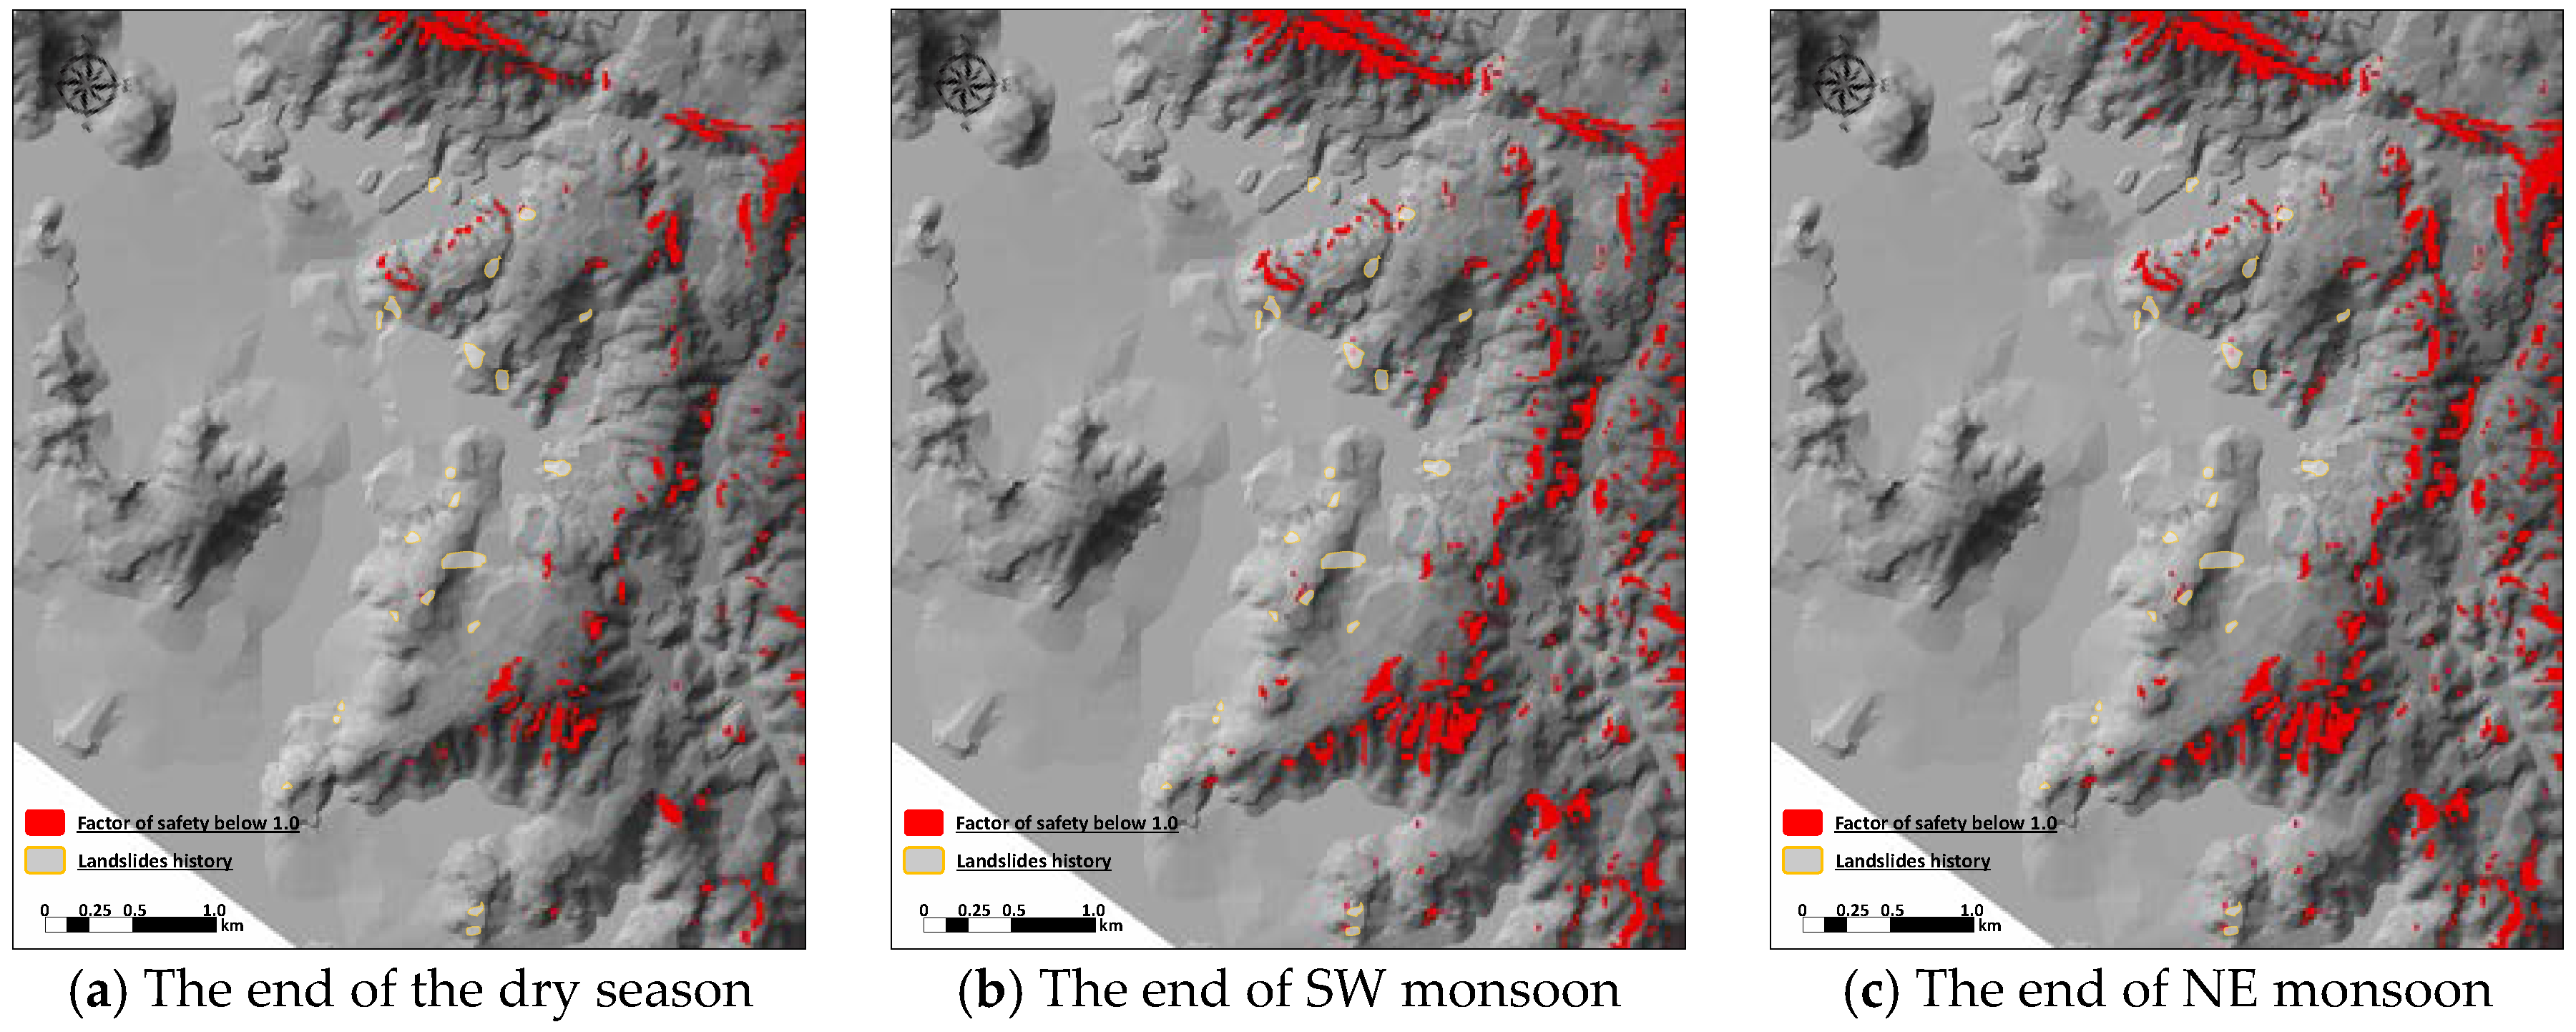
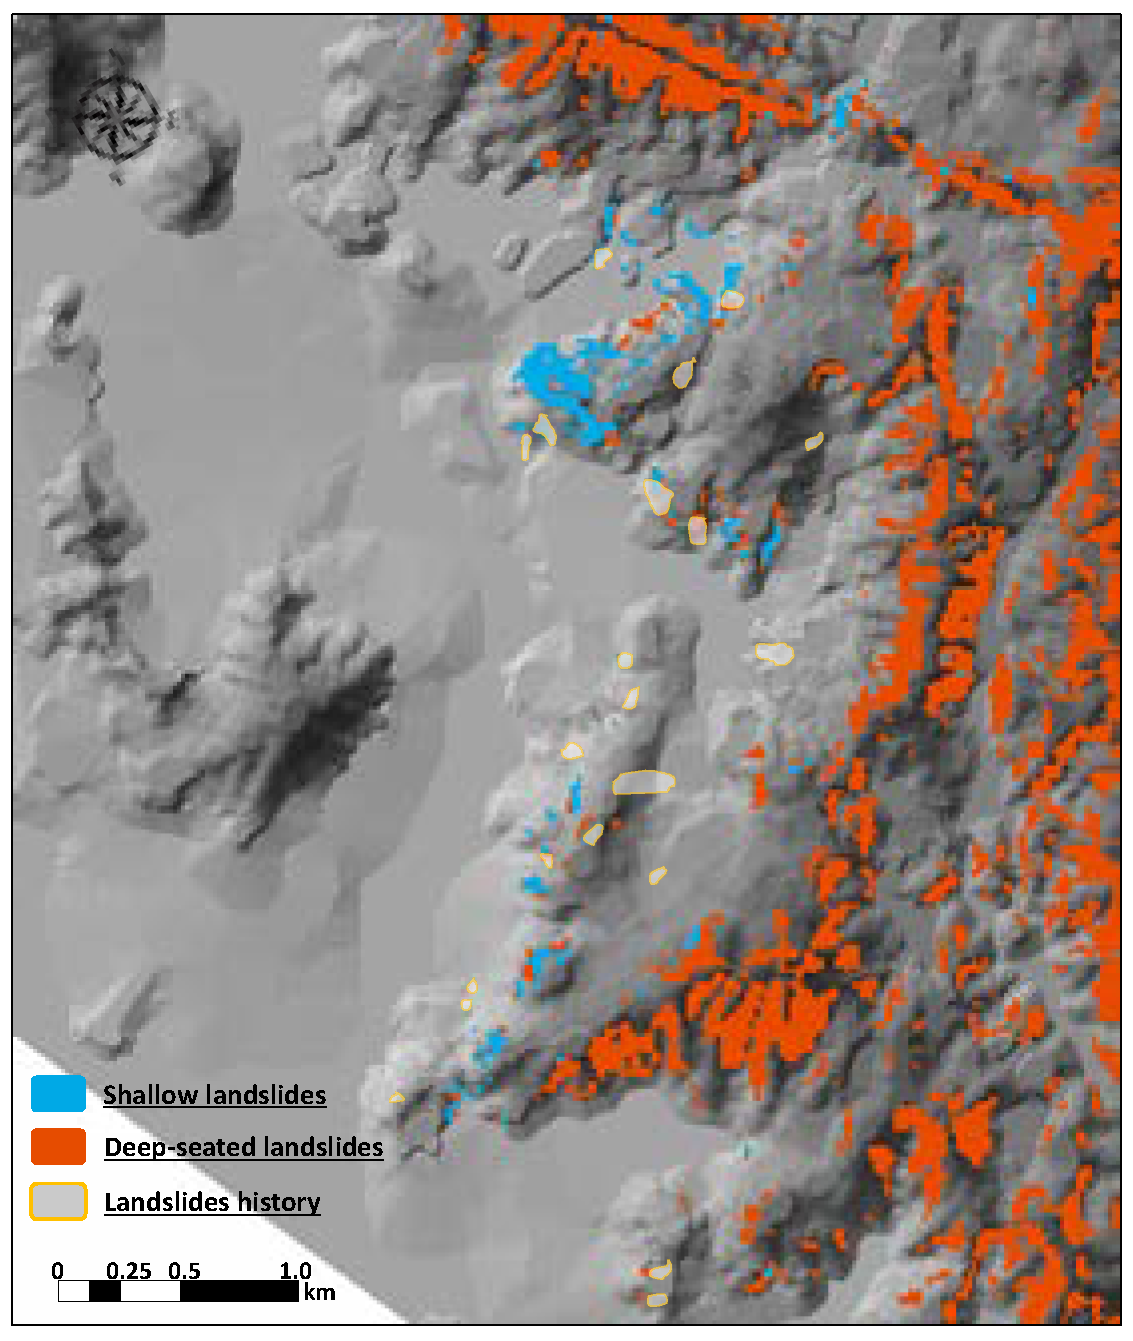
- YS-Slope model, the model used in this study has clearly simulated two types of the rainfall-induced landslide. One is the shallow landslide and another is the deep-seated landslide. According to the results of the study, shallow landslides due to failure under the wetting front mainly occurred in the central area, while deep-seated landslides due to failure on the bedrock were predominant in the east side of the study area. It can be also deduced that the prediction based on the shallow landslides analysis is more consistent by comparing the historical landslides.
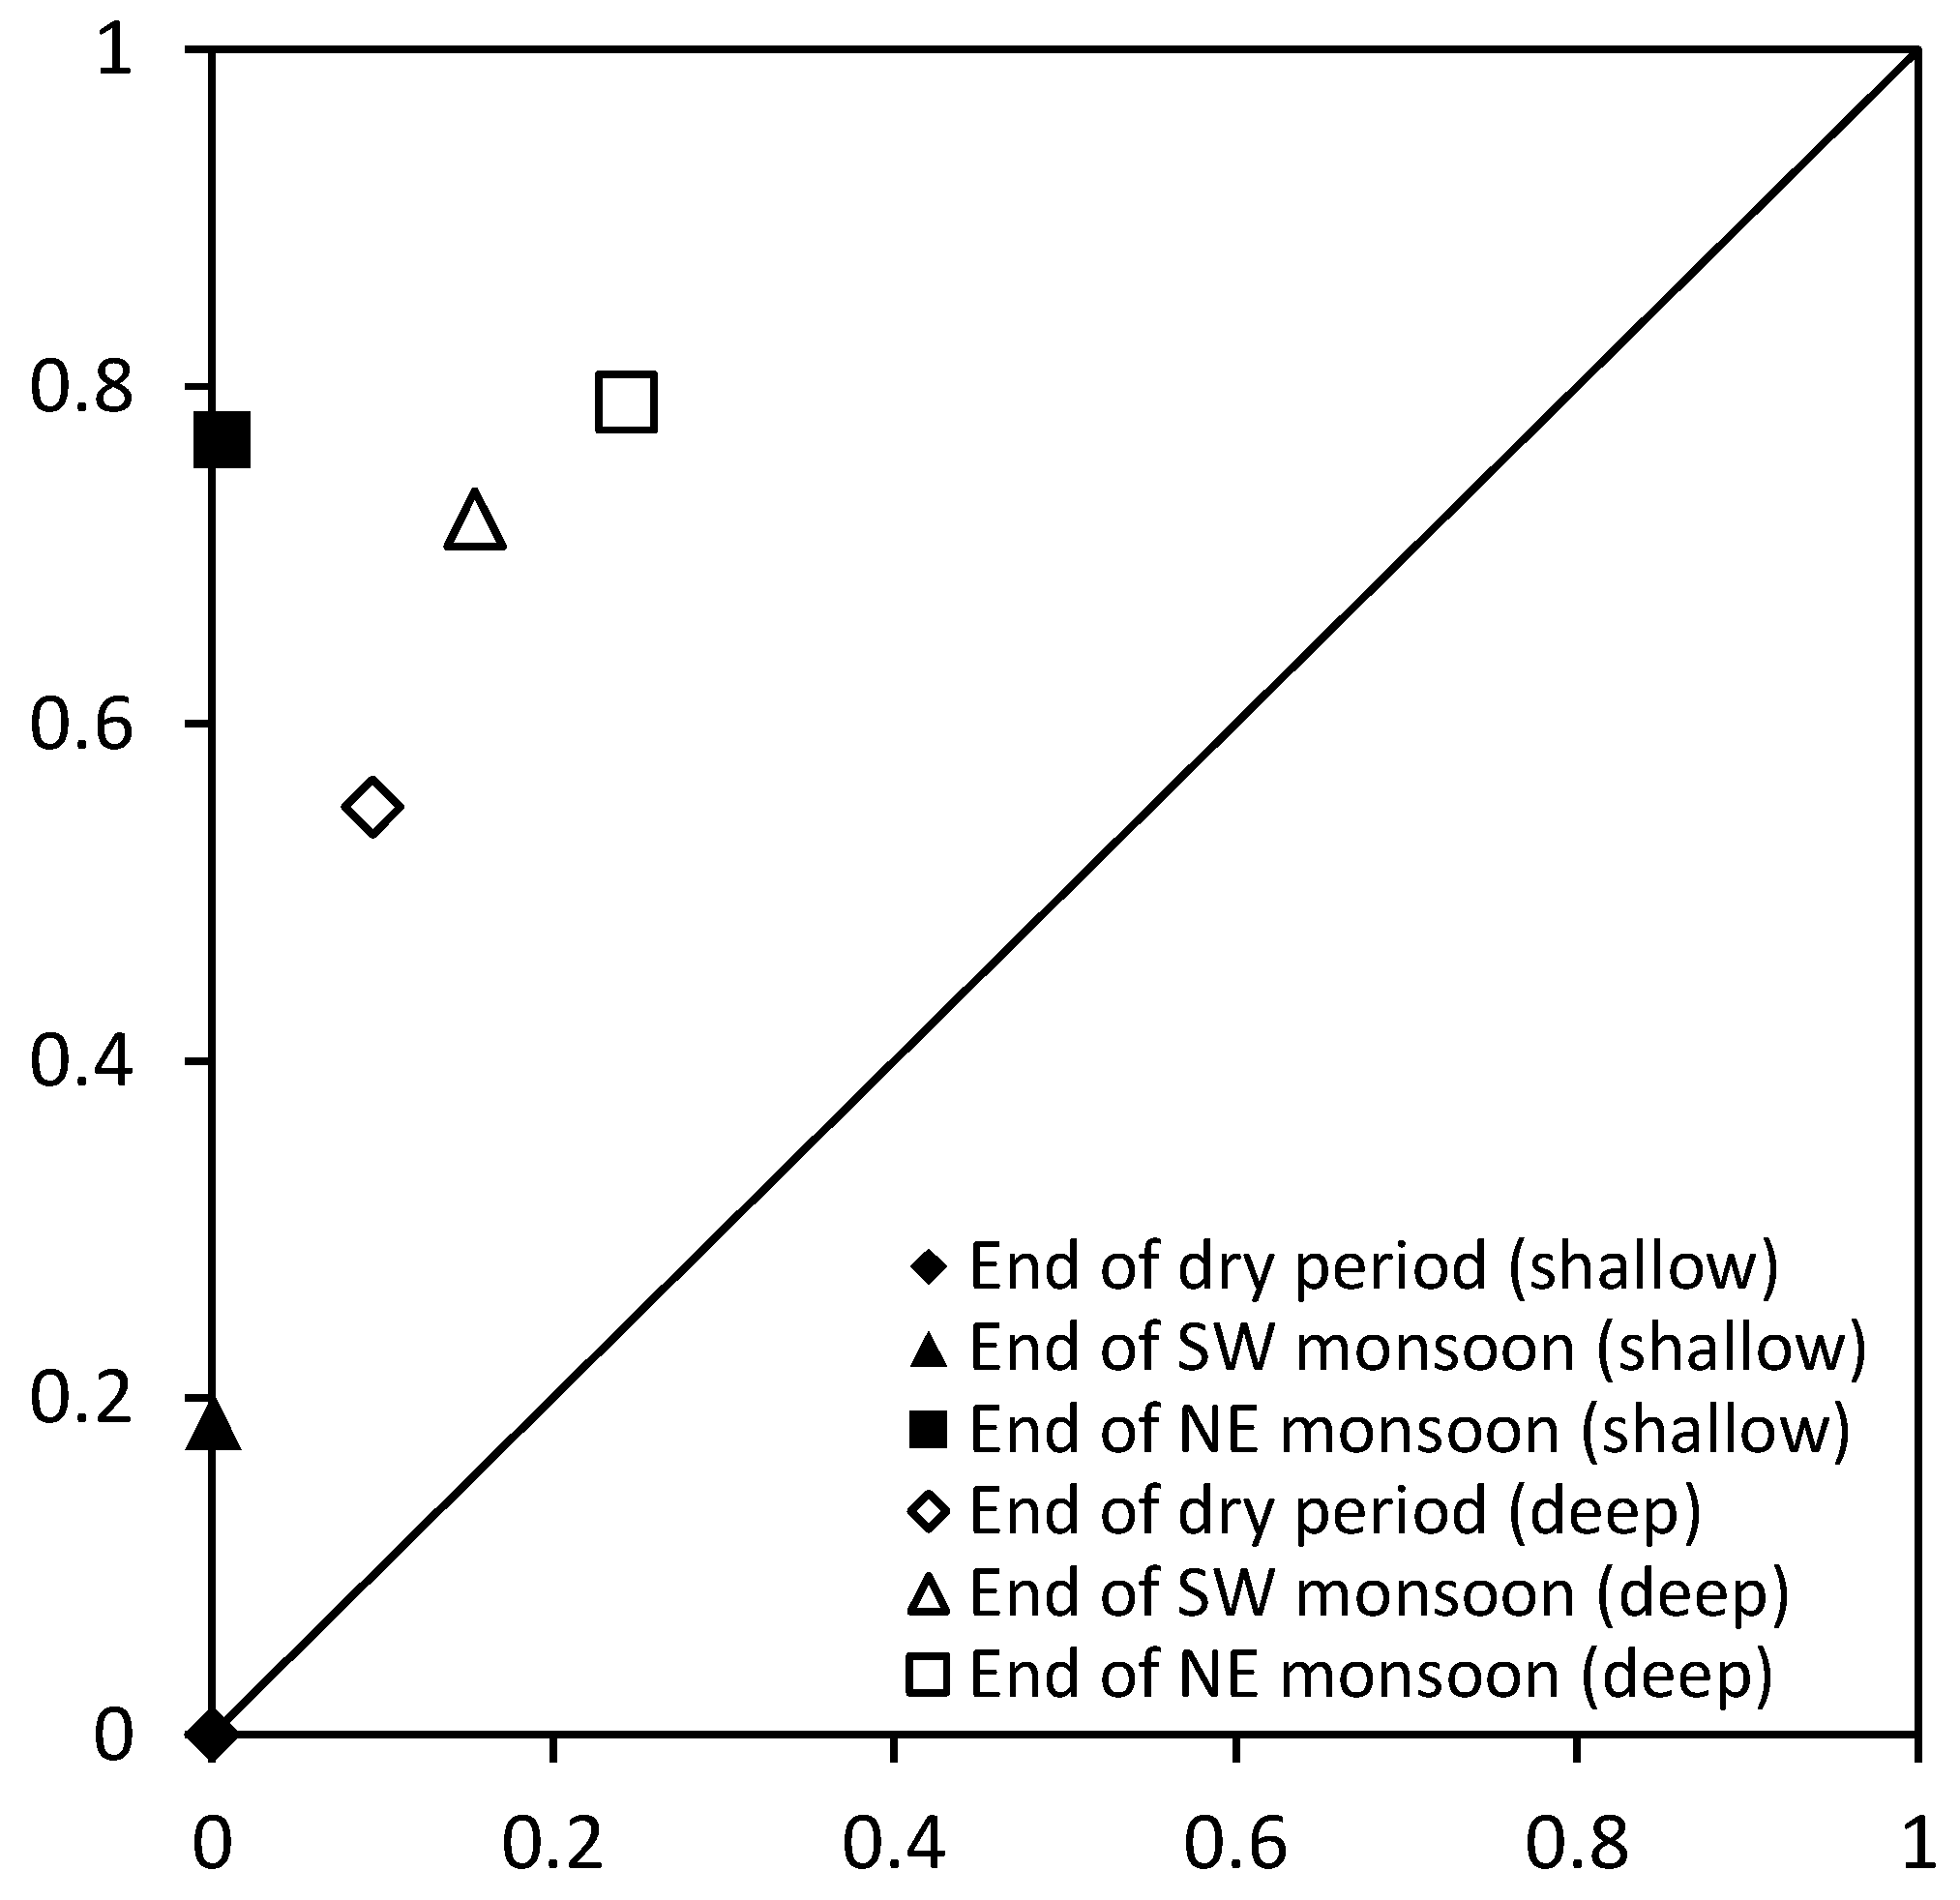
- The ROC analysis was conducted to quantitatively analyze the results of this study. Each analytical results of landslides susceptibility analysis for the end of dry season, the end of SW monsoon and the end of NE monsoon were evaluated by ROC analysis. As a result of ROC analysis, it is shown that the analytical result at the end of northeast monsoon for shallow landslides has the highest value of the distance from the standard line (y = x). This result means that the prediction based on the result at the end of northeast monsoon for shallow landslides is more accurate compared with other results.
- In comparison with previous research results by the result of shallow landslides prediction at the end of northeast monsoon season which has the highest accuracy, the false positive is very small, while the false negative is higher than the conventional models. It can be interpreted that the sensitivity is high but the specificity is low in landslide prediction compared with the previous research results.
Author Contributions
Funding
Conflicts of Interest
References
- Baek, S.C.; Kang, I.K.; Kim, H.T.; Sim, Y.J. An experimental study on the variation of pore-water pressure in soil slope during the rainfall. Int. J. Geo-Eng. 2012, 4, 35–42. [Google Scholar]
- Wang, Q.; Wang, D.; Huang, Y.; Wang, Z.; Zhang, L.; Guo, Q.; Sang, M. Landslide susceptibility mapping based on selected optimal combination of landslide predisposing factors in a large catchment. Sustainability 2015, 7, 16653–16669. [Google Scholar] [CrossRef]
- Zhou, S.; Chen, G.; Fang, L.; Nie, Y. GIS-based integration of subjective and objective weighting methods for regional landslides susceptibility mapping. Sustainability 2016, 8, 334. [Google Scholar] [CrossRef]
- Kim, H.G.; Lee, D.K.; Park, C. Assessing the Cost of Damage and Effect of Adaptation to Landslides Considering Climate Change. Sustainability 2018, 10, 1628. [Google Scholar] [CrossRef]
- Saadatkhah, N.; Kassim, A.; Lee, L.M. Qualitative and quantitative landslide susceptibility assessments in Hulu Kelang area, Malaysia. EJGE 2014, 19, 545–563. [Google Scholar]
- Hammond, C.J.; Prellwitz, R.W.; Miller, S.M. Landslide hazard assessment using Monte Carlo simulation. In Proceedings of the 6th International Symposium on Landslides, Christchurch, New Zealand, 10–14 February 1992; Balkema: Rotterdam, The Netherlands, 1992; Volume 2, pp. 251–294. [Google Scholar]
- Montgomery, D.R.; Dietrich, W.E. A physically based model for the topographic control on shallow landsliding. Water Resour. Res. 1994, 30, 1153–1171. [Google Scholar] [CrossRef]
- Mantovani, F.; Soeters, R.; Van Westen, C.J. Remote sensing techniques for landslide studies and hazard zonation in Europe. Geomorphology 1996, 15, 213–225. [Google Scholar] [CrossRef]
- Van Westen, C.J. Statistical landslide hazard analysis. ILWIS 1997, 2, 73–84. [Google Scholar]
- Tucker, G.E.; Catani, F.; Rinaldo, A.; Bras, R.L. Statistical analysis of drainage density from digital terrain data. Geomorphology 2001, 36, 187–202. [Google Scholar] [CrossRef]
- Dai, F.C.; Lee, C.F.; Ngai, Y.Y. Landslide risk assessment and management: An overview. Eng. Geol. 2002, 64, 65–87. [Google Scholar] [CrossRef]
- Baum, R.L.; Savage, W.; Godt, J.W. TRIGRS—A Fortran Program for Transient Rainfall Infiltration and Grid-Based Regional Slope Stability Analysis; Open-File Report 02-0424; USGS: Reston, VA, USA, 2002; p. 35.
- Zhou, G.; Esaki, T.; Mitani, Y.; Xie, M.; Mori, J. Spatial probabilistic modeling of slope failure using an integrated GIS Monte Carlo simulation approach. Eng. Geol. 2003, 68, 373–386. [Google Scholar] [CrossRef]
- Metternicht, G.; Hurni, L.; Gogu, R. Remote sensing of landslides: An analysis of the potential contribution to geo-spatial systems for hazard assessment in mountainous environments. Remote Sens. Environ. 2005, 98, 284–303. [Google Scholar] [CrossRef]
- Huabin, W.; Gangjun, L.; Weiya, X.; Gonghui, W. GIS-based landslide hazard assessment: An overview. Prog. Phys. Geogr. 2005, 29, 548–567. [Google Scholar] [CrossRef]
- Gupta, R.P.; Joshi, B.C. Landslide hazard zoning using the GIS approach-a case study from the Ramganga catchment, Himalayas. Eng. Geol. 1990, 28, 119–131. [Google Scholar] [CrossRef]
- Borrelli, L.; Ciurleo, M.; Gullà, G. Shallow landslide susceptibility assessment in granitic rocks using GIS-based statistical methods: The contribution of the weathering grade map. Landslide 2018, 15, 1127–1142. [Google Scholar] [CrossRef]
- Cascini, L.; Ciurleo, M.; Di Nocera, S.; Gullà, G. A new–old approach for shallow landslide analysis and susceptibility zoning in fine-grained weathered soils of southern Italy. Geomorphology 2015, 241, 371–381. [Google Scholar] [CrossRef]
- Ciurleo, M.; Calvello, M.; Cascini, L. Susceptibility zoning of shallow landslides in fine grained soils by statistical methods. Catena 2016, 139, 250–264. [Google Scholar] [CrossRef]
- Ciurleo, M.; Cascini, L.; Calvello, M. A comparison of statistical and deterministic methods for shallow landslide susceptibility zoning in clayey soils. Eng. Geol. 2017, 223, 71–81. [Google Scholar] [CrossRef]
- Hong, M.; Kim, J.; Jeong, S. Rainfall intensity-duration thresholds for landslide prediction in South Korea by considering the effects of antecedent rainfall. Landslides 2018, 15, 523–534. [Google Scholar] [CrossRef]
- Lu, N.; Godt, J. Infinite slope stability under steady unsaturated seepage conditions. Water Resour. Res. 2008, 44. [Google Scholar] [CrossRef]
- Fredlund, D.G.; Morgenstern, N.R.; Widger, R.A. The shear strength of unsaturated soils. Can. Geotech. J. 1978, 15, 313–321. [Google Scholar] [CrossRef]
- Jeong, S.; Lee, K.; Kim, J.; Kim, Y. Analysis of rainfall-induced landslide on unsaturated soil slopes. Sustainability 2017, 9, 1280. [Google Scholar] [CrossRef]
- Kim, Y.; Park, H.; Jeong, S. Settlement Behavior of Shallow Foundations in Unsaturated Soils under Rainfall. Sustainability 2017, 9, 1417. [Google Scholar] [CrossRef]
- Kim, J.; Kim, Y.; Jeong, S.; Hong, M. Rainfall-induced landslides by deficit field matric suction in unsaturated soil slopes. Environ. Earth Sci. 2017, 76, 808. [Google Scholar] [CrossRef]
- Jeong, S.; Kim, Y.; Lee, J.K.; Kim, J. The 27 July 2011 debris flows at Umyeonsan, Seoul, Korea. Landslides 2015, 12, 799–813. [Google Scholar] [CrossRef]
- Cotecchia, F.; Santaloia, F.; Lollino, P.; Vitone, C.; Mitaritonna, G. Deterministic landslide hazard assessment at regional scale. In GeoFlorida 2010: Advances in Analysis, Modeling & Design; ASCE Library: Reston, VA, USA, 2010; pp. 3130–3139. [Google Scholar]
- Pardeshi, S.D.; Autade, S.E.; Pardeshi, S.S. Landslide hazard assessment: Recent trends and techniques. SpringerPlus 2013, 2, 523. [Google Scholar] [CrossRef] [PubMed]
- Brabb, E.E. Proposal for worldwide landslide hazard maps. In Proceedings of the 7th International Conference and Field Workshop on Landslides, Rotterdam, The Netherlands, 28 August–15 September 1993; Novosad, S., Wagner, P., Eds.; Balkema: Rotterdam, The Netherlands; pp. 15–27. [Google Scholar]
- Burrough, P.A. Principles of Geographical Information Systems for Land Resources Assessment; Claredon Press: Oxford, UK, 1986; p. 194. [Google Scholar]
- Van Westen, C.J. Application of Geographic Information Systems to Landslide Hazard Zonation; ITC Enschede: Enschede, The Netherlands, 1993. [Google Scholar]
- Tarboton, D.G. A New Method for the Determination of Flow Directions and Contributing Areas in Grid Digital Elevation Models. Water Resour. Res. 1997, 33, 309–319. [Google Scholar] [CrossRef]
- Simoni, S.; Zanotti, F.; Bertoldi, G.; Rigon, R. Modelling the probability of occurrence of shallow landslides and channelized debris flows using GEOtop-FS. Hydrol. Process. 2008, 22, 532–545. [Google Scholar] [CrossRef]
- Montrasio, L.; Valentino, R.; Losi, G.L. Towards a real-time susceptibility assessment of rainfall-induced shallow landslides on a regional scale. Nat. Hazards Earth Syst. Sci. 2011, 11, 1927–1947. [Google Scholar] [CrossRef] [Green Version]
- Lepore, C.; Arnone, E.; Noto, L.V.; Sivandran, G.; Bras, R.L. Physically Based Modeling of Rainfall-Triggered Landslides: A Case Study in the Luquillo Forest, Puerto Rico. Hydrol. Earth Syst. Sci. 2013, 17, 3371–3387. [Google Scholar] [CrossRef] [Green Version]
- Kim, J.; Lee, K.; Jeong, S.; Kim, G. GIS-based prediction method of landslide susceptibility using a rainfall infiltration-groundwater flow model. Eng. Geol. 2014, 182, 63–78. [Google Scholar] [CrossRef]
- Green, W.H.; Ampt, G. Studies on soil physics, 1. The flow of air and water through soils. J. Agric. Sci. 1911, 4, 1–24. [Google Scholar]
- Mein, R.G.; Larson, C.L. Modeling infiltration during a steady rain. Water Resour. Res. 1973, 9, 384–394. [Google Scholar] [CrossRef]
- Soller, D.; Duncan, I.; Ellis, G.; Giglierano, J.; Hess, R. Proposed guidelines for inclusion of digital map products in the National Geologic Map Database. In Proceedings of the Digital Mapping Techniques’99, Madison, WI, USA, 19–22 May 1999; Workshop US Geological Survey Open-File Report. USGS: Reston, VA, USA, 1999; pp. 99–386. [Google Scholar]
- Ali, F. Unsaturated tropical residual soils and rainfall induced slopes in Malaysia. In Proceedings of the Asian Conference on Unsaturated Soils, Singapore, 18–19 May 2000; Volume 41, pp. 18–19. [Google Scholar]
- Saadatkhah, N.; Mansor, S.; Kassim, A.; Lee, L.M.; Saadatkhah, R.; Sobhanmanesh, A. Regional modeling of rainfall-induced landslides using TRIGRS model by incorporating plant cover effects: Case study in Hulu Kelang, Malaysia. Environ. Earth Sci. 2016, 75, 445. [Google Scholar] [CrossRef]
- Stek, P.E. Urban Groundwater Extraction in Kuala Lumpur, Malaysia. Master’s Thesis, Civil Engineering and Management, University of Twente, Enschede, The Netherlands, 2008. [Google Scholar]
- Anderson, M.G.; Burt, T.P. The role of topography in controlling through flow generation. Earth Surf. Process. 1978, 3, 331–344. [Google Scholar] [CrossRef]
- Koler, T.E. Evaluating slope stability in forest uplands with deterministic and probabilistic models. Environ. Eng. Geosci. 1998, 4, 185–194. [Google Scholar] [CrossRef]
- Schmidt, K.M.; Roering, J.J.; Stock, J.D.; Dietrich, W.E.; Montgomery, D.R.; Schaub, T. The variability of root cohesion as an influence on shallow landslide susceptibility in the Oregon Coast Range. Can. Geotech. J. 2003, 40, 237–253. [Google Scholar] [CrossRef]
- Stokes, A.; Norris, J.E.; Van Beek, L.P.H.; Bogaard, T.; Cammeraat, E.; Mickovski, S.B.; Jenner, A.; Iorio, A.; Fourcaud, T. How Vegetation Reinforces Soil. Slope Stability and Erosion Control: Ecotechnological Solutions; Springer: Berlin, Germany, 2008; pp. 65–118. [Google Scholar]
- Cancienne, R.; Fox, G.A.; Simon, A. Influence of seepage undercutting on the root reinforcement of streambanks. Earth Surf. Proc. Landf. 2008, 33, 1769–1786. [Google Scholar] [CrossRef]
- Hoffman, J.R.; Stout, J.R. Performance-enhancing substances. In Essentials of Strength and Conditioning, 3rd ed.; Earle, R.W., Baechle, T.R., Eds.; Human Kinetics: Champaign, IL, USA, 2008; pp. 179–200. [Google Scholar]
- Sonnenberg, R.; Bransby, M.F.; Hallett, P.D.; Bengough, A.G.; Mickovski, S.B.; Davies, M.C.R. Centrifuge modelling of soil slopes reinforced with vegetation. Can. Geotech. 2010, 47, 1415–1430. [Google Scholar] [CrossRef]
- Lee, M.L.; Ng, K.Y.; Huang, Y.F.; Li, W.C. Rainfall-induced landslides in Hulu Kelang area, Malaysia. Nat. Hazards 2014, 70, 353–375. [Google Scholar] [CrossRef]


| Soil Name | γs | C′ (kPa) | φ′ (°) | Ks (m/s) | θr | θs |
|---|---|---|---|---|---|---|
| STP2 | 14.1 | 23 | 31.5 | 9.47 × 10–07 | 0.079 | 0.442 |
| LAACOL2 | 16.3 | 11 | 31 | 1.52 × 10–06 | 0.063 | 0.384 |
| STP1 | 15.4 | 21 | 29 | 9.47 × 10–07 | 0.079 | 0.442 |
| MUM-SBN | 13.7 | 26 | 23 | 1.71 × 10–07 | 0.098 | 0.459 |
| LAACOL1 | 16.8 | 4 | 33 | 1.52 × 10–06 | 0.063 | 0.384 |
| DLD | 15.7 | 5 | 32 | 1.40 × 10–06 | 0.043 | 0.263 |
| RGM | 18.7 | 2 | 35 | 4.43 × 10–06 | 0.039 | 0.387 |
| UDEVA | 14.8 | 22 | 28 | 1.11 × 10–06 | 0.111 | 0.481 |
| Class | Root Cohesion (kPa) | LAI | Interception Loss (%) | |
|---|---|---|---|---|
| Primary forest | 2.75 | 2.95 | 3.99 | 24 |
| Secondary forest | 1.76 | 2.25 | 3.35 | 23 |
| Rubber | 0.3 | 1.35 | 2.29 | 19 |
| Sundry tree cultivation | 2.75 | 2.25 | 3.5 | 23 |
| Grass land | 0 | 0 | 1.49 | 17 |
| Cleared land | 0 | 0 | 0 | 0 |
| Developed area | 0 | 0 | 0 | 0 |
| Lake | 0 | 0 | 0 | 0 |
| Time | Confusion Matrix | TPR | FPR | Distance to y = x Line | |||
|---|---|---|---|---|---|---|---|
| End of dry season (shallow) | Prediction | Positive | Negative | 0 | 0 | 0 | |
| Occurrence | |||||||
| Yes | 0 | 285 | |||||
| No | 0 | 36,815 | |||||
| End of SW monsoon (shallow) | Prediction | Positive | Negative | 0.186 | 5.16 × 10–04 | 0.131 | |
| Occurrence | |||||||
| Yes | 8 | 35 | |||||
| No | 19 | 36,796 | |||||
| End of NE monsoon (shallow) | Prediction | Positive | Negative | 0.769 | 5.79 × 10–03 | 0.539 | |
| Occurrence | |||||||
| Yes | 83 | 25 | |||||
| No | 213 | 36,602 | |||||
| End of dry season (deep-seated) | Prediction | Positive | Negative | 0.551 | 0.094 | 0.323 | |
| Occurrence | |||||||
| Yes | 38 | 31 | |||||
| No | 3446 | 33,369 | |||||
| End of SW monsoon (deep-seated) | Prediction | Positive | Negative | 0.722 | 0.154 | 0.401 | |
| Occurrence | |||||||
| Yes | 70 | 27 | |||||
| No | 5664 | 31,151 | |||||
| End of NE monsoon (deep-seated) | Prediction | Positive | Negative | 0.791 | 0.243 | 0.388 | |
| Occurrence | |||||||
| Yes | 91 | 24 | |||||
| No | 8933 | 27,882 | |||||
| Depth | False Evaluation | TRIGRS (%) | Improved TRIGRS (%) | YS-Slope (%) [Depth = Wetting Front Depth] | |
|---|---|---|---|---|---|
| 4 m | False positive | 30.09 | 29.08 | False positive | 0.58 |
| False negative | 12.25 | 4.83 | |||
| 8 m | False positive | 23.13 | 17.08 | False negative | 23.15 |
| False negative | 21.03 | 10.04 | |||
© 2018 by the authors. Licensee MDPI, Basel, Switzerland. This article is an open access article distributed under the terms and conditions of the Creative Commons Attribution (CC BY) license (http://creativecommons.org/licenses/by/4.0/).
Share and Cite
Jeong, S.; Kassim, A.; Hong, M.; Saadatkhah, N. Susceptibility Assessments of Landslides in Hulu Kelang Area Using a Geographic Information System-Based Prediction Model. Sustainability 2018, 10, 2941. https://0-doi-org.brum.beds.ac.uk/10.3390/su10082941
Jeong S, Kassim A, Hong M, Saadatkhah N. Susceptibility Assessments of Landslides in Hulu Kelang Area Using a Geographic Information System-Based Prediction Model. Sustainability. 2018; 10(8):2941. https://0-doi-org.brum.beds.ac.uk/10.3390/su10082941
Chicago/Turabian StyleJeong, Sangseom, Azman Kassim, Moonhyun Hong, and Nader Saadatkhah. 2018. "Susceptibility Assessments of Landslides in Hulu Kelang Area Using a Geographic Information System-Based Prediction Model" Sustainability 10, no. 8: 2941. https://0-doi-org.brum.beds.ac.uk/10.3390/su10082941