Study of the Impact of a High-Speed Railway Opening on China’s Accessibility Pattern and Spatial Equality


1
Human Settlements Research Center, Liaoning Normal University, Dalian 116029, China
2
Liaoning Key Laboratory of Physical Geography and Geomatics, Liaoning Normal University, Dalian 116029, China
3
Department of Tourism Management, Soochow University, Suzhou 215123, China
*
Authors to whom correspondence should be addressed.
Sustainability 2018, 10(8), 2943; https://0-doi-org.brum.beds.ac.uk/10.3390/su10082943
Submission received: 6 July 2018
/
Revised: 2 August 2018
/
Accepted: 15 August 2018
/
Published: 19 August 2018
(This article belongs to the Section Sustainable Transportation)
Abstract
:China’s high-speed rail was inaugurated in 2008; it has greatly improved accessibility, and reduced the time required to travel between cities, but at the same time, has caused an unfair distribution of accessibility levels. Therefore, this paper analyzes urban traffic roads and socio-economic statistics, using network analysis methods, accessibility coefficients of variation, and social demand indexes to explore the spatial and temporal characteristics of transport accessibility and spatial equity in China. By 2015, the national transport accessibility level will form a new pattern of “corridors” and “islands”, centered on high-speed rail lines and sites. Additionally, the opening of high-speed railways has improved, to a certain extent, the inter-regional accessibility balance, and increased accessibility from high-speed railway sites to non-site cities. Spatial equality was also analyzed using the accessibility coefficient and social demand index. In conclusion, studying accessibility and spatial equity plays an important role in the rational planning of urban land resources and transportation.
1. Introduction
A transportation network is formed by the daily commuting routes of a city’s residents, as well as the methods of transporting goods, which include railways, highways, aviation, and waterways. The establishment of a good transportation network is thus important to the future development of a city [1,2,3]. Presently, high-speed railways have become an important part of the transportation infrastructure, forming a new trend for traveling between cities [4,5]. These high-speed railways not only improve the convenience of visiting cities, but also promote the economic development of en route cities, as well as cities not directly along the railway [6,7]. Additionally, high-speed railways have reshaped the collaborative relationships between a city and its surrounding areas, thus promoting regional economic integration [8,9]. Therefore, the study of transportation accessibility and spatial equality has become a hot topic in research in the fields of urban planning, social economics, and transportation [10].
“Accessibility” is an important measure of a transport network; it is used to measure the interaction potential between urban nodes in the transportation network [11,12,13]. This concept was first proposed by Hansen in the 1950s [14]. Presently, the research on urban transportation accessibility includes scale, transportation methods [15,16], and modeling [17]. It also focuses on the importance of transportation networks in optimizing land use [18,19], patterns of tourism [20,21], housing prices [22], and the formation of a regional economic system [23]. Many studies have been primarily based on raster cost weighting and network analyses [24,25]. The weighted average travel time, economic potential, daily accessibility, and network efficiency were thus used to construct models to study accessibility [26,27]. For example, Gutiérrez used the potential accessibility index to assess the impact of high-speed railways on major cities along the route [28]. Jiang et al. adopted integrated network analysis and raster cost weighting to evaluate the impact of the Beijing–Shanghai high-speed railway on accessibility to central cities based on the weighted average travel time and potential value [29].
Transportation equity influences many social aspects, such as the time and cost spent on daily commutes, for educational purposes [30], and on public services [31,32,33]. Transportation accessibility is an important indicator for measuring inter-city visits, emphasizing residents’ time spent on traveling, and their enthusiasm for participating in social activities. Accessibility has been gradually recognized as an indicator of transportation equity [34]. Presently, the evaluation of transportation equity is mostly focused on the needs of different social groups, population density, investment in transport facilities, and the strength of the external relationships of the city [35,36,37], and at the same time, uses the Lorenz curve and accessibility coefficient of variation (CV) to describe spatial inequality and accessibility [38,39]. The opening of high-speed railways has a non-uniform “corridor effect” on cities with or without stations along the route. Thus, this phenomenon may lead to some differences in the spatial distribution of accessibility. For example, Monzón et al. and López et al. used the CV of economic potential to study the impact of the Spanish high-speed railway expansion on city efficiency and equity [40,41]. Kim and Sultana used the potential accessibility and weighted average travel time to determine the effect of high-speed railways on regional equity in South Korea [42]. With the rapid development of society and improvements in living standards, the social demand indicator of each city has become different. Social indicators depend, to some extent, on the economy, population, and other indicators [43,44]. Therefore, the social indicator and the spatial distribution of accessibility illustrate the spatial equality problem [45,46]. To accurately reflect the problem of spatial equality, a selection of indicators and evaluation methods has been studied by many researchers.
Currently, many researchers use the spatial distribution of accessibility to illustrate China’s spatial equality, but they seldom consider the social needs of cities. Considering the large difference in social needs of different cities, this study explores the impact of accessibility and spatial equality after the opening of the high-speed rail. It will then provide a reference for road planners and policy makers to narrow the gap in accessibility between cities.
2. Methodology
This section describes the calculation methods of accessibility and equality, in order to reflect spatial equality by calculating the accessibility and social demand indicator. The first part describes the accessibility and index selection. The second part describes the CA and social demand index and establishes a social demand indicator system.
2.1. Accessibility Measures
Accessibility concepts and measurement are very important for urban transportation researchers and planners. There are many ways to measure accessibility, such as the distance method, topology method, cumulative chance method, and the gravity model [47,48]. The measures of accessibility are mostly concentrated on the shortest time between cities, the cost and the comprehensive evaluation of the transport network [49]. However, many researchers measured accessibility using a single angle previously, often neglecting the cost of urban transportation trips, socio-economic, and demographic factors. Therefore, this study selects two indicators of generalized weighted average travel time and economic potential to describe accessibility spatial characteristics.
2.1.1. Generalized Weighted Travel Time
The generalized weighted travel time (GAT) represents integrated time and cost to measure accessibility, where the lower the value, the better the accessibility. Therefore, it is of great importance as a measure of transportation accessibility [50].
In the above equations, aij represents inter-city accessibility. Fij represents the lowest travel cost. Mj represents the total population of city j. Tij represents the shortest travel time. TVj represents the generalized travel time of a city. Here, aij, Fij, and Tij are obtained using the ArcGIS Network Analysis Module. TVj represents the contribution of the gross domestic product (GDP) per capita per hour in city j. Pj and GDPj represent the population and GDP of the destination city, respectively. WH represents the standard working hours per year (2000 h) in China. Ai represents the GAT of city i.
2.1.2. Economic Potential Accessibility Index
The potential accessibility index (PA) represents the total amount of economic activities in cities and can reflect the strength of interaction among cities and the diffusion capacity [51].
In the above, PAi denotes the economic potential of city I; the greater the value, the better the accessibility, and vice versa. Tij represents the minimum time required to travel from node city i to city j.
2.2. Spatial Equality
The research on transportation equity is mostly concentrated on land use, population distribution, economic level, and public service, but its concept is still vague, with no clear standard for its definition [52,53,54]. Transportation equity can be generalized to both horizontal and vertical aspects [55]. Horizontal equity refers to the equal allocation of resources for all members of society under certain conditions. It mainly analyzes the spatial distribution of accessibility in space, and does not take into account the social needs of different regions [56]. Vertical equity needs to take into account the income of different residents, residents’ needs, age groups, and so on, followed by an analysis of the issue of spatial equality [57,58].
2.2.1. Coefficient of Variation
The degree of regional accessibility is measured by CV, which has been widely used in previous studies too [59,60]. This study applies CV as an evaluation indicator of transportation equity:
where CV represents the accessibility CV, σP represents the standard deviation of accessibility, and Ai represents the accessibility value, which is the GAT or PA.
2.2.2. Social Demand Indicator System
Since the 1980s, people have gradually used social demand indicators to reflect the issue of spatial equality, and combined the social needs and the spatial distribution characteristics of accessibility to illustrate transportation equity. Social indicators have been widely used to reflect the issue of spatial equality [61,62]. For example, Hao et al. analyzed the demand of urban transportation in China using indicators like low-income groups, disabled population, and aging population [63]. Xia et al. analyzed the Perth transportation equity problem by incorporating no-car groups into social demand indicators [64]. Therefore, how to select social demand indicators and build a comprehensive evaluation index system has become an important part of evaluating equity issues.
The construction of the social demand evaluation system is a prerequisite for the study of transportation equity. This study selects 13 social demand indicators from the three aspects of population, economy, and society to build a social demand indicator system (Table 1). Finally, the Global Principal Component Analysis (GPCA) is used to calculate the social demand index of each city [43,65].
3. Study Area and Data
3.1. Study Area
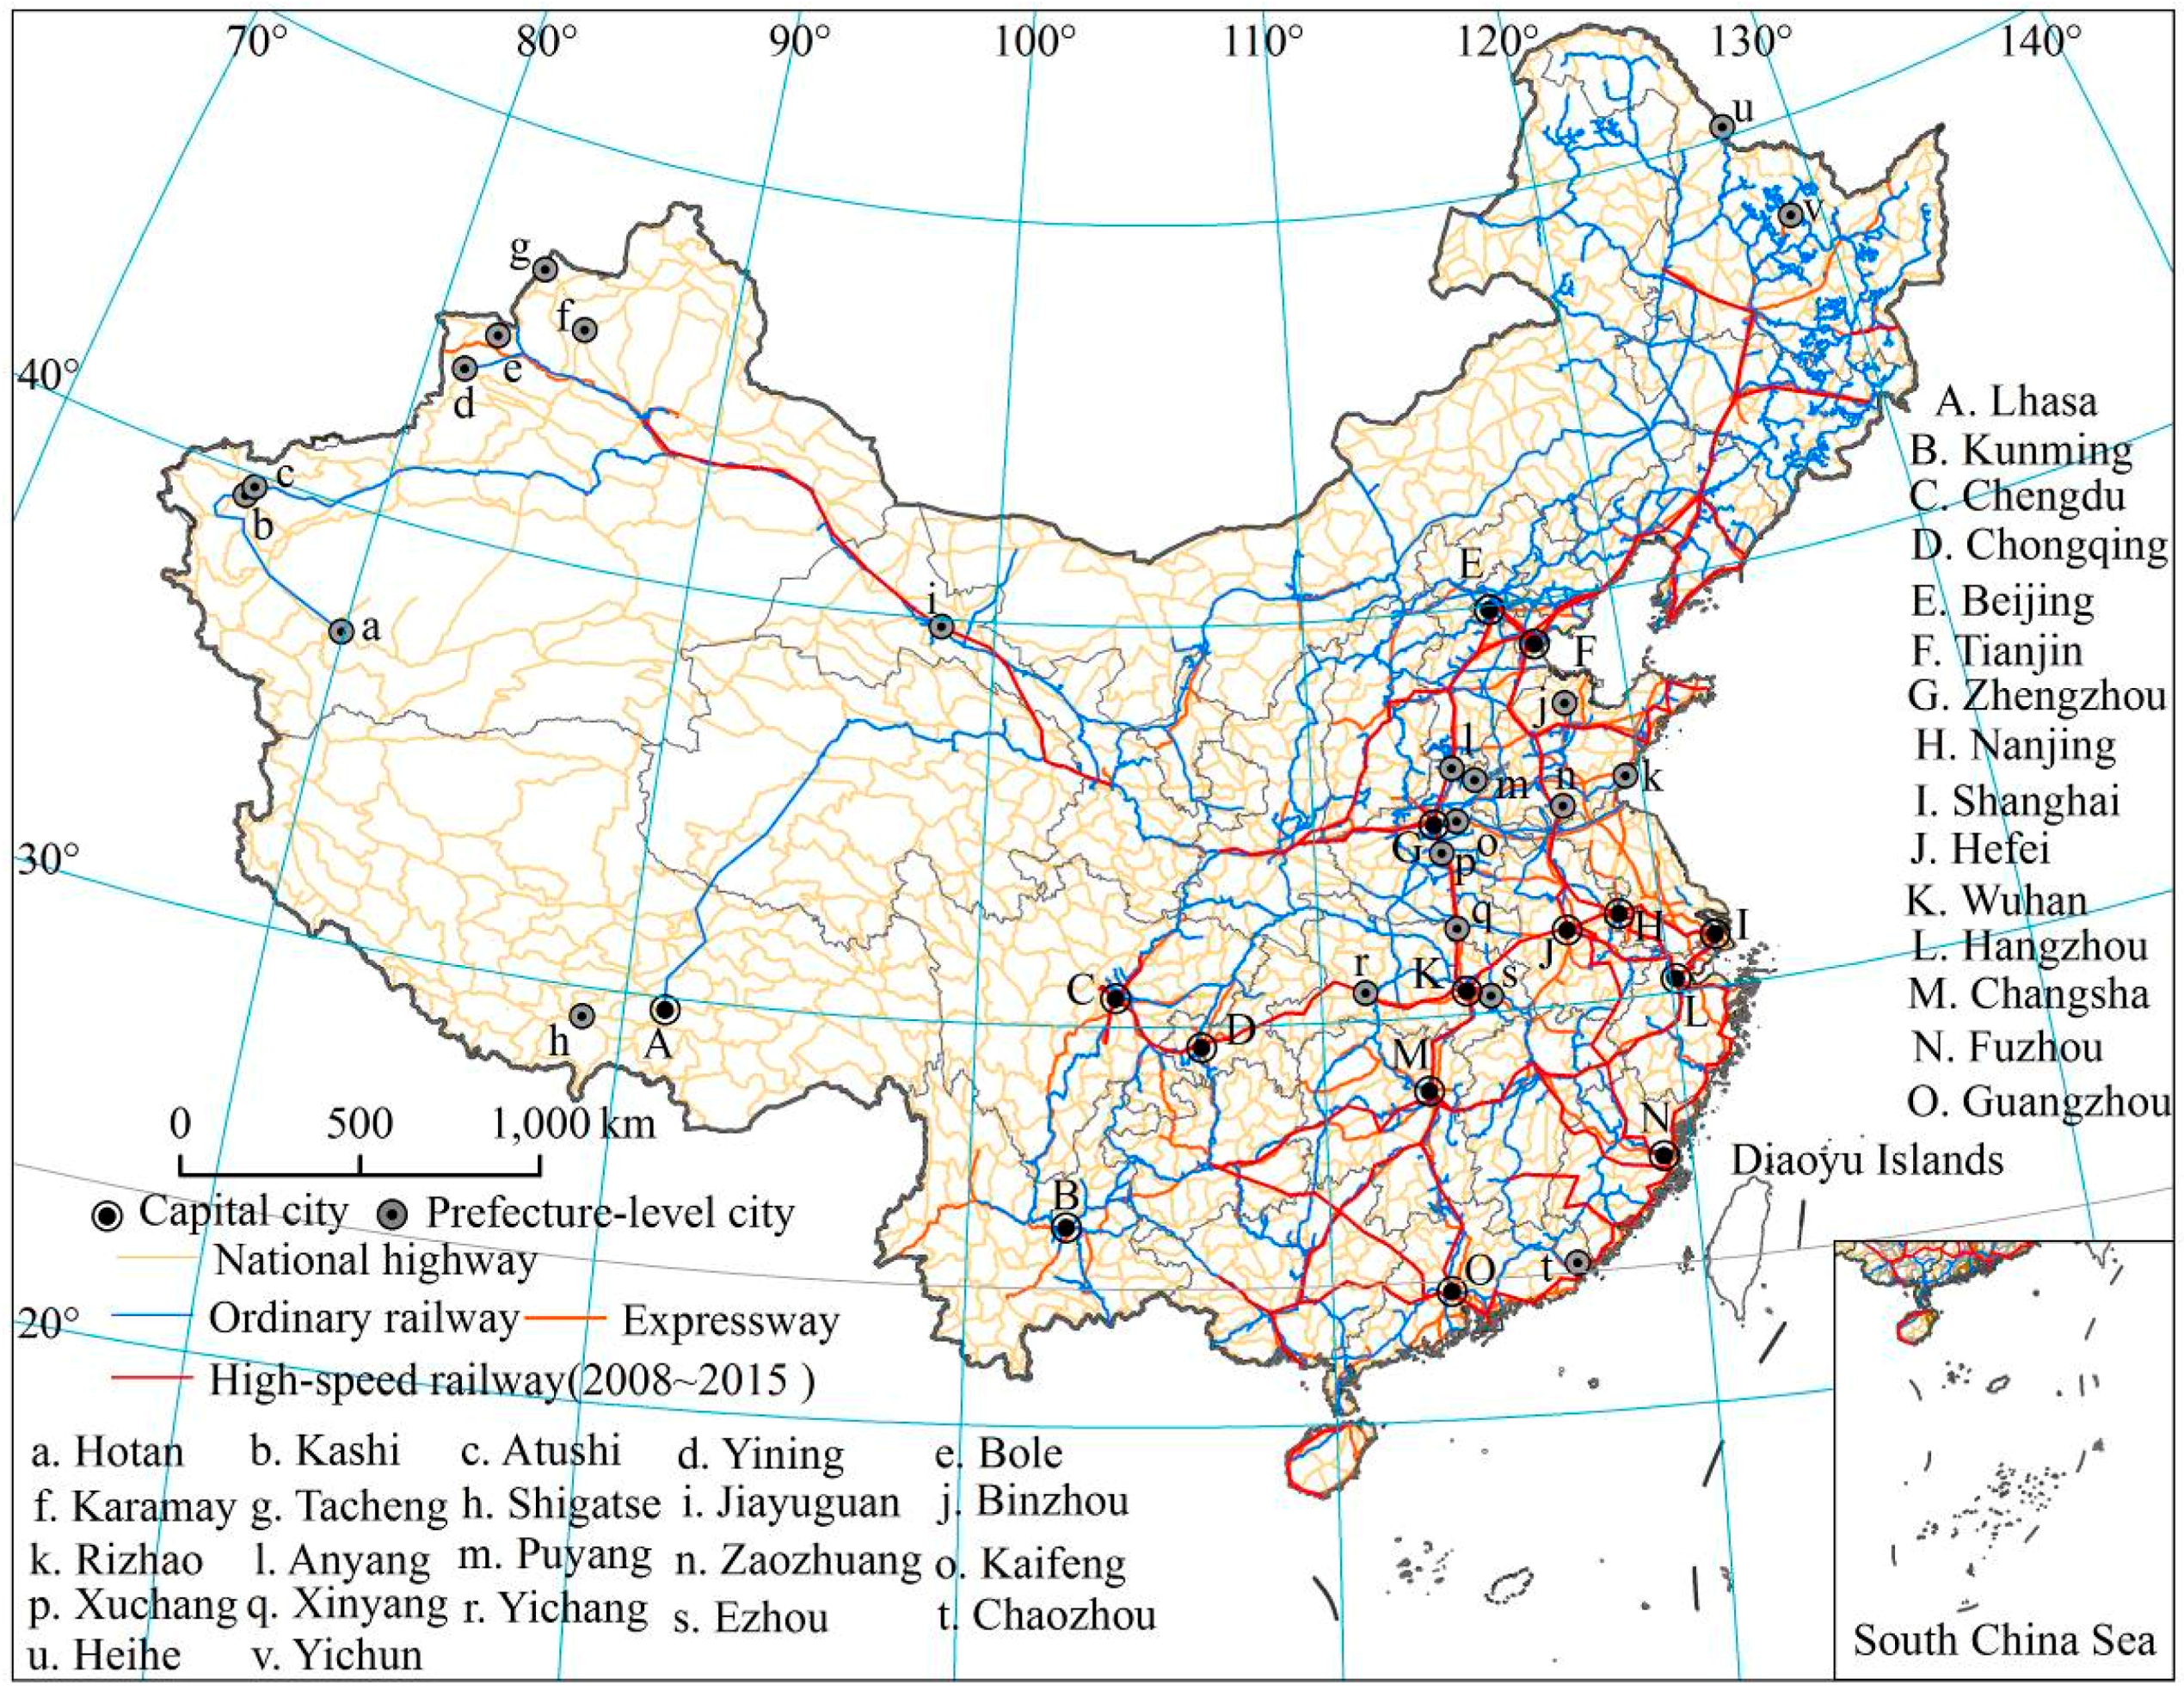
In China, as urbanization progresses, inter-regional economies become more closely linked, and the construction of integrated urban transportation infrastructure becomes more prominent. Cities with a high population density in China are mostly concentrated in the eastern region, mainly in the plains and hills, and belong to the monsoon season. High-speed rail is mostly distributed in the eastern and central regions. In July 2016, the National Development and Reform Commission approved the “The mid- to long-term railway network development plan”, which proposed two networks—high-speed and ordinary railways. By the end of 2015, China’s railway operation had reached 121,000 km, wherein the high-speed railway covered 19,000 km. This study explores the spatial and temporal characteristics of transportation accessibility and spatial equality before and after the opening of China’s high-speed rail (Figure 1).
3.2. Data Sources and Processing
This study is based on two periods of national traffic road data (1: 250,000), high-speed railway data, basic attributes, and socio-economic data (Table 2). The high-speed railway was first introduced in China in 2008, and is used as the starting point to evaluate transportation accessibility and differences in spatial-temporal equality. In accordance with the “People’s Republic of China highway engineering technical standards” and “The mid- to long-term development plan of China’s railway (2008–2020),” transportation networks are assigned the following speed definitions: high-speed railway (300 km/h), bullet train (250, 200 km/h), ordinary train (90 km/h), express highway (100 km/h), national highway (80 km/h), provincial highway (60 km/h), and country road (40 km/h). “China economic and social development statistical database” and related research articles are used to calculate travel cost for high-speed railway (1.75 Yuan/min), bullet train (0.75 Yuan/min), express highway/national highway/provincial highway/country road (0.1 Yuan/min), and ordinary railway (0.22 Yuan/min) [66].
4. Results and Analysis
4.1. Temporal-Spatial Variation of Accessibility
4.1.1. Generalized Weighted Travel Time
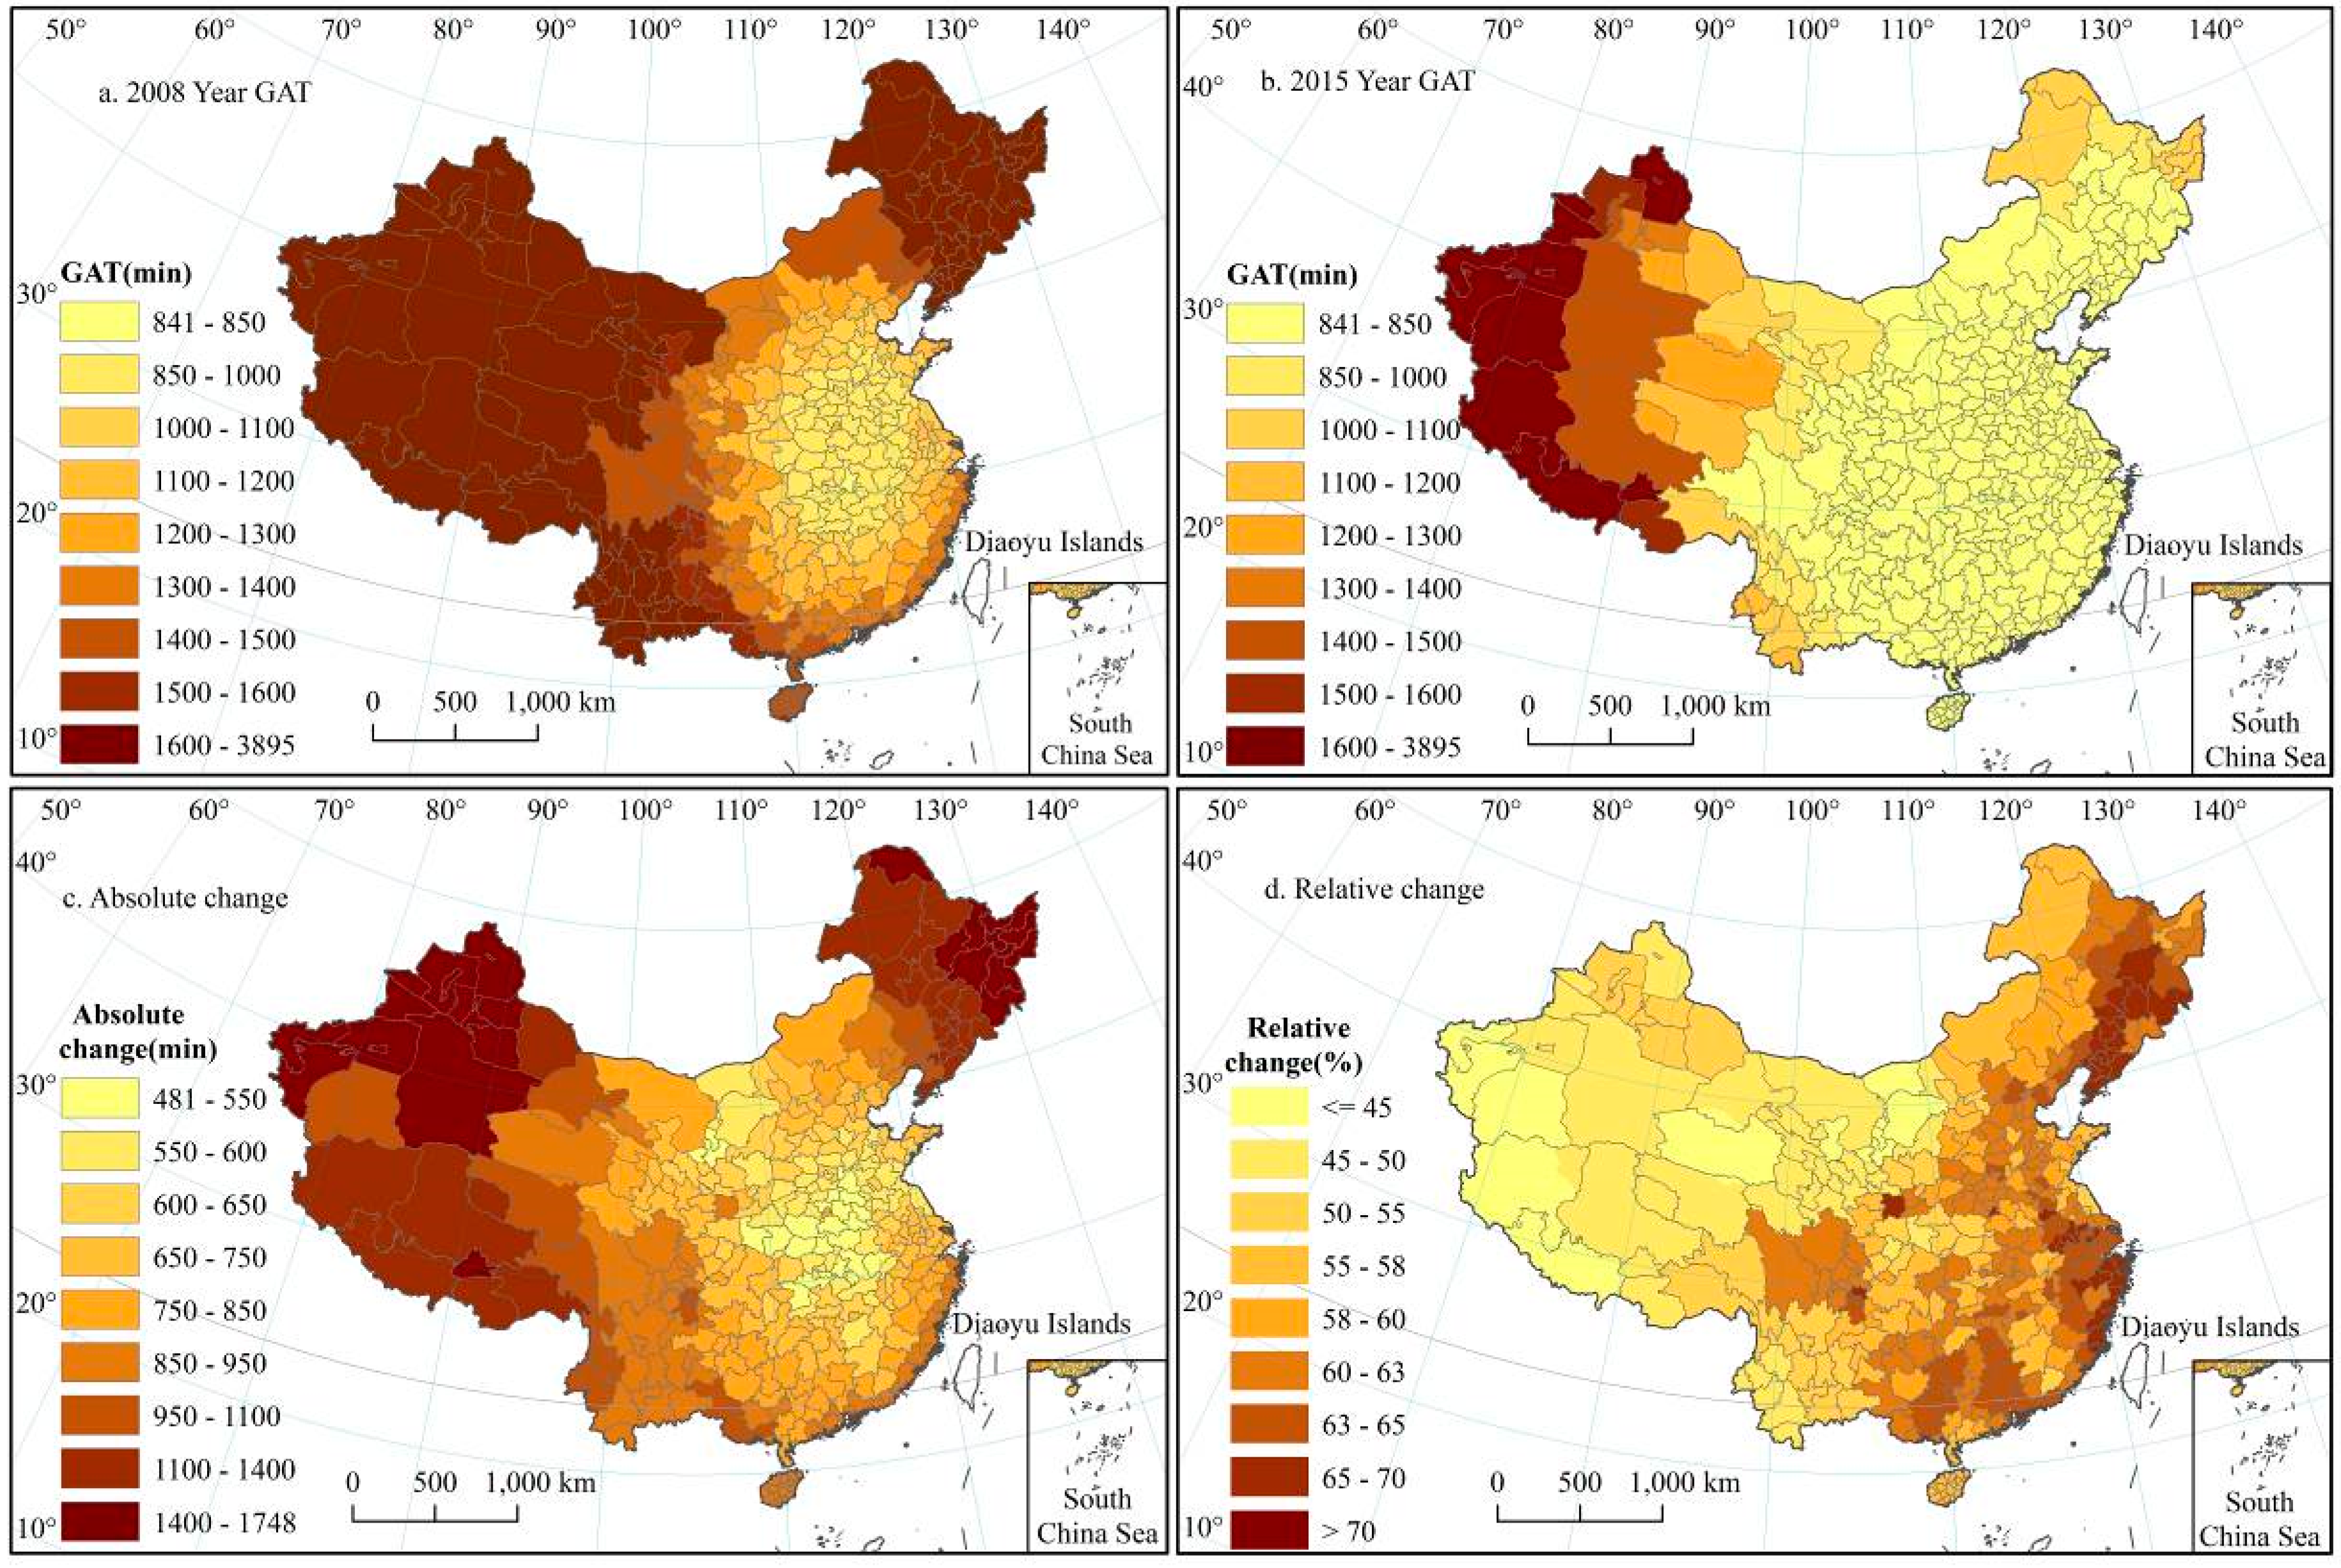
The temporal and spatial distribution of time-space distribution in China (Figure 2) was calculated using GAT reachability (Equations (1)–(3)).
GAT spatial distribution (Figure 2) shows that, before 2008, GAT formed a spatial pattern with Henan and Hubei as low-value cores with gradual expansion in the surrounding areas. The low-value core areas include Xinyang, Kaifeng, Xuchang, Wuhan, and Ezhou, with an average value of 872.91 min. High-value areas are concentrated in western China, such as in Atushi, Kashgar, and Hotan cites, which have poor transportation networks because of the climate, population density, economic factors, and political elements.
From 2008 to 2015, with the introduction of high-speed railways, the national GAT showed an overall reduction of 59.53%. This formed a high accessibility pattern along the high-speed railway, with destination cities as core nodes. In terms of magnitude of change, the absolute change in the northwestern and northeastern cities, such as Lhasa, Kashi, Jixi, or Yichun, is the most evident. In terms of relative change, central and eastern regions, such as Guangzhou, Changsha, Hefei, Fuzhou, Shanghai, Hangzhou, Nanjing, Beijing, or Chongqing, have exceeded the 60% mark because of the impact of multiple high-speed railways, including the Beijing–Shanghai, Beijing–Guangzhou, Hangzhou–Fuzhou–Shenzhen, Shanghai–Kunming, and Shanghai–Yichang–Chengdu routes. This result further shows that high-speed trains reduced traveling time between regions, thereby strengthening the socio-economic ties of remote areas with eastern and central regions.
4.1.2. Economic Potential
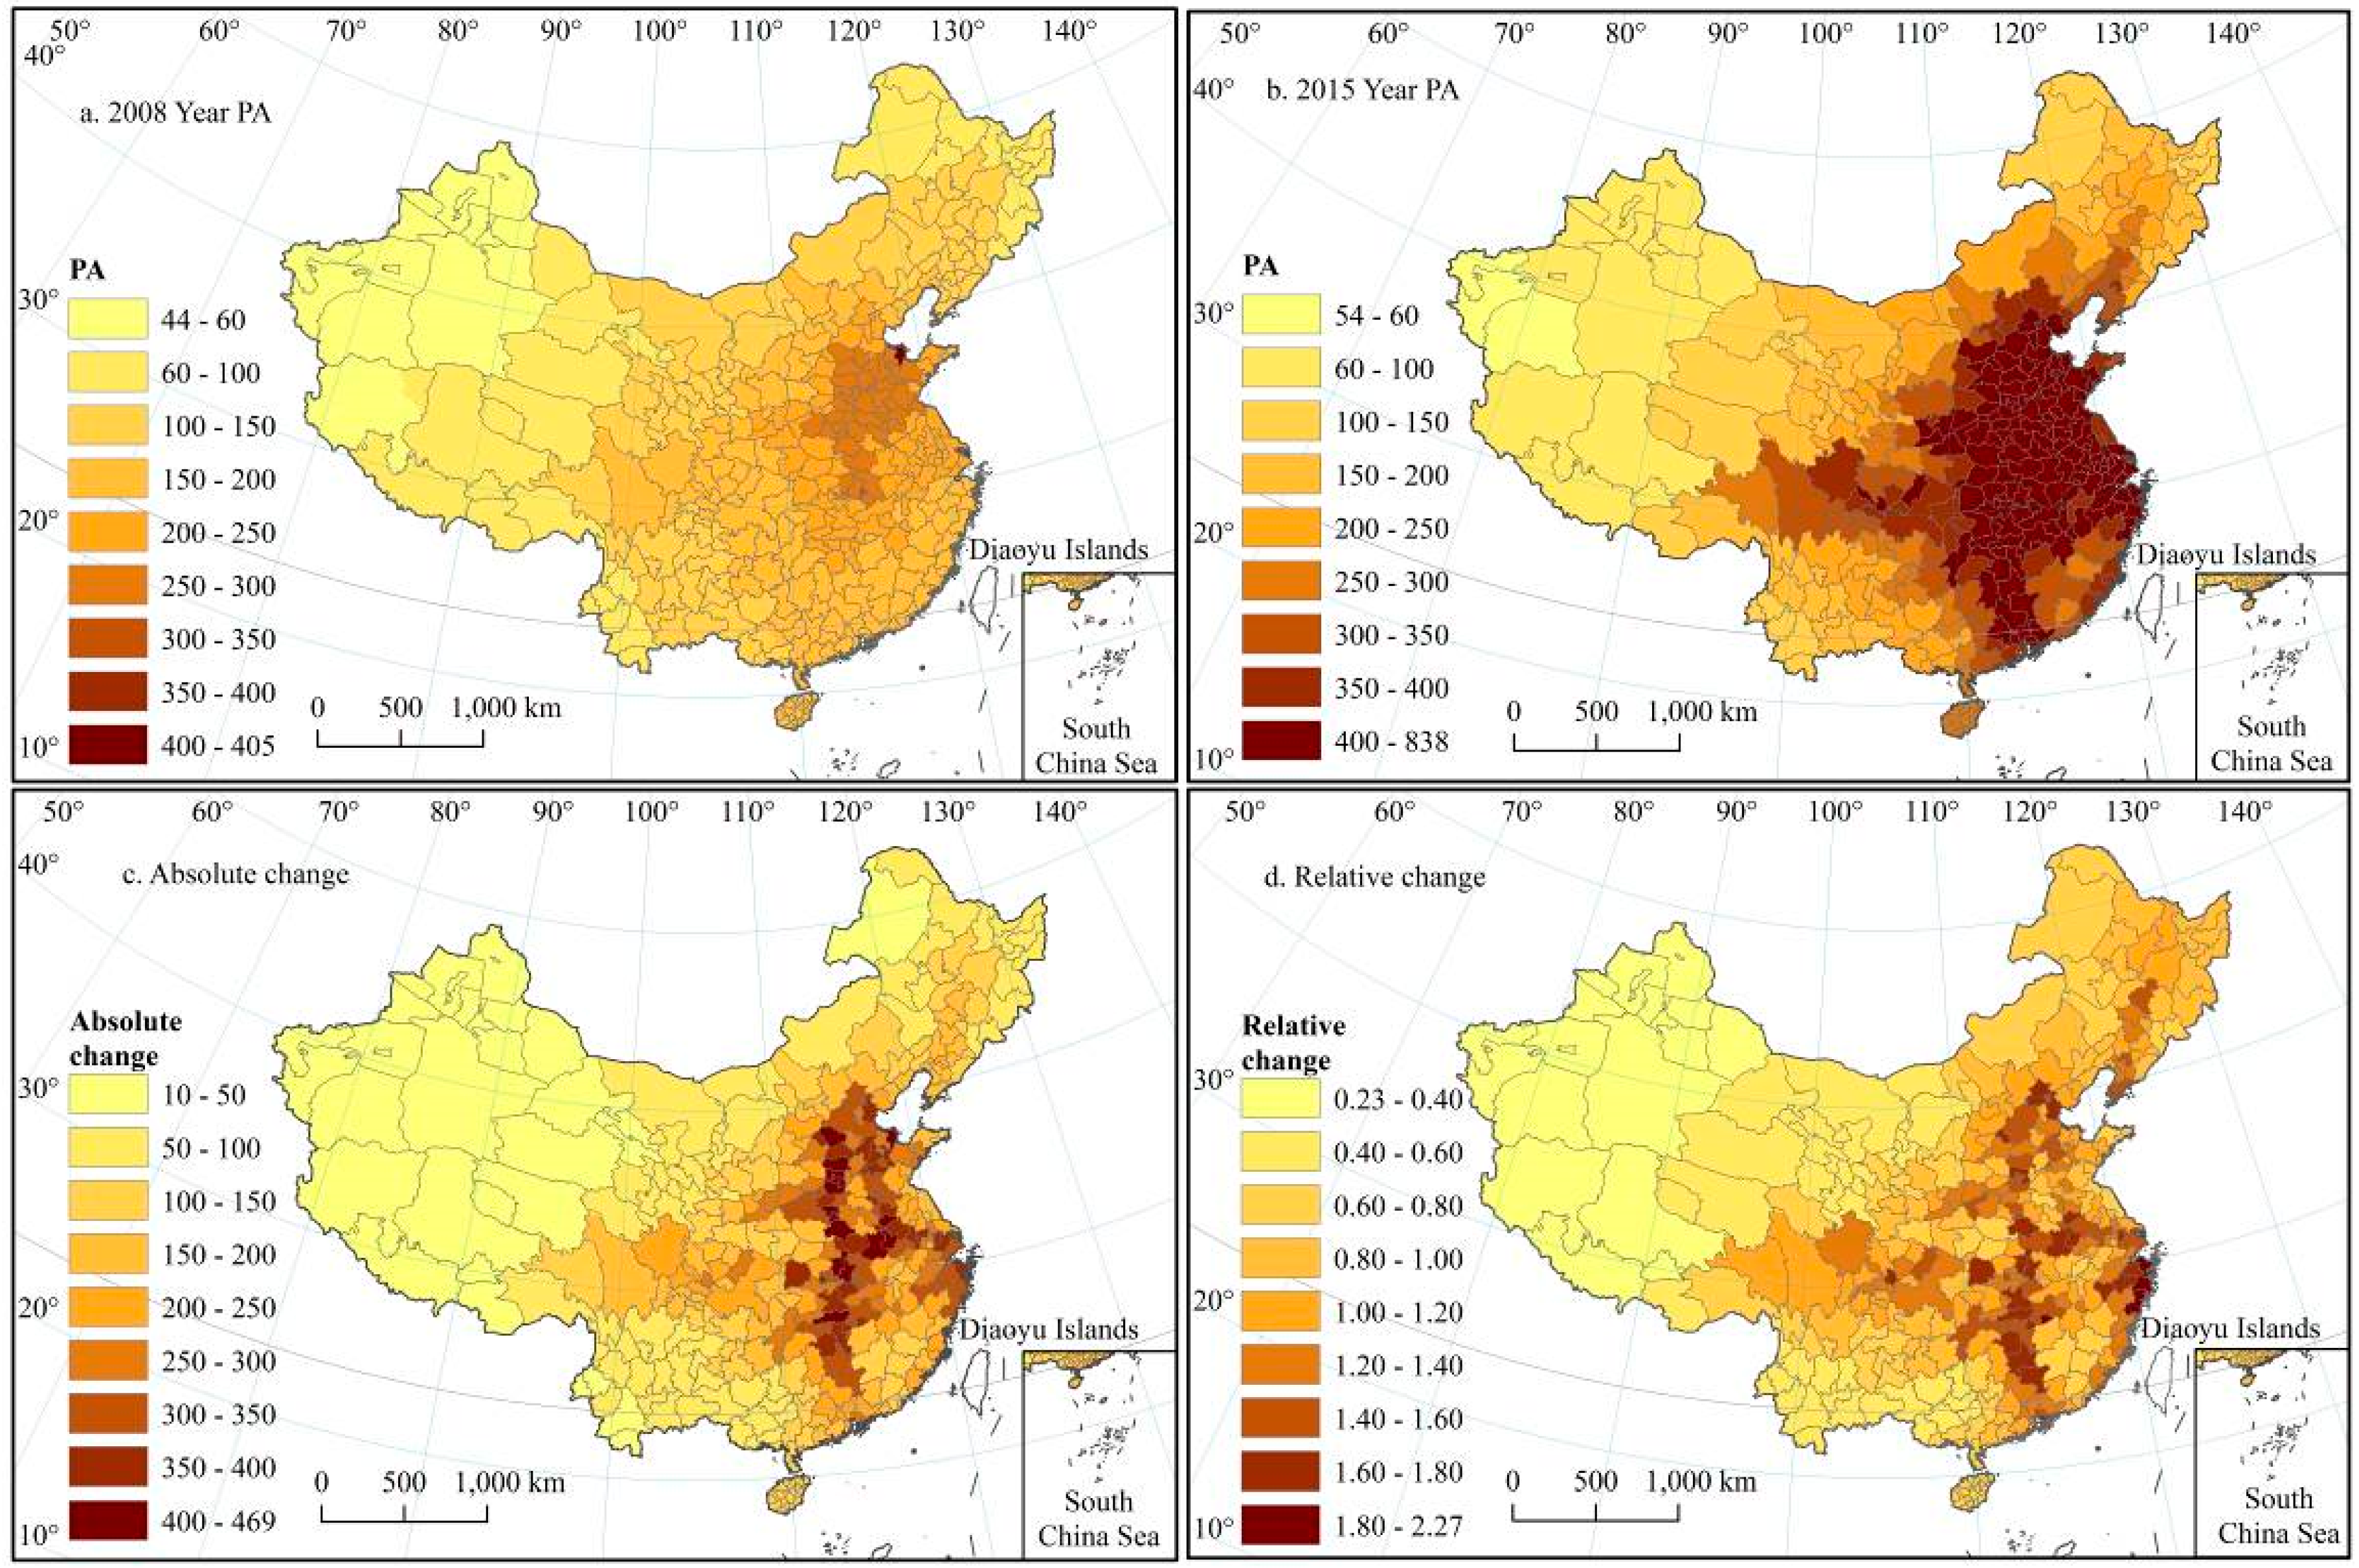
Using the PA approach (Equation (4)), the temporal and spatial distribution of China’s PA is computed (Figure 3).
The economic potential indicates that, before 2008, cities for which the PA exceeded 300 were mostly located in the central eastern region of Henan Province (Figure 3). Areas with economic potentials below 60 were mostly concentrated in western Xinjiang and remote areas in Tibet. Therefore, this distribution forms a pattern of “concentric circles” with the mid-eastern region as high-economic potential cores; this region’s high-value core areas include Ezhou, Xuchang, and Kaifeng, while Atushi, Lhasa, Bole, and Yining are the western low economic potential cities.
From 2008 to 2015, the economic potential of China increased by 118.61%. Economic potential is higher in cities along the high-speed railway and those with stations, such as Kaifeng, Anyang, Zhengzhou, and Hefei, which have economic potentials above 700. Low economic potential areas are still concentrated in the western region’s remote areas of Yunnan, Heilongjiang, and Inner Mongolia, with an average increase in economic potential of 28.17%. The results indicate that high-speed railways have strengthened the economic diffusion capacity and connection between cities, thereby promoting the development of economic potential in remote areas.
4.2. Spatial-Temporal Differentiation of Equality
4.2.1. Coefficient of Variation
Accessibility CV is used to evaluate transportation equity (Equation (5)). Table 3 presents the following two aspects. First, all sample cities’ accessibility CV increased by 0.34 and 0.16, showing that, over eight years, the balance of accessibility difference increased. At the same time, the difference in economic potential balance is lower than the GAT. Second, in cities with and without high-speed train stations, GAT (CV) increased by 0.11 and 0.29, respectively. The economic potential CV increased by −0.02 and 0.18, respectively, which indicates that the balanced difference of travel time in cities with high-speed train stations is smaller than that in non-destination cities. Moreover, the high-speed railway reduced the balanced difference of economic potential in cities with train stations and promoted the economic potential value for non-destination cities.
4.2.2. Social Demand Indicator
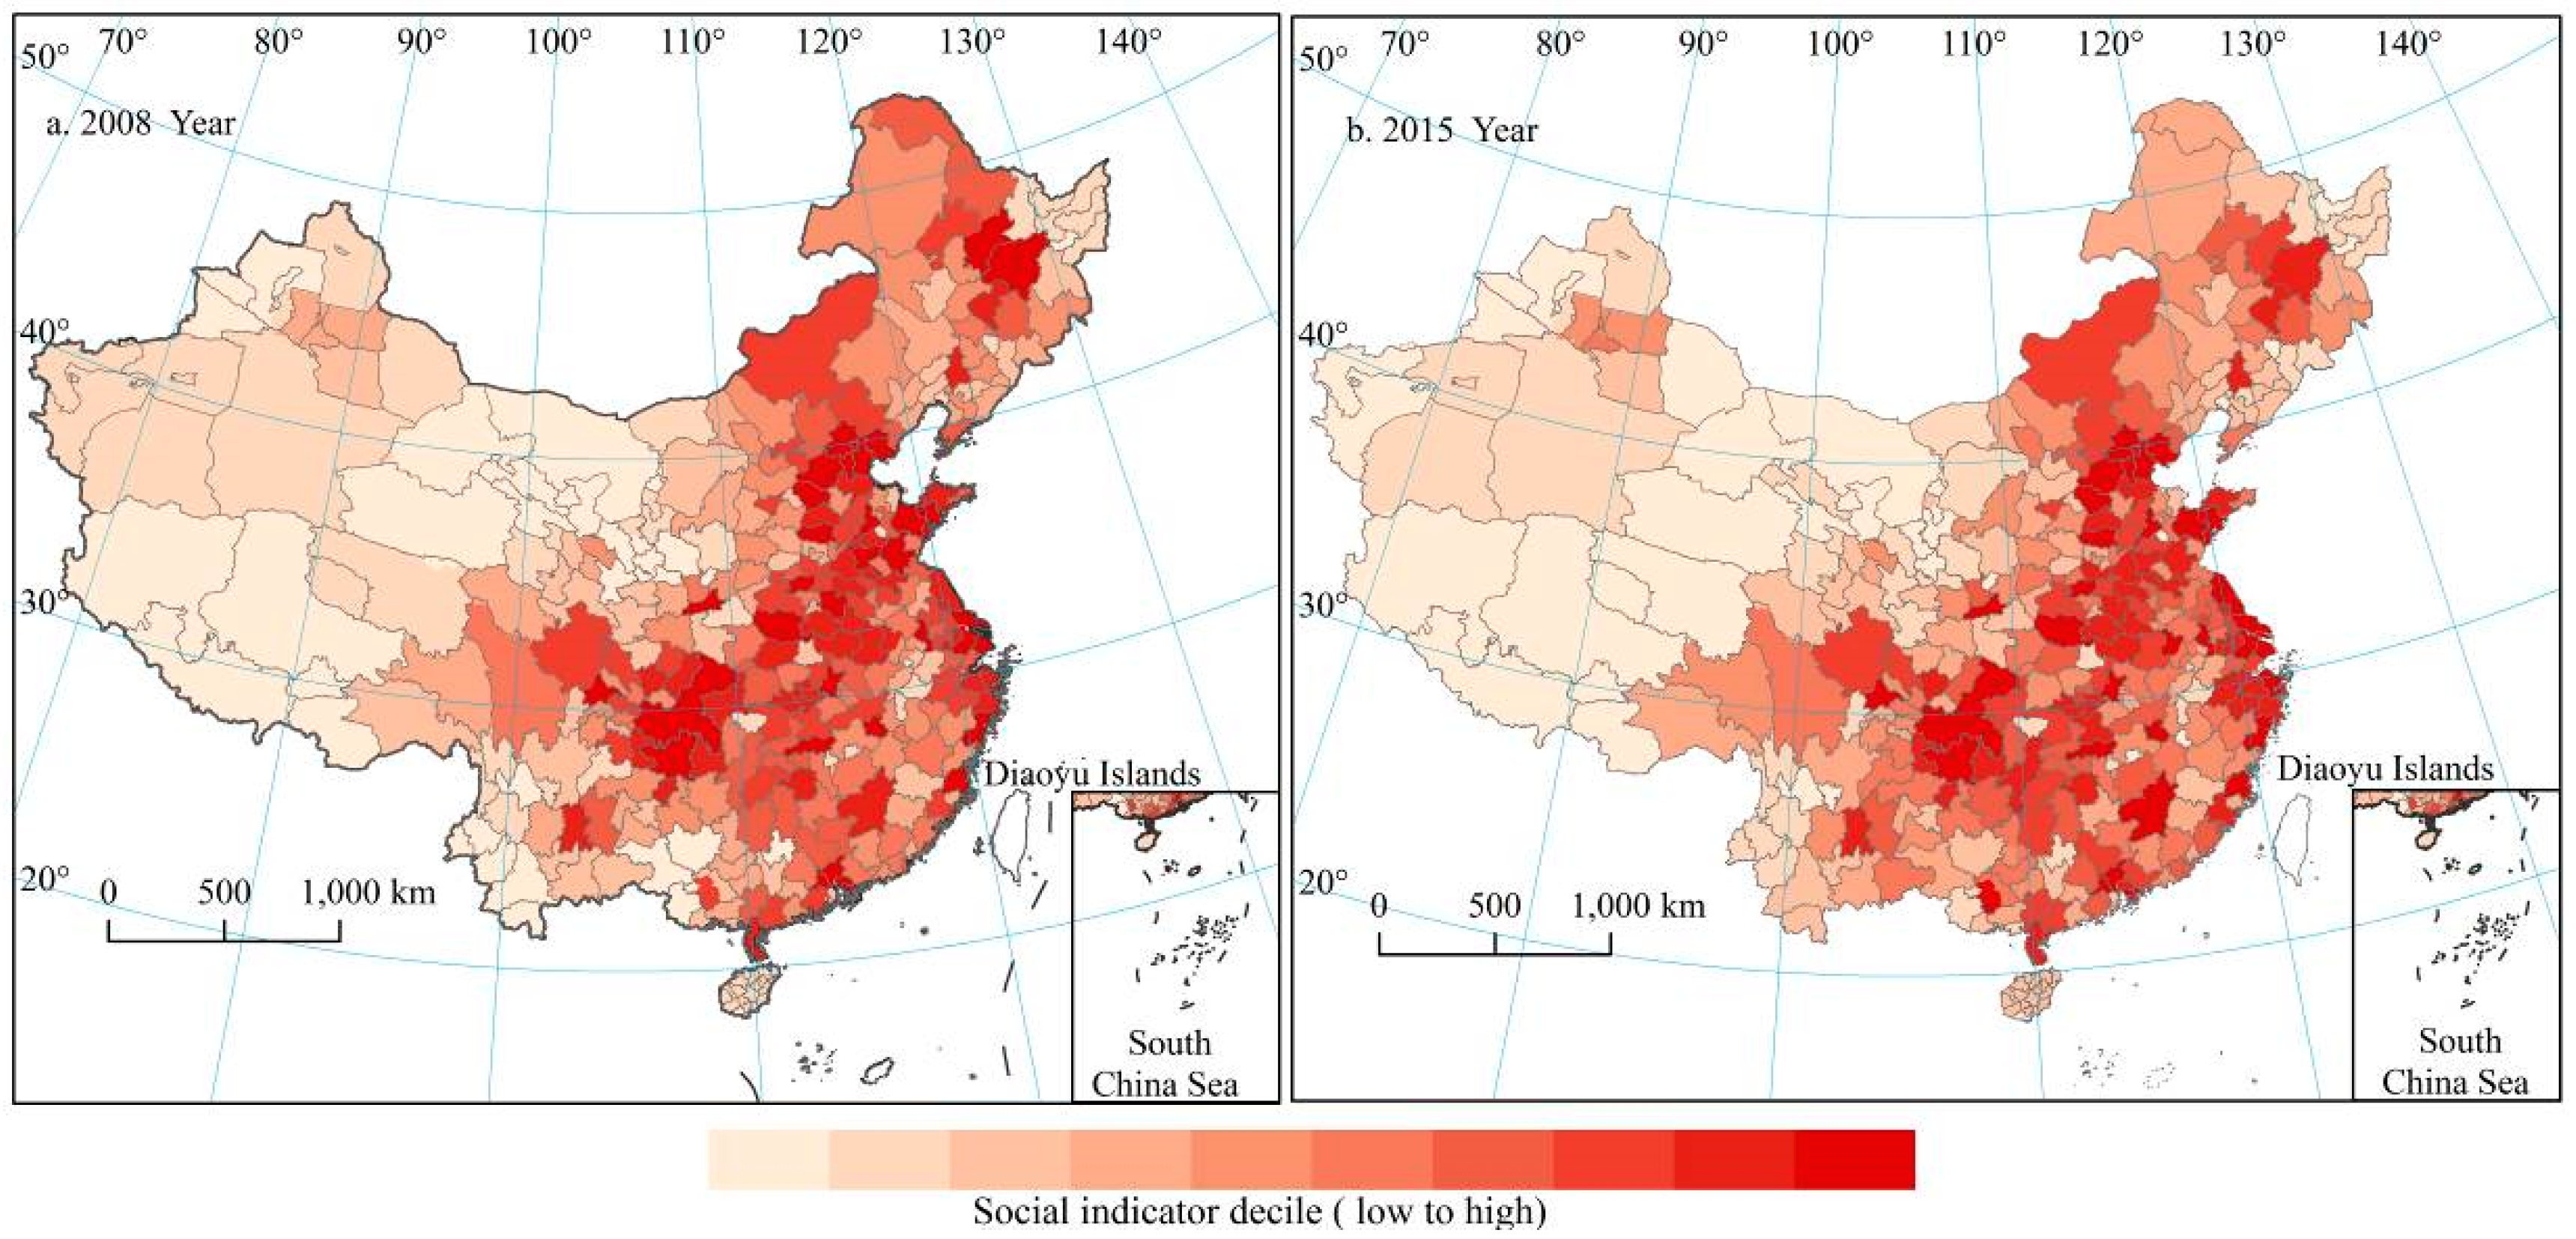
This section is mainly based on the constructed social demand index (Table 1), and uses the GCPA to determine the contribution rate of the main factors and the comprehensive score. As shown in Table 4, three principal component factors were extracted, with a cumulative variance contribution rate of 80.722%, indicating they all contained basic information. To discuss the spatial distribution of the social demand indicator, this study divides the latter into certain intervals (Figure 4). Among them, the lighter color represents lower urban social demand indexes, and the darker color represents higher social indexes, thus requiring higher accessibility.
The spatial distribution of the social demand indicator (Figure 4) shows that, in 2008, the cities with high social demand index included Beijing, Wuhan, Tianjin, and Shanghai, with a demand index above 10. This region has been influenced by many factors, such as history, culture, policy, and economy. As such, the comprehensive development level of the cities is relatively high. Moreover, in Xinjiang’s Tacheng City, Karamay City, Gansu’s Jiayuguan, Tibet’s Lhasa, and other cities, the social demand index is low. As of 2015, cities with a high urban social demand indicator in China are still concentrated in the eastern and central regions—mostly high-speed rail sites—and are located at the intersection of high-speed rail lines, such as Beijing, Tianjin, Chengdu, and Wuhan. Overall, from 2008 to 2015, the national urban social demand index increased by an average of 0.12, with absolute changes being registered in the largest cities, such as Shanghai, Hefei, and Tianjin, and relatively large changes in cities like Chaozhou, Heihe, and Yichang.
4.2.3. Trends by Social Indicator Decile
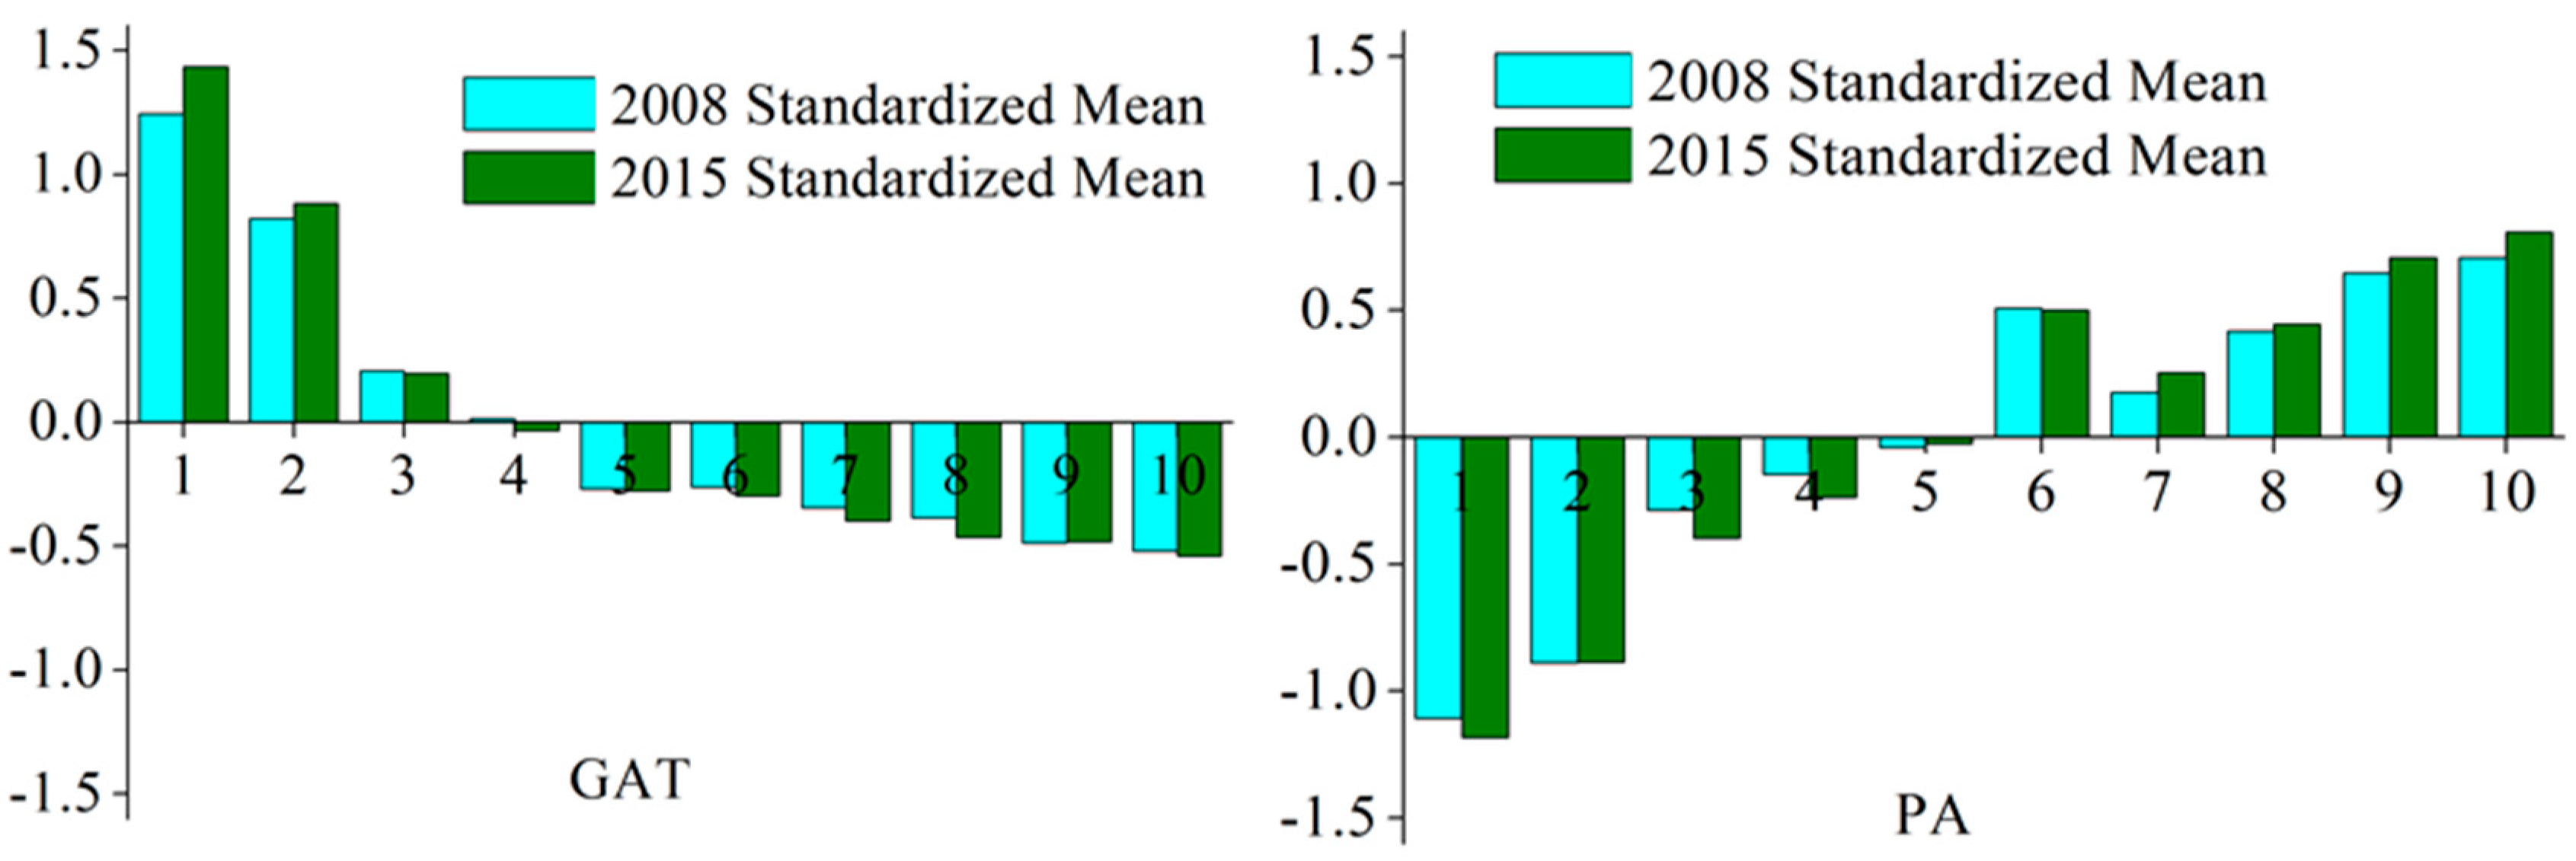
To further analyze the relationship between urban transportation accessibility and social demand, this study considers the relationship between its standardized values, as shown in Table 5. Over the past eight years, the gap between the social demand indicator of each city increased; the range of generalized weighted average travel time and potential value increased by 0.63 and −1.18, respectively; and the median by, −0.14 and 0.12, respectively. To a certain extent, this reflects the high-speed railway increasing generalized weighted average travel time differences between cities, thus narrowing potential accessibility differences.
The distribution of accessibility is analyzed based on the decile of the social demand index of cities across the country, in 2008 and 2015, as shown in Figure 5. Among them, the first decile of urban groups indicates the lowest social needs. For the first and third deciles, urban groups have lower social demand indices, and thus, an overall higher average weighted average travel time, which indicates lower accessibility. However, during the past eight years, the generalized weighted accessibility of the first and third decile city averages increased by 0.38 and 0.09, while the first decile range increased by 1.39, indicating that high-speed rail widened the city and overall national accessibility levels (e.g., the cities of Karamay, Jiayuguan, Lhasa, and Shigatse City).
By analyzing the potential accessibility of different city deciles over these eight years, the average transportation accessibility of potentials, in addition to the third, fourth, and sixth deciles in 2008 and 2015, decreased by 0.21, 0.09, and 0.29, respectively, while the accessibility level increased for the other decile arrays. Among them, the sixth decile group of urban potential accessibility shows the largest reduction, with spatial scattering. For cities like Binzhou, Rizhao, Zaozhuang, Puyang, and Ezhou, there is a significant gap between accessibility levels and social needs.
5. Discussion and Conclusions
This study analyzes the spatial and temporal characteristics of China’s transportation accessibility and spatial equality through accessibility and social needs. First, it uses the accessibility index (GAT, PA) to explain its spatial variation characteristics. Second, from the three aspects of population, economy, and society, the index system of urban social needs is built, while principal component analysis is used to obtain the index of urban social needs. Finally, the spatial equality problem is explained by combining the coefficient of accessibility variation and the social demand index. The following conclusions were drawn.
- The high-speed rail greatly improved the country’s accessibility level and promoted socio-economic exchanges between regions. It reshaped the spatial pattern of accessibility and formed a high-reliability level zone centered on high-speed rail lines and site cities. Over the past eight years, the accessibility of cities in the coastal areas of the central and eastern regions of China has always held a leading position. However, cities in the west, southwest, and northeastern border regions have improved their accessibility, but their relative rate of change is low, as is their accessibility level.
- The opening of high-speed railways has, to a certain extent, widened the differences in the spatial distribution of accessibility across the country. Cities with large changes in accessibility are concentrated in high-speed rail stations and railways in the eastern region. At the same time, the impact of high-speed rail on the accessibility of sites to non-site cities is different: the difference in accessibility between the former is lower than that for the latter.
- There is a significant difference in the spatial distribution of social demand indexes; cities with high social demand indexes generally have higher accessibility. In 2008, the cities with low transportation accessibility and high social demand index were “scattered” in space, mainly in Xinjiang, Qinghai, Yunnan, Sichuan, Heilongjiang, and Guangdong. The overall level of national accessibility was low because the traffic network in China was not complete at that time. By 2015, the cities with a low level of high social demand were “clustered” in the spatial distribution, which is concentrated in Xinjiang, Tibet, Yunnan, Inner Mongolia, Heilongjiang, and other marginal zones, indicating that accessibility is unfair in the space distribution.
The study focuses on the relationship between accessibility and social needs, and illustrates the impact of high-speed rail on China’s accessibility pattern and spatial equality. The social demand index in previous research was mainly concentrated on socially disadvantaged groups, such as low-income, disabled, aging, unemployed, and no-car populations. This study selects several factors related to the economy, society, and population, and uses principal component analysis to conduct a comprehensive evaluation of social needs, combining the accessibility spatial distribution and social demand index to further illustrate the equity of traffic spatial distribution. Therefore, it has both reference value and significance for the study of transportation accessibility and spatial equality.
However, there are still some limitations to the study in terms of accessibility and spatial equality. Transportation accessibility and equity not only refer to travel time, cost, and distance between cities, but also accessibility of infrastructure, such as education, medical care, and services. Therefore, future research needs to further improve the accessibility model and social demand indicator system.
Author Contributions
J.Y. contributed to all aspects of this work; A.G. wrote the main manuscript text, conducted the experiment, and analyzed the data; and X.L. and T.H. revised the paper. All authors have reviewed the manuscript.
Funding
This research study was supported by the National Natural Science Foundation of China (Grant no. 41771178, 41630749, 41471140) and the Innovative Talents Support Program of Liaoning Province, (Grant no. LR2017017).
Acknowledgments
This research study was supported by the National Natural Science Foundation of China (Grant no. 41771178, 41630749, 41471140) and the Innovative Talents Support Program of Liaoning Province, (Grant no. LR2017017). The authors would like to acknowledge all experts’ contributions in the building of the model and the formulation of the strategies in this study. In addition, we would like to thank Editage (ww.editage.cn) for English language editing.
Conflicts of Interest
The authors declare no conflict of interest.
References
- Gutiérrez, J.; González, R.; Gomez, G. The European high-speed train network: Predicted effects on accessibility patterns. J. Transp. Geogr. 1996, 4, 227–238. [Google Scholar] [CrossRef]
- Nagurney, A.; Liu, Z.; Woolley, T. Sustainable Supply Chain and Transportation Networks. Int. J. Sustain. Transp. 2007, 1, 29–51. [Google Scholar] [CrossRef] [Green Version]
- Tan, Y.; Dur, F. Developing a Sustainability Assessment Model: The Sustainable Infrastructure, Land-Use, Environment and Transport Model. Sustainability 2010, 2, 321–340. [Google Scholar] [CrossRef] [Green Version]
- Levinson, D.M. Accessibility impacts of high-speed rail. J. Transp. Geogr. 2012, 22, 288–291. [Google Scholar] [CrossRef]
- Lucas, K.; Van Wee, B.; Maat, K. A method to evaluate equitable accessibility: Combining ethical theories and accessibility-based approaches. Transportation 2016, 43, 473–490. [Google Scholar] [CrossRef]
- Tsou, K.W.; Cheng, H.T.; Tseng, F.Y. Exploring the relationship between multilevel highway networks and local development patterns—A case study of Taiwan. J. Transp. Geogr. 2015, 43, 160–170. [Google Scholar] [CrossRef]
- Jiao, J.; Wang, J.; Jin, F.; Chao, D.U. Understanding Relationship Between Accessibility and Economic Growth: A Case Study from China (1990–2010). Chin. Geogr. Sci. 2016, 803–816. [Google Scholar] [CrossRef]
- Mihyeon Jeon, C.; Amekudzi, A.A.; Vanegas, J. Transportation system sustainability issues in high-, middle-, and low-income economies: Case studies from Georgia (US), South Korea, Colombia, and Ghana. J. Urban Plan. Dev. 2006, 132, 172–186. [Google Scholar] [CrossRef]
- Martens, K. Justice in transport as justice in accessibility: Applying Walzer’s ‘Spheres of Justice’ to the transport sector. Transportation 2012, 39, 1035–1053. [Google Scholar] [CrossRef]
- Talen, E.; Anselin, L. Assessing spatial equity: An evaluation of measures of accessibility to public playgrounds. Environ. Plan. A 1998, 30, 595–613. [Google Scholar] [CrossRef]
- Li, S.; Shum, Y. Impacts of the national trunk highway system on accessibility in China. J. Transp. Geogr. 2001, 9, 39–48. [Google Scholar] [CrossRef]
- Lin, T.; Xia, J.; Robinson, T.P.; Goulias, K.G.; Church, R.L.; Olaru, D.; Tapin, J.; Han, R. Spatial analysis of access to and accessibility surrounding train stations: A case study of accessibility for the elderly in Perth, Western Australia. J. Transp. Geogr. 2014, 39, 111–120. [Google Scholar] [CrossRef]
- Jamtsho, S.; Corner, R.; Dewan, A. Spatio-Temporal Analysis of Spatial Accessibility to Primary Health Care in Bhutan. ISPRS Int. J. Geo-Inf. 2015, 4, 1584–1604. [Google Scholar] [CrossRef] [Green Version]
- Hansen, W.G. How Accessibility Shapes Land Use. J. Am. Inst. Plan. 1959, 25, 73–76. [Google Scholar] [CrossRef]
- Boisjoly, G.; El-Geneidy, A. Daily fluctuations in transit and job availability: A comparative assessment of time-sensitive accessibility measures. J. Transp. Geogr. 2016, 52, 73–81. [Google Scholar] [CrossRef]
- Tsou, K.; Hung, Y.; Chang, Y. An accessibility-based integrated measure of relative spatial equity in urban public facilities. Cities 2005, 22, 424–435. [Google Scholar] [CrossRef]
- Miller, H.J. Measuring Space-Time Accessibility Benefits within Transportation Networks: Basic Theory and Computational Procedures. Geogr. Anal. 1999, 31, 187–212. [Google Scholar] [CrossRef] [Green Version]
- Kwan, M.; Weber, J. Scale and accessibility: Implications for the analysis of land use–travel interaction. Appl. Geogr. 2008, 28, 110–123. [Google Scholar] [CrossRef]
- Chaudhuri, G.; Clarke, K.C. On the spatiotemporal dynamics of the coupling between land use and road networks: Does political history matter? Environ. Plan. B Plan. Des. 2015, 41, 133–156. [Google Scholar] [CrossRef]
- Pagliara, F.; Pietra, A.L.; Gomez, J.; Vassallo, J.M. High Speed Rail and the tourism market: Evidence from the Madrid case study. Transp. Policy 2015, 37, 187–194. [Google Scholar] [CrossRef] [Green Version]
- Alkahtani, S.J.H.; Xia, J.; Veenendaaland, B.; Caulfield, C.; Hughes, M. Building a conceptual framework for determining individual differences of accessibility to tourist attractions. Tour. Manag. Perspect. 2015, 16, 28–42. [Google Scholar] [CrossRef]
- Yang, J.; Bao, Y.; Zhang, Y.; Xueming, L.I.; Quansheng, G.E. Impact of Accessibility on Housing Prices in Dalian City of China Based on a Geographically Weighted Regression Model. Chin. Geogr. Sci. 2018, 505–515. [Google Scholar] [CrossRef]
- Yuan, Y.; Xu, J.; Wang, Z. Spatial Equity Measure on Urban Ecological Space Layout Based on Accessibility of Socially Vulnerable Groups—A Case Study of Changting, China. Sustainability 2017, 9, 1552. [Google Scholar] [CrossRef]
- Shaw, S.; Fang, Z.; Lu, S.; Tao, R. Impacts of high speed rail on railroad network accessibility in China. J. Transp. Geogr. 2014, 40, 112–122. [Google Scholar] [CrossRef]
- Jiang, B.; Chu, N. Comprehensive Evaluation of Accessibility in China’s High-Speed Rail Network Based on the Perspective of Time, Economy, and Frequency. J. Urban Plan. Dev. 2017, 143, 5017009. [Google Scholar] [CrossRef]
- Vickerman, R.; Spiekermann, K.; Wegener, M. Accessibility and economic development in Europe. Reg. Stud. 1999, 33, 1–15. [Google Scholar] [CrossRef]
- Golub, A.; Martens, K. Using principles of justice to assess the modal equity of regional transportation plans. J. Transp. Geogr. 2014, 41, 10–20. [Google Scholar] [CrossRef]
- Gutiérrez, J. Location, economic potential and daily accessibility: An analysis of the accessibility impact of the high-speed line Madrid-Barcelona-French border. J. Transp. Geogr. 2001, 9, 229–242. [Google Scholar] [CrossRef]
- Jiang, H.; Xu, J.; Qi, Y. The influence of Beijing-Shanghai high-speed railways on land accessibility of regional center cities. Acta Geogr. Sin. 2010, 65, 1287–1298. [Google Scholar] [CrossRef]
- Gao, Y.; He, Q.; Liu, Y.; Zhang, L.; Wang, H.; Cai, E. Imbalance in Spatial Accessibility to Primary and Secondary Schools in China: Guidance for Education Sustainability. Sustainability 2016, 8, 1236. [Google Scholar] [CrossRef]
- Ryan, M.; Lin, T.; Xia, J.; Robinson, T. Comparison of perceived and measured accessibility between different age groups and travel modes at Greenwood Station, Perth, Australia. Eur. J. Transp. Infrastruct. Res. 2016, 16, 406–423. [Google Scholar]
- Ahmed, Q.I.; Lu, H.; Ye, S. Urban transportation and equity: A case study of Beijing and Karachi. Transp. Res. Part A Policy Pract. 2008, 42, 125–139. [Google Scholar] [CrossRef]
- Liu, Y.; Jing, Y.; Zhang, L.; Li, J.; Yin, C. Assessing Spatial Accessibility of Public and Private Residential Aged Care Facilities: A Case Study in Wuhan, Central China. ISPRS Int. J. Geo-Inf. 2017, 6, 304. [Google Scholar] [CrossRef]
- Litman, T. Evaluating transportation equity. World Transp. Policy Pract. 2002, 8, 50–65. [Google Scholar]
- Lee, J. Cost overrun and cause in Korean social overhead capital projects: Roads, rails, airports, and ports. J. Urban Plan. Dev. 2008, 134, 59–62. [Google Scholar] [CrossRef]
- Gilart-Iglesias, V.; Mora, H.; Pérez-Delhoyo, R.; García-Mayor, C. A Computational Method based on Radio Frequency Technologies for the Analysis of Accessibility of Disabled People in Sustainable Cities. Sustainability 2015, 7, 14935–14963. [Google Scholar] [CrossRef] [Green Version]
- Zhao, M.; Liu, S.; Wei, Q.I. Spatial Differentiation and Influencing Mechanism of Medical Care Accessibility in Beijing: A Migrant Equality Perspective. Chin. Geogr. Sci. 2018, 28, 353–362. [Google Scholar] [CrossRef]
- Delbosc, A.; Currie, G. Using Lorenz curves to assess public transport equity. J. Transp. Geogr. 2011, 19, 1252–1259. [Google Scholar] [CrossRef]
- Guzman, L.A.; Oviedo, D.; Rivera, C. Assessing equity in transport accessibility to work and study: The Bogotá region. J. Transp. Geogr. 2017, 58, 236–246. [Google Scholar] [CrossRef]
- López, E.; Gutiérrez, J.; Gómez, G. Measuring Regional Cohesion Effects of Large-scale Transport Infrastructure Investments: An Accessibility Approach. Eur. Plan. Stud. 2008, 16, 277–301. [Google Scholar] [CrossRef] [Green Version]
- Monzón, A.; Ortega, E.; López, E. Efficiency and spatial equity impacts of high-speed rail extensions in urban areas. Cities 2013, 30, 18–30. [Google Scholar] [CrossRef] [Green Version]
- Kim, H.; Sultana, S. The impacts of high-speed rail extensions on accessibility and spatial equity changes in South Korea from 2004 to 2018. J. Transp. Geogr. 2015, 45, 48–61. [Google Scholar] [CrossRef]
- Church, A.; Frost, M.; Sullivan, K. Transport and social exclusion in London. Transp. Policy 2000, 7, 195–205. [Google Scholar] [CrossRef]
- Biggiero, L.; Pagliara, F.; Patrone, A.; Peruggini, F. Spatial equity and high-speed rail systems. Int. J. Transp. Dev. Integr. 2017, 2, 194–202. [Google Scholar] [CrossRef]
- Currie, G. Quantifying spatial gaps in public transport supply based on social needs. J. Transp. Geogr. 2010, 18, 31–41. [Google Scholar] [CrossRef]
- Jones, P.; Lucas, K. Social impacts and equity issues in transport: An introduction. J. Transp. Geogr. 2012, 21, 1–3. [Google Scholar] [CrossRef]
- Geurs, K.T.; Van Wee, B. Accessibility evaluation of land-use and transport strategies: Review and research directions. J. Transp. Geogr. 2004, 12, 127–140. [Google Scholar] [CrossRef]
- Zhang, W.; Nian, P.; Lyu, G. A multimodal approach to assessing accessibility of a high-speed railway station. J. Transp. Geogr. 2016, 54, 91–101. [Google Scholar] [CrossRef]
- Weber, J. The evolving Interstate Highway System and the changing geography of the United States. J. Transp. Geogr. 2012, 25, 70–86. [Google Scholar] [CrossRef]
- Shi, J.; Zhou, N. How Cities Influenced by High Speed Rail Development: A Case Study in China. J. Transp. Technol. 2013, 3, 7–16. [Google Scholar] [CrossRef]
- Cao, J.; Liu, X.C.; Wang, Y.; Li, Q. Accessibility impacts of China’s high-speed rail network. J. Transp. Geogr. 2013, 28, 12–21. [Google Scholar] [CrossRef]
- Gössling, S. Urban transport justice. J. Transp. Geogr. 2016, 54, 1–9. [Google Scholar] [CrossRef]
- Xia, J.; Nesbitt, J.; Daley, R.; Najnin, A.; Litman, T.; Tiwari, S.P. A multi-dimensional view of transport-related social exclusion: A comparative study of Greater Perth and Sydney. Transp. Res. Part A Policy Pract. 2016, 94, 205–221. [Google Scholar] [CrossRef]
- Martens, K.; Golub, A.; Robinson, G. A justice-theoretic approach to the distribution of transportation benefits: Implications for transportation planning practice in the United States. Transp. Res. Part A 2012, 46, 684–695. [Google Scholar] [CrossRef] [Green Version]
- Repetti, J.R.; Mcdaniel, P.R. Horizontal and Vertical Equity: The Musgrave/Kaplow Exchange. Fla. Tax Rev. 1993, 1, 607–622. [Google Scholar]
- Welch, T.F. Equity in transport: The distribution of transit access and connectivity among affordable housing units. Transp. Policy 2013, 30, 283–293. [Google Scholar] [CrossRef]
- Culyer, A.J. Equity-some theory and its policy implications. J. Med. Ethics 2001, 27, 275–283. [Google Scholar] [CrossRef] [PubMed]
- Jaramillo, C.; Lizárraga, C.; Grindlay, A.L. Spatial disparity in transport social needs and public transport provision in Santiago de Cali (Colombia). J. Transp. Geogr. 2012, 24, 340–357. [Google Scholar] [CrossRef]
- Ortega, E.; López, E.; Monzón, A. Territorial cohesion impacts of high-speed rail at different planning levels. J. Transp. Geogr. 2012, 24, 130–141. [Google Scholar] [CrossRef]
- Martín, J.C.; Gutiérrez, J.; Román, C. Data Envelopment Analysis (DEA) Index to Measure the Accessibility Impacts of New Infrastructure Investments: The Case of the High-speed Train Corridor Madrid-Barcelona-French Border. Reg. Stud. 2004, 38, 697–712. [Google Scholar] [CrossRef]
- Sánchez-Cantalejo, C.; Ocana-Riola, R.; Fernández-Ajuria, A. Deprivation index for small areas in Spain. Soc. Indic. Res. 2008, 89, 259–273. [Google Scholar] [CrossRef]
- El-Geneidy, A.; Levinson, D.; Diab, E.; Boisjoly, G.; Verbich, D.; Loong, C. The cost of equity: Assessing transit accessibility and social disparity using total travel cost. Transp. Res. Part A Policy Pract. 2016, 91, 302–316. [Google Scholar] [CrossRef]
- Deng, H.; Li, Y.; Li, W.; Yu, Y. Urban transport social needs in China: Quantification with central government transit grant. Transp. Policy 2016, 51, 126–139. [Google Scholar] [CrossRef]
- Ricciardi, A.M.; Xia, J.C.; Currie, G. Exploring public transport equity between separate disadvantaged cohorts: A case study in Perth, Australia. J. Transp. Geogr. 2015, 43, 111–122. [Google Scholar] [CrossRef]
- Foth, N.; Manaugh, K.; El-Geneidy, A.M. Towards equitable transit: Examining transit accessibility and social need in Toronto, Canada, 1996–2006. J. Transp. Geogr. 2013, 29, 1–10. [Google Scholar] [CrossRef]
- Jiang, H.; Zhang, W.; Qi, Y.; Jiang, J. The land accessibility influenced by China’s high-speed rail network and travel cost. Geogr. Res. 2015, 34, 1015–1028. [Google Scholar] [CrossRef]
Figure 1.
Transportation network in China from 2008 to 2015.

Figure 2.
GAT spatial distribution.

Figure 3.
Spatial distribution map of economic potential.

Figure 4.
Social indicator deciles, 2008 and 2015.

Figure 5.
Accessibility by social needs indicator deciles.


Table 1.
Social demand indicator system.
| Objective | Criteria | Indicator | Description |
|---|---|---|---|
| Social demand indicators | Population | X1 Population density (people/km2) | Proportion of population accounting for secondary and tertiary industries |
| X2 Population different age groups | Population age (<15 years old, 15–64 years old, >64 years old) | ||
| X3 Floating population | Person whose residence is inconsistent with the residence registration | ||
| X4 Registered unemployed population in cities and towns | |||
| X5 Student population | Ordinary high school students, ordinary middle school students, primary school students | ||
| Economy | X6 Regional GDP per capita (10,000 yuan/capita) | Total urban GDP/Total population | |
| X7% of secondary, tertiary industries (%) | Secondary, tertiary industry GDP/Total GDP | ||
| X8 Saving per capita (%) | The total sales of consumer goods/Total population | ||
| Society | X9 Investment in fixed assets accounted for GDP (%) | Investment in fixed assets/total GDP | |
| X10 Proportion of non-agricultural workforce | Non-agricultural workforce/Total workforce | ||
| X11 Proportion of education and science account for local finance expenditure (%) | Expenditure on education and science/Local fiscal expenditure | ||
| X12 Bus per 10,000 people (bus/10,000 people) | Number of bus/Total population | ||
| X13 Number of medical institutions (institution/10,000) | Number of hospital beds/Total population |
Table 2.
Data sources and description.
| Data Sources | Description |
|---|---|
| National Geographic Information Bureau | Ordinary railway, express highway/national highway/provincial highway/country road data |
| “The mid to long-term railway network development plan” (2030) | 2008–2015, Data from cities with high-speed railway and Railway stations by geographical registration http://crh.gaotie.cn/ http://www.360doc.com/content/11/0218/23/4665399_94209414.shtml |
| “The mid to long term development plan of China’s railway” (2008–2020) | |
| “China Statistical Yearbook” (2008 and 2016) | Social indicator based on different age groups and socio-economic factors. |
Table 3.
Accessibility CV.
| Category | GAT | PA | ||||||||
|---|---|---|---|---|---|---|---|---|---|---|
| 2008 | CVGAT | 2015 | CVGAT | CV Change | 2008 | CVPA | 2015 | CVPA | CV Change | |
| All cities | 1368.76 | 0.422 | 553.92 | 0.566 | 0.34 | 180.94 | 0.312 | 395.56 | 0.363 | 0.16 |
| Cities with stations | 1283.55 | 0.291 | 467.94 | 0.322 | 0.11 | 194.80 | 0.276 | 453.44 | 0.270 | −0.02 |
| Cities without stations | 1402.17 | 0.455 | 587.63 | 0.585 | 0.29 | 177.03 | 0.330 | 382.15 | 0.389 | 0.18 |
Table 4.
Principal component eigenvalue and variance contribution rate.
| Principal Component | Eigenvalue | Variance Contribution Rate % | Accumulative Variance Contribution Rate |
|---|---|---|---|
| 1 | 7.492 | 49.945 | 49.945 |
| 2 | 3.476 | 23.173 | 73.118 |
| 3 | 1.141 | 7.604 | 80.722 |
Table 5.
Standardized accessibility index and social indicator.
| Year | Maximum | Minimum | Range | Median | |
|---|---|---|---|---|---|
| Social indicator | 2008 | 13.92 | −5.56 | 19.48 | −0.63 |
| 2015 | 17.10 | −5.82 | 22.92 | −0.81 | |
| GAT | 2008 | 4.47 | −1.08 | 5.55 | −0.20 |
| 2015 | 5.27 | −0.91 | 6.18 | −0.34 | |
| PA | 2008 | 3.78 | −2.08 | 5.86 | −0.08 |
| 2015 | 2.83 | −1.85 | 4.68 | 0.04 |
© 2018 by the authors. Licensee MDPI, Basel, Switzerland. This article is an open access article distributed under the terms and conditions of the Creative Commons Attribution (CC BY) license (http://creativecommons.org/licenses/by/4.0/).
Share and Cite
MDPI and ACS Style
Yang, J.; Guo, A.; Li, X.; Huang, T. Study of the Impact of a High-Speed Railway Opening on China’s Accessibility Pattern and Spatial Equality. Sustainability 2018, 10, 2943. https://0-doi-org.brum.beds.ac.uk/10.3390/su10082943
AMA Style
Yang J, Guo A, Li X, Huang T. Study of the Impact of a High-Speed Railway Opening on China’s Accessibility Pattern and Spatial Equality. Sustainability. 2018; 10(8):2943. https://0-doi-org.brum.beds.ac.uk/10.3390/su10082943
Chicago/Turabian StyleYang, Jun, Andong Guo, Xueming Li, and Tai Huang. 2018. "Study of the Impact of a High-Speed Railway Opening on China’s Accessibility Pattern and Spatial Equality" Sustainability 10, no. 8: 2943. https://0-doi-org.brum.beds.ac.uk/10.3390/su10082943
Note that from the first issue of 2016, this journal uses article numbers instead of page numbers. See further details here.