Measuring Knowledge Diffusion in Water Resources Research and Development: The Case of Korea

1
Department of Energy Systems Engineering, Seoul National University, 1 Gwanak-ro, Gwanak-gu, Seoul 08826, Korea
2
Future Policy Division, Korea Institute of Geoscience and Mineral Resources, 124 Gwahang-no, Yuseong-gu, Daejeon 34132, Korea
*
Author to whom correspondence should be addressed.
Sustainability 2018, 10(8), 2944; https://0-doi-org.brum.beds.ac.uk/10.3390/su10082944
Submission received: 23 July 2018
/
Revised: 16 August 2018
/
Accepted: 17 August 2018
/
Published: 19 August 2018
Abstract
:Technological knowledge created through government R&D investment not only contributes to technology and market expansion, but is also a major factor in evaluating a nation’s innovation capacity. As government budgets are limited, establishing an effective investment strategy is important. The purpose of this paper is to suggest R&D investment priorities in terms of the centrality of knowledge diffusion—which technology field is targeted in knowledge diffusion—and rapidity of knowledge diffusion—how quickly technological knowledge diffuses. The analysis focused on a water resources R&D program led by the Korean government. The centrality and rapidity of knowledge diffusion were analyzed using network analysis and patent citation information, respectively. By showing that results differ depending on whether centrality or rapidity are used to rank investments, the findings suggest the need for multiple analyses when establishing an R&D investment strategy. Moreover, this study expanded analysis of knowledge diffusion to the second diffusion, and confirmed that, when the rapidity of knowledge diffusion through the second diffusion is considered, priorities for government R&D investments change. The results have useful implications for R&D investment by identifying investment priorities in the water resources sector, and changes in those priorities when mid- to long-term knowledge diffusion is considered.
1. Introduction
In the development of science and technology, market failures are often expected due to positive externalities and uncertainty; as a result, investments in science and technology in public sectors are usually government driven. Government-led R&D investment affects national economic growth by improving the nation’s technological strength. Technology development can be expected to have direct effects, such as reducing production costs, increasing productivity [1], and creating new jobs, but attention should also be paid to knowledge diffusion, an indirect effect. Mamuneas [2], Park [3], and Ruegg and Thomas [4] argued that, even though the government does not make direct investments specifically to increase productivity in the private sector, it indirectly contributes to expanding technology and market opportunities by creating technological knowledge that spreads throughout the economy. In today’s knowledge-based society, knowledge is one of the major factors used to evaluate national competitiveness and the innovation capacity of institutions or a nation [5]; therefore, sharing and diffusing technological knowledge generated by investment is important [6]. Because government R&D budget is bound to be limited, it is important to understand the diffusion path of the knowledge it generates to maximize its effect.
Since the mid-1990s, there have been many studies on knowledge diffusion [7]; these have mainly focused on analyzing the creation and diffusion of technological knowledge from the viewpoint of companies. This is likely because most technology innovation through R&D activities in the past was performed by companies. However, institutions other than companies, such as universities, research institutes, and governments, have become innovators as the knowledge-based society has developed. Moreover, the boundaries of innovation have become blurred, increasing the importance of areas of convergence, and making it necessary to deal with both direct and indirect knowledge diffusion. However, the study of knowledge diffusion from the public sector, where governments have heavily invested, has been limited.
Some R&D investments are expected to perform in the short-term to immediately be reflected in policy, but most R&D investments are expected to achieve mid- to long-term development. These are generally large-scale investments and thus a mid- to long-term analysis is required to evaluate their knowledge diffusion. In recent years, the convergence of technologies and industries has been encouraged and accelerated, requiring expansion and more comprehensive analysis of the scope of knowledge diffusion. While it is important to analyze the technological areas being affected by knowledge diffusion, it is also important to consider the speed of knowledge diffusion. In other words, R&D investment priorities should be determined based the nature of diffusion, focusing on its characteristics: the centrality of knowledge diffusion—which technology is targeted in knowledge diffusion—and the rapidity of knowledge diffusion—how quickly the technological knowledge diffuses. However, all previous studies analyzing knowledge diffusion were merely primary knowledge analyses. The performance of R&D investment needs to be comprehensively examined, including analyzing secondary knowledge diffusion triggered by the diffusion of primary knowledge, which is the motivation for this study.
Korea is among the countries conducting government-led R&D investment in the basic and public technology development sectors. The purpose of this study was to analyze knowledge diffusion from the water resources R&D program led by the Korean government, with a focus on the centrality and rapidity of knowledge diffusion. Since the late 1990s, large-scale investments have been made in Korea to develop science and technology. During this time, demand has increased for solutions to the national water shortage crisis derived from development of water resources technology that considers the country’s geographical and economic situations, and a large-scale R&D program has been promoted. Although this is the first R&D program in the water resources field, there has been no analysis or evaluation of the performance or effects of the program. By conducting mid- to long-term analysis, this paper suggests: (i) prioritization of R&D investment in the water resources field; and (ii) confirmation of whether investment priorities are changing.
The diffusion of technological knowledge is not easy to measure because its characteristics are unobservable [8]. Embodied knowledge flows through economic transactions in the form of intermediate goods or capital goods. An input–output analysis is widely used for this kind of knowledge diffusion. However, because disembodied knowledge is passed through an informal route, it is difficult to measure its diffusion. Scherer [9] approached this problem using a technology flow matrix, while Jaffe [10] proposed an approach that used technological similarity by measuring technology distance between industries. Mainstream measurement of disembodied knowledge diffusion uses patent and citation data as proxy variables for technology innovation, and research using a network theory, called patent citation network analysis, has recently been increasing [11]. This approach addresses the limitation of patent analysis, which is that it cannot deal with relational properties between analytic entities. In addition, it is useful for identifying the characteristics of the entire technological diffusion network and the location of technologies in the network. Because of this advantage, this study applies network analysis using patent citation information to measure knowledge diffusion.
The remainder of this paper proceeds as follows. Section 2 reviews previous studies that have measured knowledge diffusion. Section 3 explains the methodology of the study, and includes an introduction to the background of the Sustainable Water Resources Research Program (SWRRP) in Korea, the subject of the study. Section 4 contains the results of the empirical analysis and their discussion. Finally, Section 5 presents the main conclusions and implications of the study.
2. Literature Review
Research on knowledge diffusion has been conducted in earnest since the late 1990s. Various subjects have been studied, such as the form of knowledge sharing and the factors, scope, and impact of knowledge diffusion. Numerous studies, including Appleyard [12], Jaffe and Trajtenberg [13], Branstetter [14], Kaiser [15], Todo and Miyamoto [16], Hájek and Stejskal [17], and Zhou et al. [18], have addressed knowledge diffusion in private sectors. However, there has been little research into the spillover diffusion of knowledge generated by government investment in public sectors. In particular, there have been few cases dealing with knowledge diffusion of government-led R&D activities, even though many countries that are pursuing an economic growth model through technology innovation are investing substantial resources into those activities. Park [3], Park and Yoon [19], Feldman and Kelley [20], and Ruegg and Thomas [4] are representative examples of previous research on knowledge diffusion of government R&D.
Park [3] attempted to quantify knowledge diffusion of R&D investment in the public and private sectors of production and research activities for ten Organization for Economic Cooperation and Development (OECD) countries. Park [3] showed that, while research in the private sector is relatively more important for productivity improvement in the private sector than research in the public sector, the public sector has indirectly contributed to production improvements by generating cross-national spillover effects. Although countries invest in large scale R&D programs to overcome market failures and promote technology convergence, Park and Yoon [19] suggested efficient use of those resources should be ensured by conducting a technological and economic evaluation before investments are made and budgets should be allocated based on that evaluation. They conducted a network analysis of technological knowledge flow using citation data of Korean national R&D patent applications between 2008 and 2011 and identified the direction for investments in technology development. Feldman and Kelley [20] analyzed the impact of government R&D subsidies on knowledge spillovers in the Advance Technology Program, which was a large-scale R&D program conducted by the U.S. government. Ruegg and Thomas [4] evaluated the paths of knowledge generation and diffusion from the Wind Energy Program, which was funded by the U.S. Department of Energy. The authors used a historical tracing framework and multiple techniques to prove that government-funded R&D support in wind energy was linked to innovation in that industrial sector.
Most research on knowledge diffusion of government R&D activities has been focused on the impact of government investment on knowledge diffusion and the effect of investments in the public sector. However, few studies have analyzed the path of knowledge diffusion. As shown by Park and Yoon [19], a more active discussion of the effective allocation of R&D in the public sector is needed based on the knowledge diffusion. A limitation of existing research is that only the first diffusion path has been analyzed. The recent convergence of technology and industry has encouraged and accelerated creation of new industries and new technologies, so it is necessary to measure knowledge diffusion more comprehensively to broaden the scope of analysis. In other words, it is necessary to evaluate the full impact of R&D investment by also analyzing the secondary knowledge diffusion path that is triggered by primary knowledge diffusion.
3. Materials and Methods
3.1. Background of the SWRRP in Korea
Korea has undergone rapid economic growth, but faced a serious water crisis in the 1990s [21]. The Korean government implemented various policies to overcome the water crisis problems, such as insufficient water quantity and deterioration of water quality, but these policies were not successfully promoted. Further, the research and development attempted by government ministries was only sporadic, with short-term projects to develop minimum guidelines and generate information needed for the work of specific ministries [22]. Projects related to water quantity and quality, flood control, and conservation were managed through several ministries because a dedicated integrated water management organization did not exist.
At that time, the level of water technology in Korea was very low, and advanced technologies came from abroad. However, introducing water technology developed in other countries has limitations: it creates economic costs, and does not consider the geographical characteristics of Korea. As demand for development of water technologies that consider Korea’s geographical and economic situation increased among researchers, the Korean government had plans to develop comprehensive and systematic water resource technologies to overcome its national water shortage crisis [22]. At a time when the Ministry of Environment managed water quality and the Ministry of Land, Transport and Maritime Affairs controlled water quantity, the Ministry of Education and Science Technology, which controlled Korean science technology and R&D, promoted the SWRRP to comprehensively manage water quality and quantity. Therefore, this study uses the SWRRP during its implementation as a representative Korean R&D program in the water resources area.
The aim of the SWRRP was to minimize water shortages and improve quality of life by developing water technologies and stabilizing water supplies. The program design included projects in four major fields of research: technology to integrate water resources management, secure surface water, secure groundwater, and secure alternative water resources. Technology to integrate water resources management is focused on integrating and managing the quantity and quality of both surface water and groundwater; this approach differs from traditional management, which addresses water quantity and quality separately. Technology to secure surface water, which refers to technologies for investigating, interpreting, and developing water resources, is fundamental for securing and managing water resources. Technology to secure groundwater provides the ability to access groundwater resources in addition to surface water. Initially, research was conducted to develop technologies related to diagnosing, evaluating, exploring, and managing groundwater. Technology to secure alternative water resources includes technologies for securing water resources not currently used or not typically regarded as useful (e.g., technologies related to water reuse, rainwater storage and utilization, and highly efficient desalination). This program was implemented for ten years from 2001 to 2010, with a total budget of 1264 billion KRW, and 545 institutes (139 industries, 303 academicians, and 103 research institutes) participating [23].
3.2. Research Flow
3.2.1. Overview of Research Flow
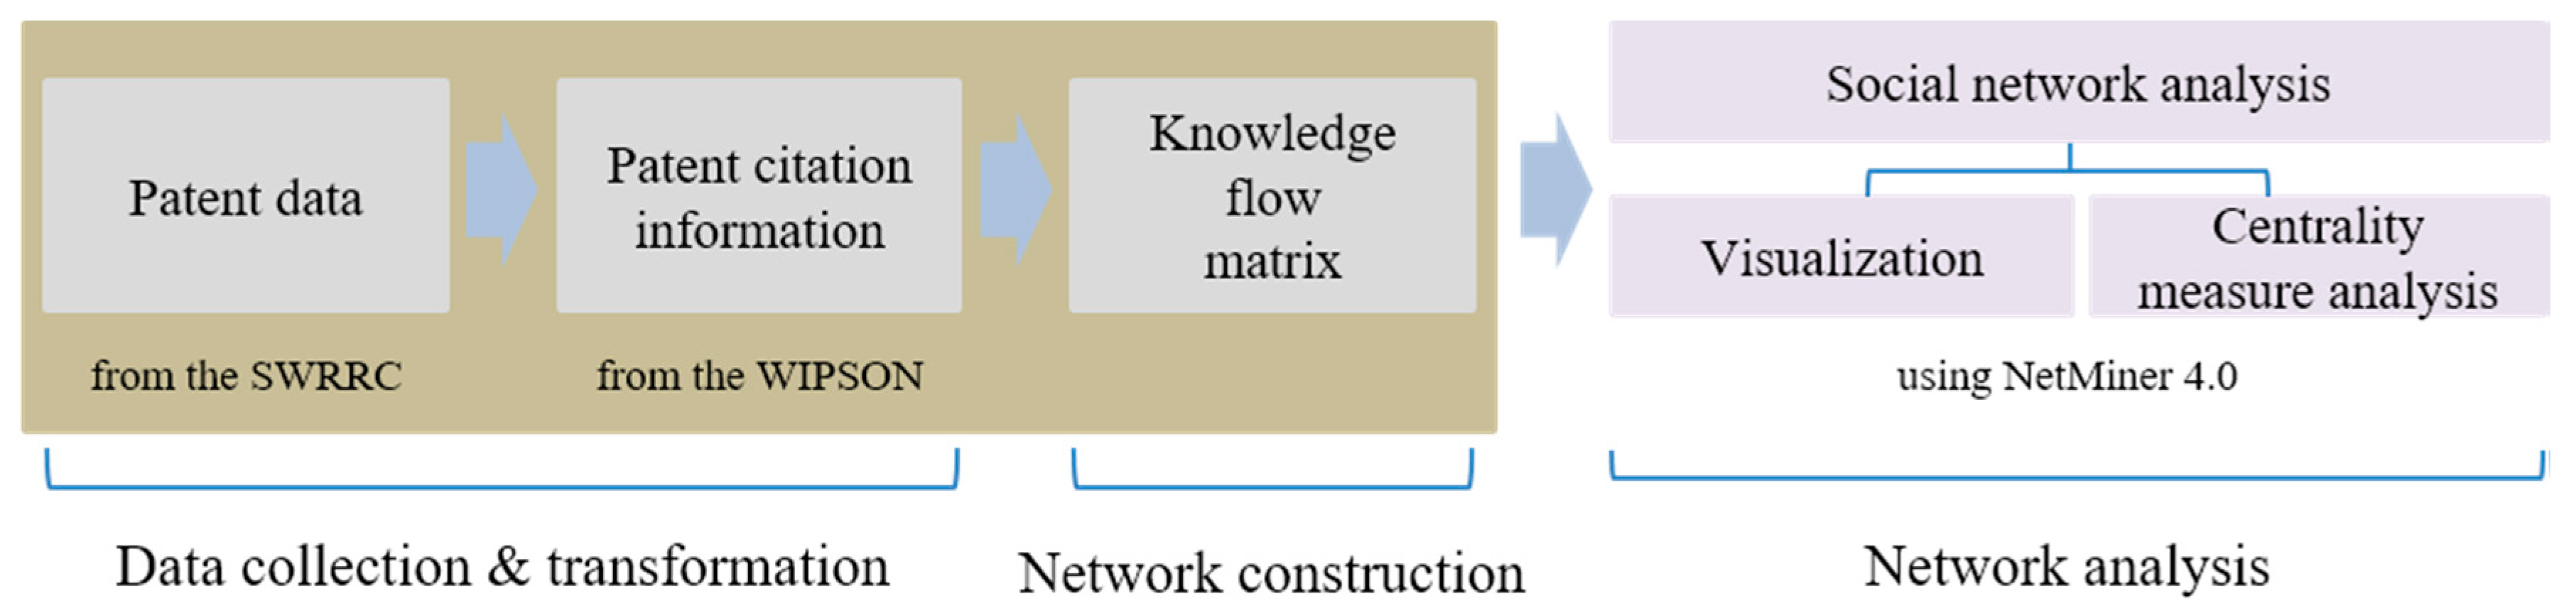
This study conducted three analyses. The first analysis was of the flow of direct knowledge diffusion from the SWRRP investment, while the second examined which research entities contributed to the generation and diffusion of technological knowledge from the SWRRP. Finally, indirect knowledge diffusion in the long-term was examined. Three steps were used to accomplish this: collection and transformation of data, network construction, and network analysis. Figure 1 shows the flow of the analysis.
3.2.2. Step I. Patent Data Collection and Transformation
Patent data used for the analysis were obtained from the Sustainable Water Resources Research Center, which managed SWRRP’s projects and evaluated its performance. Among the total of 222 domestic and international patents issued between 20 August 2001 and 31 March 2011, the research period for SWRRP activities, 198 patents that provided citation information were included in the analysis. As seven years have passed since the SWRRP was completed, the international patent classification (IPC) resulting from the program can be considered to have been diffused in that field and other fields, and sufficient time has passed to utilize forward citation information. Citation information was collected through the WIPSON (http://www.wipson.com) service provided through WIPS cooperation.
3.2.3. Step II. Constructing the Network
In the citation-based approach, the relationship between citing and cited patents implies that knowledge flow exists [19]. That is, if Patent B cites Patent A, then technological knowledge included in Patent A flows to Patent B [24,25]. Many previous studies on knowledge diffusion have been conducted based on this assumption, and prior to establishing a network of patent citations, this study also assumed that the relationship between cited and citing patents indicates knowledge diffusion. A one-mode matrix from technology to technology was constructed, allocating IPC groups generated through the SWRRP to rows and citing groups to columns. Self-citation occurring within individual research institutions that participated in the SWRRP were also included, as self-citation can transfer a significant amount of tacit knowledge or know-how within the same research institution [26]. Self-citation is often used as a proxy for knowledge accumulation or knowledge strength, but this study regarded it as a phenomenon that occurs as part of knowledge diffusion. In addition, knowledge is assumed to have diffused from one technology field to more than two technology fields if the IPC group of cited patents is one and those of the citing patents is more than two. This process was used to construct a 42 × 42 one-mode matrix of technological knowledge diffusion.
3.2.4. Step III. Analyzing the Network
The network analysis among technologies was conducted using the knowledge diffusion matrix constructed in Step II. The IPCs of citing and cited patents are expressed in the form of nodes and the flow of knowledge is expressed in the form of links. This study derived and applied the out-degree centrality of social network analysis to focus the analysis on the release of knowledge. As the study deals with all patent data from the SWRRP, which is population data, patent data were not normalized. However, data were normalized for additional analysis using the value of out-degree centrality first derived when it was necessary to remove any effect that might be caused by the different sizes of the networks.
Two important factors in social network analysis are visualization and measurement [27]. The use of visual images has the advantage of allowing the whole network to be examined at a glance, but it begins to have drawbacks when the number of observed nodes increases. On the other hand, measurement analysis makes it difficult to see the relationship of each node in the network at a glance but makes it possible to compare quantitative measurements of the relationships [28]. In this study, the entire network is first visualized, and then a numerical analysis is performed based on the values of degree centrality.
3.3. Patent Citation Network Analysis
This study used patent and citation information to analyze the path of knowledge diffusion. A patent grants the exclusive right to a commercial invention to a specific person, and includes data ranging from information about the inventor and the assignee to a large amount of technical content [24]. When a new patent is applied for, a patent citation includes information embodied in existing patents and is similar to references cited in scientific publications. Patent citations contain the art from the cited patent, which can be useful for understanding the technology’s development process [29]. In addition, it can provide information about technological knowledge flow in a specific technical sector [29]. Thus, patent and citation information are proxy variables that indicate the usefulness of technological knowledge generated through R&D activities for other development activities [13,30], and is widely used in research on knowledge diffusion [31,32,33].
However, patent citation analysis has limitations because it considers only cited and citing information and does not consider internal relationships among patents [34]. As the flow of knowledge has characteristics similar to transferring information between agents that construct relationships, it is necessary to consider this network element. Typical statistical methods deal with an actor’s attribute data, but do not deal with relational data between actors. To overcome this limitation, much research on knowledge diffusion, such as Shin et al. [35], Hsueh and Wang [34], Li et al. [36], and Choe et al. [31], has adopted patent citation network analysis, a method that combines patent citation information and social network analysis [31]. Social network analysis is the process of constructing a network of the relationships or interactions among people, organizations, and things, and then analyzing the structures quantitatively; this analysis can clearly define and structure the relationships among agents in a network [37]. Patent citation network analysis is useful not only to analyze how often specific technological knowledge is quoted, but also to confirm the direction of the flow of technological knowledge.
Degree Centrality
Centrality is one of the concepts studied in network research, and is a measure of the relative importance of a vertex or node within a network. This has great potential for evaluating research because it is a good indicator of the knowledge flow among actors [11]. Centrality can be divided into various performance measures depending on the calculation method, and, of these measures, this study’s empirical analysis is based on degree centrality.
Degree centrality is an indicator of the degree to which a node is centrally located in a network and measures how many times the node is connected to other nodes in the network [37]. Previous studies on knowledge diffusion (e.g., [18,38]), have used this indicator to measure the relationships among nodes. High degree centrality of any specific node means that the node plays an important role in the network, or can strongly affect other nodes [39]. Following the definition of Freeman [40], degree centrality can be formulated as in Equation (1):
where xij is an adjacency matrix that indicates the connection from node i to node j. When node i is connected to node j, it equals one; otherwise it is zero. N is the total number of nodes in the network. In directional networks, such as a patent citation network, degree centrality is divided into in-degree and out-degree centrality depending on the direction of the connection between the two nodes. In-degree centrality only considers connections coming from other nodes, and out-degree centrality considers connections going to other nodes. For node i, which is the node being observed, in-degree and out-degree centrality are defined by Equations (2) and (3), respectively.
The size of the network can affect degree centrality, so it is necessary to eliminate these effects [40], which can be done by normalizing the degree centrality of a node. Normalized degree centrality can be formulated as in Equation (4):
In a patent citation network, the in-degree centrality of Patent A is expressed as the number of patents cited by Patent A, and the out-degree centrality is expressed as the number of patents citing Patent A. This study’s analysis is based on the out-degree centrality of nodes to examine technology-centered contributions to the release of knowledge. NetMiner 4.0 was used for the analysis.
4. Results and Discussion
4.1. Basic Statistics
The 198 patents in this analysis are classified into 28 second-level classes of IPC. Because some patents have multiple IPCs, a total of 239 cases were considered for the final analysis. Table 1 shows the number of patents corresponding to 28 IPCs and the number of patents utilized. Patents in 27 IPC fields, excluding E04 (Building), were utilized; out of the total 239 cases, 168 or about 70% of the total were utilized.
As a result of examining the patents citing the 239 cases, it was confirmed that C02, G01, B01, G06, and E03 comprised more than 10% of the total 637 cases. The IPCs of the patents generated through the SWRRP and those of the patents citing the SWRRP patents are the same, so technological diffusion within the same field can be confirmed. However, there are differences in the IPCs based on an examination of the average number of citing patents. As shown in Table 2, C02, which was the most cited field, affected an average of 4.6 patents by extending 34 patents to 157 cases. On the other hand, B01 affected an average of 5.4 patents by extending 16 patents to 86 cases. The average number of citing patents ranges from 2.7 to 5.4 according to IPC fields; it can be seen that the technological impact is different for each IPC.
Table 3 shows the differences in the use of patents according to the type of patent applicants. Of the patents created in research institutes, academia, and industry, 74.6%, 72.7%, and 68.1% were utilized, respectively. However, considering the average number of citations per patent, 4.1, the largest number were developed by industry. This result can be related to the characteristics of an industry. Because the purpose of an industry is to seek a profit from all its activities, even if the research is supported by a governmental budget, industries tend to be more practical in conducting their research and development since those activities are directly connected to the company’s profit.
4.2. Network Visualization
Figure 2 shows the direction and magnitude of patent diffusion by visualizing the form of the network based on degree centrality, setting up IPCs as nodes. The size of nodes differ according to the value of degree centrality; a higher value indicates that the IPC class is at a more central location in the network. The size of nodes C02 (treatment of water, waste water, sewage, or sludge), E03 (water supply; sewerage), G01 (measuring; testing), and G06 (computing; calculating; counting) were relatively large. In other words, C02, E03, G01, and G06 technologies contribute more to knowledge diffusion than other technologies. Much of the knowledge of C02, E03, G01, and G06 were diffused to B01, C02, G06, and G01, respectively, with the exception of citing to their own IPC field. On the other hand, C12 (biochemistry; beer; spirits; wine; vinegar; microbiology; enzymology; mutation or genetic engineering) has no connection with other nodes, indicating that citation relationships exist only in their own technology areas.
4.3. Centrality Measure Analysis among Industry, Academia, and Research Institutes
To evaluate technological knowledge diffusion according to the type of research institution, a citation network for each type of institution was constructed and the average out-degree centrality was calculated. Table 4 shows the average value of centrality in the networks of industry, academia, and research institutes. The averages of centrality for industry, academia, and research institutes were measured as 0.279, 0.238, and 0.159, respectively, ranking the contributions to knowledge diffusion of industry, academia, and research institutes in descending order.
Table 5 shows the number of IPC classes corresponding to range of centrality. In the entire network, at less than 0.2, over 73% of the classes had very low centrality. This can be interpreted as 73% or more of the classes having very little or no contribution to knowledge diffusion. On the other hand, only 20% of the IPC classes in each network were included in the centrality range above 0.6. As noted earlier, considering that the value of degree centrality generally ranges from 0 to 1, and the importance of the node in a network increases as the value of degree centrality increases, less than 20% or less than 10% of IPC classes can be regarded as contributing to medium-term diffusion. As a result of being a technology field with a value of 0.6 or more in each network, the values of C02, E03, G01, and G06 are greater than those of other technologies in the entire network, as confirmed by the visualization. Patent technologies with a value of 0.6 or more appeared most often in the industry network. This means that the technological knowledge of the SWRRP has diffused to more areas through industrial activities than through other networks. The technological knowledge of B09 (disposal of solid waste, reclamation of contaminated soil), C25 (electrolytic or electrophoretic processes, apparatus thereof), and G08 (signaling) was diffused only through industries. In contrast, diffusion of G06 only occurred in the academia network, while knowledge diffused by research institutes was limited to E03 and G01.
The concept of a technology cycle time (TCT) index was used for the analysis to compare the time required for technological citation by type of research institution. TCT is a measure used to estimate technological progress, and is computed as the difference between the citing patent’s application year and the application years of the cited patents [5]. The TCT between the application year of the SWRRP patent and those of citing patents was calculated and the result was assumed to be the time taken for knowledge diffusion. The results show that the time taken to diffuse technological knowledge averaged 4.4 years overall. The analyses of the individual networks showed that the average citation times for industry, academia, and research institutes were 4.6, 4.4, and 4.0 years, respectively. Therefore, the citation time for research institutes was the fastest.
According to previous studies that adopted the TCT approach, the TCT value in a rapidly developing technology sector or country is smaller, and, conversely, in a mature technology sector or in advanced countries, it is larger [32,41,42]. TCT values of 4–5 years are considered rapid, and technology fields such as electronics areas generally have values in this range. On the other hand, TCT values of more than 15 years are seen in mechanical areas, while values in slower technology areas are also generally in this range [32]. Considering these value ranges, Korea’s water resources related technology has progressed rapidly during the government’s investment in technology development, which also suggests rapid development of technology through the implementation of SWRRP.
4.4. Analysis of Long-Term Knowledge Diffusion in Water Resource Technology
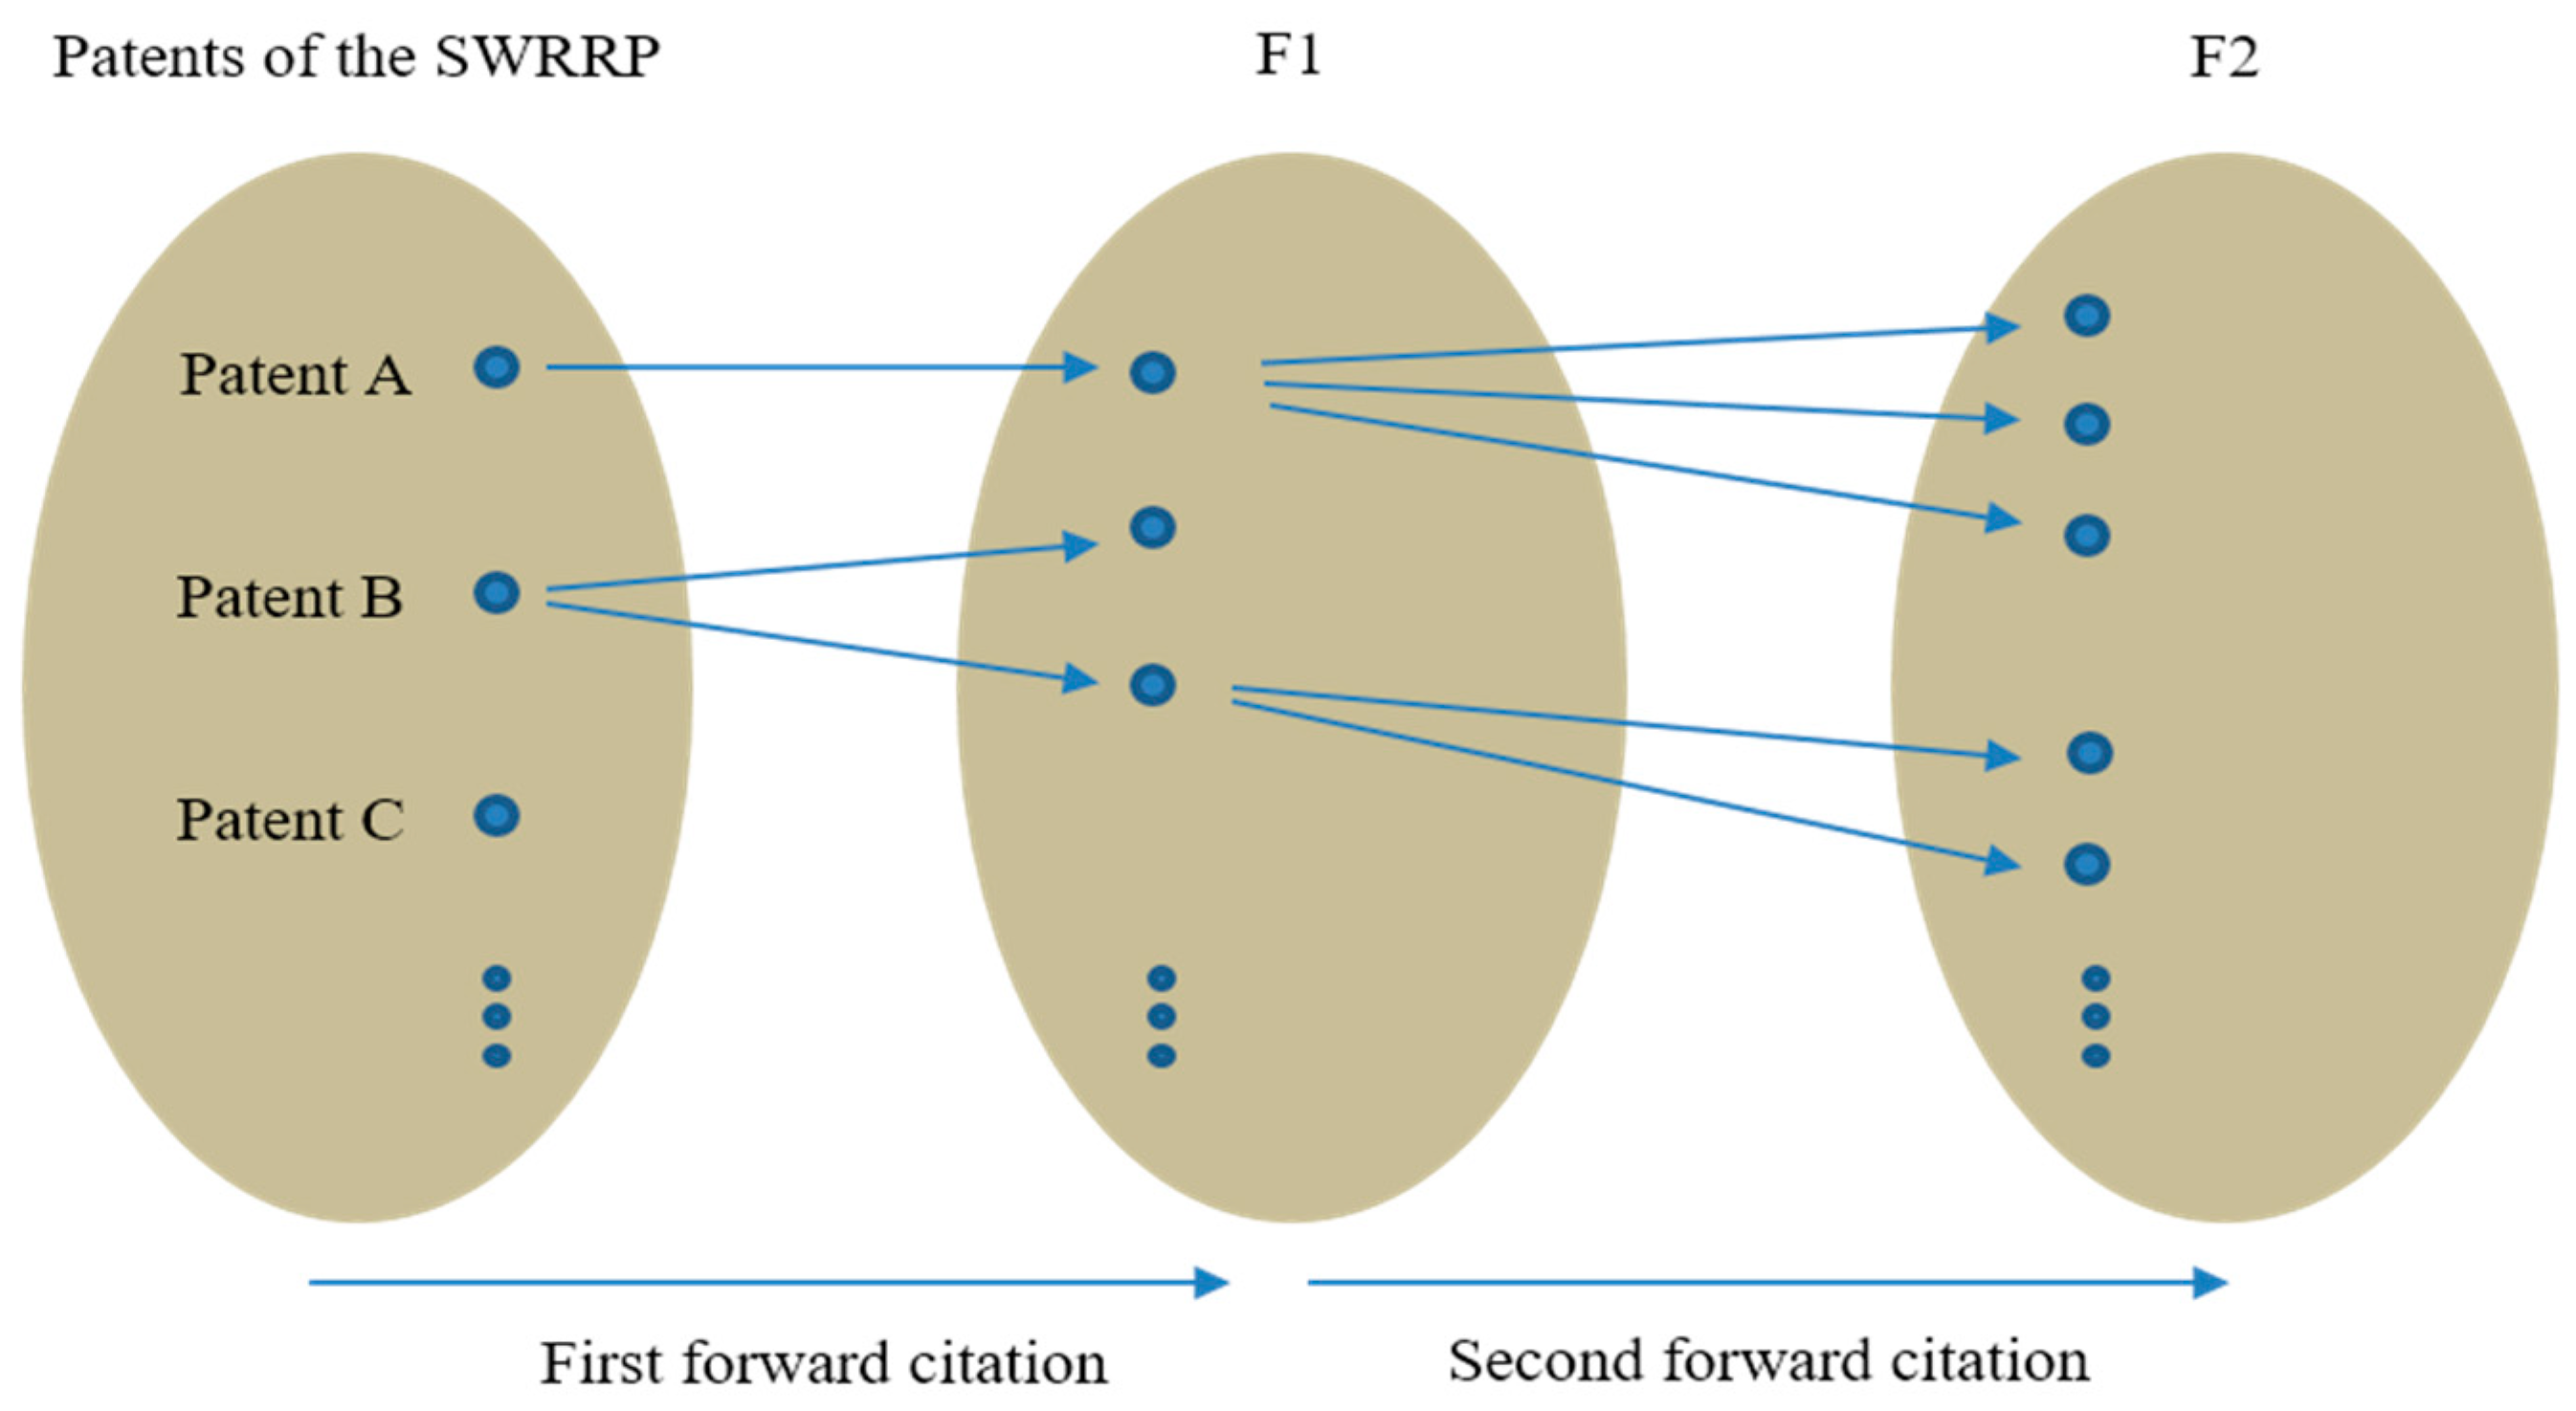
To consider mid- to long-term knowledge diffusion, the second knowledge diffusion network was constructed in the same way as the SWRRP patent technology and the patent citation network. The network constructed in previous steps is defined as the first diffusion network, and the long-term network is defined as the second diffusion network. Figure 3 illustrates this distinction.
Table 6 compares the values of out-degree centrality between the first and second diffusion networks. The average values of out-degree centrality for the first and second networks were estimated at 0.223 and 0.288, respectively, showing that release of technological knowledge in the second diffusion network was relatively more rapid than in the first diffusion network. In addition, the number of IPC classes that contributed to knowledge diffusion were 26 and 29 in the first and second diffusion networks, respectively, indicating that release of technological knowledge from more IPC classes occurred in the second diffusion network.
IPC classes that contributed to the release of knowledge in the first diffusion network but not in the second were A01 (agriculture; forestry; animal husbandry, hunting, trapping, fishing), B08 (cleaning), B26 (hand cutting tools; cutting; severing), B82 (nanotechnology), C09 (dyes; paints; polishes; natural resins; adhesives; compositions not otherwise provided for; applications of materials not otherwise provided for), F04 (positive-displacement machines for liquids; pumps for liquids or elastic fluids), and G09 (educating; cryptography; display; advertising; seals). In contrast, IPC classes such as B02 (crushing, pulverizing, or disintegrating; preparatory treatment of grain for milling), B05 (spraying or atomizing in general; applying liquids or other fluent materials to surfaces, in general), B21 (mechanical metal-working without essentially removing material; punching metal), C01 (inorganic chemistry), C04 (cements; concrete; artificial stone; ceramics; refractories), C12 (biochemistry; beer; spirits; wine; vinegar; microbiology; enzymology; mutation or genetic engineering), E04 (building), F17 (storing or distributing gases or liquids), G05 (controlling; regulating), and H01 (basic electric elements) did not contribute to knowledge diffusion in the first diffusion network but were found in the second diffusion network. Although the frequency of these IPC classes is not high, indicating that they did not comprise a large share of the release of technological knowledge, this result shows that indirect diffusion of SWRRP technology has spilled over to other technology areas.
Table 7 summarizes the citation times for the 23 IPCs that are common between the first and second diffusion networks. Times for technological citation of B08, A63, A61, C12, A01, C25, B29, and C09 were all found to be within three years and their diffusion was relatively faster than other technologies in the first diffusion network. Of these, the times for citation of B08, A63, A61, A01, C25, and B29 were also within three years in the second diffusion network; those IPCs were diffused quickly in both the first and second diffusion networks. In particular, B08 was diffused very rapidly, with only three years required for both the first and second networks. On the other hand, among the IPCs above, the times for citation of C12 and C09 in the second diffusion network were slow. Therefore, when considering both the first and second diffusions, their ranks for knowledge diffusion dropped from 2 to 23 and from 7 to 22, respectively. Knowledge of 14 IPCs, including B08 and B09, were diffused more rapidly in the second diffusion network than in the first network, diffusing within three years. Meanwhile, E21, G06, B09, and B25, which at over three years had relatively slow citation times in the first diffusion network, were found to diffuse relatively rapidly overall when both the first and second diffusions were considered.
A quadratic assignment procedure (QAP) was applied to analyze the relationship between the first and second diffusion networks. QAP, proposed by Krackhardt [43], is a method for testing statistical significance using the concept of a permutation test. When analyzing relationships between two networks, this method considers interdependence included in the network data. In this analysis, it was necessary to normalize the degree centrality of each node to eliminate the effect of the two networks’ different sizes. The QAP correlation analysis between the two networks showed relatively high correlation (0.91, significant at the 5% level). In addition, a multiple regression QAP (MRQAP) with the first diffusion network’s centrality value as the independent variable and that of the second diffusion network as the dependent variable, was performed to examine whether the first diffusion network affected the second diffusion network. The results show that the first diffusion network has a statistically significant effect on the second diffusion network (regression coefficient 0.931, significant at the 1% level, R-squared 0.828).
5. Conclusions
This study conducted an empirical analysis of the centrality and rapidity of knowledge diffusion to derive R&D investment priorities based on a large-scale national R&D program in Korea in the water resources field. There are three conclusions and implications based on the study’s findings. First, it is recommended that water resources R&D investment be prioritized according to the order of the centrality of knowledge diffusion; that is, ranked from highest to lowest in order of their effects on other technological areas, as measured by degree centrality. For Korea, this ranking should be C02, E03, G01, and G06. On the other hand, based on the rapidity of knowledge diffusion to other technological areas found in the TCT analysis of patent citation information, R&D investment priorities should be recommended in the order of B08, C12, A63, A61, and A01. Thus, this study confirmed that R&D investment priorities vary depending on whether they are ranked according to centrality or rapidity of knowledge diffusion. In other words, R&D investment plans that focus on knowledge diffusion should be evaluated using more than one indicator, such as both centrality and rapidity of knowledge diffusion.
Second, the time required for citation of technological knowledge generated through the SWRRP was estimated to average 4.4 years, approximately the same speed as knowledge diffusion in electronics areas, which are known to have short citation times [32]. This study confirmed that the speed of knowledge diffusion varies by institutional network type. The average citation times for industry, academia, and research institutes were 4.6, 4.4, and 4.0 years, respectively, indicating that knowledge diffusion of research institutes was relatively fast. This result is useful for R&D agents making decisions and planning large national R&D investments considering national knowledge capacity.
Finally, this study confirmed R&D investment decisions may change if they are based on the rapidity of both the first and second waves of knowledge diffusion. Some technological areas exist where even if more time is required for the first knowledge diffusion network, the second knowledge diffusion network may be rapid enough to more than compensate. In addition, there are cases where the opposite is true. In this study, technological areas such as B09, H04, B25, C08, and G08 belong to the former, and C12 and C09 belong to the latter. In other words, B08, C12, A63, A61, and A01 may be proposed for investment if the decision is made based on the rapidity of the first knowledge diffusion. However, when considering both the first and second knowledge diffusion networks, the order should be B08, A63, A61, and C25.
This study confirms that the expansion of knowledge diffusion, which has not been addressed in most previous studies of knowledge diffusion, affects R&D investment priorities, and should be considered in R&D policies. Therefore, the results of this study are useful for policy makers planning practical R&D programs. However, as the convergence of science and technology becomes more important, research needs to examine the possibility of convergence with other technology areas. In addition, although this study’s analysis focused on the release of technological knowledge, more implications may be derived by considering absorption of knowledge using a measure of in-degree centrality.
This study does have some limitations. Although the SWRRP is representative of water resources during the period of the program, patents generated by individual researchers who did not participate in the program were excluded from the analysis. That is, the contribution of this R&D program to knowledge diffusion could be evaluated by comparing the amount of technological knowledge generated by research institutions that were not recipients of government support while the program existed to that generated by institutions who were involved with the program. However, this analysis was not conducted due to lack of access to the necessary data. In addition, although the technological knowledge generated through R&D activities is not reflected only in patents [44], this study derived the results of technological knowledge diffusion based on IPC classes that were identified by focusing on industrial sectors. This may lead to underestimating the innovation capability of the program.
Author Contributions
I.C., J.P., and E.H. contributed equally to the conceptualization of this research. I.C. analyzed the data using software, and wrote the original draft preparation. After the three authors discussed the results, J.P. edited the draft.
Acknowledgments
This work was supported by a grant-in-aid awarded by the Basic Research Project of the Korea Institute of Geoscience and Mineral Resources (KIGAM), funded by the Ministry of Science and ICT. The authors would like to thank the funded project for providing material for this research. The authors would also like to thank our anonymous reviewers for their valuable comments on this paper.
Conflicts of Interest
The authors declare no conflict of interest.
References
- Ravavenscraft, D.; Scherer, F.M. The lag structure of returns to research and development. Appl. Econ. 1982, 14, 603–620. [Google Scholar] [CrossRef]
- Mamuneas, T.P. Spillovers from publicly financed R&D capital in high-tech industries. Int. J. Ind. Organ. 1999, 17, 215–239. [Google Scholar] [CrossRef]
- Park, W.G. International R&D spillovers and OECD economic growth. Econ. Inq. 1995, 18, 571–591. [Google Scholar] [CrossRef]
- Ruegg, R.; Thomas, P. Tracing government-funded research in wind energy to commercial renewable power generation. Res. Eval. 2009, 18, 387–396. [Google Scholar] [CrossRef]
- Park, G.; Shin, J.; Park, Y. Measurement of depreciation rate of technological knowledge: Technology cycle time approach. J. Sci. Ind. Res. 2006, 65, 121–127. [Google Scholar]
- Bretschger, L. Knowledge diffusion and the development of regions. Ann. Reg. Sci. 1999, 33, 251–268. [Google Scholar] [CrossRef]
- Park, J.; Heo, E.; Lee, D. Effective R&D investment planning based on technology spillovers: The case of Korea. Scientometrics 2017, 111, 67–82. [Google Scholar] [CrossRef]
- Krugman, P. Geography and Trade; MIT Press: Cambridge, UK, 1991; ISBN 0-262-61086-8. [Google Scholar]
- Scherer, F.M. Inter-industry technology flows in the United States. Res. Policy 1982, 11, 227–245. [Google Scholar] [CrossRef]
- Jaffe, A.B. Technological opportunity and spillovers of R&D: Evidence from firms: Patents, profits, and market value. Am. Econ. Rev. 1986, 7, 984–1001. [Google Scholar]
- Mote, J.E.; Jordan, G.; Hage, J.; Whitestone, Y. New directions in the use of network analysis in research and product development evaluation. Res. Eval. 2007, 16, 191–203. [Google Scholar] [CrossRef]
- Appleyard, M.M. How does knowledge flow? Interfirm patterns in the semiconductor industry. Strat. Manag. J. 1996, 17, 137–154. [Google Scholar] [CrossRef]
- Jaffe, A.B.; Trajtenberg, M. International knowledge flows: Evidence from patent citations. Econ. Innovat. New Technol. 1999, 8, 105–136. [Google Scholar] [CrossRef]
- Branstetter, L.G. Are knowledge spillovers international or intranational in scope? Microeconometric evidence from the U.S. and Japan. J. Int. Econ. 2001, 53, 53–79. [Google Scholar] [CrossRef]
- Kaiser, U. Measuring knowledge spillovers in manufacturing and services: An empirical assessment of alternative approaches. Res. Policy 2002, 31, 125–144. [Google Scholar] [CrossRef]
- Todo, Y.; Miyamoto, K. Knowledge Diffusion from Multinational Enterprises: The Role of Domestic and Foreign Knowledge-Enhancing Activities. OECD Development Centre Technical Papers No. 196, 2002; (Downloaded on 7 October 2017). Available online: http://0-www-oecd--ilibrary-org.brum.beds.ac.uk/development/knowledge-diffusion-from-multinational-enterprises_642545611773 (accessed on 16 August 2018).
- Hájek, P.; Stejskal, J. R&D cooperation and knowledge spillover effects for sustainable business innovation in the chemical industry. Sustainability 2018, 10, 1064. [Google Scholar] [CrossRef]
- Zhou, Y.; Pan, M.; Urban, F. Comparing the international knowledge flow of China’s wind and solar photovoltaic (PV) industries: Patent analysis and implications for sustainable development. Sustainability 2018, 10, 1883. [Google Scholar] [CrossRef]
- Park, H.; Yoon, J. Assessing coreness and intermediarity of technology sectors using patent co-classification analysis: The case of Korean national R&D. Scientometrics 2014, 98, 853–890. [Google Scholar] [CrossRef]
- Feldman, M.P.; Kelley, M.R. The ex ante assessment of knowledge spillovers: Government R&D policy, economic incentives and private firm behavior. Res. Policy 2006, 35, 1509–1521. [Google Scholar] [CrossRef]
- Choi, I.-C.; Shin, H.-J.; Nguyen, T.T.; Tenhunen, J. Water policy reforms in South Korea: A historical review and ongoing challenges for sustainable water governance and management. Water 2017, 9, 717. [Google Scholar] [CrossRef]
- KISTEP (Korea Institute of S&T Evaluation and Planning). A Study on Planning the 21st Century Frontier R&D Program (II); KISTEP: Seoul, Korea, 2000. (In Korean) [Google Scholar]
- MEST (Ministry of Education and Science Technology). 21st Century Frontier R&D: A Decade Challenge for the Future; MEST: Seoul, Korea, 2011. (In Korean) [Google Scholar]
- Verspagen, B. Mapping technological trajectories as patent citation networks: A study on the history of fuel cell research. Adv. Complex Syst. 2007, 10, 93–115. [Google Scholar] [CrossRef]
- Jaffe, A.B.; Trajtenberg, M.; Henderson, R. Geographic localization of knowledge spillovers as evidenced by patent citations. Q. J. Econ. 1993, 108, 577–598. [Google Scholar] [CrossRef]
- Deng, Y. The Value of Knowledge Spillovers. Federal Reserve Bank of San Francisco Working Paper Series No. 2005-14. 2005. Available online: http://www.frbsf.org/publications/economics/papers/2005/wp05-14k.pdf (accessed on 7 July 2017).
- Crosby, A.W. The Measure of Reality: Quantification in Western Europe, 1250-1600; Cambridge University Press: Cambridge, UK, 1997; ISBN 0-521-55427-6. [Google Scholar]
- Leoncini, R.; Maggioni, M.A.; Montresor, S. Intersectoral innovation flows and national technological systems: Network analysis for comparing Italy and Germany. Res. Policy 1996, 25, 415–430. [Google Scholar] [CrossRef]
- Chang, S.-B.; Lai, K.-K.; Chang, S.-M. Exploring technology diffusion and classification of business methods: Using the patent citation network. Technol. Forecast. Soc. Chang. 2009, 76, 107–117. [Google Scholar] [CrossRef]
- Hu, A.G.; Jaffe, A.B. Patent citations and international knowledge flow: The cases of Korea and Taiwan. Int. J. Ind. Organ. 2003, 21, 849–880. [Google Scholar] [CrossRef]
- Choe, H.; Lee, D.H.; Seo, I.W.; Kim, H.D. Patent citation network analysis for the domain of organic photovoltaic cells: Country, institution, and technology field. Renew. Sust. Energy Rev. 2013, 26, 492–505. [Google Scholar] [CrossRef]
- Karki, M. Patent citation analysis: A policy analysis tool. World Pat. Inf. 1997, 19, 269–272. [Google Scholar] [CrossRef]
- Sharma, P.; Tripathi, R.; Tripathi, R.C. Patent citation network analysis for measuring the ICT patent progress in India. In Proceedings of the 2016 International Conference on Computer Communication and Informatics, Coimbatore, India, 7–9 January 2016. [Google Scholar]
- Hsueh, C.-C.; Wang, C.-C. The use of social network analysis in knowledge diffusion research from patent data. In Proceedings of the International Conference on Advances in Social Network Analysis and Mining, Athens, Greece, 20–22 July 2009. [Google Scholar] [CrossRef]
- Shin, J.; Lee, W.; Park, Y. On the benchmarking method of patent-based knowledge flow structure: Comparison of Korea and Taiwan with USA. Scientometrics 2006, 69, 551–574. [Google Scholar] [CrossRef]
- Li, X.; Chen, H.; Huang, Z.; Roco, M.C. Patent citation network in nanotechnology (1976–2004). J. Nanopart. Res. 2007, 9, 337–352. [Google Scholar] [CrossRef]
- Wasserman, S.; Faust, K. Social Network Analysis: Methods and Applications; Cambridge University Press: London, UK, 1994; ISBN 0-521-38707-8. [Google Scholar]
- Park, J.; Lee, H.; Park, Y. Disembodied knowledge flows among industrial clusters: A patent analysis of the Korean manufacturing sector. Technol. Soc. 2009, 31, 73–84. [Google Scholar] [CrossRef]
- Prell, C. Social Network Analysis: History, Theory & Methodology; SAGE Publication Ltd.: New Delhi, India, 2012; ISBN 978-1-4129-4714-5. [Google Scholar]
- Freeman, L.C. Centrality in social networks conceptual clarification. Soc. Netw. 1979, 1, 215–239. [Google Scholar] [CrossRef]
- Narine, F.; Breitzman, A.; Thomas, P. Using patent citation indicators to manage a stock portfolio. In Handbook of Quantitative Science and Technology Research; Moed, H.F., Glanzel, W., Schmoch, U., Eds.; Kluwer Academic Publishers: Dordrecht, The Netherlands, 2004; pp. 553–568. ISBN 1-402-02755-9. [Google Scholar]
- Park, K.-H.; Lee, K. Linking the technological regime to the technological catch-up: Analyzing Korea and Taiwan using the US patent data. Ind. Corp. Chang. 2006, 15, 715–753. [Google Scholar] [CrossRef]
- Krackhardt, D. QAP partialling as a test of spuriousness. Soc. Netw. 1987, 9, 171–186. [Google Scholar] [CrossRef]
- Basberg, B.L. Patents and the measurement of technological change: A survey of the literature. Res. Policy 1987, 16, 131–141. [Google Scholar] [CrossRef]
Figure 1.
Framework for patent citation network analysis.

Figure 2.
Whole network based on out-degree centrality.

Figure 3.
Long-term network of knowledge diffusion.


Table 1.
Number of patents through the SWRRP.
| IPC | Description | No. of Patents 1 (%) | No. of Utilized Patents (%) |
|---|---|---|---|
| G01 | Measuring; testing | 46 (19.2) | 32 (19.1) |
| C02 | Treatment of water, waste water, sewage, or sludge | 41 (17.2) | 34 (20.2) |
| G06 | Computing; calculating; counting | 35 (14.6) | 25 (14.9) |
| E03 | Water supply; sewerage | 24 (10.0) | 17 (10.1) |
| B01 | Physical or chemical processes or apparatus in general | 21 (8.8) | 16 (9.5) |
| E02 | Hydraulic engineering; foundations; soil-shifting | 15 (6.3) | 7 (4.2) |
| C25 | Electrolytic or electrophoretic processes; apparatus therefor | 8 (3.4) | 5 (3.0) |
| E21 | Earth or rock drilling; mining | 8 (3.4) | 4 (2.4) |
| A01 | Agriculture; forestry; animal husbandry; hunting; trapping; fishing | 5 (2.1) | 5 (3.0) |
| Others 2 | 36 (15.0) | 23 (13.6) | |
| Total | 239 (100) | 168 (100) | |
1 If one patent has two IPCs, it is counted as two; 2 Others include C08 (Organic macromolecular compounds; their preparation or chemical working-up; compositions based thereon), B08 (Cleaning), B09 (Disposal of solid waste; reclamation of contaminated soil), H04 (Electric communication techniques), A61(Medical or veterinary science; hygiene), B82 (Nanotechnology), E01 (Construction of roads, railways, or bridges), E04 (Building), F04 (Positive-displacement machines for liquids; pumps for liquids or elastic fluids), F16 (Engineering elements or units; general measures for producing and maintaining effective functioning of machines or installations; thermal insulation in general), G08 (Signaling), G09 (Educating; cryptography; display; advertising; seals), A63 (Sports; games; amusements), B25 (Hand tools; portable power-driven tools; handles for hand implements; workshop equipment; manipulators), B26 (Hand cutting tools; cutting; severing), B29 (Working of plastics; working of substances in a plastic state in general), B63 (Ships or other waterborne vessels; related equipment), C09 (Dyes; paints; polishes; natural resins; adhesives; compositions not otherwise provided for; applications of materials not otherwise provided for), and C12 (Biochemistry; beer; spirits; wine; vinegar; microbiology; enzymology; mutation or genetic engineering).
Table 2.
Citation information of each IPC class citing SWRRP patents.
| Rank | IPC 1 | No. of Utilized Patent | No. of Citing Patents (%) 2 | Average No. of Citing Patents |
|---|---|---|---|---|
| 1 | C02 | 34 | 157 (24.6) | 4.6 |
| 2 | G01 | 32 | 108 (17.0) | 3.4 |
| 3 | B01 | 16 | 86 (13.5) | 5.4 |
| 4 | G06 | 25 | 68 (10.7) | 2.7 |
| 5 | E03 | 17 | 66 (10.4) | 3.9 |
1 IPC classes that included more than 10% of the patents citing the SWRRP patents; 2 The ratio of the number of citing patents per IPC class to the total number of citing patents.
Table 3.
Statistics of citing and cited patent information by type of institution.
| No. of Patents | No. of Cited Patents (%) | No. of Citing Patents | Average No. of Citing Patents | |
|---|---|---|---|---|
| Industry | 69 | 47 (68.1) | 192 | 4.1 |
| Academia | 66 | 58 (72.7) | 147 | 3.1 |
| Research institutes | 63 | 47 (74.6) | 125 | 2.7 |
| Total | 198 | 142 (71.7) | 464 | 3.3 |
Table 4.
Value of centrality by type of research institution.
| Whole Network | Industry | Academia | Research Institute | |
|---|---|---|---|---|
| Value of centrality (ave.) | 0.223 | 0.279 | 0.238 | 0.159 |
Table 5.
Number of IPC classes by range of centrality.
| Range of Centrality | Whole Network (%) | Industry (%) | Academia (%) | Research Institute (%) |
|---|---|---|---|---|
| 0.000–0.200 | 31 (73.8) | 16 (61.5) | 14 (66.7) | 21 (80.8) |
| 0.200–0.400 | 5 (11.9) | 3 (11.5) | 3 (14.3) | 1 (3.8) |
| 0.400–0.600 | 2 (4.8) | 2 (7.8) | 0 (0.0) | 2 (7.8) |
| 0.600–0.800 | 0 (0.0) | 4 (15.4) | 0 (0.0) | 1 (3.8) |
| 0.800–1.000 | 1 (2.4) | 0 (0.0) | 3 (14.3) | 0 (0.0) |
| 1.000- | 3 (7.1) | 1 (3.8) | 1 (4.7) | 1 (3.8) |
| Total | 42 (100) | 26 (100) | 21 (100) | 26 (100) |
| IPC classes with greater than 0.600 of centrality 1 | C02 (2.073), E03 (1.439), G01 (1.463), G06 (0.829) | B09 (0.600), C02 (2.280), C25 (0.7600), G01 (0.600), G08 (0.640) | C02 (0.800), E03 (0.850), G01 (1.350), G06 (0.950) | E03 (0.720), G01 (1.360) |
1 ( ) indicates the value of degree centrality. In a graph with self-loops, a degree centrality greater than one may occur.
Table 6.
Comparison of out-degree centrality between two networks.
| First Diffusion Network (from SWRRP to F1) | Second Diffusion Network (from F1 to F2) | |
|---|---|---|
| Number of IPC | 26 | 29 |
| Out-degree centrality (ave.) | 0.223 | 0.288 |
Table 7.
Comparison of average citation times of IPCs in the first and second diffusion networks.
| IPC | Average Time for Knowledge Diffusion Per Year | Rank Considering First and Second Diffusion (A + B) | |||
|---|---|---|---|---|---|
| First Knowledge Diffusion Network | Rank (A) | Second Knowledge Diffusion Network | Rank (B) | ||
| B08 | 2 | 1 | 1 | 1 | 1 |
| C12 | 2.5 | 2 | 7 | 23 | 23 |
| A63 | 2.5 | 2 | 2.5 | 6 | 2 |
| A61 | 2.7 | 4 | 2.6 | 8 | 3 |
| A01 | 2.8 | 5 | 2.8 | 11 | 5 |
| C25 | 2.9 | 6 | 2.6 | 8 | 4 |
| C09 | 3 | 7 | 4 | 22 | 13 |
| B29 | 3 | 7 | 3 | 14 | 7 |
| E21 | 3.3 | 9 | 2.4 | 5 | 6 |
| G06 | 3.3 | 9 | 2.9 | 12 | 8 |
| E02 | 3.5 | 11 | 3.4 | 19 | 11 |
| B01 | 3.8 | 12 | 3.3 | 17 | 14 |
| E01 | 3.9 | 13 | 3.4 | 19 | 15 |
| C02 | 4.4 | 14 | 3.1 | 15 | 16 |
| B25 | 4.5 | 15 | 2 | 4 | 10 |
| E03 | 4.8 | 16 | 3.3 | 17 | 19 |
| B09 | 4.9 | 17 | 1.5 | 2 | 9 |
| H04 | 5 | 18 | 1.9 | 3 | 12 |
| F16 | 5 | 18 | 3.2 | 16 | 21 |
| G08 | 5.1 | 20 | 2.7 | 10 | 17 |
| G01 | 5.1 | 20 | 3.5 | 21 | 22 |
| B63 | 5.2 | 22 | 2.9 | 12 | 18 |
| C08 | 5.7 | 22 | 2.5 | 6 | 20 |
© 2018 by the authors. Licensee MDPI, Basel, Switzerland. This article is an open access article distributed under the terms and conditions of the Creative Commons Attribution (CC BY) license (http://creativecommons.org/licenses/by/4.0/).
Share and Cite
MDPI and ACS Style
Cho, I.; Park, J.; Heo, E. Measuring Knowledge Diffusion in Water Resources Research and Development: The Case of Korea. Sustainability 2018, 10, 2944. https://0-doi-org.brum.beds.ac.uk/10.3390/su10082944
AMA Style
Cho I, Park J, Heo E. Measuring Knowledge Diffusion in Water Resources Research and Development: The Case of Korea. Sustainability. 2018; 10(8):2944. https://0-doi-org.brum.beds.ac.uk/10.3390/su10082944
Chicago/Turabian StyleCho, Inkyung, Jungkyu Park, and Eunnyeong Heo. 2018. "Measuring Knowledge Diffusion in Water Resources Research and Development: The Case of Korea" Sustainability 10, no. 8: 2944. https://0-doi-org.brum.beds.ac.uk/10.3390/su10082944
Note that from the first issue of 2016, this journal uses article numbers instead of page numbers. See further details here.