The Importance of the Public Sector in Sustainable Development in Poland


1
Warsaw School of Economics, 02-554 Warsaw, Poland
2
Department of Finance, Faculty of Economics and Management University of Szczecin, 71-101 Szczecin, Poland
3
Department of Economic Policy and Banking, Faculty of Economics and Legal Sciences, K. Pulaski University of Technology and Humanities in Radom, 26-600 Radom, Poland
*
Author to whom correspondence should be addressed.
Sustainability 2018, 10(9), 3278; https://0-doi-org.brum.beds.ac.uk/10.3390/su10093278
Submission received: 28 June 2018
/
Revised: 31 August 2018
/
Accepted: 3 September 2018
/
Published: 14 September 2018
Abstract
:The striving for sustainable development has become the goal of actions undertaken not only by representatives of public authorities and institutions representing this sector, but also representatives of private entities who are increasingly recognizing the benefits and sources of long-term development based on the principles and objectives of sustainable development. These are mainly based on the pursuit of synergy in the three basic areas of activities, i.e., in the economic, social, and environmental dimensions as well as in the maintenance of natural resources. The implementation of these activities is connected with the necessity of incurring financial expenditures, which the government (public sector) does not have in the required value. Therefore, in the process of sustainable development for which the government is responsible, the active participation of the financial sector (banks) is necessary. Achieving results within the alliance of the concept of sustainable development requires the setting of a kind of contract, the parties of which are the government, society, and financial institutions. The purpose of the conducted research is to indicate by which means the government can stimulate economic growth towards its sustainable development.
1. Introduction
In recent years, we have observed a growing consensus in the views on the broadly understood economic development. Economists believe that not only does the pursuit of high levels of economic growth, most often measured in terms of GDP (Gross Domestic Product), reflect wealth, social well-being, or the development of entrepreneurship, but first of all, that balanced and sustainable economic and social development is the basis for further positive external results in the economy. Such conditions are to a large extent fulfilled by the concept of sustainable development, which aims at obtaining rational benefits for the stakeholders of this approach. In the modern economy, it is important that as many stakeholders as possible benefit from the positive external results of the GDP generated by the economy.
As part of sustainable development, activities based on the inclusive economic development principle are distinguished, where priority is given not only to achieving economic but also social goals, especially in the area of financial inclusion, eliminating social inequalities, and ensuring a high quality of life. Bearing in mind sustainable development, we touch all areas of our existence, both material and spiritual. The approach to understanding sustainability has evolved and evolved [1,2]. Together with the development and numerous dilemmas regarding the directions, principles and actions for sustainable development, it is important to say that sustainable development is “development that protects the needs of modern people without limiting the needs of future generations” [3,4,5].
One of the foundational texts on sustainable development is the International Union for Conservation of Nature and Natural Resources (IUCN) World Conservation Strategy (WCS) [3]. The WCS is a synthesis of decades of debate in the international community over the need to protect the environment while continuing the process of development. The WCS used the term “sustainable” to describe development that takes account of social and ecological factors, as well as economic ones; of the living and non-living resource base; and of the long term as well as short term advantages and disadvantages of alternative actions. Acknowledging that “conservation and development have so seldom been combined that they often appear—and are sometimes represented as being—incompatible”, the WCS proceeds to develop its case as to why conservation and economic and social development are mutually supportive endeavors. “Conservation must be combined with measures to meet short-term economic needs. The vicious circle by which poverty causes ecological degradation which in turn leads to more poverty can be broken only by development. But if it is not to be self-defeating, it must be sustainable—and conservation helps to make it so [3,6]”.
The 1987 Brundtland Report set the goal of sustainable development to create a fully sustainable way of life, and thus to improve the quality of life of people around the world without the plundered exploitation of natural resources in the world, requires different activities in different regions of the world. It focused on three directional activities: economic growth and even distribution of benefits, protection of natural resources and the environment as well as social development. From the point of view of a sustainable model of life, the achievements of the conference in Rio de Janeiro (Rio+ 20), which should be presented as a recommendation on four main blocks: Development, Human needs and abilities, Raw material triad and Environment favorable to Human development. The 2030 Agenda itself consists of 4 sections: (i) A political Declaration; (ii) A set of 17 sustainable Development Goals and 169 targets (based on the report of the OWG, with some small modifications); (iii) Means of Implementation; (iv) A framework for follow up and review of the Agenda. Scheme 1 shows how business can support Sustainable Development Goals. This assumption is based on an alliance between the Bisneys, the public sector and financial institutions.
We have accepted that in our study we will be guided by the indicated principles and 17 goals and in particular we believe that our study will reflect the following goals:
- All States and all citizens will cooperate in the implementation of basic tasks in the fight against poverty as an indispensable condition for sustainable development, to reduce disproportions in living standards and to better meet the needs of the majority of mankind.
- A special priority will be established to take into account the situation and needs of developing countries, especially the least developed countries and the most environmentally sensitive (in EU countries it is Poland case). International activities should also consider the needs and interests of all countries.
- To achieve the development of a balanced and higher quality of life for the population, States will reduce or eliminate unsustainable trends in consumption and production and will promote appropriate demographic policies.
In addition to the social aspect of sustainable development at the EU (European Union) level [7], environmental and climate change objectives are becoming increasingly important. In light of climate change, greater importance has also been attached to environmental protection and care for natural resources. The need to implement investments aimed at improving environmental protection and related outlays as well as measures aimed at improving social conditions require not only additional funds, but above all, the alliances between government and financial institutions with regard to achieving positive effects in the implementation of sustainable development. Therefore, within the framework of sustainable development, particular attention is paid to the implementation of policies and initiatives based on the principles of inclusive economic development. The inclusive growth concept is a concept of economic growth with the goal to create development opportunities for all population groups [8]. Inclusive growth development refers to both the pace and the growth pattern, which are considered to be interrelated, and should therefore be analyzed together [9].
Public institutions, national governments, and the EU authorities have a particular role and importance to play in this regard. However, public sector entities are not able to meet the adopted sustainable development objectives on their own and require the support of private sector partners. A special role is assigned to financial institutions and banks in this respect. The public–private alliances should be based primarily on the need to develop a joint strategy of action, define priorities and objectives, and indicate the means of their implementation. Financial outlays are the cash flowing from both the financial sector and public expenditure.
Considering that the public sector, within the framework of alliances with financial institutions, will strive not only to achieve economic but also social goals by affecting the level of income and expenditure. Therefore, it is reasonable to make the following research hypotheses:
Hypothetical 1 (H1).
There is a causal relationship between government spending and GDP. This means that a public institution, in order to achieve a higher level of GDP, should plan budgets based on a balanced budget policy in its budgets. This policy should take into account both the feasibility of fiscal revenues as well as sources and methods of indebtedness. For the H1 verification, the Classical Linear Regression Model, CLRM (Ordinary Least Squares Method, OLS) was used, which allowed us to estimate significant statistical variables.
Hypothetical 2 (H2).
Consumer spending is a significant priority in GDP growth. The activity of households in the scope of fitting their needs determines the direction and scope of investment decisions made in the economy. Market responses to household needs may be public or private investments usually financed with the use of loans. Given that in the structure of government spending, the participation and significance of social expenditure in stimulating economic growth processes is important, it constitutes the basis for sustainable development. In the model studies conducted for Poland, this change was not statistically significant, and its influence among the most important variables was the strongest in the analyzed years from 1995 to 2016. This is probably due to differences in the level of development of the economic and economic development between Poland and other EU countries. At the same time, the government’s policy based on social and sectoral erosion limits the activity on the labor market.
The authors advocate the collaboration between governments and financial institutions to achieve sustainable development. Poland is a country that belongs to the group of the less developed in the European Union and therefore the standard of living of the population differs from the average of EU countries. Poland has a different structure of the private sector, which could be much broadly understood, as 96% of enterprises are micro-enterprises and only 0.2% of all enterprises are large ones. This peculiarity of the Polish private sector determines that society is mainly defined as households. Consumers in Poland (the society) are highly aware of the implementation of the objectives and principles of sustainable development. The main initiator of the policy for sustainable development is the government, which cooperates with regional and local government organizations. The main activities of the policy for sustainable development are focused on the distribution of EU funds (what clearly distinguish Poland among EU countries), which significantly support the financing of the government’s policy for sustainable development. Such situation contributes to the direct relation between the EU and Polish policy for sustainable development. The idea of sustainable development has an impact on both investors and customers. At the same time, the government is involved in economic activities, both as an owner and as an operator. It results closer cooperation among financial institutions, government and the society in Poland and indicates on unique features in relation to other EU countries. In consequence the peculiarity influenced on the research hypothesis, the selected variables to be studied and the selection of Poland as the case to be discussed.
In order to comprehensively verify the undertaken research, the following research question was formulated: Are there effects (and what) of the impact of the public finance (In Poland, the public sector is the stance of all national economy entities grouping state property (State Treasury and state legal persons), ownership of local government units or self-government legal persons, and “mixed ownership” with a predominance of capital (property) of public sector entities) sector alliances on the economy and its sustainable development?
In accordance with the principle of sustainable development that “states should cooperate to promote a supportive and open international economic system that would lead to economic growth and sustainable development in all countries and would better counteract ecological problems”: GGST and GDERD are important for our research. Gross Domestic Expenditure on R&D and General Government, Social Benefits other than social transfers in kind, payable they are an important element of the impact to bring about economic growth and sustainable development. The authors advocate cooperation between governments and financial institutions to achieve sustainable development. We argue our approach is that the financial institutions sector 30 January 2017 launched the Principles for Positive Impact Finance [10]. The Principles are a timely initiative from the finance sector. They demonstrate the willingness of financial institutions to go beyond current practices and to contribute to foster a more sustainable development. They should provide strengthened foundations for a positive cooperation between public and private actors in this area. The Positive Impact Principles are a game changer, which will help to channel the hundreds of trillions of dollars managed by banks and investors towards clean, low carbon and inclusive projects. he Principles provide financiers and investors with a global framework applicable across their different business lines, including retail and wholesale lending, corporate and investment lending and asset management. With global challenges such as climate change, population growth and resource scarcity accelerating, there is an increased urgency for the finance sector both to adapt and to help bring about the necessary changes in our economic and business models.
Using the econometric analysis of the CLRM and Vector Error Correction Model (VECM) we tested the relationship between the level of economic growth and the indicators characterizing the situation of the public finance sector and the activity of the banking sector in the performance of their basic functions, i.e., the collection of savings and financing of social needs. Economic growth measured by the value of GDP is determined by the direction adopted for implementation of public policy and the instruments used to stimulate consumption in society and investment among entrepreneurs. These activities require financial resources. Therefore, it is important to obtain answers to the questions to what extent the GDP growth results from the public policy of the state with the involvement and participation of the banking sector, i.e., developed and adopted public–private alliances. It can therefore be said that sustainable development is a kind of contract to which the government, society, and financial institutions are parties. In the authors’ opinion, such an approach to the analysis of sources of economic growth in the country may constitute a basis for obtaining results in the implementation of the sustainable development concept.
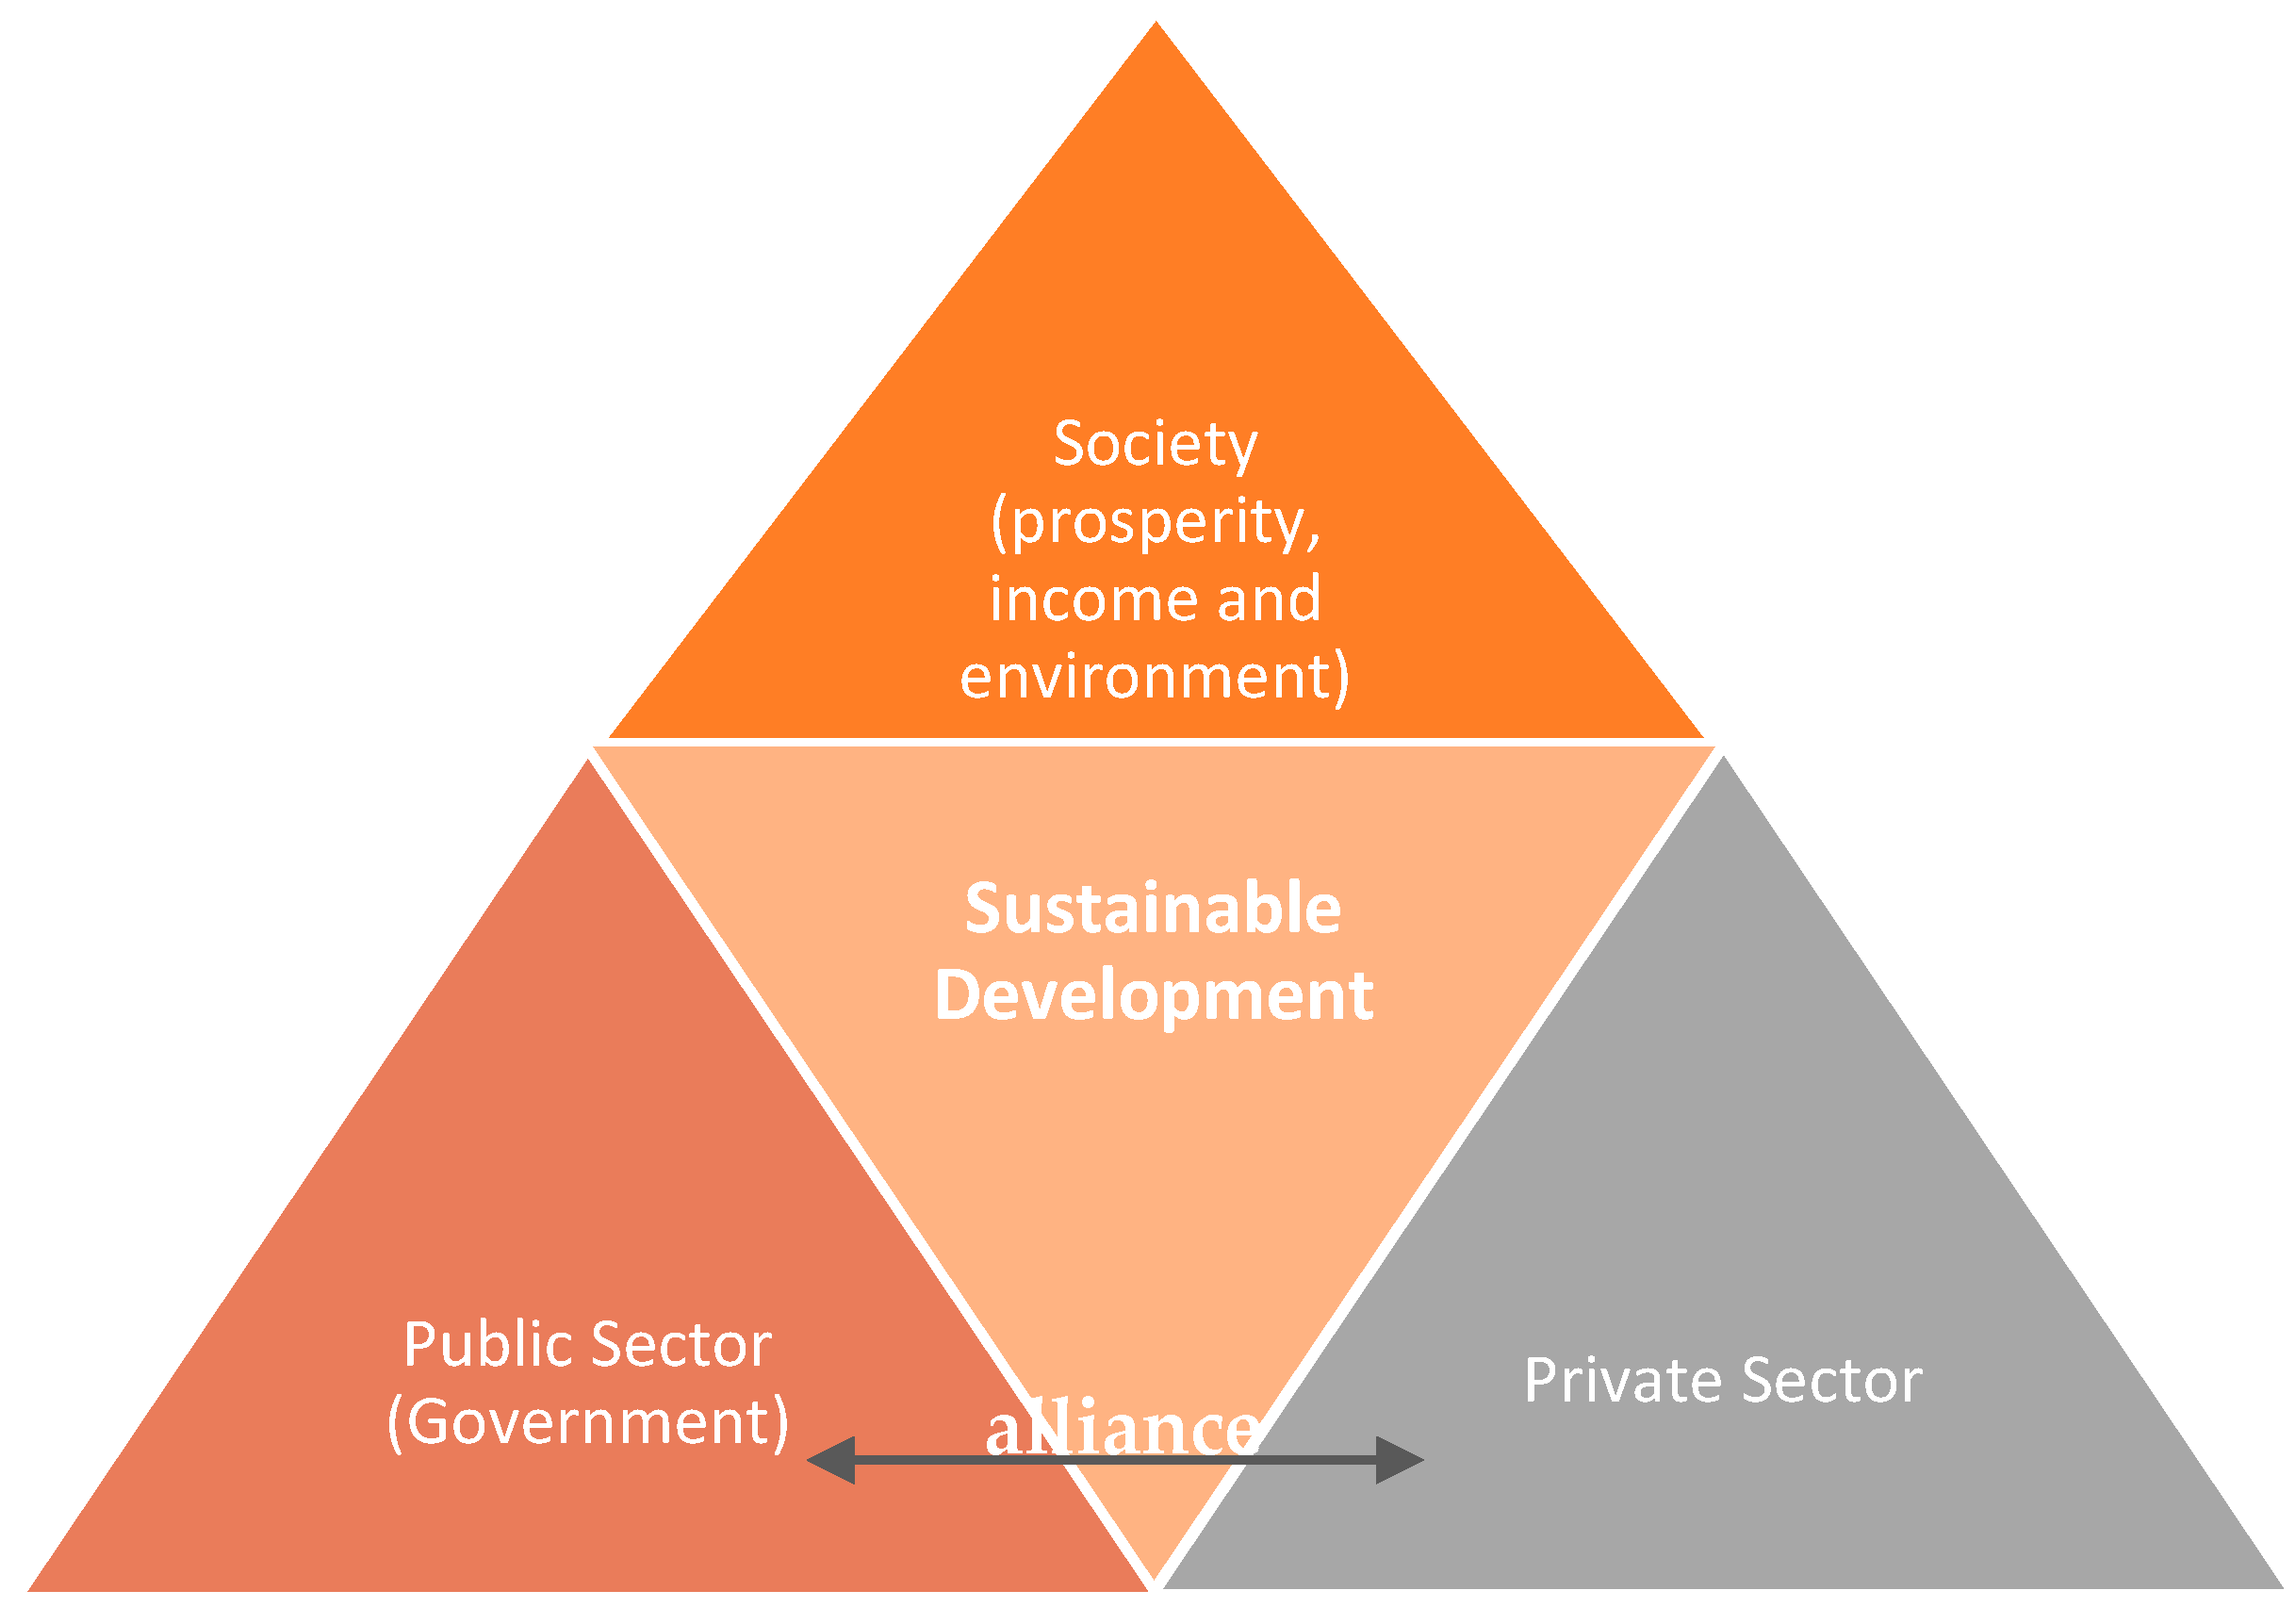
One of the main difficulties in the implementation of alliances between financial institutions and the government is the objectives of their activities. Financial institutions (in Europe these are mainly banks), as private commercial institutions, are focused on maximizing profits and therefore look for investments which, on the one hand, are safe, and on the other hand, bring the highest possible rate of return on invested capital. Public institutions, in contrast, perform social tasks, provide public goods, and ensure the long-term sustainable social and economic development of the country. The society (households), in turn, despite different objectives of each of these sectors: private and public, the institutions comprising them benefit from achieving sustainable social and economic development of the country (Scheme 2). The basis for establishing close cooperation between these sectors, in the form of an alliance, is the possibility of achieving specific benefits by each of the parties to the contract, i.e., financial institutions, public institutions and, above all, the society, which is more than the beneficiary of the effects of an appropriately developed and effectively implemented public–private alliance for sustainable development in the sphere of finance. Scheme 2 shows parties to the contract under sustainable development.
In this publication, a holistic approach will be applied to assess the level of socio-economic development in a sustainable way [11]. According to the authors, in this way it is possible to create a lasting value in the economy, which in the long run will benefit a wider group of stakeholders. Based on the assumptions developed and implemented in such a way, both the parties to the contract and other stakeholders will benefit from the positive external effects of economic growth [12]. Such an approach can be described as the social dimension of sustainable development or as a social contract for sustainable development. The parties to the social contract are governments, financial institutions, and society. Each of these parties has its own objectives: The government strives to ensure the social and economic development of the country by providing public goods; the main objective of financial institutions is to maximize profits; and society strives to increase prosperity. It is important is to set up an alliance that will fulfil all these goals.
2. State of the Art
Research carried out in Keynesian economics indicate the influence of the public sector on social and economic development. From the point of view of public and financial sector alliances, the important factors are the expenditure and revenues of the public sector, the debt level, and public policy focused on the effects of sustainable development. Transfers and expenditures related to the implementation of public tasks (both current and investment) may be of particular importance for the alliances. The implementation of public tasks should ultimately bring the effects desired from the point of view of assessing the needs of society for which the state performs its functions.
In addition to the public sector, there is also a financial system (in Europe based on banks) operating on market principles, aiming to achieve its economic goals through the use of basic instruments, i.e., savings products, payments, and loans.
The financial system provides services allowing for money circulation in the economy and is thus closely linked to other systems distinguished in the economy. The overarching objective of the entities of the financial system is to provide services to the society, thus creating a social system. The financial system should serve other market participants.
2.1. Institutional Approach to Sustainable Development
The pursuit of sustainable development has become the goal of actions undertaken not only by representatives of public authorities, but also owners of private entities who are increasingly recognizing the benefits and sources of long-term development based on principles and objectives characteristic of sustainable development. Initiatives undertaken by the government, adopted strategies, and directions of actions are mainly based on the pursuit of synergy in the scope of three basic areas of activity, i.e., the economic, social, and environmental aspects, and the maintenance of natural resources, which requires incurring financial expenses. The concept of sustainable development exposes the need to care for the natural environment and the possibility of using natural resources for the next generations of society.
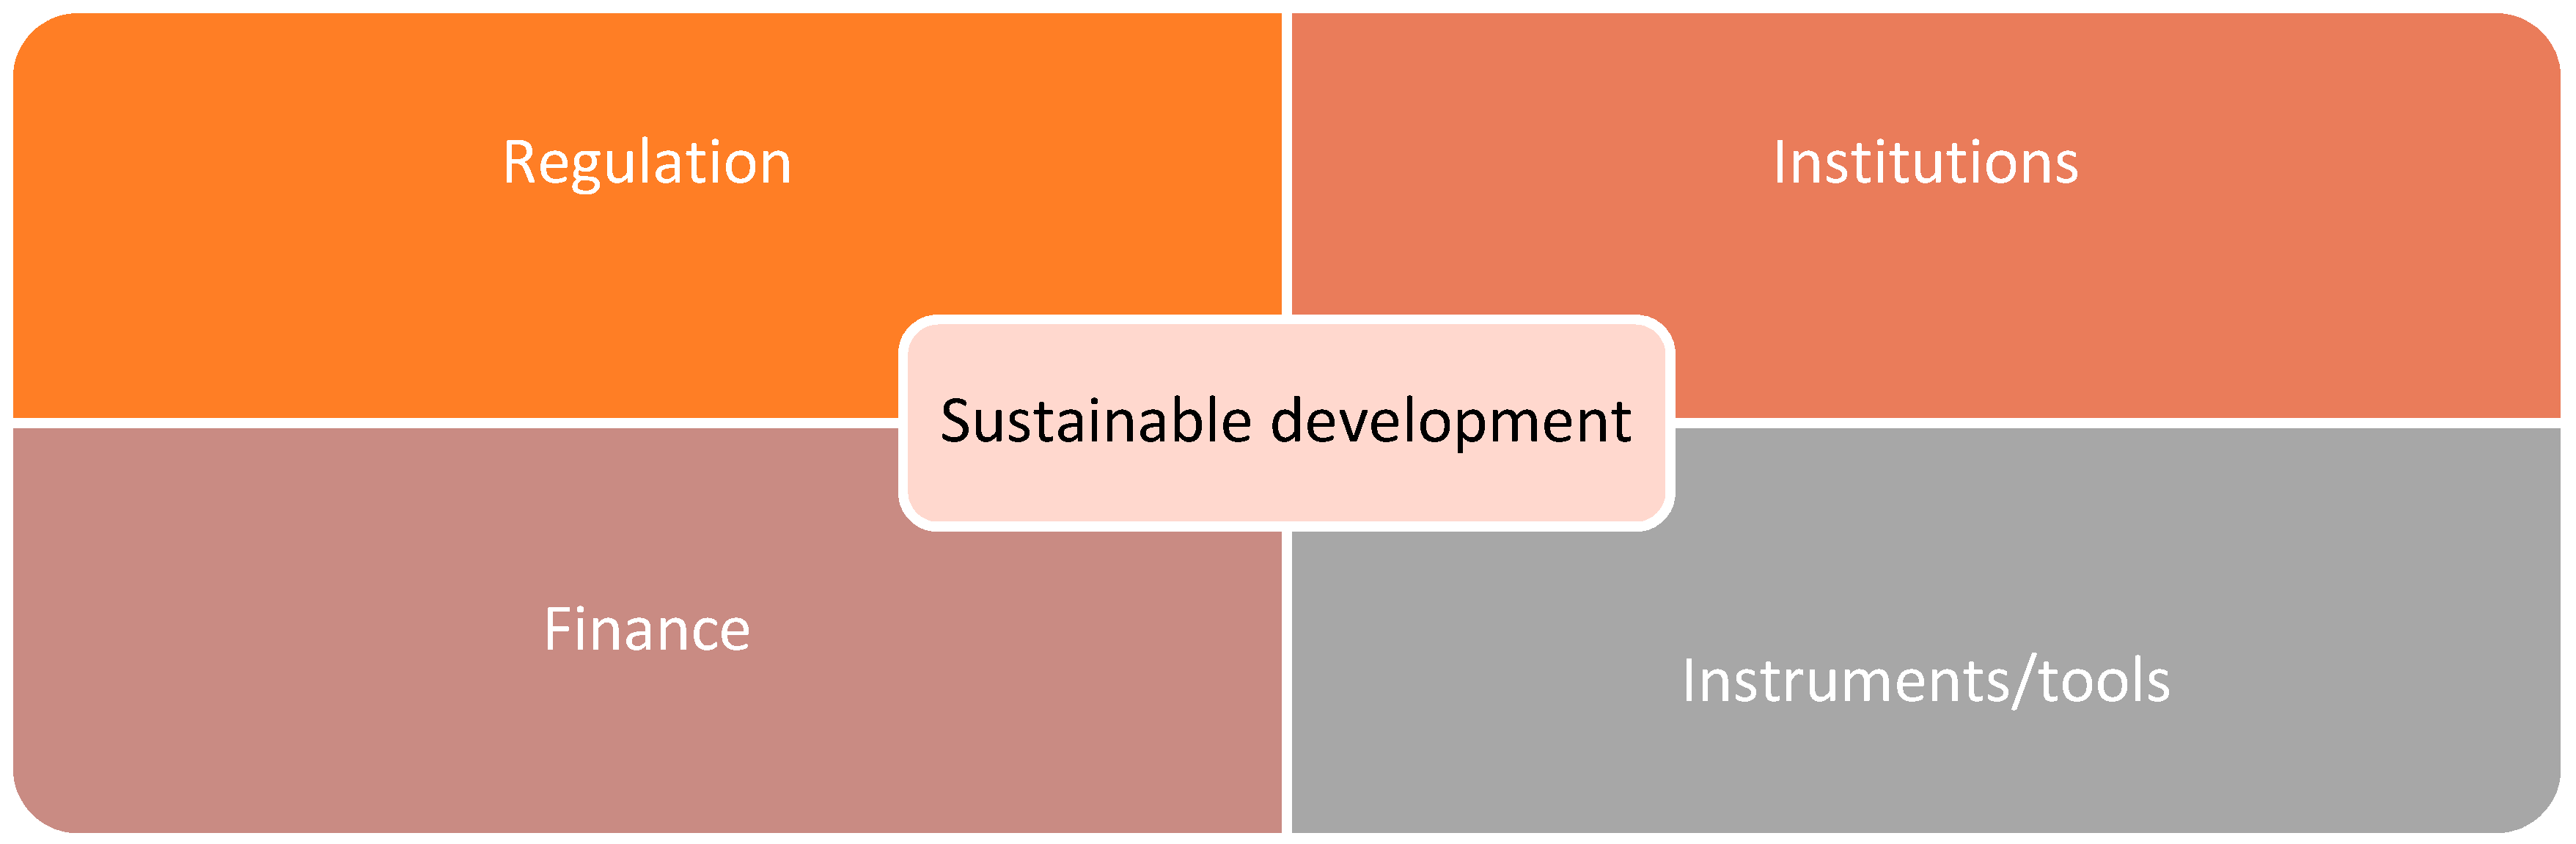
The role of the state (the public sector) manifests itself above all in creating the foundations and effective use of legal regulations and financial resources. An important role in shaping sustainable development is played by individual institutions (public and private) as well as alliances concluded in order to stimulate sustainable development. The most important in the implementation of sustainable development are: institutions, instruments, regulations, and finances. To obtain the effects, a social contract should be developed, adopted, and implemented between the basic market participants.
Effective implementation of the concept of sustainable development requires the adoption of specific organizational principles, division of work, and responsibility between all market participants. In the general scheme of organization and financing of sustainable development, one can distinguish the following essential components of the whole process: Institutions, tools, objectives, principles of financing, and means of implementation [9].
An institutional approach to the dependencies that determine sustainable development is shown in Scheme 3.
Sustainable development requires that institutions create alliances using tools and instruments as well as financing dedicated to sustainable development. Thanks to the included alliances, a synergy effect is achieved in stimulating sustainable development and the regulations created are conducive to the sustainability of the alliances included.
Considering the fact that Poland is a country that belongs to the group of the poorest in the European Union and the standard of living of the population significantly differs from the average EU countries (hence significant expenditure from the EU budget under the common policy on equal opportunities) it is necessary to analyze the relationship between GDP and households and expenditure of the public finance sector.
The authors adopted such an assumption following the conclusions contained in the document “Reengineering development cooperation institutions to deliver 2030 Agenda for Sustainable Development”, which indicates that “With multi-dimensional and interconnected global goals and development, cooperation in developing sustainable development results. Successful implementation of the 2030 Agenda and the SDGs. Competent and accountable institutions of the development of cooperation [13]”.
The government as the basic policy creator for sustainable development interacts with the use of various instruments for the behavior of financial institutions aimed at achieving the goals of sustainable development [14]. Through the incentive system, it also influences the consumption behavior of the society. Financial institutions taking part in financing the state’s borrowing needs as well as the public can support sustainable development in two ways:
- Be participants (agents) of government programs financing socio-economic changes for sustainable development (e.g., low-carbon area),
- directly finance tasks related to achieving the effects of sustainable development.
The Polish enterprise sector is dominated by microenterprises whose share in the structure of all enterprises amounts to as much as 96%. Polish microenterprises are characterized by a positive development trend: on the space in recent years, their number, value of production, revenues, investment outlays, the number of employees and employees have been growing. The share of large enterprises in the structure of the Polish economy is only 0.2% [15]. Considering the above, a simplified statement was adopted that “sustainable development is a kind of contract to which the government, society and financial institutions are party”.
2.2. Government Spending, Revenue, Economic Growth as Indicators of Alliance in Sustainable Development
The research conducted by Abu-Bader and Abu-Qarn [16] indicated both positive and negative effects of the active role of the public sector in the economy. They pointed out that public sector actions based on adopted programs and financed from the budget could have a positive impact on GDP, because: (a) the State provides pure public goods, which account for a significant share of global demand; (b) the State may own or manage enterprises and institutions providing quasi-public or private goods; (c) state regulation and control facilitates the protection of property rights and improves the efficient allocation of resources in case of externalities; (d) the income taxes and transfers affect income distribution and can create a fairer society; and (e) the State often facilitates the functioning of markets dealing with asymmetric and imperfect information.
The relationship between the public finance sector’s expenditure and GDP growth has been considered in numerous studies. The impact of government spending on GDP in the context of development factors was examined by Dao [17,18]. Dao confirmed Barro’s research [19], stating that the implementation of public policies as well as the institutions implementing them are key factors (indicators) for economic growth. Barro stated that an important aspect of public sector actions is that in society, there is a tendency to assess the well-being of the individual compared to other individuals [19]. Additionally, Dandan [20] and Garba [21] have shown that public spending maintains a positive long-term relationship with economic growth, and that a long-term policy (recurrent expenditure) is important for growth and development of the economy [1,22].
Nordhaus and Tobin’s studies [23] and the subsequent Daly and Cobb studies [24,25] provided a basis for determining the positive impact of consumer expenditure [1].
It should be stressed that the classic approach indicates that it is necessary to balance consumer expenditure by such factors as revenue distribution, costs related to environmental pollution, and other undetectable, intangible costs. For the modern citizen, the issues related to environmental protection, actions for sustainable development, and respect of the principles of social responsibility are of particular importance and have often become a priority, as demonstrated by Cobb, Glickman, and Cheslog [24]. Therefore, the public sector, in pursuing its policy of influencing GDP growth, refers to the protection of the natural environment through the prism of measures for sustainable development [26,27].
In this respect, the expenditure structure has a special meaning. An analysis of the Polish example showed that the largest share in this structure (in the countries of system transformation and development disproportions existing) is social expenditure, playing a key role in stimulating consumption growth. As emphasized by the economist from Cambridge in the report for the EC [28] the time is now ripe to develop a new macro-economics for sustainability that does not rely on its stability for relentless growth and expanding material throughput. Four specific policy areas have been identified to achieve this:
- Developing macro-economic capability
- Investing in public assets and infrastructures
- Increasing financial and fiscal prudence
- Reforming macro-economic accounting
In addition, since 2016, Poland has been implementing a strategy of responsible sustainable development; paying special attention to spending funds for investments as well as within public policies on the impact on sustainable development and low-emission economy [29]. As part of the implementation of the strategy of sustainable responsible development in Poland, the model of current consumption has changed, attaching greater importance to the financing of expenses consistent with the idea of sustainable development on both the public and private (society) sides. The public sector in the Polish economy, through alliances with the financial sector, activates both raising funds for financing expenditures related to the implementation of a responsible and sustainable development strategy, and stimulates consumer behaviors focused on the goals set in the strategy. In addition, the public sector, in order to implement the strategy of responsible and sustainable development, shapes tax policy (the side of state budget revenues) by increasing the importance of proecological taxes. The public sector, in order to fulfil its task of influencing sustainable development through the stimulation of economic growth, has an impact on taxation, which is public revenue. A good approach to the analysis of this issue was presented in the works on the relationship between taxation and economic growth by Myles [30], Stoilova [31], and Stoilova and Patonow [32]. Literature sources differ in evidences concerning the level and growth of taxes and tax structure. Arnold notes that research results analyzing the link between growth and tax structures provided slightly more conclusive answers than research focusing on the level of taxation. The results of the empirical analysis conducted by Schwellnus and Arnold [33], Vartia [34], Stoilova and Patonov [32] are considered in the literature to be sufficiently reliable for the nature of the examined compound. A recent study has shown a very strong link between taxation (government revenue) and economic growth [31]. Empirical studies have also confirmed the relationship between expenditure and tax revenue (which is public revenue) and expenditure and growth. The studies carried out showed various relationships depending on the level of development of the economy [17,18,35], which requires deepening the research to precisely determine the strength and direction of these relationships. Studies have confirmed that public finances have an impact on growth through taxation, which confirms the alliance between sectors. These alliances are used to shape the sustainable development policy through the application of government expenditure and ecological taxation by the public finance sector. Their impact is constantly analyzed in the literature [26,36,37] due to the so-called “crowd-in effect”, which occurs especially in relation to the expenditures affecting sustainable development. The starting point for further analysis is research [38]. They included the following policy measures: Investment, Labor force, Population, Poverty, Technological Change, Government Expenditures, Trade, Work Week, Greenhouse Gases, Consumption, Environment and Resources, and Localization. From this set of important indicators (macroeconomic values), those that have the most significant importance in Poland were selected. Below summarized actions require large state activity and public facilities (see Table 1).
The policy of alliances between the private sector and financial institutions may, as a result of the budget deficit and public debt caused by the expansionary fiscal policy, result in the necessity to supplement private expenditure by public expenditure [40] The research indicates that the economic growth rate will depend i.a. on the rate of return on private capital and the households’ propensity to save. Greiner and Semmler [41], among others, assuming that the public debt is incurred exclusively to finance the public investment, proved that the increase in the budget deficit and the public debt could accelerate the long-term economic growth rate. Xu and Yan, on the other hand, [42] proved that investment expenditure from the state budget (government investment expenditure) in public goods contributed to economic growth by achieving a positive complement effect through the involvement of the private sector. To ensure future economic growth, the government should increase expenditure in public investment and reduce the investment in those sectors that compete directly with the private sector.
2.3. The Importance of the Financial Sector in Sustainable Development
The financial system could be a very important factor to promote sustainable development as it could foster economic growth and development, efficient resource allocations, the protection of the environment, and social responsibility. The financial system is an element of the economic system, which consists of two principal components: The public finance sector and market-based finance system. Actions undertaken as part of the sustainability finance concept could contribute to changing the orientation of finance measures and to strengthening efforts to generate a long-term positive impact on socio-economic development. A particular role and importance in this respect is ascribed to public authorities, which use public finance to achieve sustainable development.
The role of the financial system in promoting economic growth has been the subject of many works. Numerous econometric analyses have found a positive link between financial development (market-based finance system) and economic growth [8,43,44,45] and stresses that the availability of loans and the stock market situation determines positive decisions concerning investments in the economy, consequently supporting cyclical growth in the economy. Financial intermediation may, in the short term, cause imbalance, but is beneficial for economic development in the long term [46].
Amit, Brander, and Zott [47] highlighted the growing role of the market system, primarily the specialized financial institutions such as investment funds (venture capital) who not only provide capital, but also assist in the development process, which reduces information asymmetry in the initial period of a company’s life, enabling them to finance and support innovative activities.
The increase in the size of the financial system leads to economic growth, but at the same time, it is also conducive to higher volatility and banking crises [48]. The balance of the impact of the factors seems to depend on the development stage of the financial system. The positive impact of the financial system on economic growth only starts to occur in the case of financial systems of medium size. It cannot be excluded that the benefits from the functioning of the financial system, after exceeding a certain threshold, may drop more rapidly than they were initially increasing.
Numerous studies also point to the negative impact of the financial system on economic growth. The research in this area was conducted i.a. by Barajas [49]. Tobin in 1984 [50] emphasized that a large financial sector can have a direct negative impact on the average economic growth rate as it attracts people with high intellectual potential by offering high salaries, while the added value of part of their work is low. Doubts were raised about the benefits of the active management of the investment portfolio, which absorbs an increasing share of resources in finance [46]. Arcand et al. [51] proved in their research that the debt structure in the financial sector could have a negative effect, which reflected a shift in corporate and household financing and an increase in the share of mortgages in global bank balance sheets. This situation did not increase productivity and innovativeness, leading rather to the property market bubble. Banbuła [52] identified the decreasing impact of the financial system on economic growth due an increase in the risk of crises. When the financial system is developing, the value of assets increases (financialization), but this has not been accompanied by an acceleration in economic growth, but rather by its slowdown.
The results of these studies confirm the thesis that in order to achieve the objectives resulting from sustainable development, active participation and involvement of the state is necessary.
Moldovan distinguished several key functions that the financial system should perform in the economy. Through these functions, the importance of the financial system in supporting the economic development can be identified in three key areas of activity [53]:
- Accumulation and mobilization of savings, accumulation of capital, and the allocation of investment funds.
- Effective allocation of financial resources and their utilization to finance environmental projects, and
- Incorporating socially responsible activities (CSR) into their strategies and basing their investment policy on these principles.
The importance of the financial system in promoting economic growth has been the subject of a great number of papers and still lacks a clear answer. Numerous econometric analyses have captured a positive relationship between financial development and economic growth. This is reflected in the research of King [8] and Bencivenga [43]. In 2015, the International Monetary Fund (IMF) published the results of research [33] indicating that the size and structure of the financial system in Poland, consisting of the banking sector, has proved to be optimal in relation to the size and potential of the Polish economy. Research conducted by the IMF indicated that Poland has an optimal financial structure, supporting economic development [54].
3. Materials and Methods
3.1. Data
Considering that the basic goal of our research was to assess the impact of financial institutions’ and government’s alliances on sustainable development, we needed to select a representative set of variables to study. The classic approach to the GDP survey including major aggregates shows development as including household spending on consumer goods (C), gross fixed capital formation (I), and inventory growth (∆R), government expenditure (G), and net exports (En).
The classic approach to stimulating economic development does not take into account differences between sectors in the form of impact instruments and does not take into account alliances and their impact on the possibility of creating sustainable development. Therefore, these variables were included in the presented econometric models. Table 2 presents the categorization of key indicators included in the study along with justification.
3.2. Modeling of Sustainable Development for Poland
In order to analyze the interrelations between economic growth, the area of public finances, and financial institutions, we prepared two models of economic growth (CLRM, VECM) and analyzed the activity of monetary financial institutions (MFIs).
- In the first model, we used a classic linear regression model (CLRM) to statistically estimate significant macroeconomic variables affecting GDP changes.
- In the second model, we used the Vector Error Correction Model (VECM) to examine the interrelations between GDP and selected macroeconomic variables. In the modelling, the impulse response functions were used to diagnose the impact force and direction as well as the decompositions of the random component variance to assess the degree of explanation of individual variables.
- Another analysis concerned the assessment of the activity of MFIs in the scope of loans granted and deposits accepted for corporations and households from 1996 to 2018.
3.3. Model Approach
In this study, we used methods known from the literature on international economics and international finance, and econometric methods like the basis of the CLRM model [60] and next VECM [61,62] with impulse responses and variance decomposition analysis [63]. In order to analyze the significance of macroeconomic factors on economic growth for Poland from 1995 to 2016 [41,64], the final formula for the production function was developed as follows:
Model I (CLRM)
In order to estimate the factors of economic growth, we used the following formula:
where n is the number of estimated units; k is the number of independent variables ; are the parameters; t = 1, 2, …, n; and is the random component.
We used the model consisting of the dependent variable (GDP) and the seven independent variables.
where:
- : Gross Domestic Product, GDP (USD millions, PPPs)
- : Total General Government Revenue (USD millions)
- : Total General Government Expenditure (USD millions)
- : Gross General Government Debt (USD millions)
- : Gross Fixed Capital Formation (USD millions)
- : Gross Domestic Expenditure on R&D (USD millions)
- : General Government, Social Benefits other than social transfers in kind, payable (USD millions)
- : Final Consumption Expenditure of Households (USD millions, PPPs)
- : Period
The time series of variables were taken from the OECD Internet databases and were annual data. These variables respond to the basic aggregate of GDP. Variables such as TGGE, GGST, and FCEH represent demand. Domestic capital is represented by GFCF. The R&D variable responds to expenditure on information and telecommunication technologies (ICT).
The summary statistics including the values of the standard deviation (Std. Dev.) showed that the biggest changes were shown by the variable GGGD (0.60971), while the lowest change (the most stable) was FCEH (0.22928). Similar variability was shown by the dependent variables TGGR (0.47360) and TGGE (0.47602). Coefficients of variation (C.V.), that is, the measures of differentiation, confirmed that the highest level of this differentiation occurred for the variable GGGD (0.051494) against the lowest for FCEH (0.017772) (Table 3).
Prior to the estimation of the model, the variables were logarithmed, the significance of structural parameters (t-distribution, F-Snedocor test) was examined as well as the goodness of fit of the model (the coefficient of determination, ) and selection of variables for the model (correlation matrix). In order to analyze the correlations between the dependent variable being GDP and independent variables, the Pearson’s correlation coefficient was calculated. The highest positive linear correlation occurred between GGST and GDP ( = 0.9670), next between GFCF and GDP ( = 0.9616), compared with a lower correlation between expenditure on R&D and the GDP value ( = 0.9314) and between TGGE and GDP ( = 0.9418).
The model’s verifications were based on the assessment of the structural parameters’ significance, Student’s t test, F-Snedecor test, and White’s test for heteroskedasticity.
In the input version of the estimated model, the variable significant at the 1% significance level was FCEH, by 5% were GDERD, TGGE, and TGGR, whereas GGGD, GFCF, and GGST turned out to be insignificant. The coefficient of determination equaled R2 = 0.998772, which proved a high level of explanation. The F-Snedecor test performed confirmed the overall suitability of the model, because . The Durbin-Watson autocorrelation test (DW) at = 0.6772 and = 2.2465 confirmed the relations (Table 4).
In order to analyze the stationarity of the analyzed variables, an augmented Dickey-Fuller test (ADF) was employed. For all analyzed variables, a unit root a = 1 was noted; integration row I (1) indicated the non-stationarity of the time series (Appendix A, Table A1). Normality of the distribution of residuals was assessed with the use of the Doornik–Hansen test, which confirmed that the distribution of residuals had the features of normal distribution. White’s test for non-linearity (logarithms) was used for the assessment of the linearity of the analytical form of the model and confirmed the validity of the linear form model.
Factual verification of the final model of economic growth for Poland in the period 1995–2016 estimated the ultimate results. The significant independent variables for GDP became the variables FCEH, TGGE, TGGR, GDERD (α = 0.01), and GGGD (α = 0.05). The coefficient of the model determination was maintained at a level = 0.998737. The F-Snedecor test performed confirmed the overall suitability of the model as . The Durbin-Watson autocorrelation test (DW) at = 0.8629 and = 1.9400 confirmed the relations (Table 5).
According to White’s test for heteroskedasticity, the p-value = P (Chi-square (20) > 21.921981) = 0.344759. The condition of maintaining the linear form of the model has been fulfilled because = 21.921981 < 28.412. In addition, the results of White’s test for heteroskedasticity (squares only) with the p-value = P (Chi-square (10) > 14.166091) = 0.165550 also confirmed the validity of the linear model, with = 14.166091 < (10%, 10) = 15.9872.
The equitation for the final model estimated economic growth for the years 1995–2016 (Table 4) was as follows:
This equitation could be interpreted as:
- (1)
- A 1% increase in TGGR would lead to a 0.23% increase GDP.
- (2)
- A 1% increase in TGGE would lead to a 0.29% decrease GDP.
- (3)
- A 1% increase in GGGD would lead to a 0.10% increase GDP.
- (4)
- A 1% increase in GDERD would lead to a 0.05% increase GDP.
- (5)
- A 1% increase in FCEH would lead to a 0.86% decrease GDP.
The results of the OLS model confirmed that the FCEH variable was statistically significant and had the largest share in the explanation of the GDP changes. This means a positive verification of the H1 hypothesis.
Model II (VECM)
The next step used was VECM, which was estimated on the same factors as model I (CLRM), with the aim to verify the interrelations between GDP and selected macroeconomics variables. The adoption of the above-mentioned explanatory variables for GDP results from the make-up of the Cobb-Douglas component functions and research methodology adopted by many authors, among others, Dimelis–Papoioannou [11], Roman–Padureanu [65], and Driffield–Jindra [66], Kosztowniak [67].
The preparation of the VECM model was preceded by numerous tests (Asteriou, Dimitrios; Hall, Stephen (2011)). For all analyzed variables, it was found that they lacked stationarity of time series, but a unit root a = 1 occurred at process I(1). For each sequence separately, the ADF test was carried out with an absolute term and with an absolute term and a linear trend (Appendix A, Table A1). The test results confirmed the non-stationarity. Assuming that the null hypothesis is true, the empirical significance levels (p-values of the tests) proved that the probability of obtaining ADF test statistics was high for the majority of variables. Thus, there were no reasons for rejecting the hypotheses that the examined sequences were non-stationary. To verify the conclusions drawn on the basis of the ADF test, the KPSS (Kwiatkowski–Philips–Schmidt–Shin) stationarity test was carried out, where the null hypothesis assumed a sequence stationarity, whereas the alternative hypothesis assumed the occurrence of the unit root (Appendix A, Table A2).
Next, the Johannes test was carried out, which confirmed co-integration among the examined variables. In the Johansen test, all eigenvalues were significantly different from zero, which meant that all variables were stationary (Appendix A, Table A3). The next step was to determine the maximum lag order for the VAR model. According to the Akaike Information Criterion (AIC), the Bayesian Information Criterion (BIC) and the Hannana–Quinna Information Criterion (HQC), the maximum lag equals 2, at the appropriate lag equals 1.0 (Table 6).
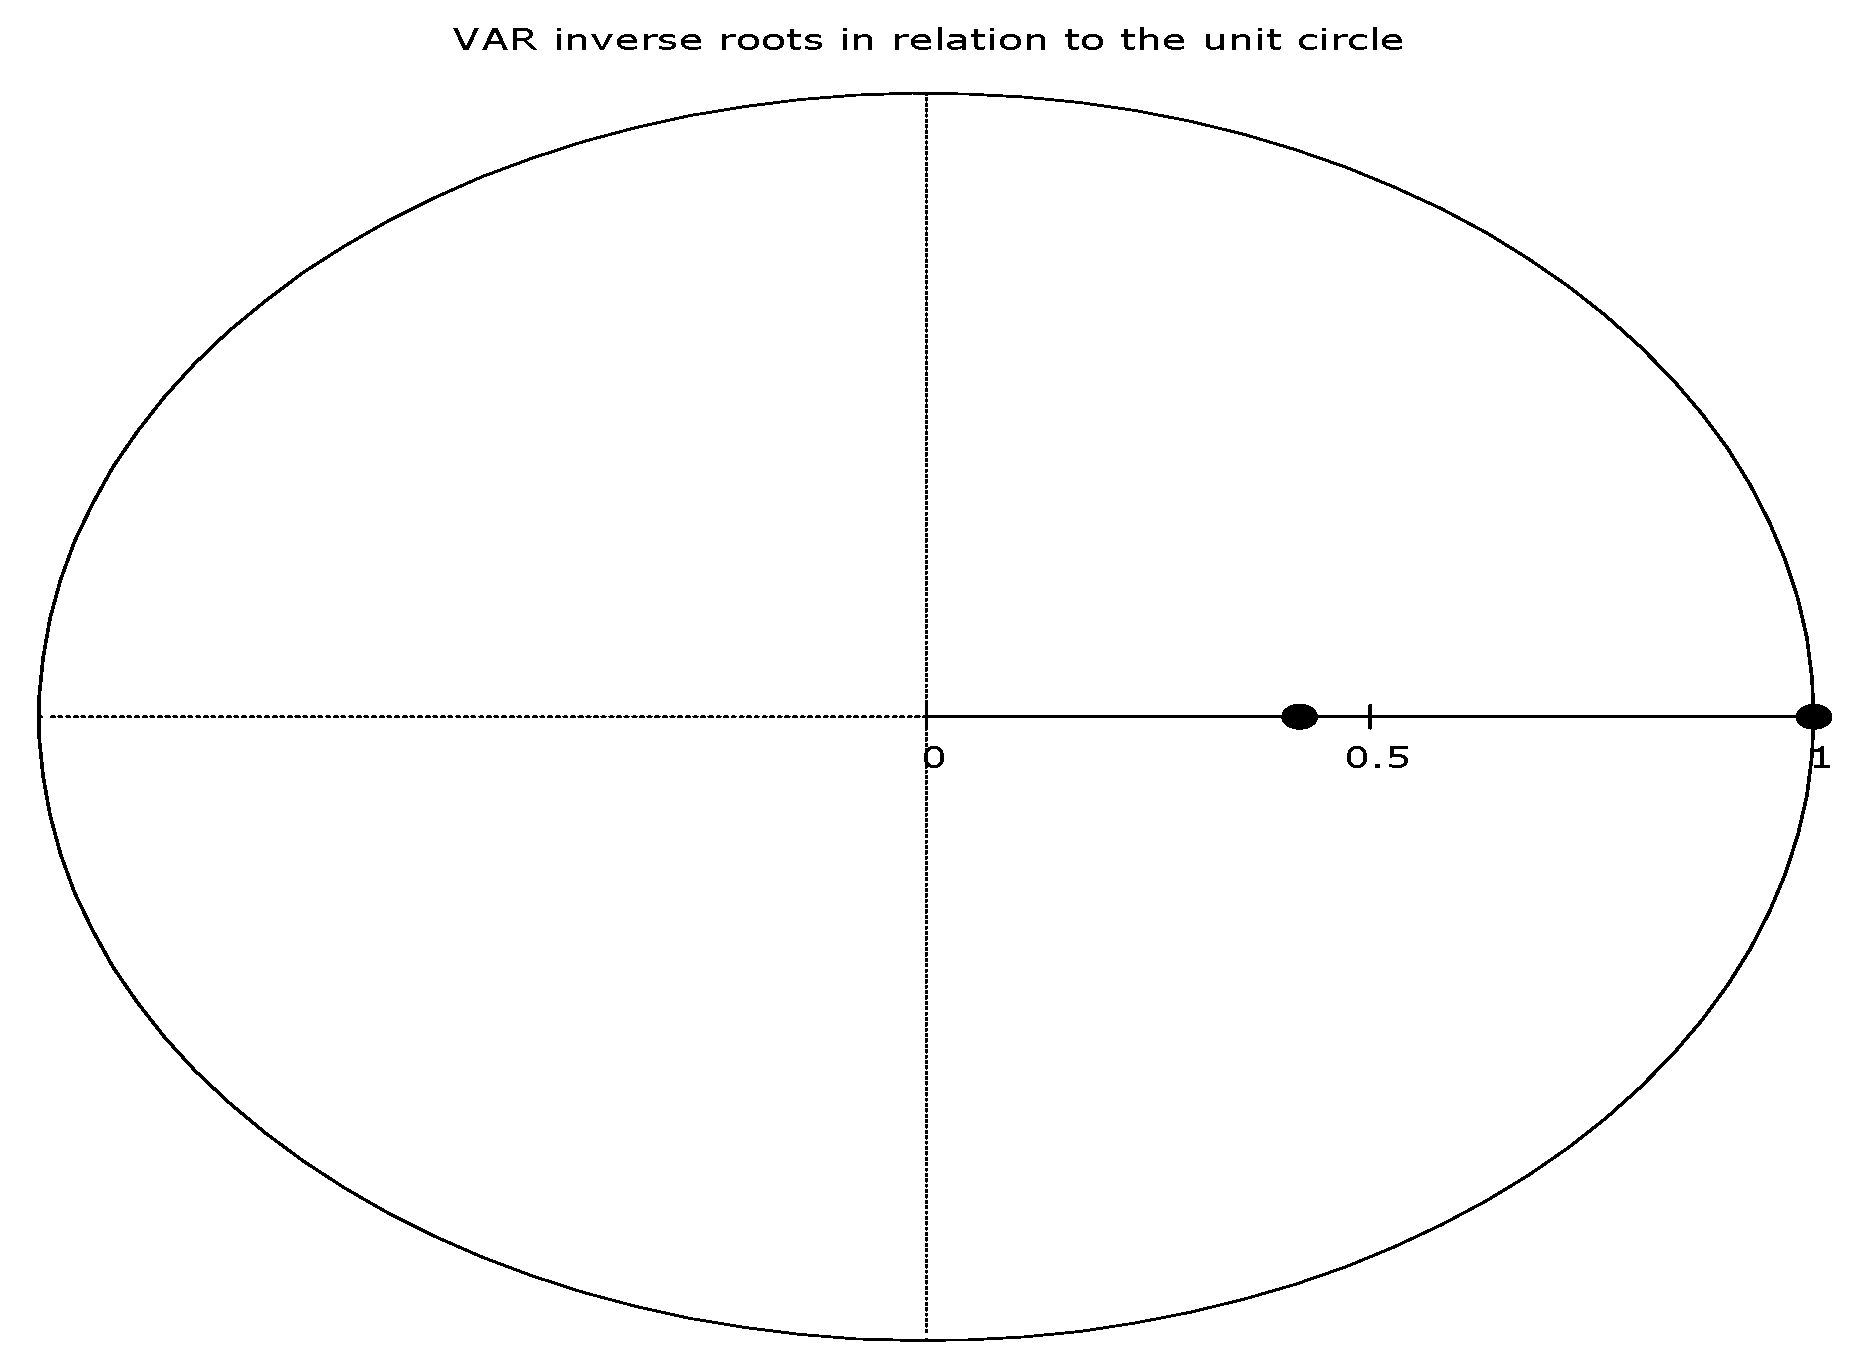
To analyze the Vector AutoRegressive Models (VAR) model stability, the unit root test was carried out (Figure 1). It revealed that in the analyzed model, all roots of the equations regarding the module were lower than 1.0.
Since the roots of the characteristic equation are inside the unit circle (lower than 1), it is possible to supplement the VAR model with the so-called component of error correction expressing the long-term relationship, and the interpretation of impulse responses and variance decomposition will give credible results. Furthermore, in accordance with the Granger representation theorem, if variables are integrated of order one I(1) and are co-integrated, the relationship between them can be represented as the VECM.
The Ljung–Box test was used to verify the occurrence of autocorrelation between the variables of the VECM model. The results of the Ljung–Box test for the estimated models, i.e., for all examined variables, showed that the empirical p-levels were higher than the nominal significance level = 0.05. This authorized us to state the lack of autocorrelation in the residual process.
4. Empirical Results
4.1. Impulse Response Functions
The graphs of GDP response functions to impulses of the model variables indicated that with time, the impulses of the seven variables exerted both an increasing as well as weakening impact on future values. Responses of the GDP dynamics revealed the increasing/enhancing effect of the impulses of three variables: own GDP, TGGR, GGST and GFCF in the period of one year, followed by the decreasing effect in period 3 and stabilizing effect from period 4 onwards. These results can be interpreted in such a way that the pillars of GDP growth in Poland are: TGGR, GGST, and GFCF. The results of research in this respect are important from the point of view of their application and mean that the economic policy should use the tools that support the social policy referring to levels of consumption, taxation, and investment (Figure 2).
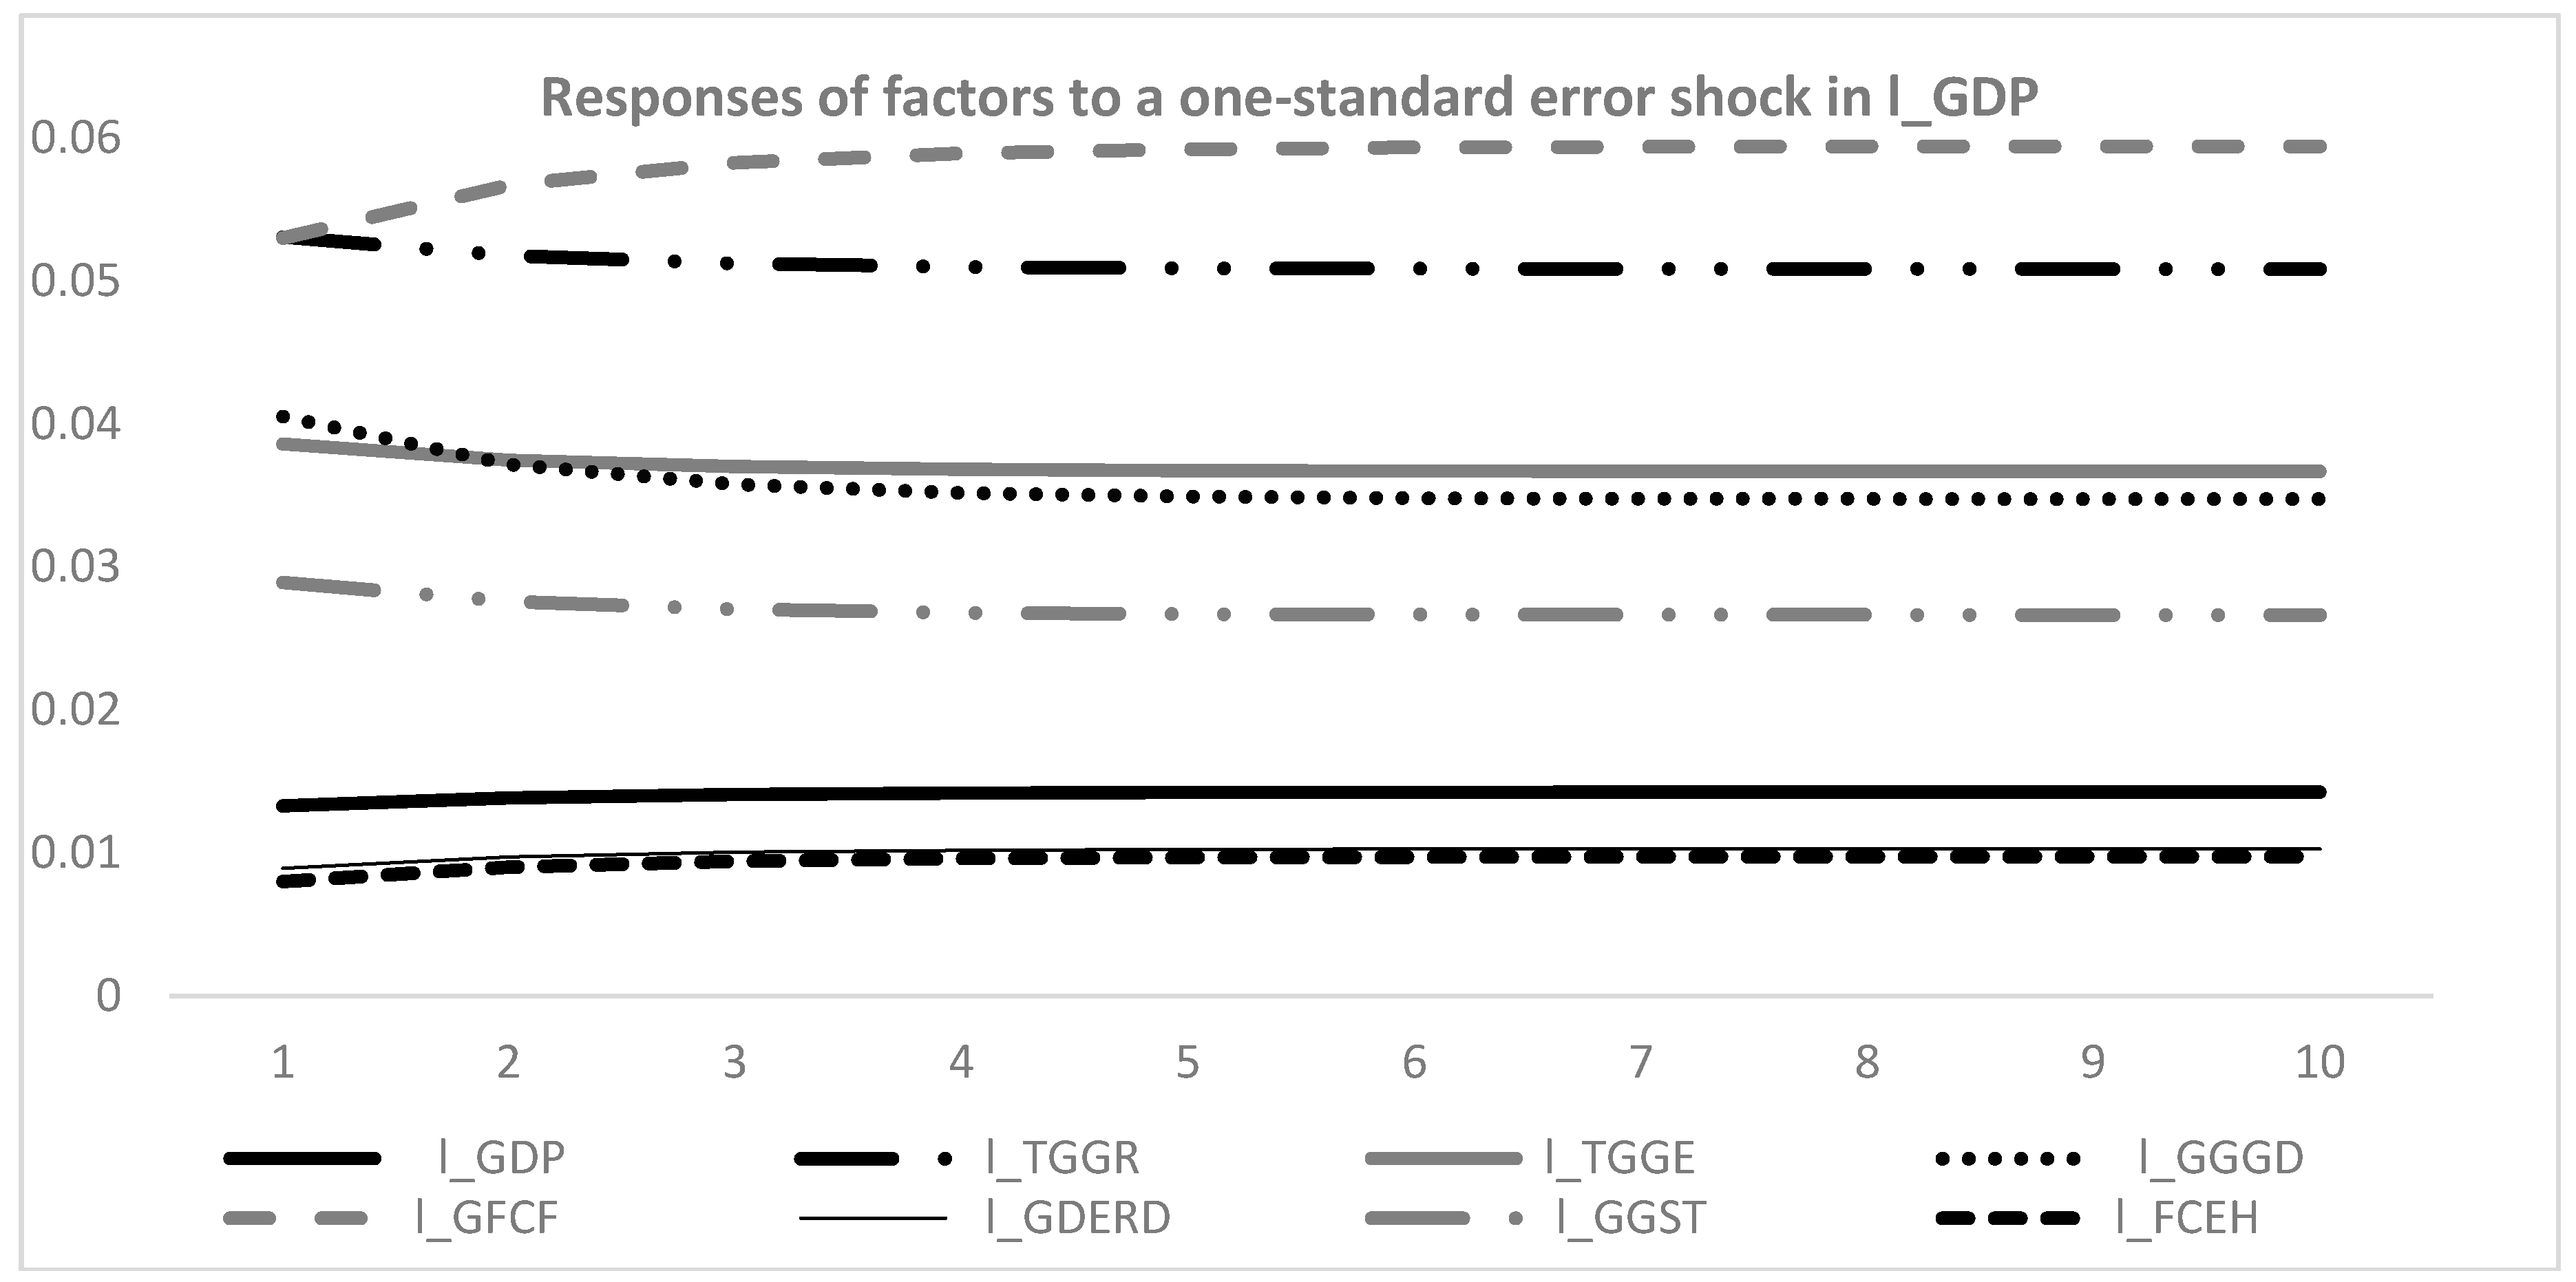
The graphs of the function responses of factors to one-standard error shock in I_GDP indicate that they increased as a result of the impulses coming from GDP in the period of the first two years, weakened in periods 3–4 and stabilized in the following periods. Changes of GDP influenced the strongest effect on GFCF, TGGR, TGGE (referred to H2) and GGGD. However, these changes of GDP error shock influenced the low effect on GDERD and FCEH (Figure 3). The reaction of explanatory variables to changes in GDP showed that GFCF, TGGR, GGGD, and TGGE were the most sensitive to changes in economic growth both in the short and long term. These results indicate the necessity to include them in the investment and fiscal policy pursued.
4.2. Variance Decomposition
In order to determine the explanation degree of changes in GDP and the examined remaining seven macroeconomic indicators in Poland from 1995 to 2016, the error variance decomposition was carried out for the VECM model variables. The adopted forecast horizon embraced 10 periods (years). This decomposition allowed us to discover the system dynamics showing the most significant places in the VAR/VECM structure and shows which shocks have the dominant effect on the standard error of each endogenous variable of the model.
The calculations of the GDP variance decomposition made on the logarithms showed that growth dynamics was explained to the greatest extent by the variances of own GDP forecasts (100.0% in period 1 and 72.13% in period 10) and from periods 2–10 by the dynamics of TGGR (3.7–12.4%), GGST (2.4–8.3%), and GFCF (1.9–6.4%) (Table 7).
The significance of cause-and-effect relations between the GDP changes and consumption expenditure (FCEH) was also confirmed by the analysis of the decomposition of these expenditures as well as the results of the CLRM model.
The analysis of FCEH decomposition (Table 8) indicated that the largest share in the explanation of these expenditures were GDP (from 25.08% to 17.38%) and GGST (from 18.75% to 40.26%). This means that social expenditures have a significant share in explaining changes in the consumer demand of households, and importantly, that their importance is growing over time. It is also worth noting that GFCH was largely explained by TGGR (from 4.50% to 35.032%). Thus, it is important to redistribute budget revenues including GGST, but also the sources of obtaining income by the state (taxes, budget deficit, and public debt). The decomposition of variance for 1_FCEH is presented in the Table 8.
Moreover, the decomposition of variance for other factors indicated the crucial part into forecasts for (from the first period to tenth period):
- TGGE had significant meanings from TGGR (81.90%, 77.87%) and GDP (11.67%, 12.82%) (refer to H2).
- GGGD had adequate TGGR (50.81%, 19.52%) and GDP (17.04%, 16.75%).
- GFCF had a GDP (68.96%, 31.81%) and own GFCF (24.08%, 32.12%).
- GDERD had a GFCF (20.07%, 27.72%) and GGGD (10.30%, 10.20%).
- GGST had a TGGR (75.84%, 73.79%) and GDP (10.71%, 13.17%).
- FCEH had a GDP (35.08%, 17.38%; refer to H1).
- GGST (18.75%, 40.26%) and TGGR (4.50%, 35.03%).
The decomposition results for TGGE confirmed the validity of H2. TGGR’s government revenue dependent on GDP and fiscal revenues had the largest share in their explanation.
5. Monetary Financial Institutions
The next stage of our analyses was to estimate the sources of finance by monetary financial institutions, especially for banks. We mainly concentrated on how the units play a crucial role in economic growth, e.g., non-financial corporation’s (enterprises) and households.
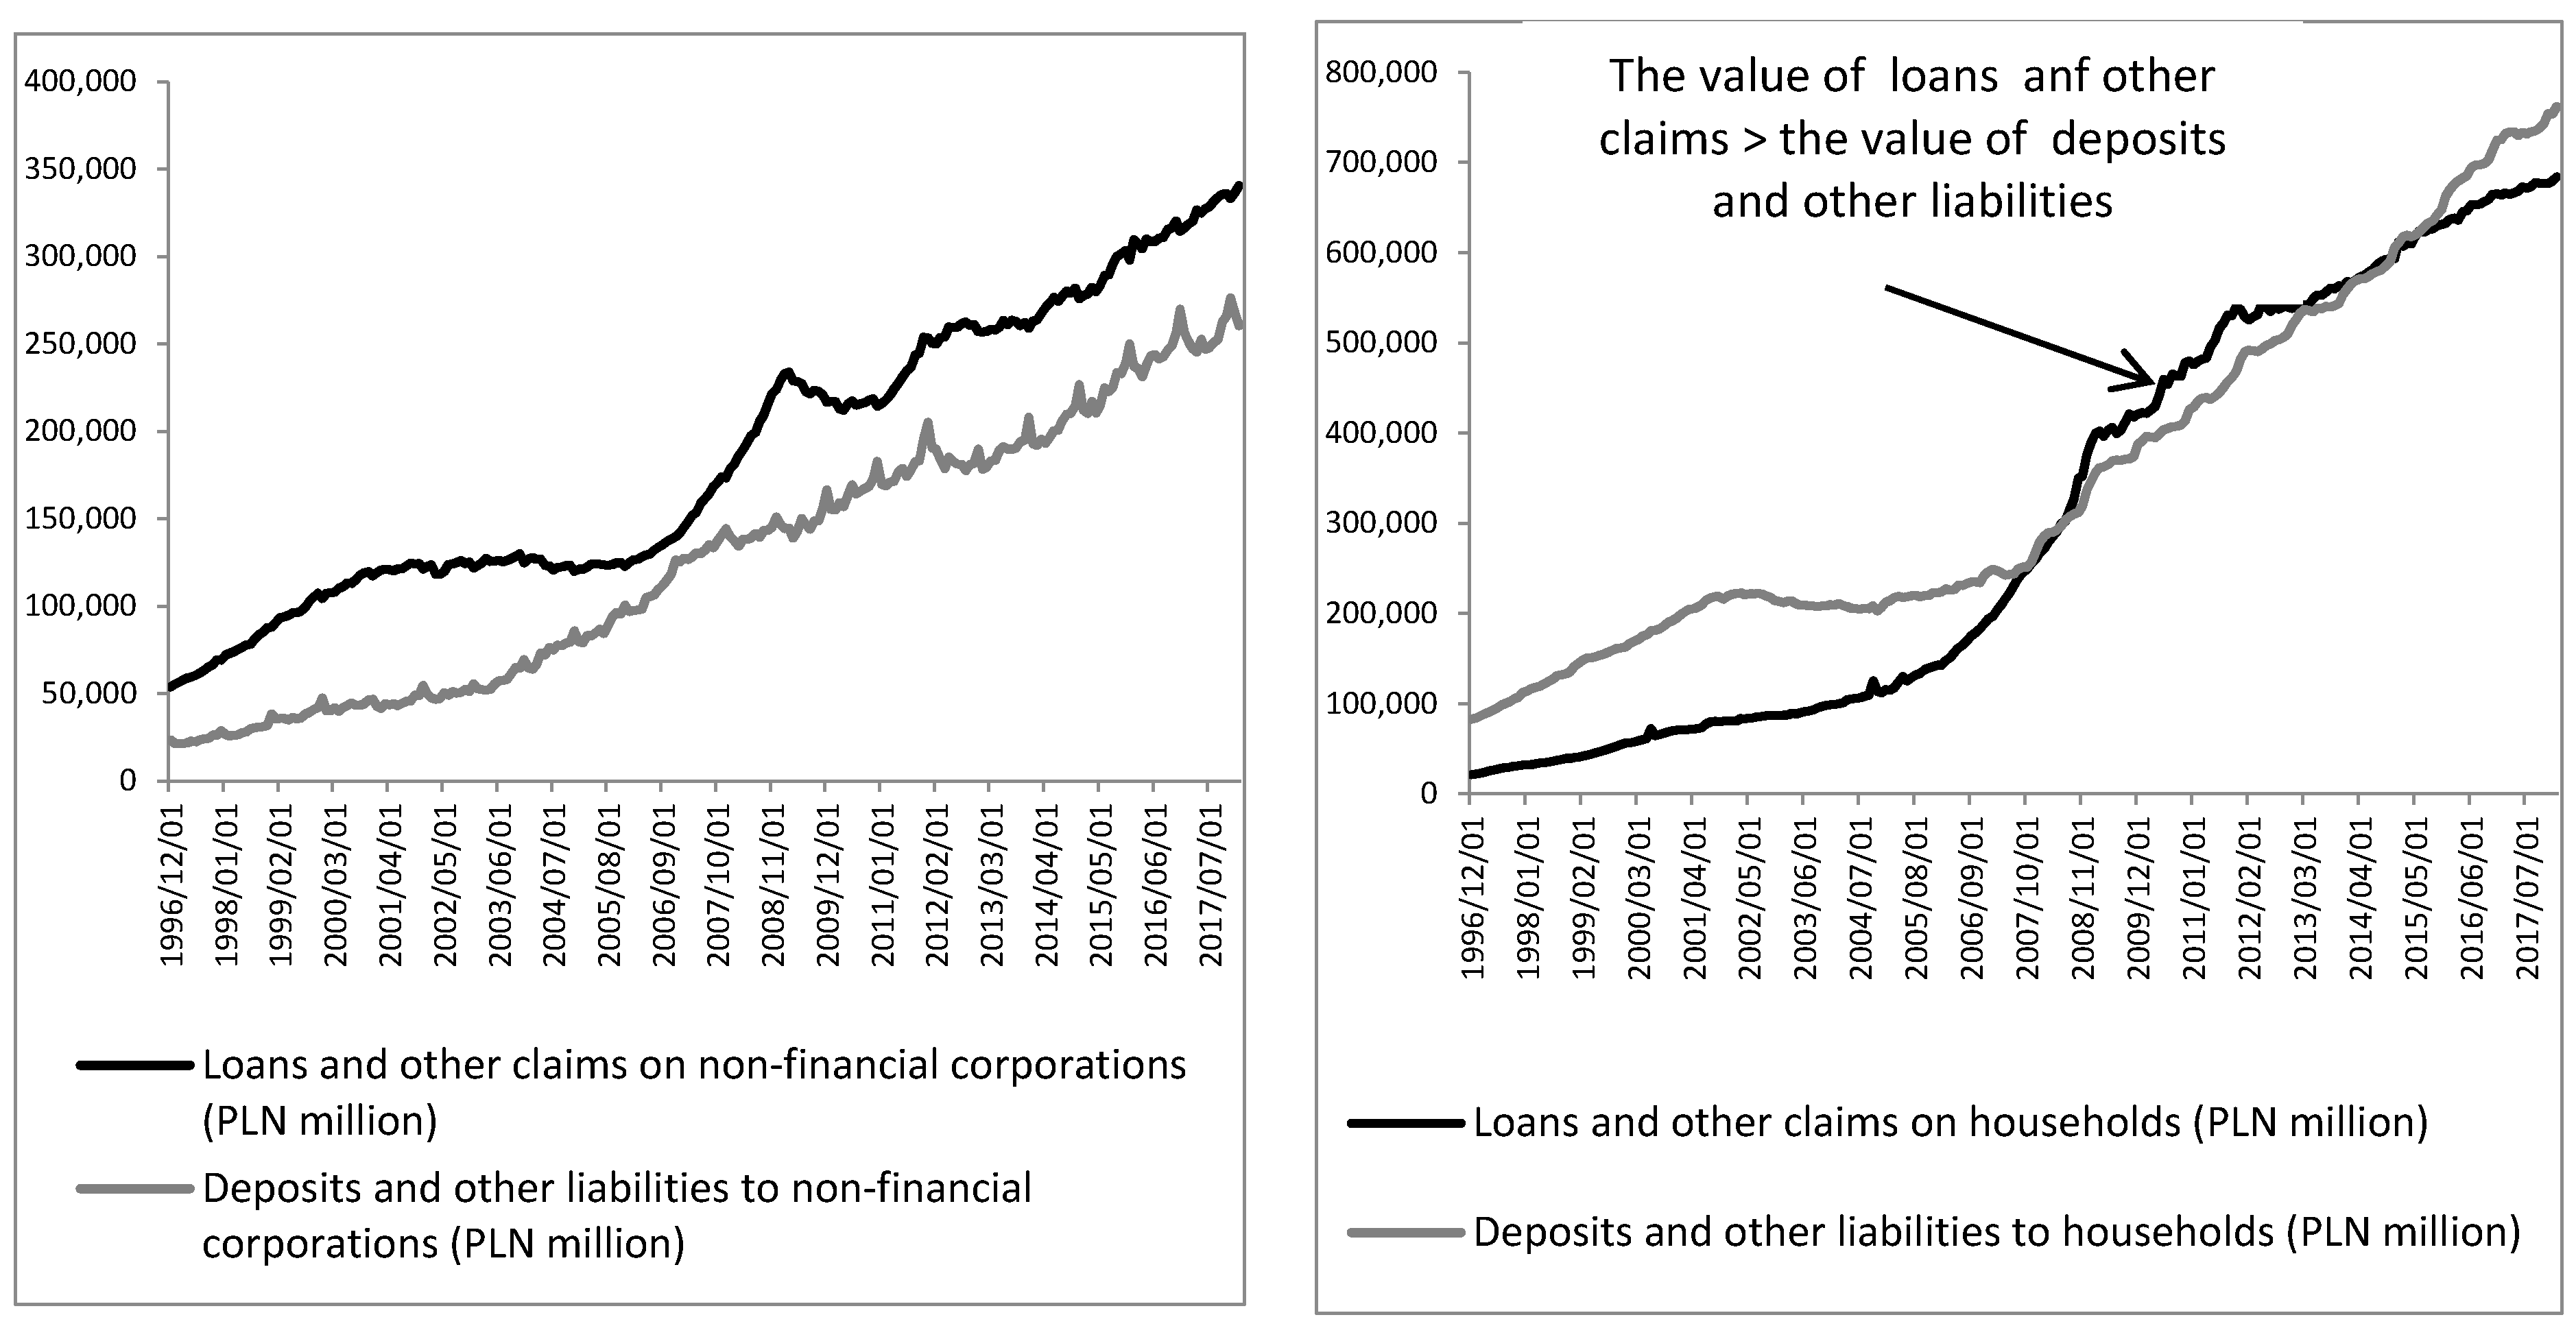
Figure 4 presents the total value of deposits and loans in the period of December 1996–February 2018 (monthly data). In the case that a non-financial corporation’s values of loans and other claims exceeds the deposits and other monetary financial institutions (MIFs) liabilities, it means that banks supported the corporations in financing economic activity, in this sense participating in the rate of GDP growth.
The other situation we have is in the case of households. In the analyzed period of 1996–2007 and 2015–2018, the value of deposits and other liabilities to households exceeded the value of loans and other MIFs’ claims on households. Between these periods, we had opposite situations, which means that in the period 2007–2014, the MIF’s given loans were higher than the accepted deposits and could support the final consumption expenditure of households. In these case MIFs (banks), created additional private consumption and economic growth. However, from 2015, banks provided financial support mainly for corporations.
6. Conclusions
In Poland, the main activities of sustainable development policy are focused on the distribution of EU funds (which clearly distinguishes Poland among other EU countries), that in large scale support the financing of the government’s policy for sustainable development. Such situation results in the direct relation between the EU and Polish sustainable development policy. The idea of sustainable development has an impact on both investors and customers. At the same time, the government is involved in economic activities, both as an owner and as an operator. This strengthens the cooperation among financial institutions, government and the society in Poland and indicates on unique features in relation to other EU countries. Therefore, sustainable development in Poland forces new approach and new ways of forging cooperation between the public and the private sector, especially the financial sector. Moreover, the specificity of the Polish economy (the prevalence of small enterprises, Poland as a developing EU country, the predominance of the use of EU funds) indicates the important role of the public sector in creating sustainable development.
This study had two objectives, achieved by the authors through the use of econometric models and the analysis of financial institutions (MFI). The first objective was to demonstrate the impact of public sector institutions and financial sector institutions on sustainable economic growth through public policy instruments. The second objective was to indicate that without mutual alliances (cooperation and interpenetration of activities and policies pursued), this increase would be possible.
The research (CLRM) carried out showed that the pillars of GDP growth in Poland were the final consumption expenditure of households (FCEH), total general government expenditure (TGGE), and total general government revenue (TGGR). The results of the said research are important from the perspective of their use and strengthen the claim that economic growth will be significantly influenced by the government’s actions in the field of spending policy [16]. This means that economic policy should use the tools supporting social policy regarding the level of consumption, taxation, and investment. The studies presented confirm the previously conducted analyses [1,23,25,30]. In addition, the conducted research (VECM) confirmed that there is a public sector impact on sustainable economic growth through public policy instruments aimed at GDP growth. Studies have shown that the significant factors are expense policy (measured by TGGE) and investment expenditure (measured by GFCF). It is a two-way relationship that, based on alliances with financial sector institutions, can contribute to shaping sustainable, sustainable development in Poland. Thus, the policy of alliances between financial institutions and the private sector may, due to the budget deficit and public debt caused by the expansive policy of stimulating sustainable development, justify the necessity to supplement private expenditure by state expenditure.
The results of the decomposition model carried out under the VECM model indicated a low share of total government expenditure in explaining GDP. However, social spending (GGST) and fixed investment expenditures (GFCF) had a clear pro-growth role and a significant share in the structure of these expenditures.
Poland is a good example for the analysis of the possibilities of achieving sustainable development based on the use of the potential and capabilities of each party in a social contract. This is due to the fact that, as a country undergoing systemic transformation, it is catching up with development disparities in relation to highly industrialized countries, has an effective and profitable banking system, and has achieved a high level of economic growth. In this context, it is necessary to examine whether the alliance between the banking and public sectors has contributed to the improvement of the social situations of society. One of the measures assessing this condition is the value of deposits collected by the banking sector and the value of loans granted. Banks, as a specialized entity, are able to assess whether a customer (both a natural person and enterprise) has the creditworthiness to settle its liabilities in a timely manner in the future. The government’s contribution to this process by increasing external financing from banks is to ensure a minimum (e.g., minimum subsistence level, minimum income levels, and social or welfare benefits) that provides security in the use of external sources of financing. Sustainable development based on government–banking alliances consists of the division of roles and responsibilities between these institutions within the framework of the state’s financial policy. The government provides legal regulations, an institutional environment, and financial resources at the level of minimum subsistence and enterprise development, and thus prepares potential customers of financial institutions to use repayable financial instruments (e.g., loans). Such processes will allow for an improvement in the social status, an increase in investments, and obtaining higher income among households and enterprises, and thus will contribute to the growth of GDP and sustainable development.
The model analysis carried out indicates that in countries of systemic transformation—such as Poland, it is important to stimulate consumer spending, which has about a 40% share in the GDP and positively affects sustainable development. The increase in the intentions of households contributes to the limitation of social spending, which has a limited stimulus effect on GDP.
The impact of financial sector institutions on economic growth should also be emphasized. Banks were supporting corporations in financing their business activities; in this sense, they were participating in the GDP growth rate. Thus, special attention should be paid to the alliances of public and financial sectors.
It has been demonstrated that public sector expenditure, stimulated by the activity of public institutions and public policy applied to consumer spending and investments, have a stimulating effect on economic growth and sustainable development.
Our research provides recommendations to the government regarding corrections to existing public policies, and thus the use of expenditure instruments and profitable public instruments. The results obtained may improve the relationship between the public sector and financial institutions by creating new or modifying existing financial instruments supporting public policies. The results of the research will allow the view on the relationship between GGGE and GDP to be enriched and the impact of the results on the directions of alliances with financial sector institutions.
In a situation where there is no government impulse and no public sources of public financing, households can (and should) use the offer of banking institutions targeted at household demand.
Our research could be extended by introducing into Model I [CLRM] and Model II [VECM] an aggregate indicator of sustainable development in the economic area. Unfortunately, such research is currently not possible in Poland due to the lack of data continuity. For other countries, such a study would give more comprehensive results and would widen the possibility of applying and building recommendations.
Further research in this area should focus on the analysis of income distribution in the national economy and the assessment of the significance of the trade balance with foreign countries. These changes based on the applied gradations of factors at this stage of research were omitted as determinants of the sustainable development phenomenon.
Author Contributions
A.A. contributed to the design of the article title, reviewed the literature and discussion, provided advice on results. B.Z.F. joined the literature review and discussion and contributed to writing the paper. A.K. provided advice of results reviewed the literature, tested the data, carried out model analysis and wrote the part of the manuscript. All authors have read and approved the final manuscript.
Funding
This research received no external funding.
Conflicts of Interest
The authors declare no conflict of interest.
Appendix A

Table A1.
Unit Root test—Stationarity test results on the basis of the Augmented Dickey-Fuller (ADF) test for the model variables.
Table A1.
Unit Root test—Stationarity test results on the basis of the Augmented Dickey-Fuller (ADF) test for the model variables.
| Specification | GDP | TGGR | TGGE | GGGD | GFCF | GDRRD | GGST | FCEH |
|---|---|---|---|---|---|---|---|---|
| Null hypothesis: unit root appears | a = 1; process I(1) | a = 1; process I(1) | a = 1; process I(1) | a = 1; process I(1) | a = 1; process I(1) | a = 1; process I(1) | a = 1; process I(1) | a = 1; process I(1) |
| ADF test with absolute term(const); Asymptotic p-value | p = 0.9995 | p = 0.7206 | p = 0.709 | p = 0.9854 | p = 0.9775 | p = 0.949 | p = 0.9998 | p = 0.8149 |
| ADF test with absolute term(const) and linear trend; Asymptotic p-value | p = 0.286 | p = 0.05222 | p = 0.7989 | p = 0.5435 | p = 0.3023 | p = 0.2176 | p = 0.01164 | p = 0.06227 |
Note: Lag order for ADF test equal 8. Source: Author’s own compilation with the use of the Gretl program.
Table A2.
Unit Root test—KPSS stationarity test results for the examined sequences.
| Specification | GDP | TGGR | TGGE | GGGD | GFCF | GDRRD | GGST | FCEH | |
|---|---|---|---|---|---|---|---|---|---|
| KPSS without a trend | Test statistic | 0.8337 | 0.745952 | 0.735452 | 0.76172 | 0.788668 | 0.725203 | 0.780045 | 0.837419 |
| Critical value | 0.356 (10%); 0.462 (5%); 0.6999 (1%) | ||||||||
| KPSS with a trend | Test statistic | 0.138967 | 0.109707 | 0.115219 | 0.113131 | 0.0750318 | 0.209524 | 0.112952 | 0.0659001 |
| Critical value of the test | 0.124 (10%); 0.149 (5%); 0.206 (1%) | ||||||||
Note: Lag order for KPSS test equal 2. Source: Author’s own compilation with the use of the Gretl program.
Table A3.
Johannes co-integration test results.
| Rank | Eigenvalue | Trace Test p-Value | Lmax Test p-Value | Corrected for Sample Size (df = 12) | |
|---|---|---|---|---|---|
| Rank | Trace Test p-Value | ||||
| 0 | 0.98423 | 270.51 [0.0000] | 87.145 [0.0000] | 0 | 270.51 [0.6557] |
| 1 | 0.96216 | 183.36 [0.0000] | 68.761 [0.0000] | 1 | 183.36 [0.6095] |
| 2 | 0.84509 | 114.60 [0.0011] | 39.163 [0.0597] | 2 | 114.60 [0.6789] |
| 3 | 0.75079 | 75.441 [0.0151] | 29.179 [0.1674] | 3 | 75.441 [0.5502] |
| 4 | 0.62446 | 46.262 [0.0687] | 20.567 [0.3137] | 4 | 46.262 [0.4473] |
| 5 | 0.55978 | 25.695 [0.1421] | 17.230 [0.1670] | 5 | 25.695 [0.3502] |
| 6 | 0.29781 | 8.4644 [0.4244] | 7.4247 [0.4490] | 6 | 8.4644 [0.5183] |
| 7 | 0.048302 | 1.0397 [0.3079] | 1.0397 [0.3079] | 7 | 1.0397 [0.3627] |
Note: Number of equations = 8; Lag order = 1; Estimation period: 1996–2016 (T = 21); Case 3: Unrestricted constant; Log-likelihood = 524.016 (including constant term: 464.42). Source: Author’s own compilation with the use of the Gretl program.
References
- Ashford, N.A.; Hall, R.P. Technology, Globalization, and Sustainable Development: Transforming the Industrial State; Yale University Press: New Haven, CT, USA, 2011. [Google Scholar]
- Ashford, N.A.; Hall, R.P. Primer on the Emergence and Evolution of Sustainable Development (1951 to 2012); Virginia Tech: Blacksburg, VA, USA, 2012. [Google Scholar]
- International Union for Conservation and Nature and Natural Resources (IUCN); United Nations Environment Programme (UNEP) & World Wildlife Fund (WWF). World Conservation Strategy; IUCN: Gland, Switzerland, 1980. [Google Scholar]
- Imperatives, S. Report of the World Commission on Environment and Development: Our Common Future; Oxford University Press: Oxford, UK; Oslo, Norway, 1987. [Google Scholar]
- The Rio Declaration on Environment and Development; Unesco: London, UK, 1992; Available online: http://www.unesco.org/education/nfsunesco/pdf/RIO_E.PDF (accessed on 23 July 2018).
- Gudmundsson, H.; Hall, R.P.; Marsden, G.; Zietsman, J. Sustainable Transportation Indicators, Frameworks, and Performance Management; Springer: Berlin/Heidelverg, Germany, 2016. [Google Scholar]
- Financial Stability, Financial Services and Capital Markets Union. Final Report 2018 by the High-Level Expert Group on Sustainable Finance Secretariat provided by the European Commission; European Commission: Brussels, Belgium, 2017. [Google Scholar]
- King, R.; Levine, R. Finance and Growth: Schumpeter Might be Right. Q. J. Econ. 1993, 108, 717–737. [Google Scholar] [CrossRef]
- What is Inclusive Growth? World Bank. 10 February 2009. Available online: http://siteresources.worldbank.org/INTDEBTDEPT/Resources/468980-1218567884549/WhatIsInclusiveGrowth20081230.pdf (accessed on 21 July 2018).
- The Principles for Positive Impact Finance—A Common Framework to Finance the Sustainable Development Goals; International Environment House: Geneva, Switzerland, 2016; Available online: http://www.unepfi.org/wordpress/wp-content/uploads/2017/01/POSITIVE-IMPACT-PRINCIPLES-AW-WEB.pdf (accessed on 23 July 2018).
- Dimelis, S.P.; Papaioannou, S.K. FDI and ICT Effects on Productivity Growth: A Comparative Analysis of Developing and Developed Countries. Eur. J. Dev. Res. 2010, 22, 79–96. [Google Scholar] [CrossRef]
- Sustainable Development Financing: Perspective from Asia and the Pacific; United Nations Economic and Social Commission for Asia and the Pacific: Bangkok, Thailand, 2014.
- Reengineering Development Cooperation Institutions to Deliver on the 2030 Agenda for Sustainable Development. Development Cooperation Forum Policy Briefs. 2016. No. 16. Available online: https://www.un.org/ecosoc/sites/www.un.org.ecosoc/files/publication/dcf-policy-brief-16.pdf (accessed on 23 July 2018).
- Scaling Up Finance for the Sustainable Development Goals: Experimenting with Models of Multilateral Development Banking; United Nations: New York, NY, USA; Geneva, Switzerland, 2018; Available online: http://unctad.org/en/PublicationsLibrary/gdsecidc2017d4_en.pdf (accessed on 23 June 2018).
- Brussa, A.; Tarnawa, A. Raport o Stanie Sektora Małych i Średnich Przedsiębiorstw w Polsce; PARP: Warszawa, Poland, 2017. [Google Scholar]
- Abu-Bader, S.; Abu-Qarn, A.S. Government Expenditures, Military Spending and Economic Growth: Causality Evidence from Egypt, Israel, and Syria. J. Policy Model. 2003, 25, 567–583. [Google Scholar] [CrossRef]
- Dao, M.Q. Public Policies, Institutions, and Economic Growth in Low-Income and Lower Middle-Income Countries: Further Empirical Evidence. Adv. Econ. Bus. 2017, 5, 440–447. [Google Scholar] [CrossRef]
- Dao, M.Q. Institutions and Development in Developing Countries: An Empirical Assessment. Perspect. Glob. Dev. Technol. 2011, 10, 327–338. [Google Scholar] [CrossRef]
- Barro, R.J. Determinants of Economic Growth: A Cross-Country Empirical Study. NBER Work. Pap. 1996, 5698. [Google Scholar] [CrossRef]
- Dandan, M.M. Government expenditures and economic growth in Jordan. In Proceedings of the International Conference on Economics and Finance Research, Singapore, 26–28 February 2011; Volume 4, pp. 467–471. [Google Scholar]
- Garba, T.; Abdullahi, S.Y. Public Expenditure and Economic Growth: An Application of Cointegration and Granger Causality Tests on Nigeria. J. Econ. Soc. Res. 2013, 15, 1–30. [Google Scholar]
- Udoka, C.O.; Anyingang, R.A. The Effect of Public Expenditure on the Growth and Development of Nigerian Economy (1980–2012). Int. Rev. Manag. Bus. Res. 2015, 4, 823–833. [Google Scholar]
- Nordhaus, W.D.; Tobin, J. Is Growth Obsolete? The Measurement of Economic and Social Performance; Moss, M., Ed.; National Bureau of Economic Research (Distributed by Columbia University Press): New York, NY, USA, 1973; pp. 509–532. [Google Scholar]
- Cobb, C.; Glickman, M.; Cheslog, C. The Genuine Progress Indicator 2001 Update. Edefining Progress Issue Brief. December 2001, pp. 1–6. Available online: https://www.researchgate.net/profile/Clifford_Cobb/publication/237470296_THE_GENUINE_PROGRESS_INDICATOR_2000_UPDATE/links/56fe2d0a08aee995dde673d1.pdf (accessed on 10 May 2018).
- Daly, H.E.; Cobb, J.B. For the Common Good. Redirecting the Economy toward Community, Environment, and a Sustainable Future; Beacon Press: Boston, MA, USA, 1989. [Google Scholar]
- Filipiak, B. Challenges of Sustainable Development in the New Financial Perspective—Financial Approach; Nachhaltigkeit, ökonomiche Gleichgewichte und Wertschöpfung; Witte, H., Ed.; Edi UNS: Bahia Blanca, Argentina, 2014; pp. 169–192. [Google Scholar]
- Neumayer, E. The ISEW: Not an index of sustainable economic welfare. Soc. Indic. Res. 1999, 48, 77–101. [Google Scholar] [CrossRef] [Green Version]
- Pollitt, H.; Barker, A.; Barton, J.; Pirgmaier, E.; Polzin, C.; Lutter, S.; Hinterberger, F.; Stocker, A. A Scoping Study on the Macroeconomic View of Sustainability; Final Report for the European Commission; DG Environment Cambrige: Vienna, Austria, 2010. [Google Scholar]
- Strategia na Rzecz Odpowiedzialnego Rozwoju do Roku 2020 (z Perspektywą do 2030 r.); Monitor Polski: Warszawa, Poland, 2017; Volume 260.
- Myles, G. Economic Growth and the Role of Taxation; Report for the OECD; OECD: Paris, France, March 2007; pp. 1–202. [Google Scholar]
- Stoilova, D.N. Tax structure and economic growth: Evidence from the European Union. Contad. Adm. 2017, 62, 1041–1057. [Google Scholar] [CrossRef]
- Stoilova, D.N.; Patonov, N. An empirical evidence for the impact of taxation on economy growth in the European Union. Tour. Manag. Stud. Int. Conf. Algarve 2012, 3, 1031–1039. [Google Scholar]
- Sahay, R.; Cihak, M.; N’Diaye, P.; Barajas, A.; Pena, D.A.; Bi, R.; Gao, Y.; Kyobe, A.; Nguyen, L.; Saborowski, C.; et al. Rethinking Financial Deepening: Stability and Growth in Emerging Markets. Rev. Econ. Inst. 2015, 17, 73–107. [Google Scholar] [CrossRef]
- Vartia, L. How Do Taxes Affect Investment and Productivity? Industry Level Analysis of OECD Countries; OECD Economics Department Working Papers; OECD Publishing: Paris, France, 2008. [Google Scholar]
- Njindan Iyke, B.N.; Takumah, W. The Links between Economic Growth and Tax Revenue in Ghana: An Empirical Investigation; Munich Personal RePEc Archive: Munich, Germany, 2015. [Google Scholar]
- De Los Ríos-Carmenado, I.; Ortuño, M.; Rivera, M. Private–Public Partnership as a Tool to Promote Entrepreneurship for Sustainable Development: WWP Torrearte Experience. Sustainability 2016, 8, 199. [Google Scholar] [CrossRef]
- Caracciolo, B.; Cheuvart, C.H.; Dragomirescu-Gaina, C.; Ntousas, V.S. (Eds.) Progressive Lab for Sustainable Development; Foundation for European Progressives Studies Solidar: Brusels, Belgium, 2017. [Google Scholar]
- Victor, P.A. Managing without Growth. Slower by Design, Not Disaster; Edward Elgar: Cheltenham, UK, 2008. [Google Scholar]
- OECD. General Statistics; OECD: Paris, France, 2018. [Google Scholar]
- Friedman, B.M. Crowding out or Crowding in? Economic Consequences of Financing Government Deficits. Brook. Pap. Econ. Act. 1978, 3, 594–654. [Google Scholar]
- Greiner, A.; Semmler, W. Endogenous Growth, Government Debt and Budgetary Regimes. J. Macroecon. 2000, 22, 363–384. [Google Scholar] [CrossRef]
- Xu, X.; Yan, Y. Does government investment crowd out private investment in China? J. Econ. Policy Reform 2014, 17, 1–12. [Google Scholar] [CrossRef] [Green Version]
- Bencivenga, V.R.; Smith, B.D. Financial Intermediation and Economic Growth. Rev. Econ. Stud. 1991, 58, 195–209. [Google Scholar] [CrossRef]
- Minsky, H.P. Can “It” Happen Again? Essays on Instability and Finance; Routledge: Abingdon, UK, 1982. [Google Scholar]
- Peetz, D.; Genreith, H. The financial sector and the real economy. Real-World Econ. Rev. 2011, 57, 41–47. [Google Scholar]
- Beck, T.; Degryse, H.; Kneer, C. Is More Finance Better? Disentangling Intermediation and Size Effects of Financial Systems; European Banking Center Discussion Paper; Tilburg University: Tilburg, The Netherlands, 2012; Volume 10, pp. 50–64. [Google Scholar]
- Amit, R.; Brander, J.; Zott, C. Why Do Venture Capital Firms Exist Theory and Canadian Evidence. J. Bus. Ventur. 1998, 13, 441–466. [Google Scholar] [CrossRef]
- Ravallion, M. Growth, Inequality and Poverty: Looking Beyond Averages. World Dev. 2001, 29, 1803–1815. [Google Scholar] [CrossRef] [Green Version]
- Barajas, M.A.; Beck, T.; Dabla-Norris, M.E.; Yousefi, M.R. Too Cold, Too Hot, or Just Right? Assessing Financial Sector Development across the Globe. IMF Work. Pap. 2013, WP/13/81, 14–18. [Google Scholar] [CrossRef]
- Tobin, J. On the Efficiency of the Financial System. Lloyds Bank Rev. 1984, 153, 1–5. [Google Scholar]
- Arcand, J.L.; Berkes, E.; Panizza, U. Too much finance? IMF Work. Pap. 2012, 20, 105–148. [Google Scholar] [CrossRef]
- Bańbuła, P. Polityka makroostrożnościowa: Przesłanki, cele, instrumenty i wyzwania. In Materiały i Studia; NBP: Karachi, Pakistan, 2013. [Google Scholar]
- Andrada, M.G. Sustainable development and CSR in the financial sector. Ann. Econ. Ser. 2015, 1, 217–221. [Google Scholar]
- NBP. Monetary and Financial Statistics. Assets and Liabilities of Monetary Financial Institutions. Available online: http://www.nbp.pl/homen.aspx?f=/en/statystyka/monetary-and-financial-statistics.html (accessed on 3 March 2018).
- Ullah, N. The Relationship of Government Revenue and Government Expenditure: A case study of Malaysia. Munich Pers. RePEc Arch. 2016, 69123, 1–20. [Google Scholar]
- Stiglitz, J.E.; Sen, A.; Fitoussi, J.P. Measurement of Economic. Performance and Social Progress; Working Paper; Columbia University: New York, NY, USA, 2009. [Google Scholar]
- Filipiak, B. Funding of joint investment projects of public institutions with private entities. Acta Aerarii Publ. 2016, 13, 15–23. [Google Scholar]
- Ardito, L.; Messeni Petruzzelli, A.; Albino, V. Investigating the antecedents of general purpose technologies: A patent perspective in the green energy field. J. Eng. Technol. Manag. 2016, 39, 81–100. [Google Scholar] [CrossRef]
- Tomaszewicz, Ł.; Trębska, J. The role of general government in the income redistribution in the Polish economy. J. Int. Stud. 2015, 8, 83–100. [Google Scholar] [CrossRef] [PubMed]
- Wooldridge, M.J. Introductory Econometrics. A Modern Approach, 5th ed.; South-Western Cengage Learning: Mason, OH, USA, 2012; pp. 168–186. [Google Scholar]
- Leamer, E. Vector Autoregressions for Causal Inference. Carnegie-Rochester Conf. Ser. Public Policy 1984, 22, 255–303. [Google Scholar] [CrossRef]
- Dungey, M.; Pagan, A.R. A Structural VAR Model of the Australian Economy. Econ. Rec. 2000, 76, 321–342. [Google Scholar] [CrossRef]
- Lütkepohl, H.; Saikkonen, P. Impulse response analysis in infinite order cointegrated vector autoregressive processes. J. Econom. 1997, 81, 127–157. [Google Scholar] [CrossRef]
- Kosztowniak, A. Foreign direct investment as a factor of economic growth in Poland. Empirical analysis for the period 1995–2012. In Advances in Economics and Business; Horizon Research Publishing Corporation: San Jose, CA, USA, 2013; Volume 1, pp. 203–212. [Google Scholar]
- Roman, M.D.; Padureanu, A. Models of Foreign Direct Investments Influence on Economic Growth. Evidence from Romania. Int. J. Trade Econ. Financ. 2012, 3, 1–5. [Google Scholar] [CrossRef]
- Driffied, N.; Jindra, B. Challenging the Production Function Approach to Assess the Developmental Effects of FDI. Eur. J. Dev. Res. Train. Inst. 2012, 24, 32–37. [Google Scholar] [CrossRef] [Green Version]
- Kosztowniak, A. Verification of the Relationship between FDI and GDP in Poland. Acta Oecon. 2016, 66, 307–332. [Google Scholar] [CrossRef]
- Asteriou, D.; Hall, S.G. Vector Autoregressive (VAR) Models and Causality Tests. Applied Econometrics, 2nd ed.; Palgrave MacMillan: London, UK, 2011; pp. 319–333. [Google Scholar]
- Piłatowska, M. Modelowanie Niestacjonarnych Procesów Ekonomicznych. Studium Metodologiczne; Uniwersytet M. Kopernik: Toruń, Polska, 2003; p. 192. [Google Scholar]
Scheme 1.
The idea of business support for sustainable development goals. Source: Own illustration.

Scheme 2.
Parties to the contract under sustainable development. Source: Own illustration.

Scheme 3.
Elements determining sustainable development–institutional approach. Source: Own illustration.
Scheme 3.
Elements determining sustainable development–institutional approach. Source: Own illustration.

Figure 1.
VAR inverse roots. Source: Own calculations on the basis of OECD [39], GRETL program.
Figure 1.
VAR inverse roots. Source: Own calculations on the basis of OECD [39], GRETL program.

Figure 2.
GDP responses to a one-standard error shock in other factors. Source: Author’s own compilation, OECD [39].
Figure 2.
GDP responses to a one-standard error shock in other factors. Source: Author’s own compilation, OECD [39].

Figure 3.
Responses of factors to a one-standard error shock in l_GDP. Source: Author’s own compilation, OECD [39].
Figure 3.
Responses of factors to a one-standard error shock in l_GDP. Source: Author’s own compilation, OECD [39].

Figure 4.
Monetary financial institutions (MIFs) deposits and loans by sectors in Poland from the period December 1996 to February 2018 (stocks in PLN millions). Source: Author’s own compilation: NBP (2018) [54].
Figure 4.
Monetary financial institutions (MIFs) deposits and loans by sectors in Poland from the period December 1996 to February 2018 (stocks in PLN millions). Source: Author’s own compilation: NBP (2018) [54].

Table 1.
Structure of central government expenditure in Poland from 2007 to 2015 (%).
| 2007 | 2008 | 2009 | 2010 | 2011 | 2012 | 2013 | 2014 | 2015 | |
|---|---|---|---|---|---|---|---|---|---|
| General public services | 18.54 | 17.24 | 19.88 | 19.40 | 19.71 | 20.92 | 21.95 | 20.26 | 19.12 |
| Defense | 7.90 | 7.47 | 5.92 | 5.95 | 6.10 | 5.94 | 6.91 | 6.49 | 6.83 |
| Public order and safety | 8.40 | 8.49 | 8.66 | 8.13 | 8.21 | 8.46 | 8.71 | 9.15 | 9.06 |
| Economic affairs | 12.77 | 13.54 | 13.53 | 13.03 | 13.71 | 12.98 | 9.54 | 12.58 | 13.16 |
| Environmental protection | 0.41 | 0.58 | 0.46 | 0.56 | 0.75 | 0.65 | 0.83 | 1.02 | 0.82 |
| Housing and community amenities | 0.85 | 0.84 | 0.66 | 0.39 | 0.97 | 0.80 | 0.93 | 0.75 | 0.75 |
| Health | 4.27 | 4.52 | 4.31 | 4.27 | 4.41 | 4.78 | 5.10 | 5.33 | 5.16 |
| Recreation; culture and religion | 1.46 | 1.63 | 1.33 | 1.40 | 1.23 | 1.19 | 1.18 | 1.22 | 1.25 |
| Education | 19.07 | 18.53 | 15.33 | 15.01 | 16.09 | 16.42 | 16.60 | 17.67 | 17.35 |
| Social protection | 26.31 | 27.17 | 29.92 | 31.85 | 28.83 | 27.85 | 28.24 | 25.53 | 26.48 |
| Total | 99.98 | 100.01 | 100.00 | 99.99 | 100.01 | 99.99 | 99.99 | 100.00 | 99.98 |
Source: OECD Stat. [39].
Table 2.
Explained variables included in econometric models.
| Indicators | Justification for the Choice | |
|---|---|---|
| TGGR | Total General Government Revenue | The latest research on the impact of TGGE on GBP is presented by Ullah [55], the importance of this indicator is also indicated by Stiglitz [56], income policy, especially in the area of taxation is an important factor affecting the behavior of society and is the basis for the implementation of expense policy. Studies show a relationship between GDP and TGGE [17,30,31,32,33]. |
| TGGE | Total General Government Expenditure | The importance of this indicator is indicated, among others, by Stiglitz [56]. Research indicates expenses as important factors in shaping the policy of sustainable development [16,20,23,25] as well as consumption of the society. |
| GGGD | Gross General Government Debt | The indicator points to alliances between financial institutions and the public sector. The rules in force in Poland indicate that among debt instruments, over 90% are instruments acquired from the financial sector. This fact, as well as dependence, are confirmed by research [12,21]. |
| GFCF | Gross Fixed Capital Formation | Public investments have a direct impact on the directions of spending through implemented policies. For many years, Poland has been implementing a policy of sustainable development through investment expenditures. The basic factor affecting GDP in the classic approach [38,57]. |
| GDERD | Gross Domestic Expenditure on R&D | The factor responsible for sustainable development as the policy of responsible financing of R&D spending implements the policy of sustainable development in many areas of the economy. The programs existing in Poland direct government spending to achieve the goals of responsible sustainable development. Particular importance for spending on sustainable development (development of green technologies) is demonstrated in the paper of Ardito et al. [58]. |
| GGST | General Government, Social Benefits other than social transfers in kind, payable | This influence was analyzed in the literature on the subject [59]. |
| FCEH | Final Consumption Expenditure of Households | Consumption includes the value of products used to meet the direct, individual and collective needs of the population. The basic factor affecting GDP in the classic approach [25,42]. |
Source: Own work.
Table 3.
Summary statistics using the observations from 1995 to 2016.
| Variable | Mean | Median | Minimum | Maximum | Std. Dev. | C.V. | Skewness | Ex. Kurtosis |
|---|---|---|---|---|---|---|---|---|
| l_GDP | 13.399 | 13.392 | 12.954 | 13.770 | 0.25281 | 0.018869 | −0.12531 | −1.2526 |
| l_TGGR | 11.704 | 11.794 | 11.037 | 12.288 | 0.47360 | 0.040465 | −0.11570 | −1.7257 |
| l_TGGE | 11.803 | 11.882 | 11.128 | 12.373 | 0.47602 | 0.040331 | −0.13582 | −1.6934 |
| l_GGGD | 11.840 | 11.930 | 11.046 | 12.584 | 0.60971 | 0.051494 | −0.11733 | −1.7024 |
| l_GFCF | 11.754 | 11.706 | 11.041 | 12.210 | 0.32892 | 0.027983 | −0.36728 | −0.86071 |
| l_GDERD | 8.4059 | 8.2007 | 7.8678 | 9.1509 | 0.41200 | 0.049013 | 0.63344 | −1.0414 |
| l_GGST | 10.749 | 10.823 | 10.080 | 11.271 | 0.43098 | 0.040094 | −0.19200 | −1.6201 |
| l_FCEH | 12.901 | 12.891 | 12.449 | 13.230 | 0.22928 | 0.017772 | −0.28431 | −1.0388 |
Source: Own calculations on the basis of OECD [39], GRETL program.
Table 4.
Estimation of GDP values in Poland by the CLRM for the period 1995–2016 (input data, dependent variable: l_GDP).
Table 4.
Estimation of GDP values in Poland by the CLRM for the period 1995–2016 (input data, dependent variable: l_GDP).
| Coefficient | Std. Error | t-Ratio | p-Value | α | |
|---|---|---|---|---|---|
| const | 1.07607 | 0.763964 | 1.409 | 0.1808 | |
| l_TGGR | 0.258227 | 0.0961620 | 2.685 | 0.0178 | ** |
| l_TGGE | −0.278215 | 0.100377 | −2.772 | 0.0150 | ** |
| l_GGGD | 0.0841720 | 0.0495928 | 1.697 | 0.1118 | |
| l_GFCF | −0.0257589 | 0.0415463 | −0.6200 | 0.5452 | |
| l_GDERD | 0.0563928 | 0.0208750 | 2.701 | 0.0172 | ** |
| l_GGST | −0.0134754 | 0.134321 | −0.1003 | 0.9215 | |
| l_FCEH | 0.896105 | 0.113199 | 7.916 | <0.0001 | *** |
| R-squared | 0.998772 | F(7,14) | 1626.859 | DW | 2.244204 |
Where α = 0.01 (***), where α = 0.05 (**). Source: Own calculations on the basis of OECD [39], GRETL program.
Table 5.
Estimation of the GDP value in Poland by the CLRM, for the period 1995–2016, final data (Dependent variable: l_GDP).
Table 5.
Estimation of the GDP value in Poland by the CLRM, for the period 1995–2016, final data (Dependent variable: l_GDP).
| Coefficient | Std. Error | t-Ratio | p-Value | α | |
|---|---|---|---|---|---|
| const | 1.29689 | 0.322453 | 4.022 | 0.0010 | *** |
| l_TGGR | 0.234262 | 0.0719700 | 3.255 | 0.0050 | *** |
| l_TGGE | −0.287453 | 0.0882478 | −3.257 | 0.0049 | *** |
| l_GGGD | 0.103553 | 0.0360383 | 2.873 | 0.0110 | ** |
| l_GDERD | 0.0513640 | 0.0163736 | 3.137 | 0.0064 | *** |
| l_FCEH | 0.859975 | 0.0399160 | 21.54 | <0.0001 | *** |
| R-squared | 0.998737 | F(5,16) | 2530.486 | DW | 2.057113 |
Where α = 0.01 (***), where α = 0.05 (**). Source: Own calculations based on OECD [39], GRETL program.
Table 6.
Values of the respective information criteria.
| lags | Loglike | p(LR) | AIC | BIC | HQC |
|---|---|---|---|---|---|
| 1 | 69.09266 | −6.009266 * | −5.561186 * | 5.921796 * | |
| 2 | 69.21381 | 0.62255 | −5.921381 | −5.423515 | −5.824192 |
Where * indicates lag order selected by the criterion. Source: Own calculations based on OECD [39], GRETL program.
Table 7.
Variance decomposition for the variable l_GDP.
| l_GDP | l_TGGR | l_TGGE | l_GGGD | l_GFCF | l_GDERD | l_GGST | l_FCEH | |
|---|---|---|---|---|---|---|---|---|
| 1 | 100.0 | 0.0000 | 0.0000 | 0.0000 | 0.0000 | 0.0000 | 0.0000 | 0.0000 |
| 2 | 91.7437 | 3.6670 | 0.0001 | 0.0160 | 1.8883 | 0.0537 | 2.4584 | 0.1729 |
| 3 | 84.9908 | 6.6662 | 0.0001 | 0.0291 | 3.4328 | 0.0976 | 4.4691 | 0.3143 |
| 4 | 80.6068 | 8.6133 | 0.0001 | 0.0375 | 4.4355 | 0.1261 | 5.7745 | 0.4061 |
| 5 | 77.7600 | 9.8777 | 0.0002 | 0.0431 | 5.0866 | 0.1446 | 6.6221 | 0.4657 |
| 6 | 75.8374 | 10.7316 | 0.0002 | 0.0468 | 5.5263 | 0.1571 | 7.1946 | 0.5059 |
| 7 | 74.4802 | 11.3344 | 0.0002 | 0.0494 | 5.8368 | 0.1660 | 7.5987 | 0.5343 |
| 8 | 73.4824 | 11.7776 | 0.0002 | 0.0513 | 6.0650 | 0.1725 | 7.8958 | 0.5552 |
| 9 | 72.7226 | 12.1150 | 0.0002 | 0.0528 | 6.2387 | 0.1774 | 8.1221 | 0.5711 |
| 10 | 72.1266 | 12.3798 | 0.0002 | 0.0540 | 6.3751 | 0.1813 | 8.2995 | 0.5836 |
Source: Author’s own compilation: OECD [39].
Table 8.
Decomposition of variance for l_FCEH.
| l_GDP | l_TGGR | l_TGGE | l_GGGD | l_GFCF | l_GDERD | l_GGST | l_FCEH | |
|---|---|---|---|---|---|---|---|---|
| 1 | 35.0766 | 4.5034 | 3.8923 | 7.1293 | 15.0766 | 9.5032 | 18.7540 | 6.0645 |
| 2 | 27.5027 | 20.1342 | 2.7186 | 4.3342 | 5.2181 | 5.3631 | 32.0203 | 2.7088 |
| 3 | 23.2104 | 26.9274 | 2.1468 | 3.1279 | 3.0982 | 3.6707 | 36.2689 | 1.5496 |
| 4 | 20.9490 | 30.1884 | 1.8600 | 2.5506 | 2.5154 | 2.8798 | 38.0036 | 1.0532 |
| 5 | 19.6463 | 31.9895 | 1.6983 | 2.2321 | 2.3097 | 2.4487 | 38.8804 | 0.7951 |
| 6 | 18.8294 | 33.0961 | 1.5979 | 2.0366 | 2.2188 | 2.1856 | 39.3941 | 0.6414 |
| 7 | 18.2807 | 33.8320 | 1.5308 | 1.9066 | 2.1702 | 2.0112 | 39.7275 | 0.5408 |
| 8 | 17.8912 | 34.3519 | 1.4833 | 1.8148 | 2.1400 | 1.8882 | 39.9601 | 0.4704 |
| 9 | 17.6022 | 34.7368 | 1.4481 | 1.7469 | 2.1191 | 1.7972 | 40.1313 | 0.4184 |
| 10 | 17.3799 | 35.0325 | 1.4210 | 1.6947 | 2.1036 | 1.7273 | 40.2624 | 0.3785 |
Source: Author’s own compilation: OECD [39].
© 2018 by the authors. Licensee MDPI, Basel, Switzerland. This article is an open access article distributed under the terms and conditions of the Creative Commons Attribution (CC BY) license (http://creativecommons.org/licenses/by/4.0/).
Share and Cite
MDPI and ACS Style
Alińska, A.; Filipiak, B.Z.; Kosztowniak, A. The Importance of the Public Sector in Sustainable Development in Poland. Sustainability 2018, 10, 3278. https://0-doi-org.brum.beds.ac.uk/10.3390/su10093278
AMA Style
Alińska A, Filipiak BZ, Kosztowniak A. The Importance of the Public Sector in Sustainable Development in Poland. Sustainability. 2018; 10(9):3278. https://0-doi-org.brum.beds.ac.uk/10.3390/su10093278
Chicago/Turabian StyleAlińska, Agnieszka, Beata Zofia Filipiak, and Aneta Kosztowniak. 2018. "The Importance of the Public Sector in Sustainable Development in Poland" Sustainability 10, no. 9: 3278. https://0-doi-org.brum.beds.ac.uk/10.3390/su10093278
Note that from the first issue of 2016, this journal uses article numbers instead of page numbers. See further details here.