Research on Geospatial Association of the Urban Agglomeration around the South China Sea Based on Marine Traffic Flow


1
Collaborative Innovation Center of South China Sea Studies, Nanjing University, Nanjing 210093, China
2
Key Laboratory of Geographic Information Science and Technology, Nanjing University, Nanjing 210023, China
3
School of Geography and Ocean Science, Nanjing University, Nanjing 210023, China
*
Author to whom correspondence should be addressed.
Sustainability 2018, 10(9), 3346; https://0-doi-org.brum.beds.ac.uk/10.3390/su10093346
Submission received: 16 August 2018
/
Revised: 14 September 2018
/
Accepted: 16 September 2018
/
Published: 19 September 2018
(This article belongs to the Special Issue Building Regional Sustainability in Urban Agglomeration: Theories, Methodologies, and Applications)
Abstract
:Studying the geospatial association within the urban agglomeration around the South China Sea can provide a basis for understanding the internal development of the China-Association of Southeast Asian Nations (ASEAN) Free Trade Area (CAFTA) and provide ideas for promoting economic and trade cooperation among cities in the region. The purpose of this paper was to reflect the characteristics of the urban agglomeration association network based on big traffic data. Based on trajectory data mining and complex network analysis methods, the automatic identification system (AIS) data was used to construct the traffic flow association network of the urban agglomeration around the South China Sea and then analysis and evaluation were carried out in three aspects: Spatial distribution characteristics of marine traffic flow, analysis of spatial hierarchy and internal difference analysis of the urban agglomeration. The results show the following: (1) The distribution of marine traffic flow within the urban agglomeration around the South China Sea is characterized by polarization and localization and shows a specific power-law distribution; (2) there is a close relationship within the urban agglomeration and the core urban and the marginal urban agglomerations were apparent; (3) subgroup division of urban agglomeration around the South China Sea shows an evident geographic agglomeration phenomenon and there were significant differences between the level of economic development among subgroups; and (4) relative to static factors such as population size and economic aggregate, dynamic flow of information and capital traffic flow plays a more important role in the spatial correlation between cities. Strengthening the links among the three layers of core-intermediate-edge cities through trade and investment means enhancing cooperation among cities within the urban agglomeration and ultimately promoting sustainable regional development.
1. Introduction
Since the 1990s, regional economic integration characterized by Regional integration agreement (RIA) has rapidly advanced from Europe and North America to Asia. On the other hand, the process of economic integration in Southeast Asia has been very slow. The study of the complex law of the spatial structure of regional economic relations has become the key area of regional geography and economic geography research [1]. As one of the core aspects of regional economic research, geospatial association and related fields have also become key areas of spatial economics and urban geography research [2]. In this context, the study of the spatial association between urban agglomerations can provide a basis for analyzing development and cooperation among countries and provide ideas for promoting wide-area, deep-level and all-around cooperation among regional cities.
Spatial economic agglomeration is an important feature of economic development and transportation cost is one of the main factors of spatial economic agglomeration [3,4]. First, distance constraints directly affect regional economic development [5,6] and distance is an important dimension at the national level. Especially for the regional urban agglomerations, because the spatial extent often spans multiple countries; the development level within the urban agglomerations has a large gap [7]. Therefore, distance becomes an important factor for understanding the development of urban agglomerations and the larger the urban agglomeration, the more important the distance. Secondly, transportation infrastructure conditions (such as roads, railways, waterways, and ports) are important factors in inter-regional trade [8,9,10] and together with the distance constitute the determinants of transportation costs. High transportation costs cause scarcity of trade between regions, which in turn leads to a large-scale economy that cannot achieve agglomeration effects. In addition, inter-country trade barriers are also an integral part of transportation costs [11], which mitigates the geographical concentration of the economy while also protecting the interests of some slow-growing regions.
In previous studies, scholars tended to use location entropy, the Gini coefficient, and the EG index to identify spatial agglomeration characteristics. In addition, scholars also used Getis-Ord and Moran’s I index for spatial autocorrelation analysis [12] and exploratory spatial data analysis (ESDA) to analyze the topological relationships of entities in each region [13]. However, the methods of measuring agglomeration are mainly based on the spatial distribution of administrative divisions, which leads to the possibility that important differences within administrative divisions may be hidden. In fact, because objective data such as the flow of people, capital, and information flow among cities is difficult to obtain, few studies have studied the spatial structure and associated features of spatial interaction based on point entities. With the emergence of urban big data, data-acquisition capabilities and data-mining capabilities have greatly improved. Finding scientific and reasonable parameters has become an important basis for the study of urban agglomerations, that is, the specific relational data that is used is the key to studying the urban agglomeration association network. Automatic Identification System (AIS) data contain a large number of maritime traffic characteristics, from which marine ship behavior characteristics can be obtained. Benefiting from the progress of trajectory data-mining theory and methods in recent years, it is possible to mine and analyze the internal association of urban agglomerations based on AIS data.
The rest of the paper is organized as follows: Section 2 provides a literature review of the theoretical framework and measurement methods of urban agglomeration geospatial associations, Section 3 describes the study area and data preprocessing, Section 4 describes the method of association measurement for the urban agglomeration, Section 5 describes the urban agglomeration association network constructed by marine traffic flow and the community detection method and core-periphery theory are used to obtain the subgroup structure of the urban agglomeration around the South China Sea. finally, Section 6 provides concluding observations.
2. Literature Review
Research on the spatial association of urban agglomerations was first seen in a study of the hierarchical network of urban systems by Friedman [14]. They believed that the spatial structure of urban agglomeration included the core areas of the metropolis and the fringe areas between the cities and the former has achieved a very high level of economic and cultural development at the expense of the latter. In the 1990s, related research entered an in-depth development stage. Bill Scott divided the spatial structure evolution of urban agglomerations into three phases: Single center (central city-led stage), multi-center (central city and suburban competition stage) and networking (complex interdependence and competing stages). P.J. Taylor, an economic geographer, believes that having efficient connections among cities is the main way to achieve regional economic integration. After entering the information age, with the development of communication and transportation facilities, urban agglomerations may adopt a more loose and open spatial structure, such as network cities and information cities [15].
The commonly used methods in the spatial association measure of urban agglomeration are fractal theory [16], the economic linkage strength model [17], the gravitational model [18] and network analysis [19]. The gravitational model reflects the relationship between spatial interaction and distance: The closer the distance is, the greater the interaction force [20] and more elements such as population and funds can be attracted. The network analysis method constructs the urban association network through nodes and various relationships and can portray the network of national political and economic relations and its dynamic changes [21]. Due to a lack of real data support in the past, the gravitational model based on spatial interaction was used to simulate the size of the urban external service to define its status. However, the inferred association network is not a practical connection within the urban agglomeration and the results of deductive calculations cannot match the actual directional urban flows [22]. Moreover, due to significant defects in the selection of urban scale indicators and the setting of spatial distance, the research conclusions are often biased. With the rapid development of Global Positioning Systems and modern communication and sensor technology, the research results of analyzing the spatial structure characteristics of urban agglomeration from the perspective of urban flow are also increasing. Various urban flows exist and change in the process, reflecting the situation of urban agglomeration and radiation. The inter-urban flows include various elements such as people, logistics, traffic, capital, and information, which promote the socio-economic development and spatial structure of urban agglomerations [23]. Some scholars have collected data such as population migration [24] and import and export volumes [25] through a large number of surveys and have conducted quantitative research on the spatial interaction of urban agglomeration. As the urban economy continues to prosper, the demand for urbanization continues to increase and the traffic flow within urban agglomerations continues to expand. In this process, traffic flow is the primary carrier and display method for the flow of elements such as people and logistics. Therefore, traffic flow big data are very important in economic operation monitoring and regional association analysis. However, limited by the availability of data, most current research focuses on using big data for highway [26], railway [27], and air traffic flow to empirically analyze the association networks of urban agglomeration. Compared with traffic methods such as road and air, marine traffic, which dominates international trade, has a significant impact on the flow of production factors, the expansion of urban space, and the reconstruction of the regional spatial structure [28]. Therefore, marine traffic is more suitable for studying the geospatial associations within regional urban agglomerations with larger spans.
The use of flow data, such as traffic flow, to analyze urban agglomeration networks has become popular in urban geography and regional economic research. Some scholars believe that the traffic network constructed by traffic flow is closely related to the spatial structure of urban agglomerations and a good traffic connection is closely related to the spatial integration of urban agglomerations at the national, regional and even global level [29]. However, due to the difficulty in obtaining actual operational data of the transportation network, there are more studies of the mainland and fewer studies of coastal urban agglomerations. There are relatively few studies on urban agglomeration networks based on the perspective of traffic flow and most of them focus on road, rail, and air traffic flow [26,27]. Research on urban agglomeration association based on marine traffic flow big data is still in its infancy. Given this opportunity for contributions, this paper has the potential to expand the study of geospatial associations in urban agglomerations.
In order to accurately measure the internal interactions and relationships of the urban agglomeration around the South China Sea and provide a policy basis for development and cooperation among the countries within the China-Association of Southeast Asian Nations (ASEAN) Free Trade Area (CAFTA), this paper used trajectory data mining and complex network analysis methods to mine the geospatial association, relying on massive continuous maritime traffic flow data. This paper carried out a process of constructing a traffic flow network based on AIS data. The small group subdivision level relationship of urban agglomeration around the South China Sea was obtained. In addition, different results of determinants of urban interaction from the gravity model through network analysis of traffic flow were obtained. From a theoretical perspective, according to the coexistence of transportation links and economic links, we wanted to use the real traffic flow big data to explore the impact of the transportation network on the spatial structure of urban agglomeration: Geographical proximity leads to more frequent communication between neighboring cities and even a community phenomenon, thus, driving the spatial structure of urban agglomeration to multiple centers and network development. From the perspective of policy, this paper evaluated the regional traffic interconnection through the perspective of real traffic flow and then proposes policy recommendations for the construction of transportation infrastructure.
3. Study Area and Data Source
3.1. Study Area
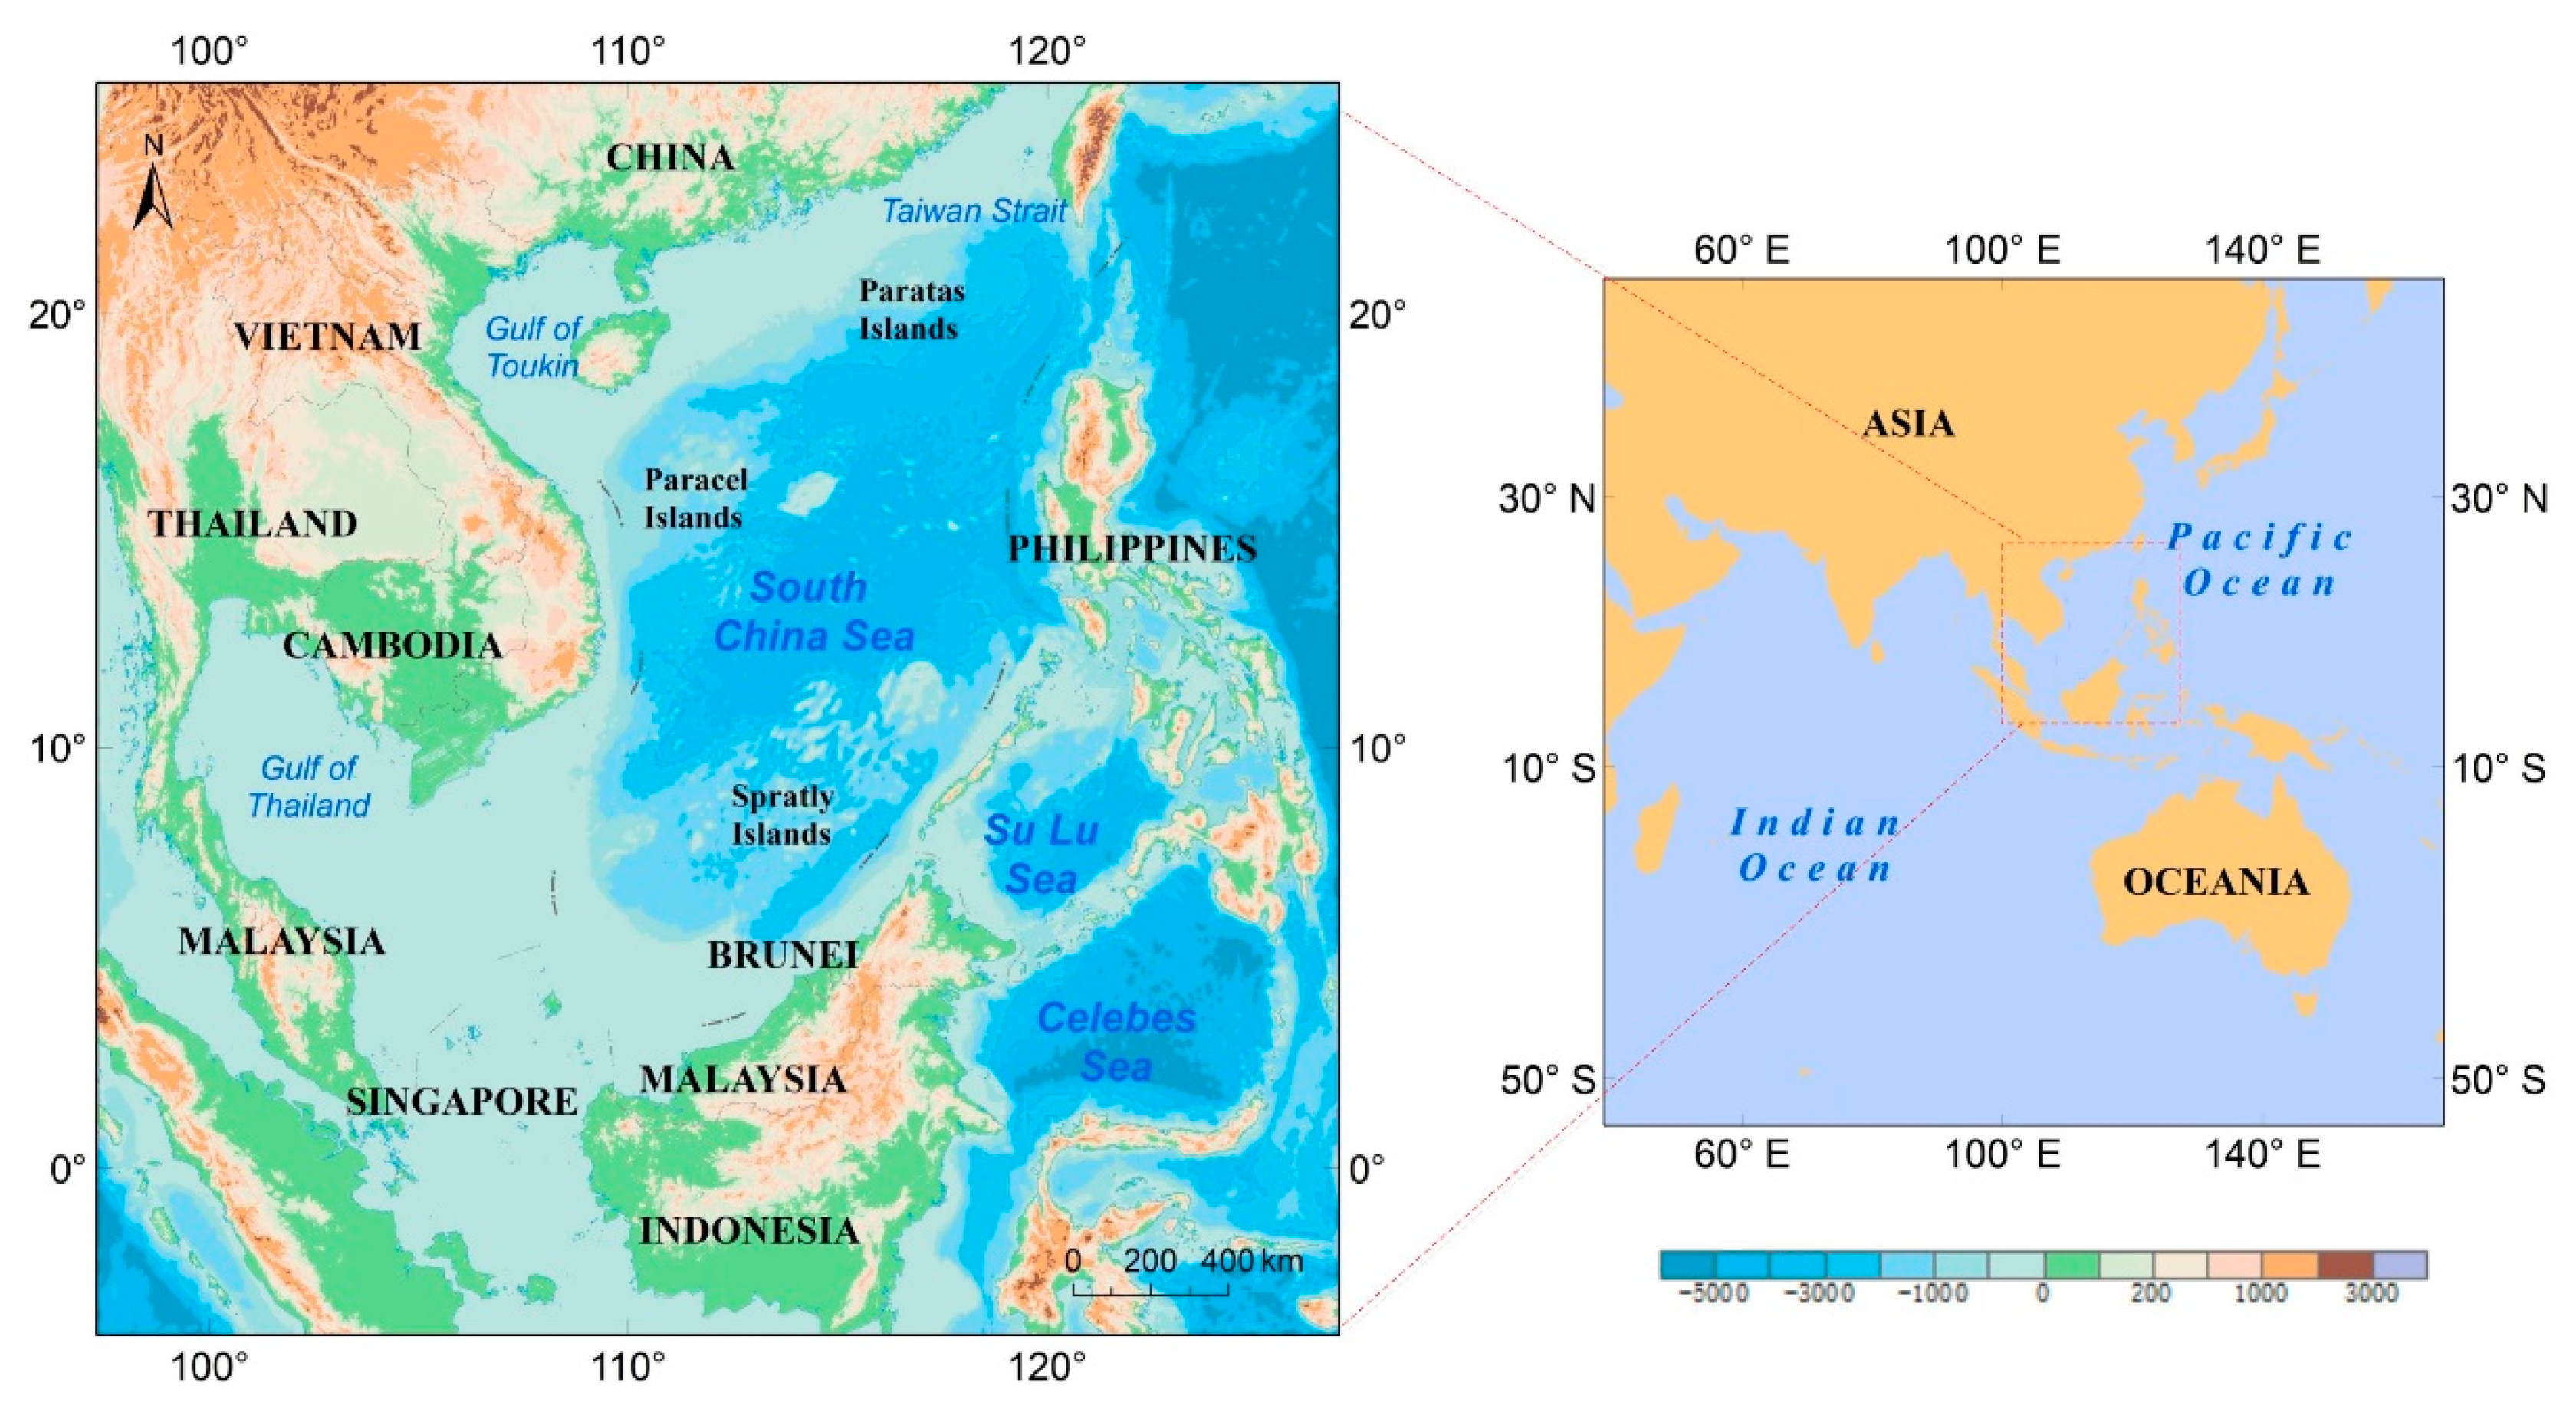
The South China Sea, known as the Mediterranean Sea of Asia, communicates with the Pacific Ocean and the Indian Ocean and links Asia and Oceania. It is geographically east of the Indochina Peninsula and north of the East Asia Peninsula; the west and south are surrounded by the Philippines and Indonesia. The sea area is 3.5 million square kilometers (Figure 1).
As one of the world’s three largest regional economic cooperation zones (the other two are the European Union and the North American Free Trade Area (NAFTA)) [30], CAFTA has become an enormous economy, covering 11 countries around the South China Sea, 1.9 billion people, and a gross domestic product (GDP) of USD 6 trillion since the official launch in 2010. In 2017, the total import and export volume between China and ASEAN reached USD 514.8 billion [31], a record high; what followed was the critical channel function of the South China Sea in the process of import and export trade within the free trade zone. In this context, China-ASEAN interconnection construction faces new historical opportunities and the promotion of interregional infrastructure projects for the interregional economy is even more pronounced. However, due to the domestic situation, regional pattern, capital and technical conditions, at present, China-ASEAN interconnection and construction face many problems and challenges that need to be addressed and resolved.
The South China Sea is the maritime transport channel necessary for CAFTA’s economic and trade cooperation and plays an important role in international trade. The countries along the South China Sea are essential partners in the construction of CAFTA, including Vietnam, the Philippines, Indonesia, Malaysia, Singapore, and others. In order to better reflect the spatial association within CAFTA, it is necessary to select urban areas scientifically. Some scholars have pointed out that coastal areas gather nearly 60% of the world’s population and the primary factor in establishing urban agglomerations in coastal areas is marine trade [32]. In addition, as regional shipping directly affects the development of a coastal cities’ economy [33], the cities around the South China Sea will become a new bright spot in the development of CAFTA and its spatial structure and functional organization are facing an inevitable restructuring and transformation. Given the above reasons, this paper selected the coastal port cities in the South China Sea and its surrounding waters as research objects.
3.2. Data and Data Processing
Traffic networks and features attached to them are important indicators of the evolution of the spatial structure model of urban agglomeration and there is a clear theoretical and practical significance to studying the geospatial association model of urban agglomeration from the perspective of traffic flow. The AIS data contain a significant amount of marine traffic information, which provides effective data to support the analysis of urban agglomeration geospatial associations using the spatiotemporal characteristics of traffic flow networks. The data involved in this study were AIS data of the South China Sea from 2014 in SQLite format and we obtained this dataset (n = 164 million) from Elane Inc. (http://www.elane.com). As shown in Table 1, the AIS dataset includes dynamic, statistical, and voyage information.
Data preprocessing was the basis and a prerequisite for the extraction of shipping information. In order to deal with the problem that the original AIS data had an inconsistent format and a large volume, we performed a series of processes: Spatialization, noise removal, and a stay point extraction. The specific steps are as follows:
- By extracting the static, dynamic and voyage information of each cargo ship, the corresponding geographic object was constructed and stored in the spatial database.
- Absolute data and outlier data in data noise were eliminated using a density-based outlier detection method.
- The stay point was extracted for each ship and the stay time and distance of the stay point must satisfy the given time threshold, , and the distance threshold, .
4. Method
4.1. Construction of Urban Agglomeration Association Network
The research focus of the geospatial association of urban agglomeration was to describe the interactions among cities by the characteristics of feature flow. Limited by data acquisition, the data used in previous studies cannot achieve full sample statistics. In order to obtain snapshots of marine traffic and build a more accurate association network, this paper attempted to use the trajectory data mining method to obtain the movement of ships, with time series information, between port cities. The main steps were as follows: (1) A kernel density estimation (KDE) method was used to generate a ship stay point density map; (2) the trend judgment method for density contour (Densi-graph) was adapted to extract the boundary of the ship’s stay area; and (3) the OD matrix of the voyage was obtained between port cities within the urban agglomeration based on ship movements in each stay area.
The purpose of the KDE was to determine the hotspots in the data, which are often used in the geographic analysis to estimate the distribution of geographic phenomena [34]. were independent identically distributed samples extracted from the population with a distribution density function of , then the value density estimation function at a point was as follows:
where denotes the value of the variable, at location i; represents the bandwidth or smoothing parameter and denotes the kernel function.
Densi-graph is a method of judging boundaries using the trend of density contours [35]. This method was used to generate the boundaries of ports around the South China Sea based on the results of the KDE. The basic idea was to find the boundary value of the density contour when the density value, d, was observed and the theoretical radius, of the corresponding closed curve enclosed area, was found. The expression was as follows:
The trend of volatility increased significantly and was irreversible, so we can conclude that there was a global inflection point.
4.2. Analysis of Urban Agglomeration Association Network
Centrality not only reveals the spatial structure characteristics of the urban agglomeration association network but also reflects the importance of nodes in the network [36]. This paper used centrality indicators to describe the hierarchical characteristics of port cities within the urban agglomeration. In addition, due to the various economic phenomena in international trade, some port cities with frequent trade in the urban agglomeration form a series of urban sub-clusters and this feature is called the community structure [37]. This paper used the method of community detection to quantitatively analyze the aggregation characteristics of subgroups within the urban agglomeration.
4.2.1. Centrality
Berry [38] pointed out that centrality is an indicator of the central level, which reflects the relative importance of serving the central cities to other cities and surrounding areas. Traffic contact is one of the main driving forces for the development of urban agglomerations and the rational and accurate division of cities and their affected areas through the traffic centrality will contribute to the rational division of labor of urban agglomerations and promote regionally balanced development [39]. As the main way for China-ASEAN major international trade, maritime transport is particularly important in the development of the urban agglomerations around the South China Sea and its impact on urban agglomerations is mainly reflected in spatial restructuring, urban hierarchical structure and regional economic development [40]. Compared with the previous methods of using the population, gross national product, and other indicators to define the city hierarchy through a gravity model, this paper selected the real internal shipping relational data of urban agglomerations as the basic data for network construction and then combined the centrality indicators of the complex network (degree centrality, betweenness centrality and closeness centrality) to divide cities according to different levels. Among them, degree centrality was used to describe the influence of a city in an urban agglomeration association network [41]; the betweenness centrality describes the influence of a city in the association network; the closeness centrality reflects the extent to which a city is central to the network. Through the calculation results of three centrality indicators, this paper attempted to make a preliminary evaluation of the status and function of each city in the network from the perspective of traffic flow.
4.2.2. Community Detection
Some individuals in the urban agglomeration association network are part of a tightly connected group and others may become bridges between groups [42]. For expression of a given city-associated network, , represents a collection of cities, represents a collection of inter-city connections, and maps each association in the graph to a non-zero function of positive weights and the problem of community detection was to find the group partition that maximizes the modularity, .
where is the weight of the edge connecting nodes i and j; is the sum of the weights of the edges connected to node i; is the community to which node i belongs; and indicates whether and belong to the same community; .
Blondel [43] proposed a community detection algorithm called Louvain, which uses a multi-segment, iterative and greedy heuristic to quickly generate a community group structure. At any given iteration, let denote the modularity gain that would result from moving vertex i from its current community, , to a different community. . Each city, i, was to assigned to it where each of its neighbor nodes were located and the node allocation scheme was selected with the maximum modularity . In order to discover subgroups in the association network of urban agglomeration, we used this method to obtain results after multiple iterations.
5. Results
5.1. Construction of Urban Agglomeration Spatial Association Network around the South China Sea
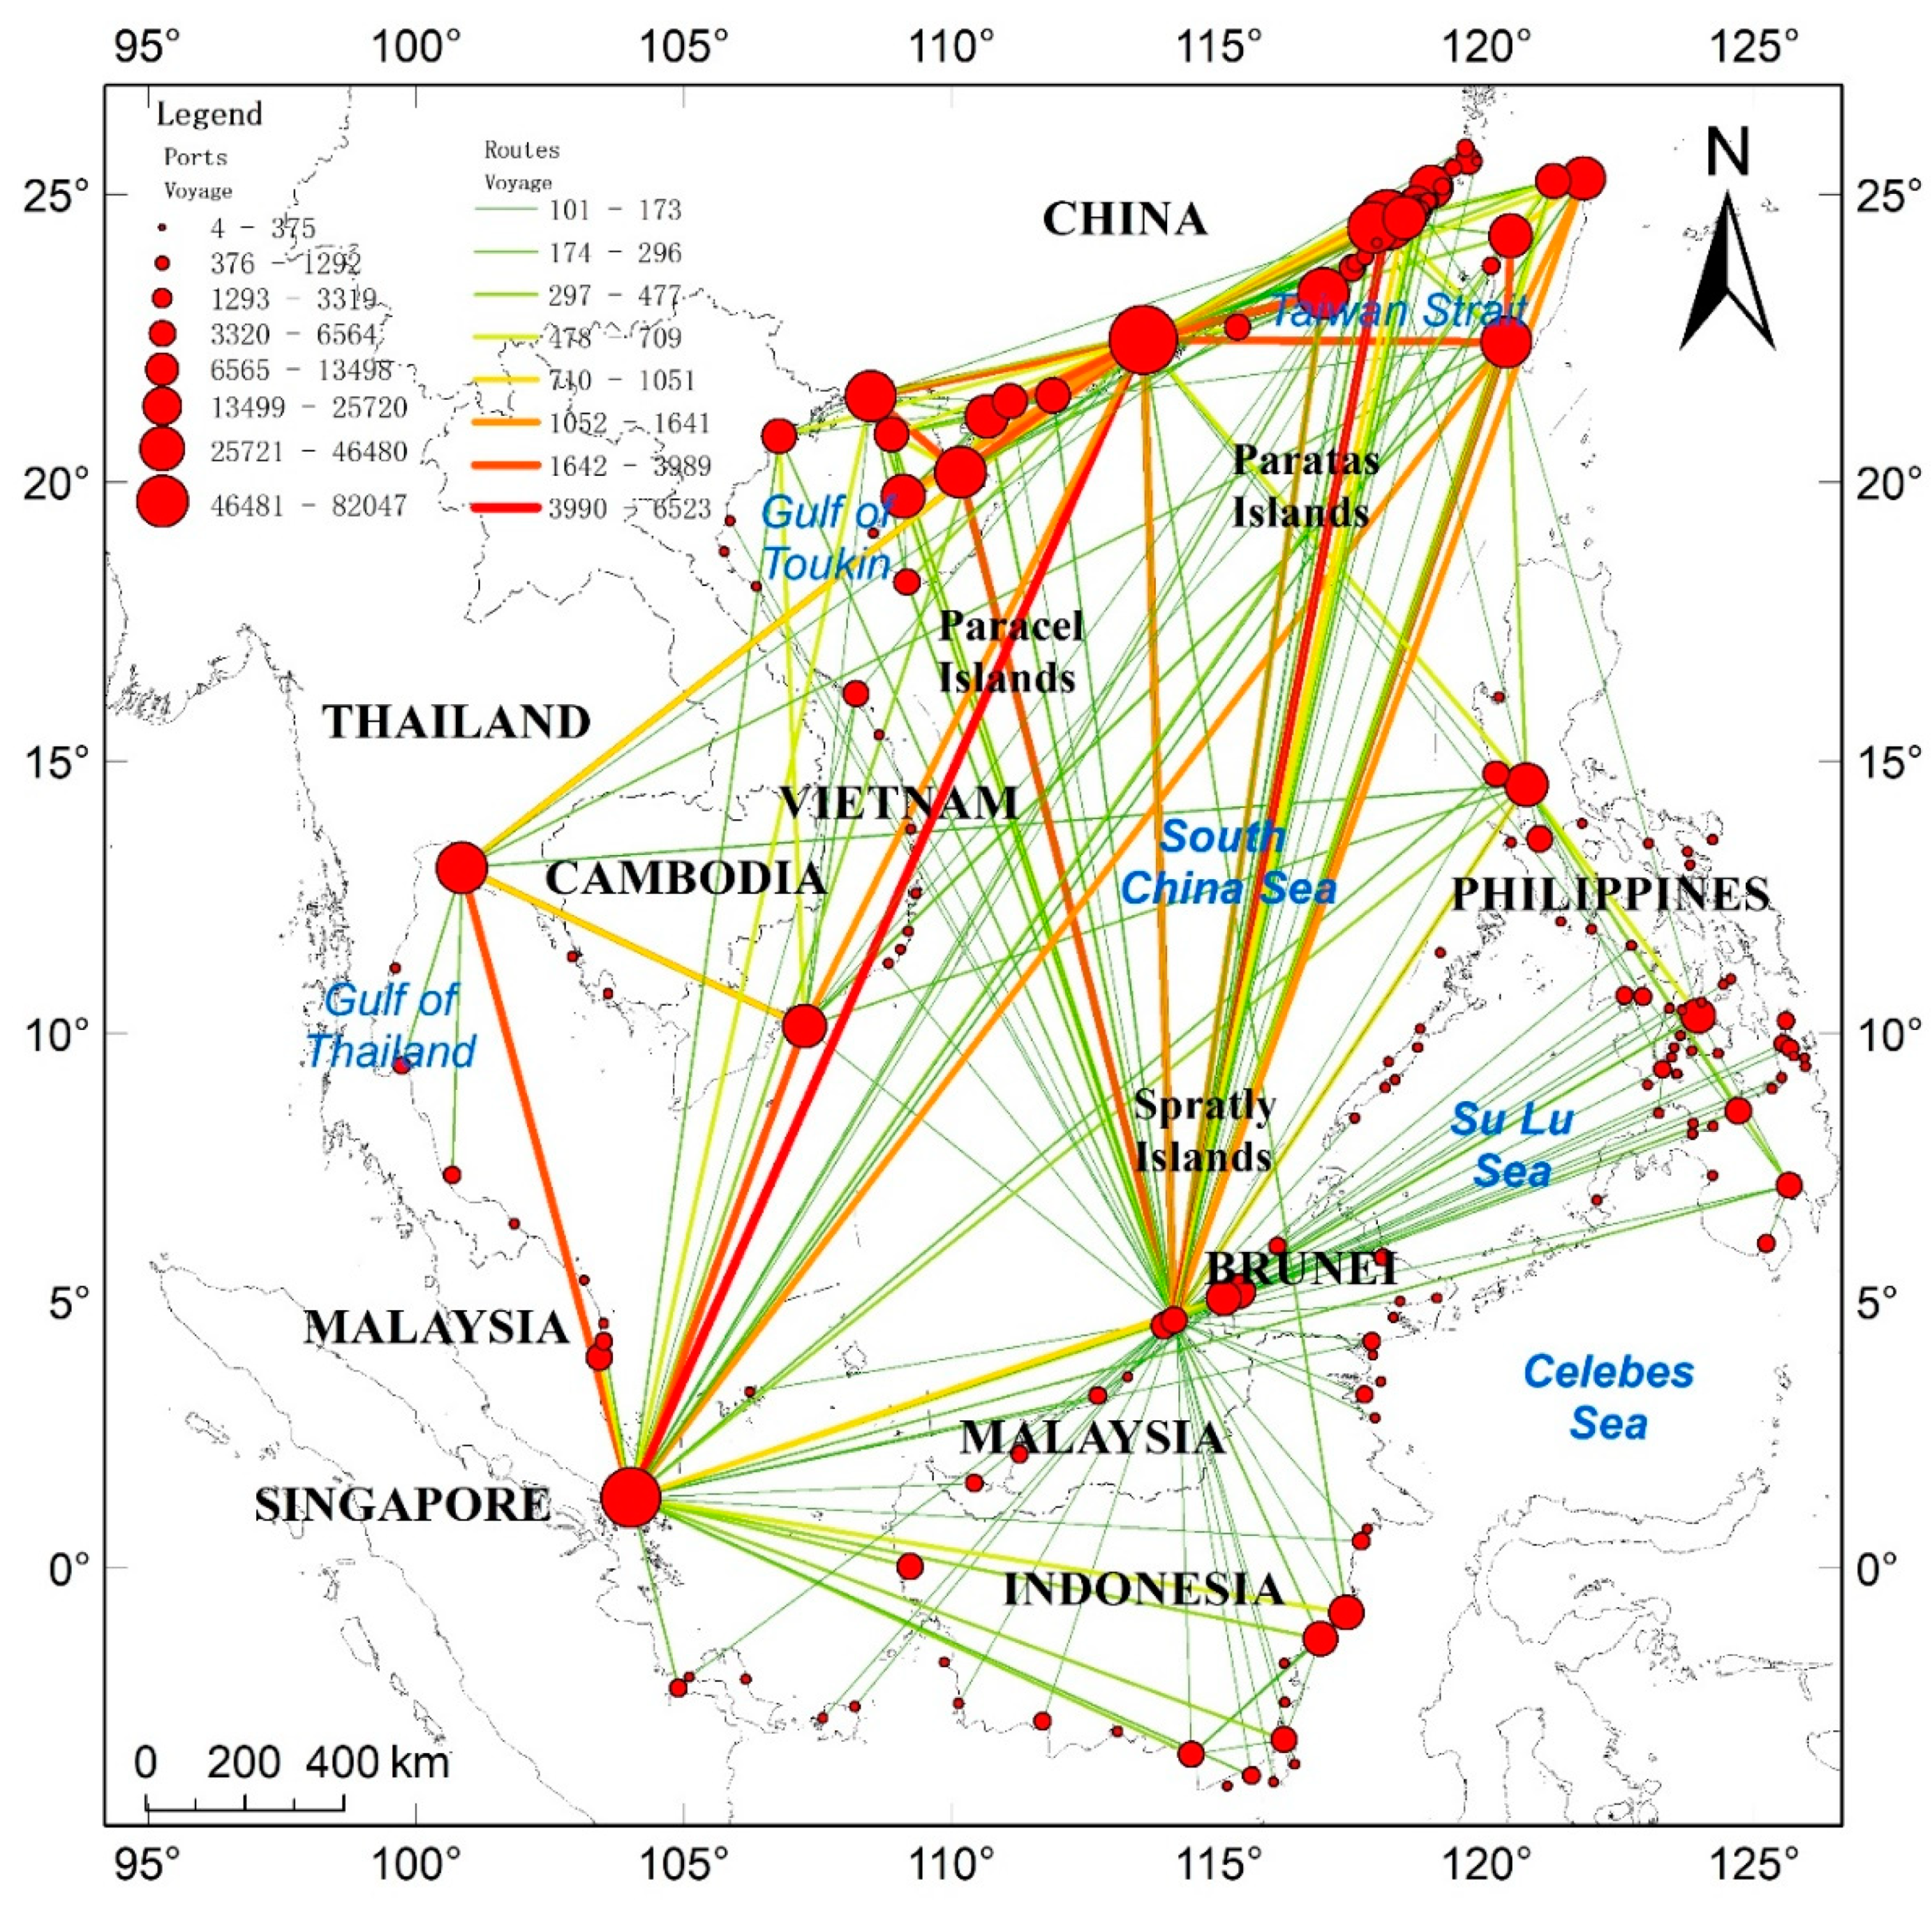
The movement of ships within the urban agglomeration forms a network and identifying the ships’ stay areas was the basis for the constructing the association network. There are various types of ship stay areas in the sea, such as oil rigs and island reef supply ports. This paper used the Densi-graph method to extract only port areas such as docks and anchorages. Based on the ship position information with time series in the boundary of the stay area, the urban agglomeration association network around the South China Sea was generated. As shown in Figure 2, the central location of the port stay area was used to indicate the 106 cargo ports extracted and the connections among the port cities were used to indicate the route. The node size of the port indicates the number of docked ships and the width and color of the lines connecting port cities represents the value of the voyage between ports.
Table 2 shows the voyage ranking table for each route in the urban agglomeration. The many connections between port cities cause the main features of the network to be concealed. Therefore, routes with fewer than 50 voyages were removed in the process of merging. From the perspective of traffic intensity between cities, Hong Kong-Singapore voyage was ranked first at 9427 voyages, followed by Zhangzhou-Xiamen at 6296 and Singapore-Bangkok at 5612. From the perspective of inter-urban linkages, there were 41 and 63 routes, respectively, involving Hong Kong and Singapore ports in the network; Bangkok, Xiamen, and other cities had between 20 and 40 routes and the remaining ports had fewer routes. In summary, within the urban agglomeration, Hong Kong and Singapore had a significant amount of marine traffic flow and a large number of routes radiating to the surrounding ports (Bangkok, Tainan, and Xiamen) centering on these two world-class cities.
5.2. Spatial Association Analysis of Urban Agglomeration around the South China Sea
5.2.1. Spatial Distribution Characteristics of Marine Traffic Flow
In general, the intensity of urban flow should be positively correlated with the size of the urban area; that is, the larger the urban size, the stronger the flow intensity. In order to obtain the distribution characteristics of traffic flow between ports and identify the spatial distribution pattern of scale within the urban agglomeration, this paper used a chord diagram [44] to visually express Origin-Destination (OD) voyages among port cities. As shown in Figure 3, two rings were used to represent a port city and its associated area in the network. The arc of the inner ring represents 106 ports in the association network and the arc of the outer ring is the area to which the inner arc port belongs (China coastal region, Taiwan, Vietnam, Thailand, Singapore, Philippines, Malaysia, and Indonesia) and the number of voyages between two ports is represented by the width of the connecting arc between the two ports in the inner ring.
As shown in Figure 3, the width of the link between the objects in the chord diagram directly shows the strength of the connections between objects. Through this form of expression, it is possible to intuitively understand the size and direction of traffic flow among different cities and sub-areas in the urban agglomeration and to further analyze the interactions among cities.
- The distribution of marine traffic flow in the urban agglomeration around the South China Sea is significantly different in different regions. The OD peak of traffic between port cities within the network appears among a limited number of ports, such as Hong Kong-Singapore (9427), Zhangzhou-Xiamen (6296), and Singapore-Bangkok (5612). The traffic flow of the entire association network was characterized by long-tailed distributions: The traffic volume of most cities was lower than the mean and in these cities was concentrated in a small low-value interval; the number of cities with high traffic volume was small and the proportion of the traffic volume in high–traffic cities was much higher than other intervals, reaching more than half of the total network traffic.
- The overall layout of the urban agglomeration was distributed along the southwest-northeast axis with excellent traffic conditions. The distribution of urban agglomeration around the South China Sea was relatively wide and the infrastructure levels of different cities in the region were quite different. As the two core cities in the region, Hong Kong and Singapore had close cooperative links with Ho Chi Minh, Manila, and other cities. It can be seen that Hong Kong and Singapore have always played a dual-core role within the urban agglomeration, in terms of economic power, geographic location, city size, and attractiveness, and the roles of cities in the region.
- The OD distribution within the urban agglomeration shows significant geographic proximity in geospatial. The OD concentration of traffic between ports adjacent to or belonging to the same area was relatively high. For example, the traffic volume of China’s coastal port cities such as Xiamen, Zhangzhou, and Haikou and the same regional port cities accounted for 72.35% of their total traffic volume. On the contrary, the traffic volume between ports that were not spatially adjacent and belong to different regions was relatively small.
5.2.2. Analysis of Urban Agglomeration Association Network
5.2.2.1 Analysis of Association Network Structure
The 106 cities of the urban agglomeration extracted in the above section were the nodes of the network and the connections after processing were used as the edge of the network. In this way, the association network was generated and the number of nodes and edges reflected the size of the network. Then, the results of the association matrix were imported into Gephi and the visual association network structure of the 106 cities in CAFTA was generated using Gephi drawing tools. The result is shown in Figure 4.
The urban agglomeration association network reflected cooperation and coordination among cities. As shown in Figure 4, we can analyze the current environment of each city; that is, the intensity, radiation range, and degree of connection of the city and the development intensity of the overall network. Cities such as Hong Kong, Singapore, Manila, and Ho Chi Minh were located at the center of the network and were more closely connected with other cities and had stronger economic radiation capabilities, which can affect other cities. In contrast, cities such as Lungsod ng Cebu, Ongshan, and Kampong Saom were at the opposite edge of the network due to their weaker influence on other cities.
5.2.2.2 Analysis of Association Network Hierarchy
The central cities of urban agglomerations often have a strong attraction and radiation effects, are gathering places for traffic flow, and have close links with other cities. From the network constructed in the previous section, it is possible to visually discover the intricate relationships among the 106 cities in CAFTA. In order to reflect the power of the nodes in the network and the interactions among the nodes (that is, to measure the influence of cities in the urban agglomeration on other cities), statistical indicators of complex networks were used to conduct an in-depth analysis of the association network, including three indicators: degree, closeness, and betweenness. The results obtained were standardized and were sorted in descending order by degree centrality (Table 3).
As shown in Table 3, the average degree of centrality of the urban agglomeration around the South China Sea was 0.1714 and there were 27 port cities above the mean. The top five port cities were Singapore, Hong Kong, Tainan, Bangkok, and Shantou. Singapore and Hong Kong were both above 0.9. It is easy to see that these cities have high levels of economic development and a strong ability to aggregate elements in the association network, resulting in more associations between these cities and other cities and they were at the center of the network. Cities below the mean were less associated with other cities due to their smaller economic size and lower concentration of their own elements.
The average betweenness value of the urban agglomeration around the South China Sea was 0.0291; 16 port cities were higher than the mean; 43 port cities were zero. The top five port cities were Singapore, Hong Kong, Manila, Lungsod ng Cebu, and Bangkok, which had a strong ability to control traffic flow between other cities in the association network. Both Singapore and Hong Kong were above 0.5, far higher than the other cities and each plays an important role as an intermediary bridge in the association network. There were more port cities with a value of zero in the network, indicating that the distribution of intermediary bridges was relatively concentrated and the network hierarchy was relatively clear.
The average closeness value of the urban agglomeration around the South China Sea was 0.1352 and there were 43 port cities above the mean. The top five port cities were Singapore, Hong Kong, Tainan, Bangkok, and Ho Chi Minh and they can quickly communicate with other port cities in the association network. It is easy to see that these cities were located at the core of the urban agglomeration, with a large economic scale and the traffic flow with other cities was stronger and more efficient. Thus, they had a strong ability to obtain the attention of other cities. Port cities with less than average values play an edge role in the network, mainly affected by other cities.
In summary, it can be seen that the cities located at the top ranking of degree, the betweenness and closeness of centrality were generally central cities with strong economic strength and radiation, such as Singapore, Hong Kong, Manila and other cities. Through this analysis, decision-makers can clearly understand the locations of the cities in the network and their associations with other cities, so as to make more specific policies and opinions for regional economic development.
There was an imbalance in the internal linkages of the urban agglomeration around the South China Sea. As shown in Table 4, the mean centrality and near-centrality of the network were 0.1714 and 0.1352 respectively, which indicates that cities in the urban agglomeration have more complicated economic links with other cities. The betweenness centrality reflects the intermediary role of a city as a bridge. The average center of the network was 1.654, relatively few times, which indicates an average of 1.654 intermediaries per city in the network. Secondly, the total length of the association network path was 25,390 and the average path length was 2.2385, which indicates that each city in the network can contact a city with strong economic radiation in about 2.23 steps. The standard deviation and variance of the betweenness centrality were 0.1144 and 0.0131 respectively and the maximum and minimum values were one and zero, respectively, which reflects the significant difference in association networks in the free trade zone.
The core-periphery model was first proposed by Krugman in 1991 and it can reflect the association degree within the urban agglomeration [45]. Combined with the statistical analysis and degree distribution of the above centrality, the spatial association of urban agglomeration around the South China Sea can be divided into core-intermediate-edge three dimensions: The first dimension is the core layer, which is mainly composed of cities with robust economic correlation capabilities and strong influence capabilities and it is centrally located in the spatial association network and drives the development of urban agglomeration through agglomeration and diffusion effects; the second dimension is the intermediate layer, which is in the middle position of the network and the infrastructure of this kind of city is better and can radiate to surrounding cities; and the third dimension is the marginal layer, which is mainly composed of cities with weak relations and a weak influence ability and these cities are located at the edge of the network. The core-intermediate-edge dimensions of the cities within the free trade zone are divided based on centrality and the specific division is shown in Table 5.
As shown in Table 4 and Table 5, it can be seen that the three centrality variances were large, which indicates that the influence of cities in the core layer and the edge layer was significant. It also shows that under the development opportunities of CAFTA, cities in the marginal zone had a higher potential for association such as free trade and investment in attracting projects. Secondly, except for Singapore and Hong Kong, the rest of the cities belonged to the middle and marginal layers. On the one hand, the above shows that through the development of the China-ASEAN strategic partnership for more than 10 years, the central and peripheral spatial economic structure of elements and industries were formed within the urban agglomeration of the South China Sea. On the other hand, it reflects the small number of urban agglomerations in the core layer, which affects the stability of the spatial association structure of the free trade zone and the ability to withstand risks to some extent.
5.2.3. Analysis of Internal Differences within the Urban Agglomeration
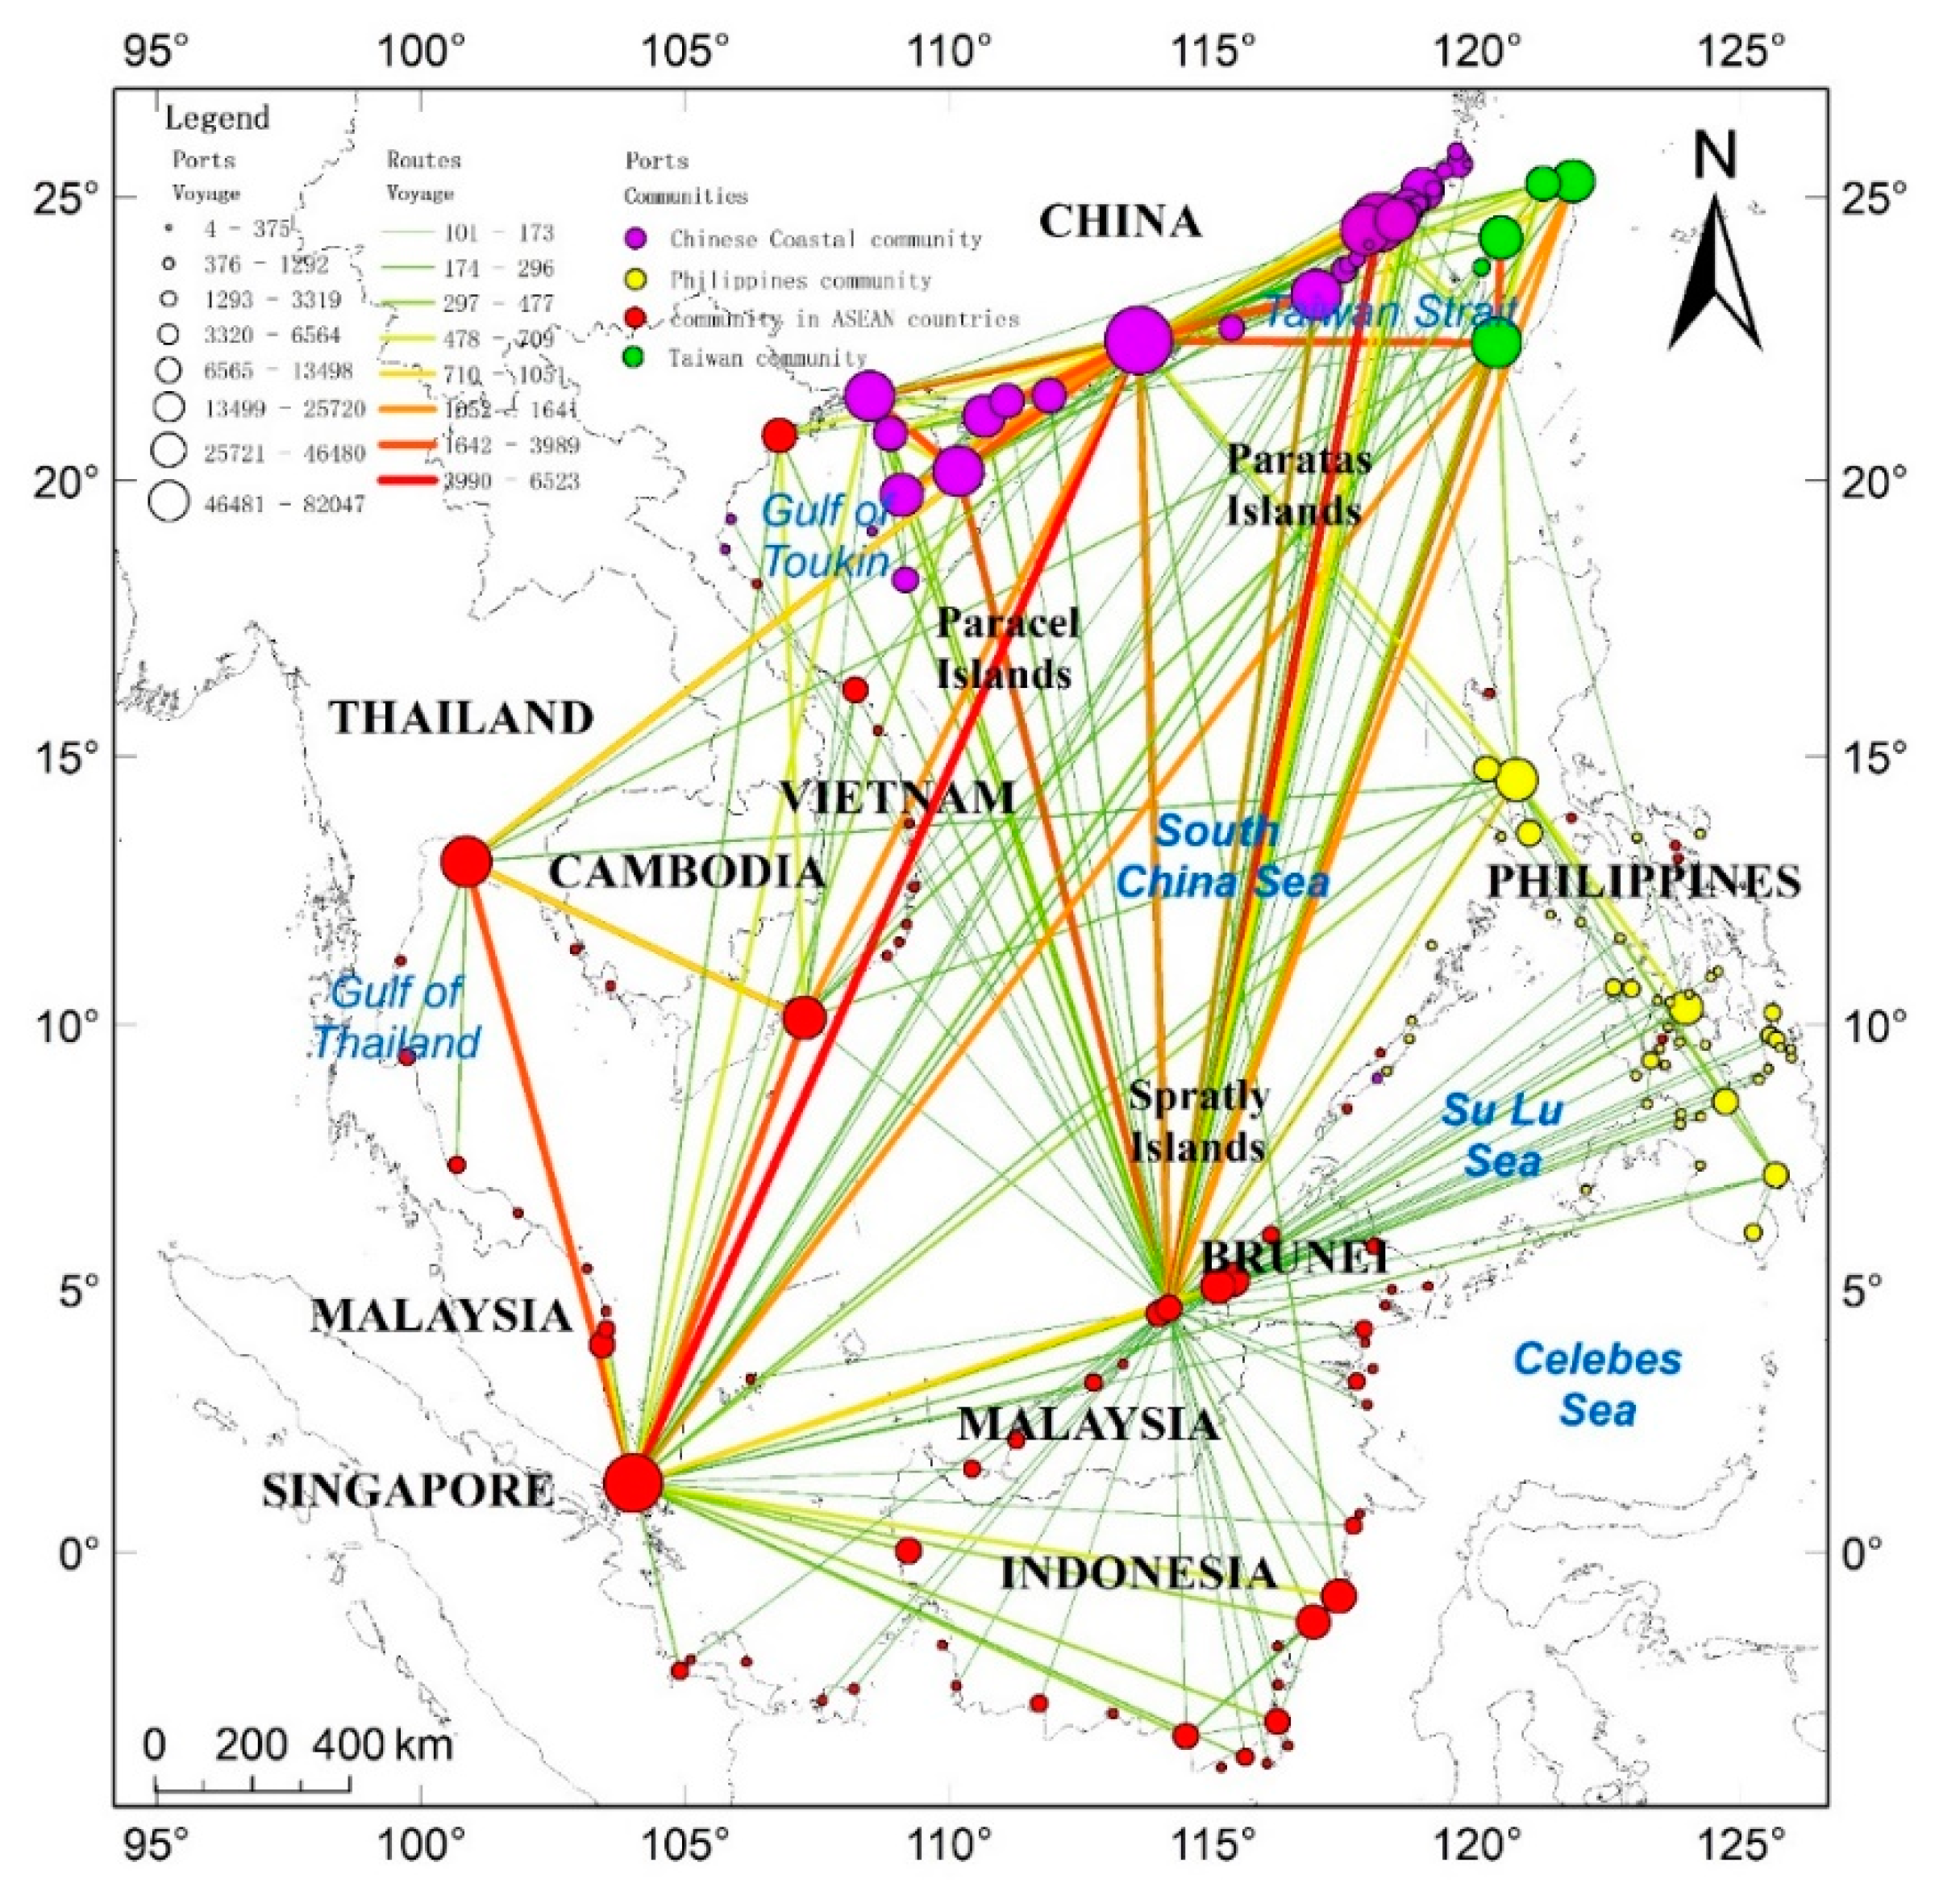
As shown in the analysis of centrality, it was found that there were differences within the urban agglomeration around the South China Sea in the characteristic of weak cohesion. From the core-intermediate-edge dimensions, it is known that there are differences in the development of core cities within CAFTA. In order to reflect the differences within the urban agglomeration, the Louvain algorithm was used to judge the community structure of the association network of the urban agglomeration and the community structure was generated as shown in Figure 5.
The result of the community detection of urban agglomeration is shown in Figure 5 and the optimization module of the association network was 0.36, indicating that the network had obvious agglomeration characteristics. The nodes of the same color in the figure represent the port cities divided into the same communities and it can be seen that there was a clear geographic agglomeration phenomenon. According to the geographic area where the community is located, the communities in the network can be divided into the Chinese coastal community, the Taiwan community, the ASEAN community and the Philippine community. Geographically, ASEAN associations include coastal port cities in nine countries except for the Philippines, such as Singapore, Vietnam, and Thailand. Among them, Singapore has a significant economic role in the community because of its critical geographic location, while other countries are relatively economically underdeveloped; the port cities in the southeastern coastal area of China were divided into the same community, because these cities have relatively complete infrastructure, economic conditions, have certain advantages and they are closely linked to each other in terms of economic and trade exchanges and cultural exchanges. Finally, the cities in the Philippines were clustered together, these cities have similar economic strengths, mutual influence, and mutual promotion. The group that gathered more cities was the ASEAN community, with 41 cities, accounting for 38.67% of all coastal cities, which reflects the significant role played by ASEAN cities in building CAFTA.
Combining the network community structure diagram and the core-intermediate-edge dimensions in the previous section, Table 6 was obtained.
(1) The coastal China community with Hong Kong as its core and the ASEAN community with Singapore as its core have been initially formed. These two communities are across the South China Sea and internal economic activities between the cities were very frequent, playing a major role in stimulating the economic development of the entire urban agglomeration. In the process of integrating the urban agglomeration, the dynamics of dual-core alliances centered on Hong Kong and Singapore were obvious. Basic interconnections have been achieved among different cities and the network structure has basically formed a three-layer nested mode. However, in order to realize resource allocation optimization, interconnection and mutual benefit and complementary development of the urban agglomeration in the true sense, it is still necessary for the countries in the region to make efforts in many aspects.
(2) Contrary to countries such as Malaysia and Vietnam, the Philippines community has not formed a close community with other ASEAN countries. The sub-group structure of the Philippines community is not yet in a stable state, the internal links were relatively concentrated in the two intermediate-layer cities of Manila and Lungsod ng Cebu and there was a no core port city with an economic strength that can drive the entire sub-group economy. In the future, the Philippines community will need to further enhance internal communication and cross-regional cooperation to make the flow of elements of the urban agglomeration around the South China Sea freer and ultimately form a multi-center coordinated development of the network structure.
(3) Relative to static factors such as population size and economic aggregation [46], the dynamic flow of information, capital and traffic flow play a more important role in inter-city spatial association. Although the population size and economic aggregation of Samarinda are much smaller than in Bangkok and Ho Chi Minh, it has a high centrality and is located in the middle layer of the ASEAN community as a distribution center for waterways, rubber, copra, wood and coal in Malaysia. The above phenomenon indicates that the level of association within the urban agglomeration does not depend entirely on population size and economic aggregation but rather on the ability and status of the city to organize economic activities and the ability to process and transform information technology and attract capital and talent.
6. Conclusions
Based on the AIS data around the South China Sea, this paper used the trajectory data mining method to obtain the marine traffic flow among port cities to build an association network of the urban agglomeration around the South China Sea. Then, this paper analyzed the spatial distribution characteristics of marine traffic flow, the urban agglomeration association network, and the internal differences of urban agglomeration. Finally, combining the results of each analysis, the inner cities of the urban agglomeration around the South China Sea were divided according to a spatial hierarchy. The main conclusions are as follows:
(1) Marine traffic flow was constructed based on the AIS data to identify the distribution characteristics of traffic flow among port cities within the urban agglomeration around the South China Sea. Marine traffic of China’s coastal areas and Singapore’s was more developed, while the eastern and western sides of the South China Sea had poor traffic flow and the main routes provide convenience for inter-city transportation. Marine traffic flow also had a bright central city orientation, especially the global cities of Hong Kong and Singapore. In addition, the distribution of traffic flow shows a significant geographic proximity in geospatial space.
(2) According to the core-intermediate-edge dimensions structure, the hierarchical structure of the urban agglomeration was obtained. It can be seen that the centrally located cities had substantial influence and a vast radiation range and the internal linkages of urban agglomerations were uneven. Based on the community detection method, the community division of port cities in the association network was obtained and it can be seen that the spatial distribution of the community had a definite geographic agglomeration phenomenon. Furthermore, the subgroup division of the entire network was obtained by combining the community and hierarchical structures. The network contained four subgroups with a relatively large scale and structure. However, there were fewer core cities with higher associations within some communities. It is necessary to strengthen the links among cities in three dimensions through trade and investment means, strengthen cooperation among sub-regions and promote sustainable development.
(3) Different from the traditional structural research based on relatively general data such as GDP, population size and urbanization level, this paper studied the structural characteristics of the urban agglomeration from the perspective of internal associations. The ordered connections and interactions among cities within the urban agglomeration of the integrated region were emphasized and the influence of each city’s exact energy levels on the development of the urban agglomeration was highlighted. The internal association characteristics of the urban agglomeration were based on the flow of ships, which made the study more microscopic and targeted. Based on the results obtained in this paper, we can find and strengthen some existing weak associations, which can optimize the structure and form a system with a compact spatial organization, close economic connections and high integration.
The above results reflect that, according to the current association network development status of the urban agglomeration around the South China Sea obtained in this paper, if the ASEAN Interconnection Master Plan and the Vision and Actions on Jointly Building Silk Road Economic Belt and 21st-Century Maritime Silk Road are to be realized, it is still necessary for the coastal countries to work together. Although the association network of the urban agglomeration around the South China Sea has formed a preliminary network structure, central cities are prominently positioned but some communities are not yet in a stable state. In the future development of the urban agglomeration, the time and space barrier between Chinese coastal community and ASEAN community may be broken first, especially after the completion of the Asian Expressway and the Trans-Asian Railway ASEAN channel, not only because convenient transportation facilities shorten the distance in time and space among cities but also because the flow of people, resources and logistics among internal cities is smoother. Due to the multiple countries involved, there is a low degree of interoperability policy among countries and there is a lack of strong guarantees for the operation of international interoperability projects and differences in traffic technology standards and these issues must be properly handled by various stakeholders through consultation. Based on the above considerations, this paper has three policy implications for the Chinese government’s policy of promoting the interconnection and intercommunication of transportation infrastructure with ASEAN in the future:
(1) It is necessary to optimize the regional economic development model by accelerating the construction of the China-ASEAN port city network. Shipping has occupied an important position in the China-ASEAN Free Trade Area and in external interconnections. Among the nine ASEAN countries around the South Sea, except Laos, which is a landlocked country, the remaining eight ASEAN countries are all coastal countries. This paper only extracted port cities from six ASEAN countries and port cities in other countries cannot be displayed due to too little traffic. Port cities are the carriers of China-ASEAN maritime interconnection and it is necessary to build a China-ASEAN port city network as soon as possible. The overall relationships of the urban agglomeration around the South China Sea should be improved to establish good geographic and spatial connections and a regional economic development model with complementary spatial and structurally large, medium and small cities.
(2) The linkage of economic development within the community needs to be focused. Four major communities of the urban agglomeration have emerged but individual communities have yet to form a stable structure. Large cities are not large and medium-sized cities do not force the spatial structure to be disordered, which in some cases exacerbates the disorderly and unequal competition among cities. When designing policies, national government departments should accurately locate urban functions, accurately determine the ownership of the community to promote rapid and stable economic development and promote the construction of safe and efficient transportation channels. Special attention needs to be paid to water transport and aviation infrastructure construction projects within the Philippines, with Manila and Lungsod ng Cebu as nodes.
Although in this paper the spatial distribution characteristics of ship traffic flow, the spatial level of the associated network and the internal differences of the urban agglomeration around the South China Sea are well displayed, there are still limitations. We only used non-directional traffic flow to represent inter-city association and do not reflect the attraction and radiation effects among communities. In addition, this paper does not fully reflect the current trade, capital and technology flows of the urban agglomeration around the South China Sea and these issues are also directions for further research. In the future, we will continue to obtain long-term sequence AIS data and multi-dimensional socioeconomic data. On this basis, we will continue to study the dependence of urban agglomeration economic growth on spatial association and reveal the evolution law and driving factors of urban cluster spatial association.
Author Contributions
All authors have contributed to the development of the research and in the elaboration of this article. X.Z. was the primary researcher. She performed the analyses with network statistics tools, which were part of the research he developed during her Doctorate. Y.C. provided technical support during the modelling procedures and also for the interpretation of the statistical tests. M.L. was the research supervisor and responsible for the final review of the article.
Funding
This research was funded by the National Key R&D Plan (2017YFB0504205), the Major Program of National Social Science Foundation (14ZDA078-5) and the National Natural Science Foundation of China (41401450) and the APC was funded by the National Key R&D Plan (2017YFB0504205). This paper was funded by the National Key R&D Plan (Grant No.2017YFB0504205), the Major Program of National Social Science Foundation (Grant No. 14ZDA078-5) and the National Natural Science Foundation of China (Grant No. 41401450).
Conflicts of Interest
The authors declare no conflict of interest.
References
- Molle, W. The Regional Economic Structure of the European Union: An Analysis of Long-Term Developments; Physica-Verlag HD: Heidelberg, Germany, 1997; pp. 66–86. [Google Scholar]
- Zhao, M.; Zhifeng, L.I.; Zhong, Y.; Ben, D.; School, A. Polycentric network topology of urban agglomerations in China. Prog. Geogr. 2016, 35, 376–388. [Google Scholar]
- Konishi, H. Formation of Hub Cities: Transportation Cost Advantage and Population Agglomeration. J. Urban Econ. 1999, 48, 1–28. [Google Scholar] [CrossRef]
- Behrens, K.; Mion, G.; Murata, Y.; Suedekum, J. Spatial frictions. J. Urban Econ. 2016, 97, 40–70. [Google Scholar] [CrossRef]
- Van Egeraat, C. Review: Proximity, Distance and Diversity: Issues onEconomic and Local Development. Edited by Arnoud Lagendijk and Päivi Oinas. Aldershot, U.K.: Ashgate, 2005. Econ. Geogr. 2007, 83, 203–204. [Google Scholar]
- Huang, R.R. Distance and trade: Disentangling unfamiliarity effects and transport cost effects. Eur. Am. Econ. Rev. 2005, 51, 161–181. [Google Scholar] [CrossRef]
- Bergstrand, J.H.; Larch, M.; Yotov, Y.V. Economic integration agreements, border effects, and distance elasticities in the gravity equation. Eur. Econ. Rev. 2015, 78, 307–327. [Google Scholar] [CrossRef]
- Mccann, P.; Shefer, D. Location, agglomeration and infrastructure. Pap. Reg. Sci. 2010, 83, 177–196. [Google Scholar] [CrossRef]
- Sánchez, R.J.; Hoffmann, J.; Micco, A.; Pizzolitto, G.V.; Sgut, M.; Wilmsmeier, G. Port Efficiency and International Trade: Port Efficiency as a Determinant of Maritime Transport Costs. Marit. Econ. Logist. 2003, 5, 199–218. [Google Scholar] [CrossRef]
- Pan, H.; Deal, B.; Chen, Y.; Hewings, G. A Reassessment of urban structure and land-use patterns: Distance to CBD or network-based?—Evidence from Chicago. Reg. Sci. Urban Econ. 2018, 70, 215–228. [Google Scholar] [CrossRef]
- Nam, S.Y. WTO Discussions on Technical Barriers to Trade and Implications for Asia-Pacific Regional Economic Integration; KIEP Research Paper No. APEC Study Series-15-01; Korea Institute for International Economic Policy: Sejong-si, Korea, 2016. [Google Scholar]
- Lee, S.I. Developing a bivariate spatial association measure: An integration of Pearson’s r and Moran’s I. J. Geogr. Syst. 2001, 3, 369–385. [Google Scholar] [CrossRef]
- Anselin, L. The Moran Scatterplot as an ESDA Tool to Assess Local Instability in Spatial Association; Regional Research Institute, West Virginia University: Morgantown, WV, USA, 1996. [Google Scholar]
- Friedmann, J.; Miller, J. The Urban Field. J. Am. Plan. Assoc. 1965, 31, 312–320. [Google Scholar] [CrossRef]
- Webster, F. Re-inventing place: Birmingham as an information city? City 2001, 5, 27–46. [Google Scholar] [CrossRef]
- Dong, Q.; Li, Y.; Liu, H. Research on the spatial distribution and division of Urban Agglomerations in China. Urban Stud. 2008, 6, 70–75. [Google Scholar]
- Zhang, R.; Matsushima, K.; Kobayashi, K. Computable urban economic model incorporated with economies of scale for urban agglomeration simulation. Ann. Reg. Sci. 2017, 59, 1–24. [Google Scholar] [CrossRef]
- Almog, A.; Bird, R.; Garlaschelli, D. Enhanced Gravity Model of trade: Reconciling macroeconomic and network models. arXiv, 2015; arXiv:1506.00348. [Google Scholar]
- Chong, Z.; Qin, C.; Ye, X. Environmental Regulation, Economic Network and Sustainable Growth of Urban Agglomerations in China. Sustainability 2016, 8, 467. [Google Scholar] [CrossRef]
- Anderson, J.E. The Gravity Model. Annu. Rev. Econ. 2011, 3, 133–160. [Google Scholar] [CrossRef]
- Qian, S.; Tang, F.; Yong, T. An economic tie network-structure analysis of urban agglomeration in the middle reaches of Changjiang River based on SNA. J. Geogr. Sci. 2015, 25, 739–755. [Google Scholar]
- Liu, H.B.; Liu, Z.L. Spatial economic interaction of urban agglomeration: Gravity and intercity flow modeling & empirical study. In Proceedings of the International Conference on Management Science and Engineering, Long Beach, CA, USA, 10–12 September 2008; pp. 1811–1816. [Google Scholar]
- Qiang, Y.E.; Zhang, L.; Peng, P.; Huang, J.; Architecture, S.O.; University, H. The Network Characteristics of Urban Agglomerations in the Middle Reaches of the Yangtze River Based on Baidu Migration Data. Econ. Geogr. 2017, 37, 53–59. [Google Scholar]
- Muto, M. The Impacts of Mobile Phones and Personal Networks on Rural-to-Urban Migration: Evidence from Uganda. J. Afr. Econ. 2012, 21, 787–807. [Google Scholar] [CrossRef]
- Zhang, H.; Zhou, D. Financial resource flows in Yangtze River Delta from the perspective of financial gradation city in urban agglomerations: A case study of city commercial banks’ expansion. Geogr. Res. 2016, 35, 1740–1752. [Google Scholar]
- Kidder, J.L. Urban Flow: Bike Messengers and the City; Cornell University Press: Ithaca, NY, USA, 2011. [Google Scholar]
- Yang, H.; Dijst, M.; Witte, P.; Van Ginkel, H.; Yang, W. The Spatial Structure of High Speed Railways and Urban Networks in China: A Flow Approach. Tijdschr. Econ. Soc. Geogr. 2017, 109, 109–128. [Google Scholar] [CrossRef]
- Ren, L. The Relationship on Multinational Firms, International Trade and International Shipping. World Ship. 2002, 8, 97–98. [Google Scholar]
- Owen, W. Transportation and world development. Int. J. Transp. Econ. 1984, 11, 123–133. [Google Scholar]
- Zhang, X.Q. Macro-Evolution Path of Typical RIAs and Implications for CAFTA. Asia-Pac. Econ. Rev. 2015, 6, 91–94. [Google Scholar]
- China-ASEAN Strengthens Cooperation to Promote Regional Prosperity. Available online: http://fta.mofcom.gov.cn/article/chinadongmeng/dongmengfguandian/201805/37919_1.html (accessed on 16 August 2018).
- Barragán, J.M.; Andrés, M.D. Analysis and trends of the world’s coastal cities and agglomerations. Ocean Coast. Manag. 2015, 114, 11–20. [Google Scholar] [CrossRef]
- Dong, X.Y. The Impact of Coastal Urban Logistics Economic Development on International Trade Development. In Proceedings of the International Conference on Education, Management and Computing Technology, Hangzhou, China, 15–16 April 2017. [Google Scholar]
- Ni, J.; Qian, T.; Xi, C.; Rui, Y.; Wang, J. Spatial Distribution Characteristics of Healthcare Facilities in Nanjing: Network Point Pattern Analysis and Correlation Analysis. Int. J. Environ. Res. Public Health 2016, 13, 833. [Google Scholar] [CrossRef] [PubMed]
- Xu, Z.; Gao, X. A novel method for identifying the boundary of urban built-up areas with POI data. Acta Geogr. Sin. 2016, 71, 928–939. [Google Scholar]
- Yu, H.; Liu, Z.; Li, Y.J. Key nodes in complex networks identified by multi-attribute decision-making method. Acta Geogr. Sin. 2013, 62, 46–54. [Google Scholar]
- Girvan, M.; Newman, M.E. Community Structure in Social and Biological Networks. Proc. Natl. Acad. Sci. USA 2002, 99, 7821–7826. [Google Scholar] [CrossRef] [PubMed]
- Berry, B.J.L. Central Places in Southern Germany. Econ. Geogr. 1966, 43, 275–276. [Google Scholar] [CrossRef]
- Wei, L. Balance of Relations: ASEAN Centrality and the Evolving Regional Order. World Econ. Polit. 2017, 38, 155–156. [Google Scholar]
- Xu, M.; Li, Z.; Shi, Y.; Zhang, X.; Jiang, S. Evolution of regional inequality in the global shipping network. J. Transp. Geogr. 2015, 44, 1–12. [Google Scholar] [CrossRef]
- Gao, C.; Wei, D.; Hu, Y.; Mahadevan, S.; Deng, Y. A modified evidential methodology of identifying influential nodes in weighted networks. Physica A 2013, 392, 5490–5500. [Google Scholar] [CrossRef]
- Malliaros, F.D.; Vazirgiannis, M. Clustering and community detection in directed networks: A survey. Phys. Rep. 2013, 533, 95–142. [Google Scholar] [CrossRef] [Green Version]
- Blondel, V.D.; Guillaume, J.; Lambiotte, R.; Lefebvre, E. Fast Unfolding of Communities in Large Networks. J. Stat. Mech. Theory Exp. 2008, 2008, 10008. [Google Scholar] [CrossRef]
- Krzywinski, M.; Schein, J.; Birol, I.; Connors, J.; Gascoyne, R.; Horsman, D.; Jones, S.J.; Marra, M.A. Circos: An information aesthetic for comparative genomics. Genome Res. 2009, 19, 1639–1645. [Google Scholar] [CrossRef] [PubMed] [Green Version]
- Robert-Nicoud, F.; Baldwin, R.; Forslid, R.; Martin, P.; Ottaviano, G.I.P. The core-periphery model: Key features and effects. Public Polit. Econ. Geogr. 2004, 99, 483–499. [Google Scholar]
- Srivastava, R.K.; Green, R.T. Determinants of Bilateral Trade Flows. J. Bus. 1986, 59, 623–640. [Google Scholar] [CrossRef]
Figure 1.
The study area.

Figure 2.
Urban agglomeration spatial association network around the South China Sea.

Figure 3.
Distribution of marine traffic flow of the urban agglomeration around the South China Sea.
Figure 3.
Distribution of marine traffic flow of the urban agglomeration around the South China Sea.

Figure 4.
Association network of urban agglomeration around the South China Sea.

Figure 5.
Result of the community detection of association network.


Table 1.
Attributes of the automated identification system (AIS) dataset.
| Dynamic Information | Statistical Information | Voyage Information |
|---|---|---|
| 1. Ship location 2. Course over ground (COG) 3. Speed over ground (SOG) 4. Heading 5. Navigation status | 1. Maritime Mobile Service Identity (MMSI) 2. IMO number 3. Ship name 4. Ship size 5. Ship type, shipbuilder | 1. Draught 2. Destination 3. Estimated arrival time |
Table 2.
Ranking of urban agglomeration routes.
| Rank | Route | Voyage | Rank | Route | Voyage |
|---|---|---|---|---|---|
| 1 | Hong Kong-Singapore | 5376 | 16 | Fangchenggang-Hong Kong | 1852 |
| 2 | Singapore-Hong Kong | 4051 | 17 | Xiamen-Hong Kong | 1817 |
| 3 | Zhangzhou-Xiamen | 3343 | 18 | Tainan-Taichung | 1756 |
| 4 | Tainan-Hong Kong | 3173 | 19 | Hong Kong-Xiamen | 1712 |
| 5 | Xiamen-Zhangzhou | 2953 | 20 | Zhanjiang-Hong Kong | 1704 |
| 6 | Hong Kong-Shantou | 2843 | 21 | Hong Kong-Zhanjiang | 1674 |
| 7 | Bangkok-Singapore | 2838 | 22 | Neibaiyu-Xiamen | 1496 |
| 8 | Singapore-Bangkok | 2774 | 23 | Hong Kong-Fangchenggang | 1463 |
| 9 | Haikou-Fangchenggang | 2528 | 24 | Haikou-Hong Kong | 1452 |
| 10 | Shantou-Hong Kong | 2426 | 25 | Xiamen-Neibaiyu | 1428 |
| 11 | Hong Kong-Tainan | 2348 | … | … | … |
| 12 | Hong Kong-Haikou | 2085 | … | … | … |
| 13 | Fangchenggang-Haikou | 1968 | 365 | Samarinda-Meizhou | 50 |
| 14 | Zhangzhou-Hong Kong | 1948 | 366 | Manila-Batangas | 50 |
| 15 | Taichung-Tainan | 1871 | 367 | Sanya-Haikou | 50 |
Table 3.
Standardization centrality of association network.
| Rank | Port Name | Degree Centrality | Betweenness Centrality | Closeness Centrality |
|---|---|---|---|---|
| 1 | Singapore | 1 | 1 | 1 |
| 2 | Hong Kong | 0.9117 | 0.5731 | 0.9664 |
| 3 | Tainan | 0.5147 | 0.1142 | 0.8275 |
| 4 | Bangkok | 0.4926 | 0.1188 | 0.8000 |
| 5 | Shantou | 0.4779 | 0.1011 | 0.7826 |
| 6 | Xiamen | 0.4632 | 0.0665 | 0.7783 |
| 7 | Ho Chi Minh | 0.4632 | 0.1181 | 0.7912 |
| 8 | Zhangzhou | 0.4338 | 0.0470 | 0.7346 |
| 9 | Fangchenggang | 0.4117 | 0.0336 | 0.7422 |
| 10 | Manila | 0.3676 | 0.2214 | 0.7741 |
| … | … | … | … | … |
| 103 | Bataraza | 0.0073 | 0 | 0.5783 |
| 104 | SanyuIslet | 0.0073 | 0 | 0.4528 |
| 105 | Iligan | 0.0073 | 0 | 0.5783 |
| 106 | Ozamiz | 0.0073 | 0 | 0.3720 |
Table 4.
Centrality statistical indicator values of the association network.
| Indicator | Degree Centrality | Betweenness Centrality | Closeness Centrality |
|---|---|---|---|
| Mean | 0.1714 | 0.0291 | 0.1352 |
| Standard Deviation | 0.1710 | 0.1144 | 0.1017 |
| Variance | 0.0293 | 0.0131 | 0.0103 |
| Max Value | 1 | 1 | 1 |
| Min Value | 0.0073 | 0 | 0.3564 |
Table 5.
Spatial association hierarchy of the urban agglomeration around the South China Sea.
| Core Layer (2) | Intermediate Layer (9) | Edge Layer (95) |
|---|---|---|
| Singapore | Bangkok | Shantou |
| Hong Kong | Shantou | Zhangzhou |
| Xiamen | Fangchenggang | |
| Ho Chi Minh | Meizhou | |
| Manila | Neibaiyu | |
| Samarinda | Haikou | |
| Taichung | Zhanjiang | |
| Lungsod ng Cebu | Beihai | |
| Tainan | Haiphong | |
| …… | ||
| SanyuIslet | ||
| Iligan | ||
| Ozamiz |
Table 6.
Subgroup structure of the urban agglomeration around the South China Sea.
| Subgroup | Name | Type | City |
|---|---|---|---|
| A | Chinese coastal community (33) | Core (1) | Hong Kong |
| Intermediate (4) | Shantou | ||
| Xiamen | |||
| Zhangzhou | |||
| Fangchenggang | |||
| Edge (28) | Haikou | ||
| Zhanjiang | |||
| Beihai | |||
| … | |||
| B | ASEA community (41) | Core (1) | Singapore |
| Intermediate (4) | Bangkok | ||
| Ho Chi Minh | |||
| Samarinda | |||
| Haiphong | |||
| Edge (36) | Banjarmasin | ||
| Satui | |||
| Sipitang | |||
| … | |||
| C | Philippine community (27) | Intermediate (2) | Manila |
| Lungsod ng Cebu | |||
| Edge (25) | Dabaw | ||
| Subic | |||
| … | |||
| D | Taiwan community (5) | Intermediate (2) | Tainan |
| Taichung | |||
| Edge (3) | Xinbei | ||
| Keelung | |||
| Mailiao |
© 2018 by the authors. Licensee MDPI, Basel, Switzerland. This article is an open access article distributed under the terms and conditions of the Creative Commons Attribution (CC BY) license (http://creativecommons.org/licenses/by/4.0/).
Share and Cite
MDPI and ACS Style
Zhang, X.; Chen, Y.; Li, M. Research on Geospatial Association of the Urban Agglomeration around the South China Sea Based on Marine Traffic Flow. Sustainability 2018, 10, 3346. https://0-doi-org.brum.beds.ac.uk/10.3390/su10093346
AMA Style
Zhang X, Chen Y, Li M. Research on Geospatial Association of the Urban Agglomeration around the South China Sea Based on Marine Traffic Flow. Sustainability. 2018; 10(9):3346. https://0-doi-org.brum.beds.ac.uk/10.3390/su10093346
Chicago/Turabian StyleZhang, Xianzhe, Yanming Chen, and Manchun Li. 2018. "Research on Geospatial Association of the Urban Agglomeration around the South China Sea Based on Marine Traffic Flow" Sustainability 10, no. 9: 3346. https://0-doi-org.brum.beds.ac.uk/10.3390/su10093346
Note that from the first issue of 2016, this journal uses article numbers instead of page numbers. See further details here.