Article

An Analysis of the Water-Energy-Food-Land Requirements and CO2 Emissions for Food Security of Rice in Japan

1
Research Institute for Humanity and Nature, Motoyama 457-4, Kamigamo, Kita-ku, Kyoto 603-8047, Japan
2
Department of Biological and Agricultural Engineering, Texas A&M University, College Station, TX 77843, USA
3
Department of Agricultural and Food Sciences, American University of Beirut, Beirut 1107-2020, Lebanon
4
Department of Rural Systems Engineering and Research Institute for Agriculture & Life Sciences, Seoul National University, Seoul 08826, Korea
5
Department of Rural and Bio-systems Engineering, Chonnam National University, Gwangju 61186, Korea
*
Author to whom correspondence should be addressed.
Sustainability 2018, 10(9), 3354; https://0-doi-org.brum.beds.ac.uk/10.3390/su10093354
Submission received: 27 August 2018 / Revised: 17 September 2018 / Accepted: 18 September 2018 / Published: 19 September 2018
(This article belongs to the Section Sustainable Agriculture)

Abstract

:
The aim of this study is to assess the impact of rice-based food security on water, energy, land, and CO2 emissions from a holistic point of view using the Nexus approach, which analyzes tradeoffs between water, energy, and food management. In Japan, both rice consumption and the area harvested for rice have decreased. Maintaining a high self-sufficiency ratio (SSR) in rice production is an important aspect of food security in Japan, impacting the management of key resources, such as water, energy, and land. This study has, therefore, assessed the impact of various SSRs on rice production, focusing on consumption and land-use trends. First, the rice production SSR is predicted to drop to 87% by 2025 within the logarithmic trend of rice consumption and the polynomial trend line of the harvested area of rice. This reflects the fact that rice production is expected to decline more steeply than consumption between 2016 and 2025. Second, this study sets the SSRs for rice in 2025 between 80% and 100%, reflecting a range of low-to-high food security levels. In comparison with the 2016 baseline, about 0.70 × 10 6 additional tons of rice will be produced. Achieving a rice production SSR of 100% will require 10,195 × 10 6 m3 more of water and 23.31 × 10 6 GJ more of energy. Furthermore, an additional 283,000 tons of CO2 will be emitted in 2025, as more energy is used. By contrast, an 80% rice production SSR scenario would save 1482 × 10 6 m3 of water and 3.39 × 10 6 GJ of energy, as well as making a 398,000-ton reduction in CO2 emissions in 2015. A lower SSR would have a positive impact on resource management but a negative impact on food security. It would also reduce the income and economic status of farmers. It is, therefore, important to consider the tradeoffs between food security and resource savings in order to achieve sustainable water, energy, food, and land management in Japan.

1. Introduction

In a 2015 World Economic Forum report, water, food crises, and energy demands were regarded as the main future risk concerns. These challenges are linked with social, economic, and political risks; various combinations of factors, including water, food, energy, trade, climate, and population growth, are currently being studied [1]. In addition, the United Nations has established 17 Sustainable Development Goals (SDGs) such as 1. no poverty, 2. zero hunger, 6. clean water and sanitation, 7. affordable and clean energy, and 11. sustainable cities and communities, and proposed an integrated approach to sustainable resource management [2]. With regard to water, by 2030, these goals call for substantially increased water-use efficiency across all sectors and to ensure sustainable withdrawals and supply of freshwater to address water scarcity and substantially reduce the number of people suffering from water scarcity. In terms of food management in the SDGs, the increase of food production for no poverty, or food security in sustainable cities, could be regarded as a reasonable action for achieving the goals.
In this study, the meaning of sustainability could be to collaborate and integrate various resources for increasing efficiency and reducing risk. For example, the increase of domestic food production should be considered within the capacity of water resources in water scarce areas, and could also result in reduced energy security due to the increase of energy use in a food-producing area. Therefore, the stakeholders of each resource, such as farmers and policy makers, should consider the impacts of their own management of other resources; the relationship between water, food, and trade can be regarded as the key factor in assessing various strategies from a holistic point of view. In addition, the externalities, such as climate change and population change, bring holistic impacts on food, water, and energy. Therefore, a holistic approach can best support decision makers, allowing them to evaluate the varied implications of current decisions on projected pathways into the future.
Currently, the “Nexus” has gained prominence as a new approach to assessing the relationship between water, energy, and food. Its overall purpose is to assess the environmental, social, and economic impact on food security policy, in accordance with given consumption, land-use trends, and food trade changes. Nexus was identified during the 2008 annual meeting of the World Economic Forum; Nexus thinking emerged from an understanding that natural resources are becoming limited [3]. The Water–Energy–Food Nexus was identified as a Global Risk in 2011 [4]. A call for action was issued by policy and research communities worldwide to develop strategies to provide a comprehensive Nexus approach [5,6]. As a result, various studies have been carried out to develop tools that can assess resource allocation strategies by understanding the tradeoffs [6,7,8,9,10,11]. For example, the Water-Energy-Food Nexus developed by the Food and Agriculture Organization (FAO) highlights that taking a Nexus approach can engage a range of stakeholders [7]. The climate, land-use energy, and water (CLEW) model considers that resource use is linked to development challenges, and provides the output of water, energy, food, land, and specific economic indicators based on national and global levels [12]. However, extensive data are required, including the technical and economic parameters of power plants, farming machinery, water supply chains, desalination terminals, irrigation technologies, and fertilizer production [8]. The Water-Energy-Food (WEF) Nexus Tool 2.0 more focuses on local characteristics, and a user can apply more localized parameters such as the levels of local production of different types of food [6]. The water evaluation and planning system—long range energy alternatives planning system (WEAP-LEAP) is the Nexus model based more on water and energy through the integration of LEAP and WEAP [10,11]. This model can exchange key model parameters and results, such as hydropower-generated or cooling water requirements, and allows users to assess a wide range of scenarios and policy choices [10,11]. However, there are critical reviews of the principal Nexus framework from a sustainable livelihood perspective. For example, the Nexus from FAO only addresses the outcomes of resource use and productivity as opposed to human wellbeing and the CLEW model does not explore how changes in resource use can make livelihoods more resilient to shocks and stresses [13]. In terms of extension and application of the tool, the WEF Nexus Tool 2.0 has only been applied to a Qatar case study and a user is required to establish their own tool for a local case study.
Although there are limitations to the Nexus approach, the potential linkages to sustainable resource management could be considered significant; for example, the Nexus approach establishes natural resource use within the context of social needs and economic development, specifically in the context of reducing poverty, as well as sustainable agriculture, ecosystems, and food security [13,14]. Decision-makers should use the Nexus assessment tools to develop information on the implications of particular decisions on expected tradeoffs involving resource systems, environmental concerns, and other externalities. In addition, national datasets, including data on water-energy-food system components, must be used within a “Nexus analytics” system to support stakeholders, including policy makers, private sector firms, and civil society, all of whom need to be involved at different stages and levels.
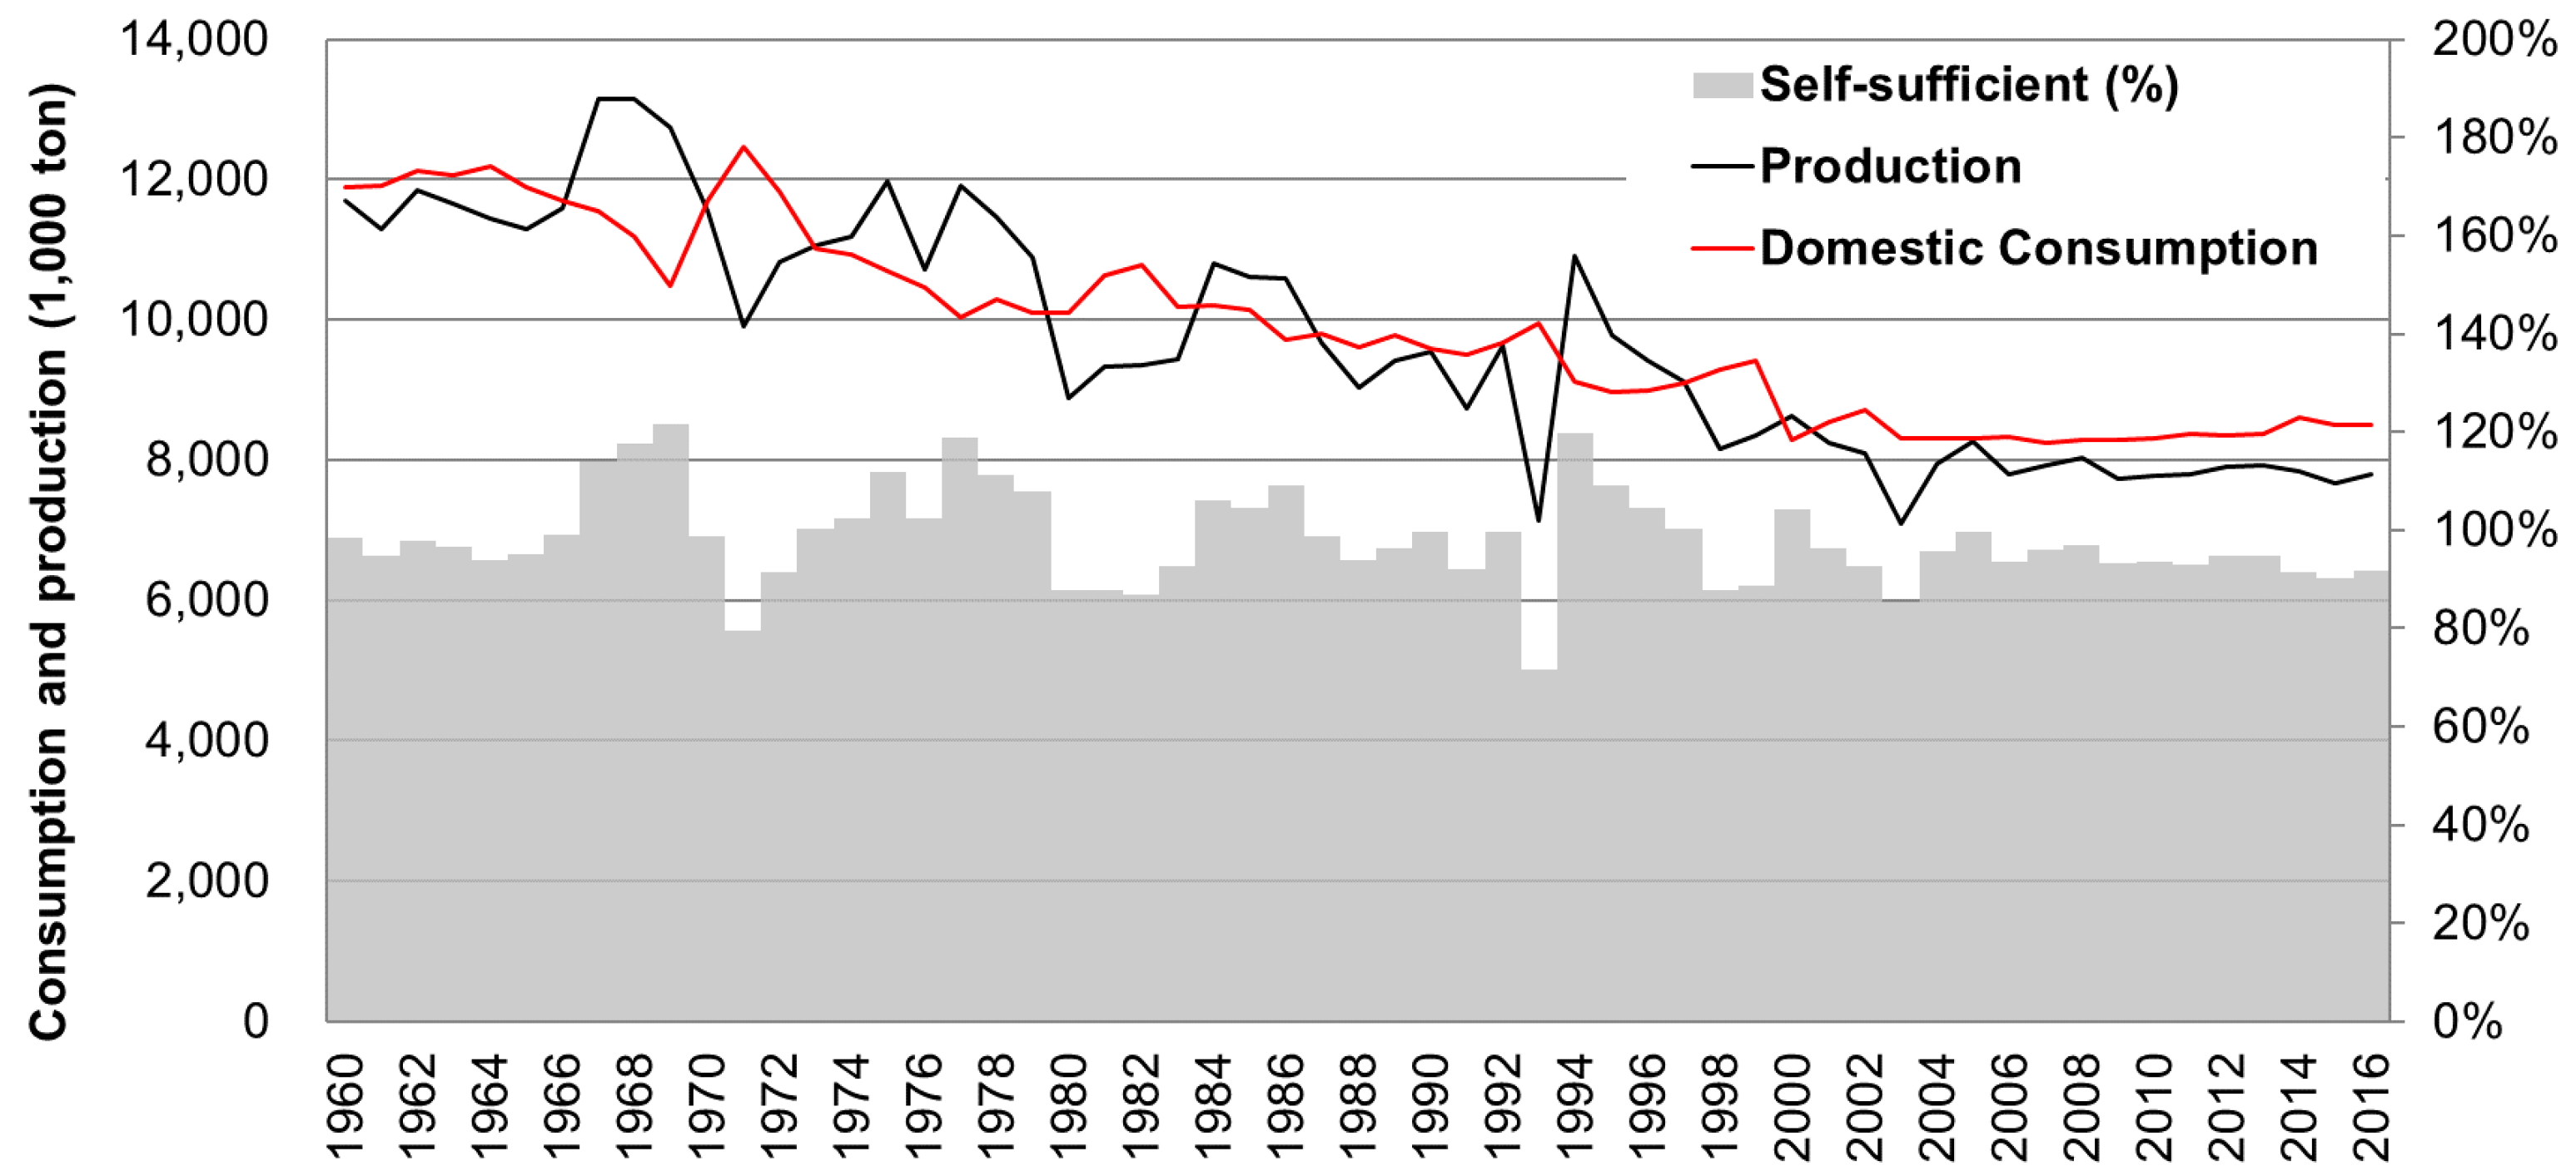
In Japan, rice is the main staple food, and the self-sufficiency ratio (SSR) of rice was around 90% in 2016 [15]. Therefore, we could consider that the food security of rice is high in Japan. Studies of rice in Japan have generally focused on the energy efficiencies and greenhouse gas emissions of rice fields as the harvested area of rice is 1.6 × 10 6 ha, 34% of the total agricultural area in 2015 [16]. In addition, the main consumer of agricultural water resources in Japan is rice fields, for example, 94% of the total water withdrawal in agricultural areas was supplied to rice paddy fields in 2012 [16]. Therefore, rice could be considered as a consumer of energy and water [17,18,
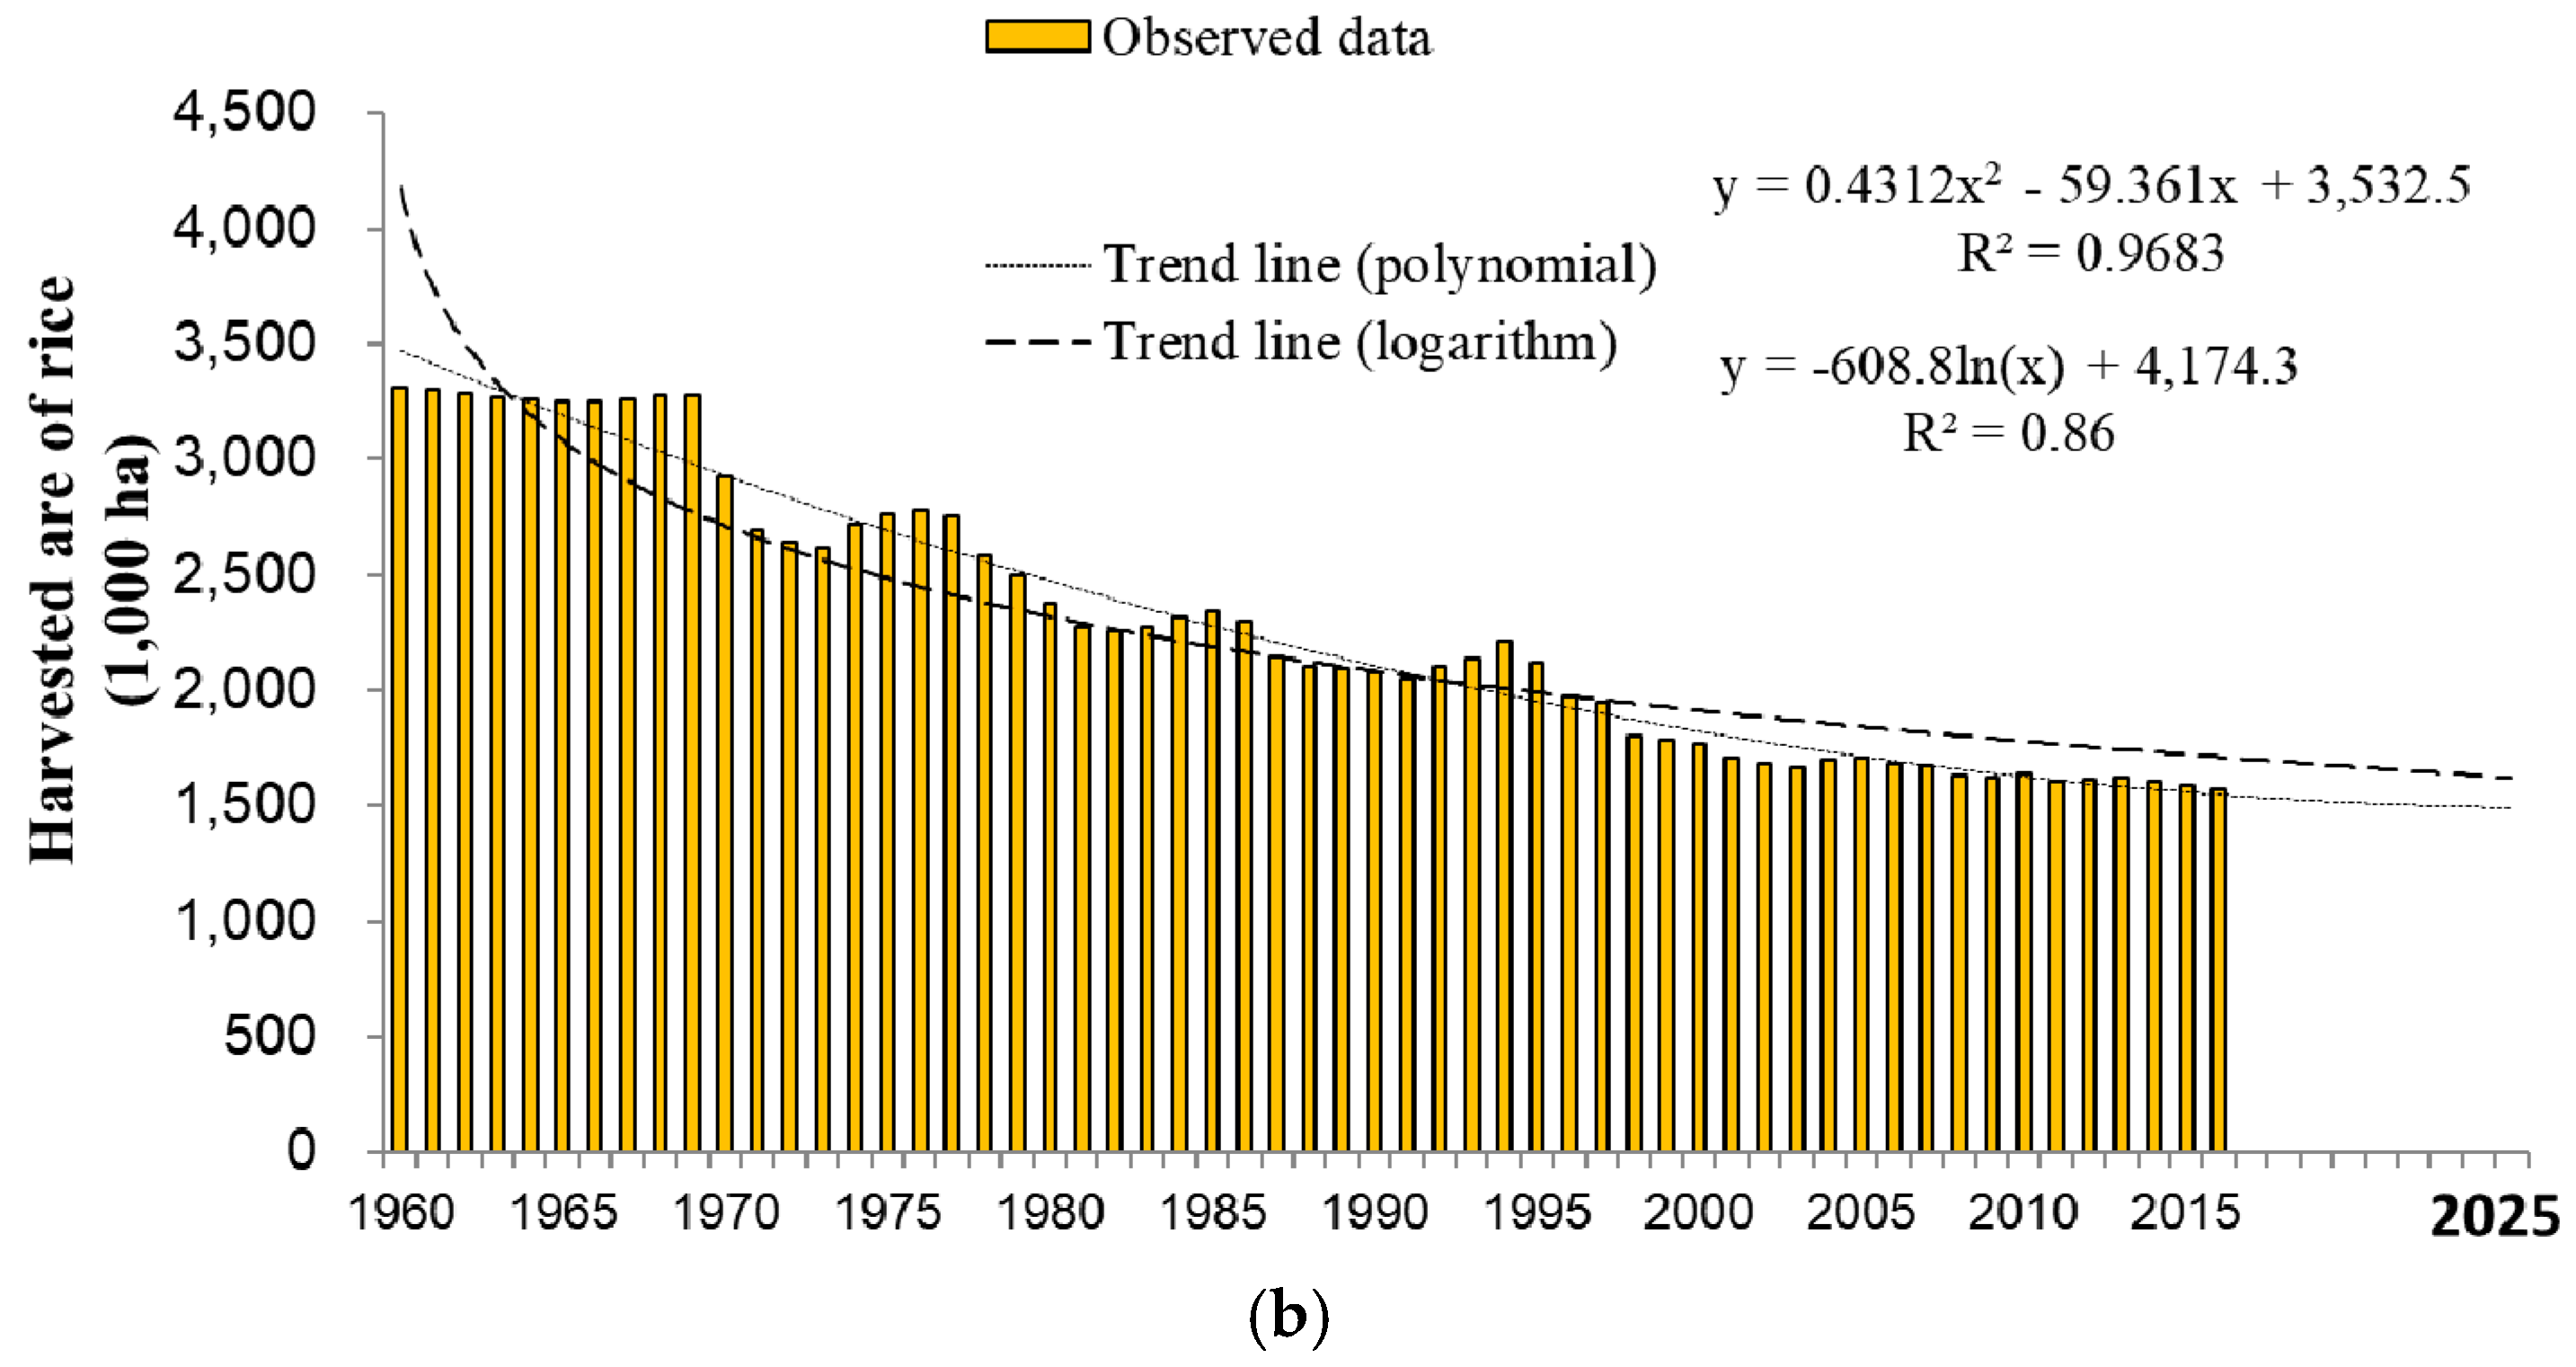
19]. However, in Japan, the harvested area of rice has decreased since 1960, with the area in 2016 being only 44% of the area in 1960, as stated by World Bank open data [20]. In addition, the SSRs of rice in the main consumption areas, such as Tokyo and Osaka, were less than 5%, so the majority of rice is transferred from other areas such as the Akita, Iwate, and Niigata prefectures. Therefore, the decrease in the production of rice could be a serious problem in some areas, even if the national SSR of rice is over 90%. In addition, rice is likely to be more sensitive to global warming than other agricultural crops and livestock, and over 70% of prefectures in Japan recognize the warming effects on rice [21].
Accordingly, the Japanese government’s policy on rice is to maintain self-sufficiency as close to 100% as possible [
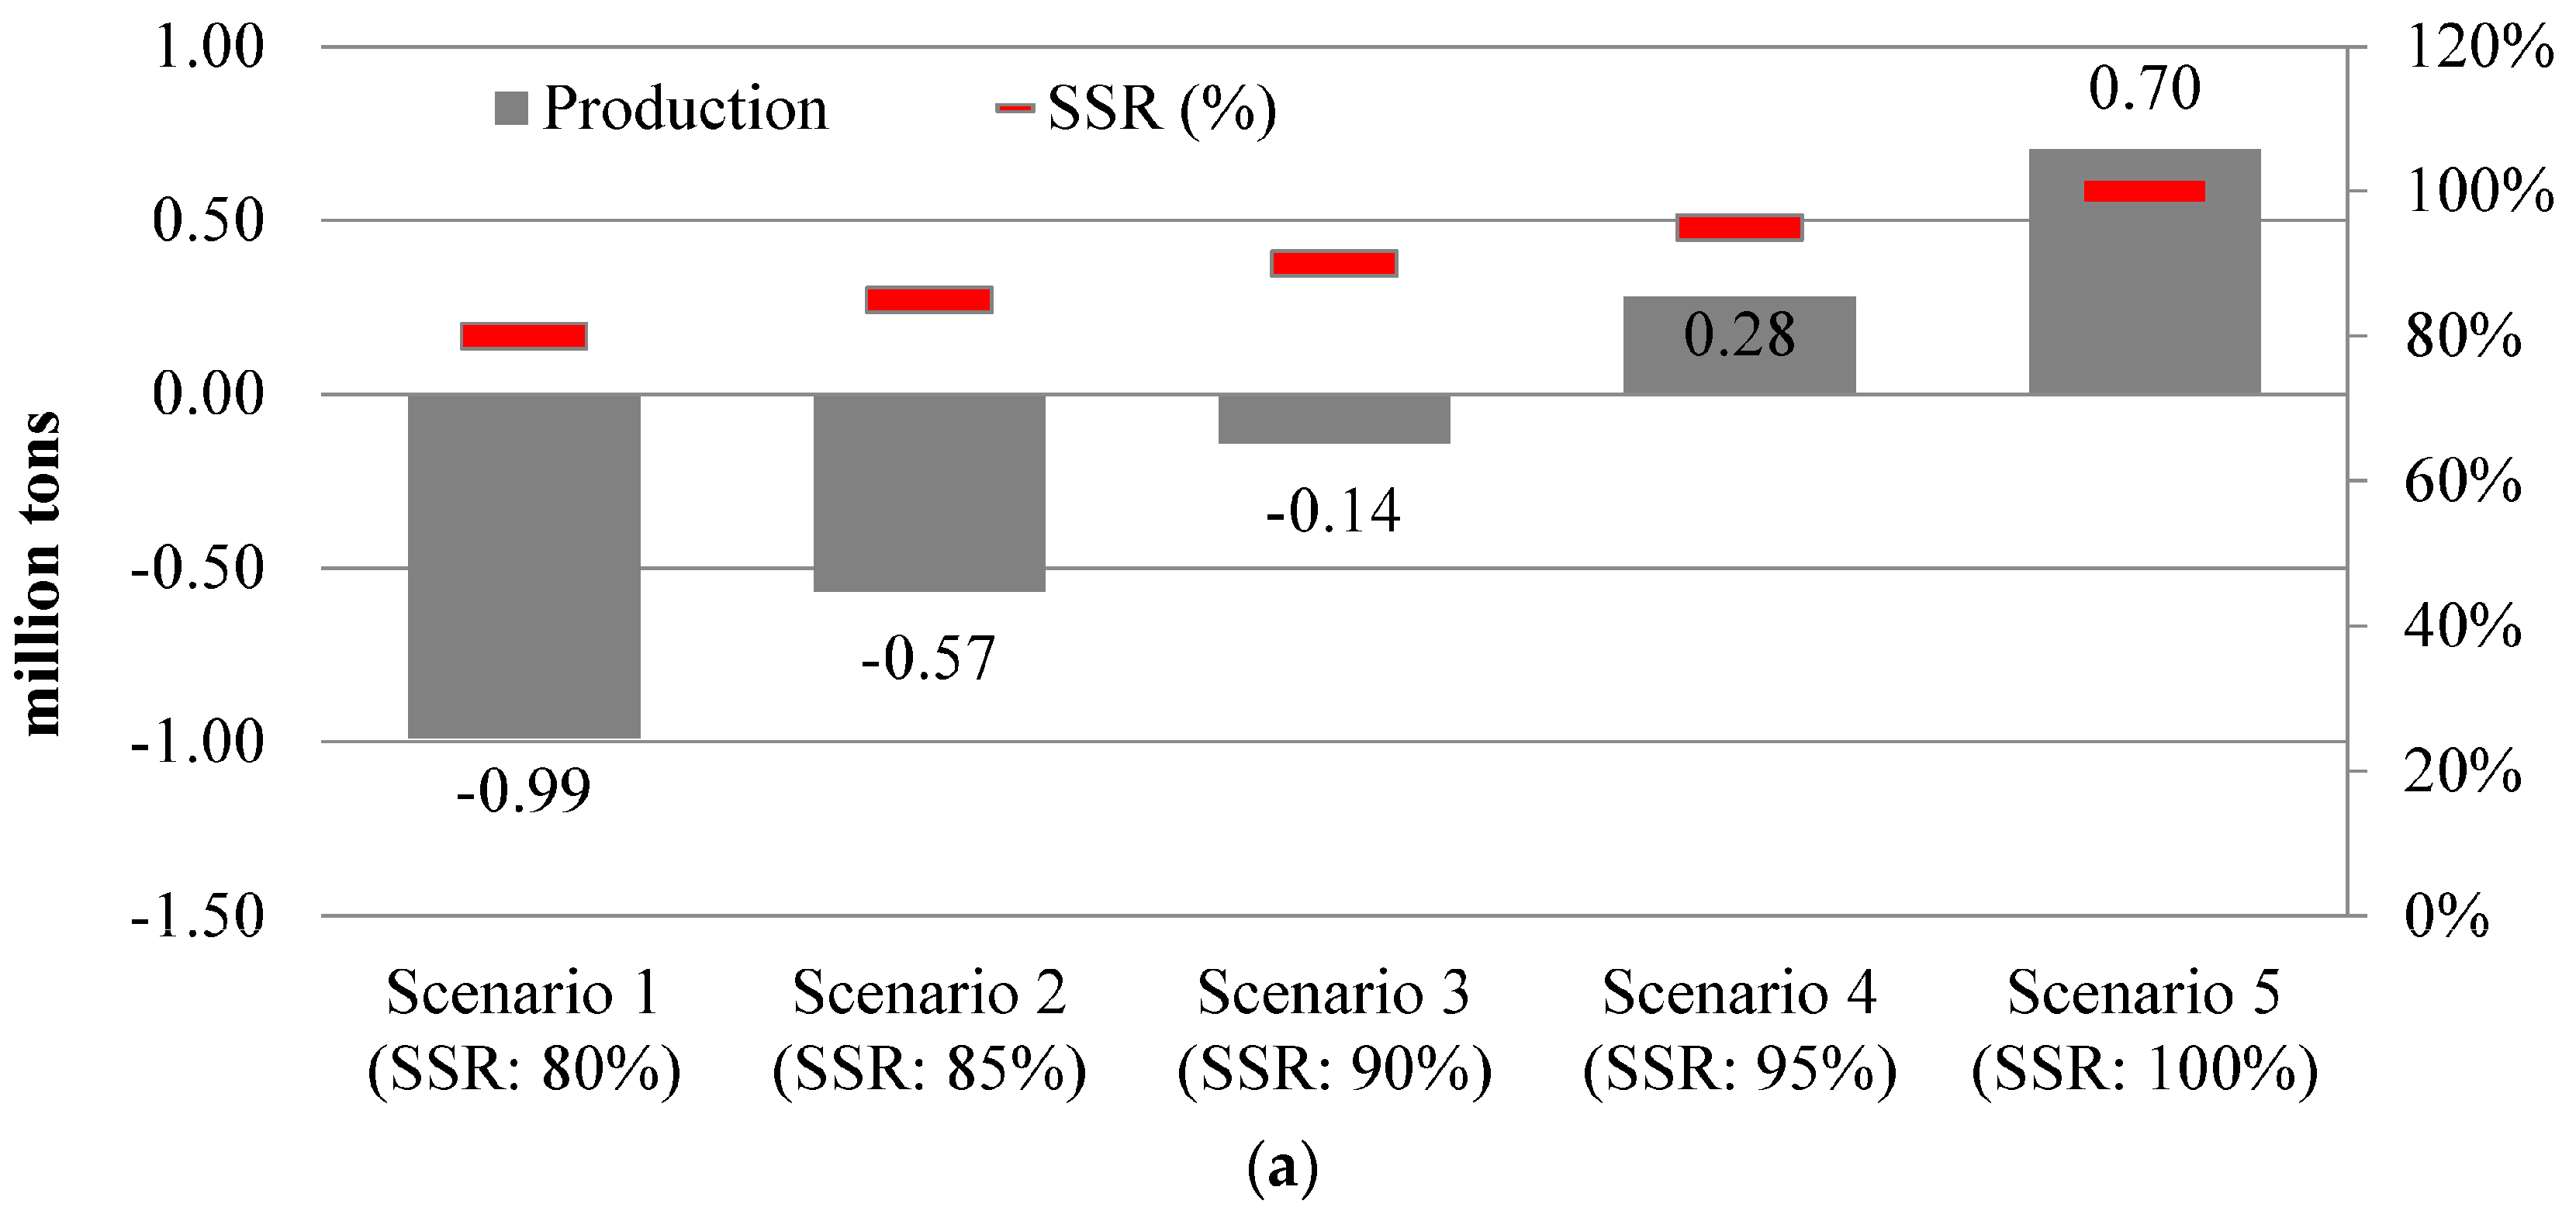
15]. However, global trade agreements necessitate some import of rice from abroad. The increase of exports of expensive food products, including rice, is another Japanese government policy for agriculture. In this situation, adjustments made to rice self-sufficiency are directly related to food security, but also to other resources, such as water, energy, and land security. The Japanese government must assess the consequences of adjusting the levels of rice self-sufficiency in future. To improve food security, it is necessary to maintain a high SSR, which can have a positive economic impact as the income of farmers will increase. However, an increase in domestic rice production will lead to changes in water, energy, and land use. It is, therefore, necessary to assess the tradeoff between food security and other resources such as water, energy, and land. In summary, food management should include an assessment of food security policy, including changes to the food SSR, to gain a holistic perspective that takes water and energy security into consideration, as well as the environmental and socio-economic impact. For this reason, the present study sets the SSR for rice in each target scenario, and then assesses the holistic impact of each SSR. In the first scenario, Japan could remain more than 90% self-sufficient in rice production to ensure its future food security. Other scenarios involve decreasing the level of self-sufficiency to reflect decreasing rice consumption. Food policies designed to improve food security may lead to an increase in domestic products and a decrease in food imports. Such policies can be accompanied by increases in farmers’ incomes. However, food imports can also result in domestic water and energy savings. In particular, food imports are very important for enabling water-poor regions to achieve water security. The holistic impact of such decisions should, therefore, be considered to achieve sustainable development.
The aim of this study is to evaluate the holistic impact of the SSR of rice in Japan using the Nexus approach. Nexus is regarded as a decision support system that assesses the potential benefits of a holistic policy and regulation through analysis of the availability of resources, economic benefit, and environmental impacts.

2. Materials and Methods

2.1. Overall Framework for Assessing the Holistic Impacts of Food Security on Water-Energy-Food-Land

The Nexus approach considered in this study specialized in assessing the food security policy and addressing the quantitative analysis of resource requirements, and comprises portfolios, scenarios, and assessments. Accordingly, the main output of this study is the quantification of food production, water-energy-land requirements, and CO2 emissions by energy use in specific food security scenarios within the trends of externalities such as population, food consumption per capita, and land-use of crop areas. Therefore, the framework of the Nexus approach is based on a decision support system that can apply scenarios and assess them, and it consists of three parts: (1) the development of a calculator that includes the complex relationship among resources; (2) the construction of a database for Water-Energy-Food-Land portfolios; and (3) an assessment of food security scenarios based on the quantification of resource requirements and CO2 emissions.
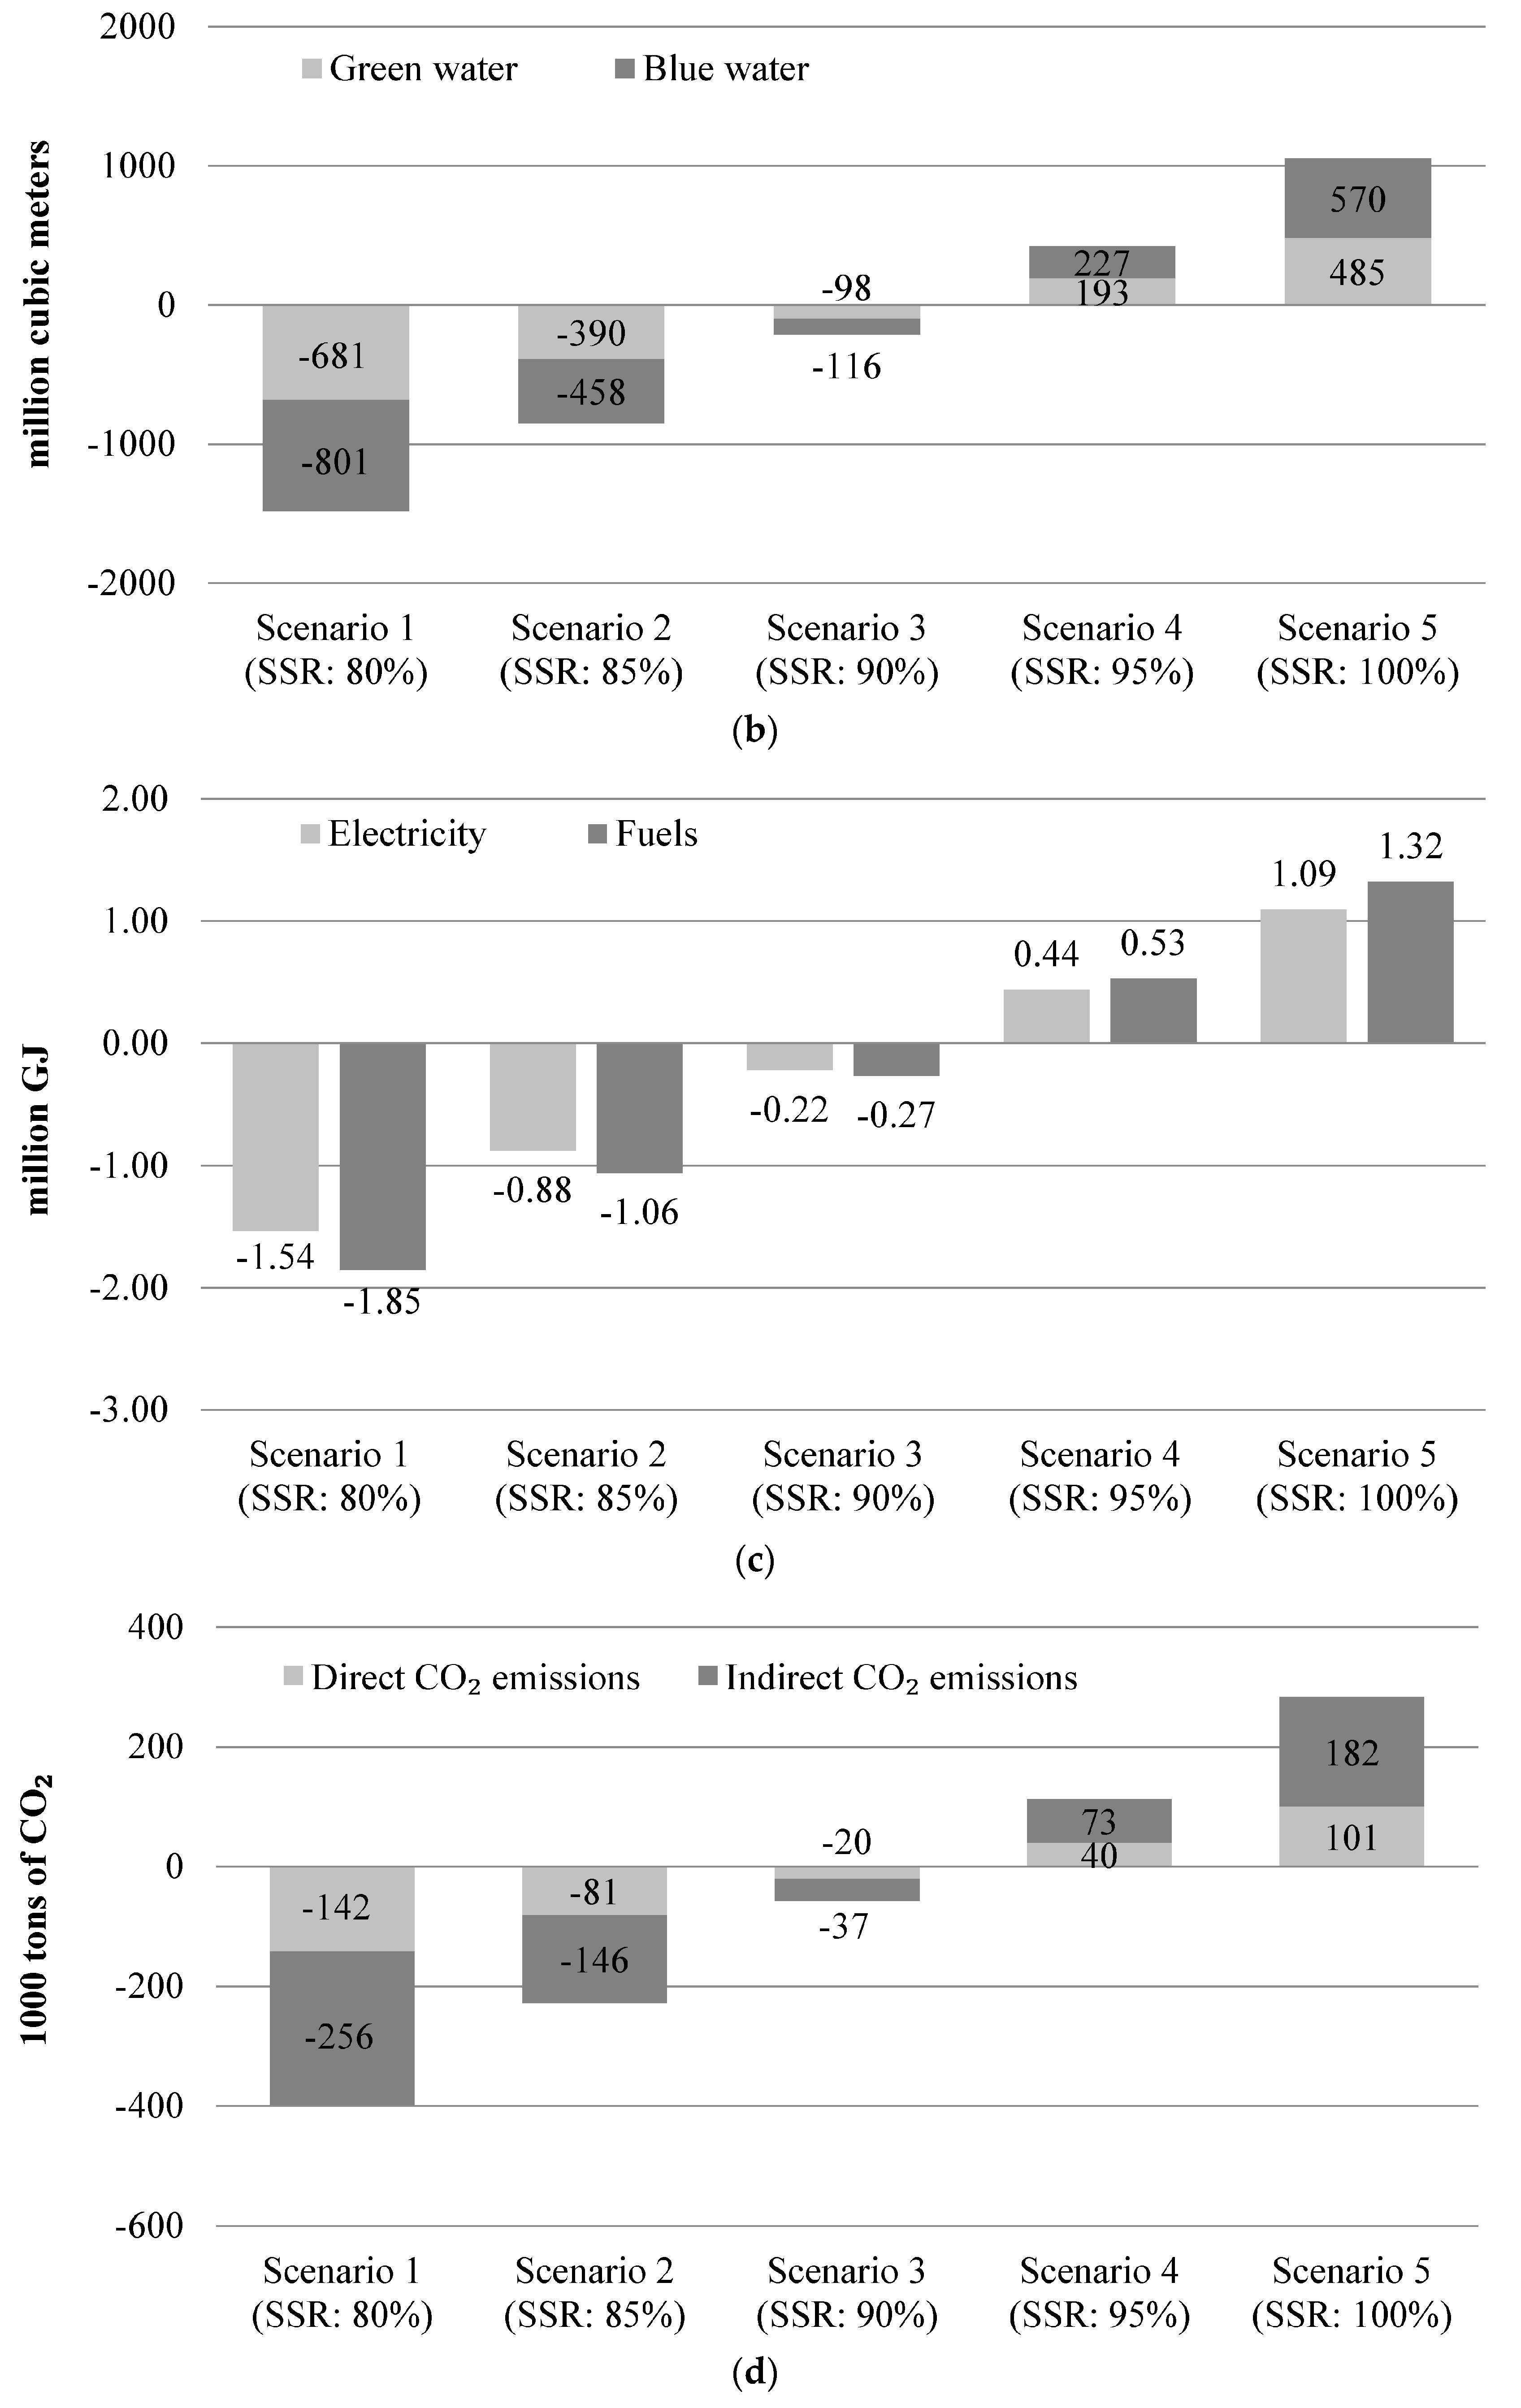
We first identified a complex relationship diagram for rice-related resources and externalities, in terms of food security, using a system-dynamics approach. Based on referenced and surveyed data, we then constructed resource portfolios that show the quantitative relationship between the components in the diagram, including the water for irrigating rice, the energy used in rice fields, the energy used for irrigation and drainage, and the CO2 emissions categorized by energy source. Finally, a target SSR of rice for a specific year (2025) was set to the food security scenarios and the impacts of the SSR scenarios were quantified regarding the requirement or savings of water-energy-land, and the change in CO2 emissions.

2.2. Quantitative Analysis to Assess Food Self-Sufficiency on the Basis of the Complex Relationship between Resources and Externalities

The main strength of the Nexus approach is to analyze tradeoffs and assess scenarios from multidisciplinary perspectives. A tradeoff analysis involves complex relationships between water, energy, food, land, and trade within the context of food management. The quantitative impacts of the scenarios were assessed according to the tradeoffs associated with various scenarios, while a mathematical modeling technique is required to understand the complex issues.
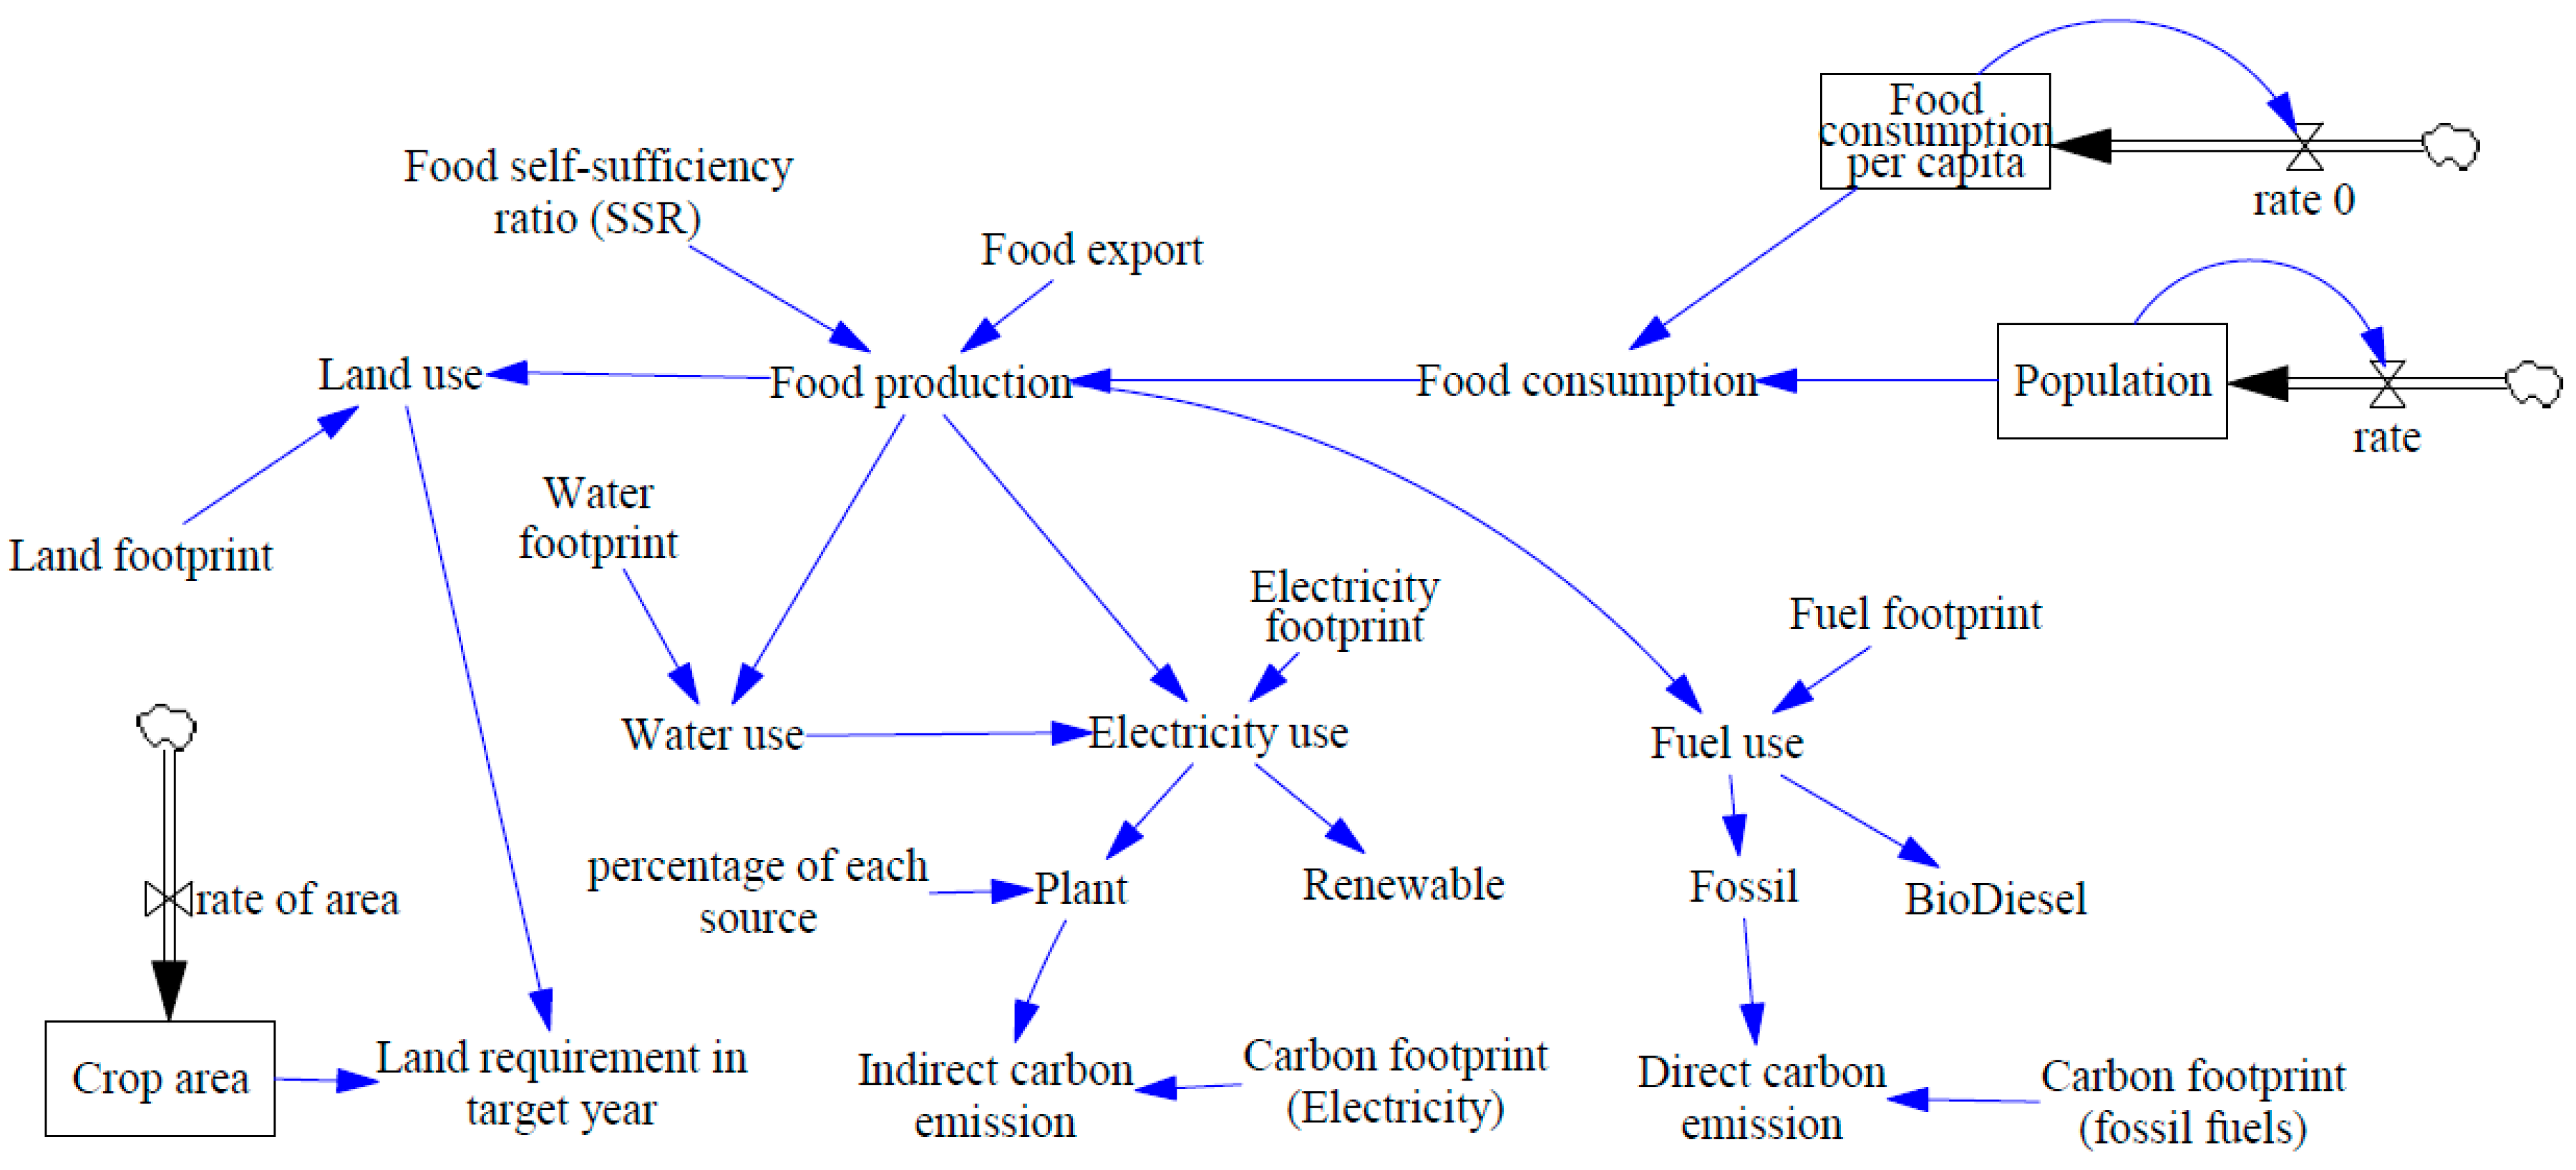
In this study, the impacts of food SSRs on food production and usage of resources were quantified through the complex relationship diagram developed by Vensim, an industrial-strength simulation software for improving the performance of real systems (Figure 1). In this diagram, the requirement of food production for the SSR scenarios was calculated based on the change of food consumption that was decided by the changes in population and food consumption per capita. The water demand for food production in each SSR scenario was calculated by a water footprint that was already surveyed as a resource portfolio. The energy demand has two consumers, including an example energy input for the cultivation of rice in paddy fields and the energy use for irrigation and drainage. Therefore, food production could indirectly affect the energy requirement relating to water demand. The diagram in Figure 1 includes the assessment of water and energy security using the capacity of water and energy. However, in this study we only consider rice production, thus it is limited as the water and energy use by rice production represents the index for the total water and energy security. The specific quantification of resources in this diagram, such as water, land, electricity, fuel requirements, and CO2 emissions, were calculated using the footprints of each resource as follows:
  P r o d i = ( S S R t a r g e t ,   i × C o n i ) + E x p o r t i  
  W U i = P r o d i × ( W F g r e e n + W F b l u e )  
  L U i = P r o d i × L F  
E U e l e c t r i c i t y ,   i = L U i × ( E E F w a t e r + E E F f i e l d )
  E U f u e l ,   i = L U i × E F F f i e l d  
  I n d i r e c t   CO 2   i = E U e l e c t r i c i t y ,   i × j n ( r j × C F e l e c t r i c i t y ,   j )  
D i r e c t   CO 2   i = E U f u e l ,   i × C F f u e l  
where i is the specific year, P r o d i (ton) is domestic production, S S R t a r g e t ,   i is the target self-sufficiency ratio, E x p o r t i (ton) is food export, and C o n i (ton) is food consumption, calculated using a trend equation. The factors W U i (m3), L U i (ha), E U e l e c t r i c i t y ,   i (kWh), and E U f u e l ,   i (GJ) are the required amounts of water, land, electricity, and fuel in specific year I, respectively. These requirements are calculated using various footprints: the green water footprint ( W F g r e e n , m3/ton), blue water footprint ( W F b l u e , m3/ton), land footprint ( L F , ha/ton), electricity footprint for irrigation and drainage ( E E F w a t e r , kWh/ha), electricity footprint in a field ( E E F f i e l d , kWh/ha), and the fuel footprint in a field ( E F F f i e l d , GJ/ha). I n d i r e c t   CO 2   i (ton of CO2) is the amount of indirect CO2 emissions produced by generating electricity. C F e l e c t r i c i t y ,   j (ton of CO2/kWh) is the carbon footprint by the source of electricity (j), such as coal, nuclear power, and natural gas; r j is the percentage of each source (j) used to generate 1 kWh electricity. D i r e c t   CO 2   i (ton of CO2) is the amount of direct CO2 emissions produced by burning fuels, while C F f u e l (ton of CO2/GJ) indicates the carbon footprint of the fuel.

2.3. Resource Portfolios for Rice Production in Japan

A key part of the Nexus modeling process is to construct a water-energy-food portfolio that indicates the quantitative relationship between resources, such as the amount of water needed for food, the energy needed for food, and the energy needed for water. In addition, the carbon footprint and land productivity are regarded as the main components of the portfolio. These Nexus databases include not only resource portfolios but also systems. The portfolios are, thus, related to systems, such as the food system (e.g., urban gardens, open fields, and greenhouses), the water system (e.g., reservoirs, treated water, and desalination), and energy systems (e.g., renewable energy).
As the present study focuses more on the impact of food management, the portfolio is mainly related to food. We collected the data of rice production, rice consumption per capita, and the harvested area of rice fields in Japan from 1960 to 2016 from the Statistics Bureau managed by the Ministry of Internal Affairs and Communications in Japan (http://www.stat.go.jp). Based on the production and harvested areas of rice, we estimated the productivity of rice fields. For example, the water for food indicates irrigation requirements, while the energy for food indicates the direct fuel or electricity consumption of a crop area. In addition, the land requirement is one of the main components of the portfolio. Water, energy use with a carbon footprint, land productivity, and energy consumption for irrigation and drainage are the main components of the portfolio.
The water footprint of a crop indicates the crop water requirement (m3/ha) per yield (ton/ha). Therefore, the water footprint (m3/ton) is the volume of water required to produce one ton of crops in the region; it consists of green and blue water [22]. The green water footprint indicates the volume of rainwater consumed, while the blue water footprint indicates the volume of irrigated water (surface and groundwater) consumed. The water footprint may connect water and food as food consumption has a significant impact on water requirement and production. We have, therefore, estimated the green and blue water footprints of rice and the national green and blue water footprints of various crops [23,24]. Table 1 shows the water footprint of rice in Japan [23]. Crop water required was calculated by the CROPWAT4 based on evapotranspiration by FAO Penman-Monteith equation and effective rainfall by USDA SCS method. In the assessment of water consumption by crops, percolation is excluded from the water footprint because it can be used to recharge ground or surface water. However, in terms of water supply, the total irrigation water supply reflects the sum of the blue water footprint and the percolation of irrigation water.
Land productivity (ton/ha) has been used to quantify the projected production, in accordance with an increase or decrease in the harvested area; it has been estimated using historical production and harvested area data, as shown in Figure 2. The productivity of paddy rice has increased since 1961, reaching 4.96 ton/ha in 2016. However, as the productivity of rice paddies can be seriously affected by climate, drought, and floods, it is difficult to project future productivity. We have, therefore, applied recent land productivity figures for rice (4.96 ton/ha) to estimate production.
The total energy use of rice paddies can be divided into the energy input to the fields and the amount of electricity used for water irrigation and drainage. One component of the energy input in rice paddies is the direct consumption of fuel and electricity resulting from the use of machinery. Table 2 [25] presents survey results from the western Kanto area, showing the input of materials and energy during the cultivation of several crops of nursery rice seedlings. For example, 9.4 GJ was used by the consumption of fuels and 0.4 GJ/ha was used by electricity. In addition, various fuel types were used, including diesel (2.7 GJ/ha), gasoline (0.7 GJ/ha), kerosene (4.4 GJ/ha), and blended oil (1.5 GJ/ha). Therefore, the sum of the energy conversion values, including fuel and electricity, is about 9.8 GJ/ha, with about 63% of the total energy being used to till the rice paddies and dry the rice [25].
In Japan’s lowland rice paddies, adequate irrigation drainage facilities are indispensable for the production of rice. This efficient type of farming is supported by energy inputs that provide irrigation and drainage. Even in national studies, there is insufficient data on the energy consumption of crop areas. For this reason, we have used a case study carried out in the Kanbara Plain (Niigata Prefecture, Nishikanbara area), as shown in Figure 3, the most downstream Shinano River area, which has developed an energy portfolio with a high reliance on electricity for both irrigation and drainage [26]. About 1.2 MWh were needed to irrigate 1 ha of rice fields; 0.825 MWh/ha [26] of energy was consumed in drainage.
CO2 emissions can be divided into direct and indirect emissions. Direct CO2 emissions are caused by burning fuels, while indirect emissions are caused by the electricity generated by power plants. This study has surveyed the quantity of the CO2 emitted by burning fuels, and used this figure to estimate the CO2 directly emitted by fuel in rice paddies, as shown in Table 3. For example, 0.0098 tons of CO2 is emitted by burning 1 gallon of gasoline [27]. Indirect CO
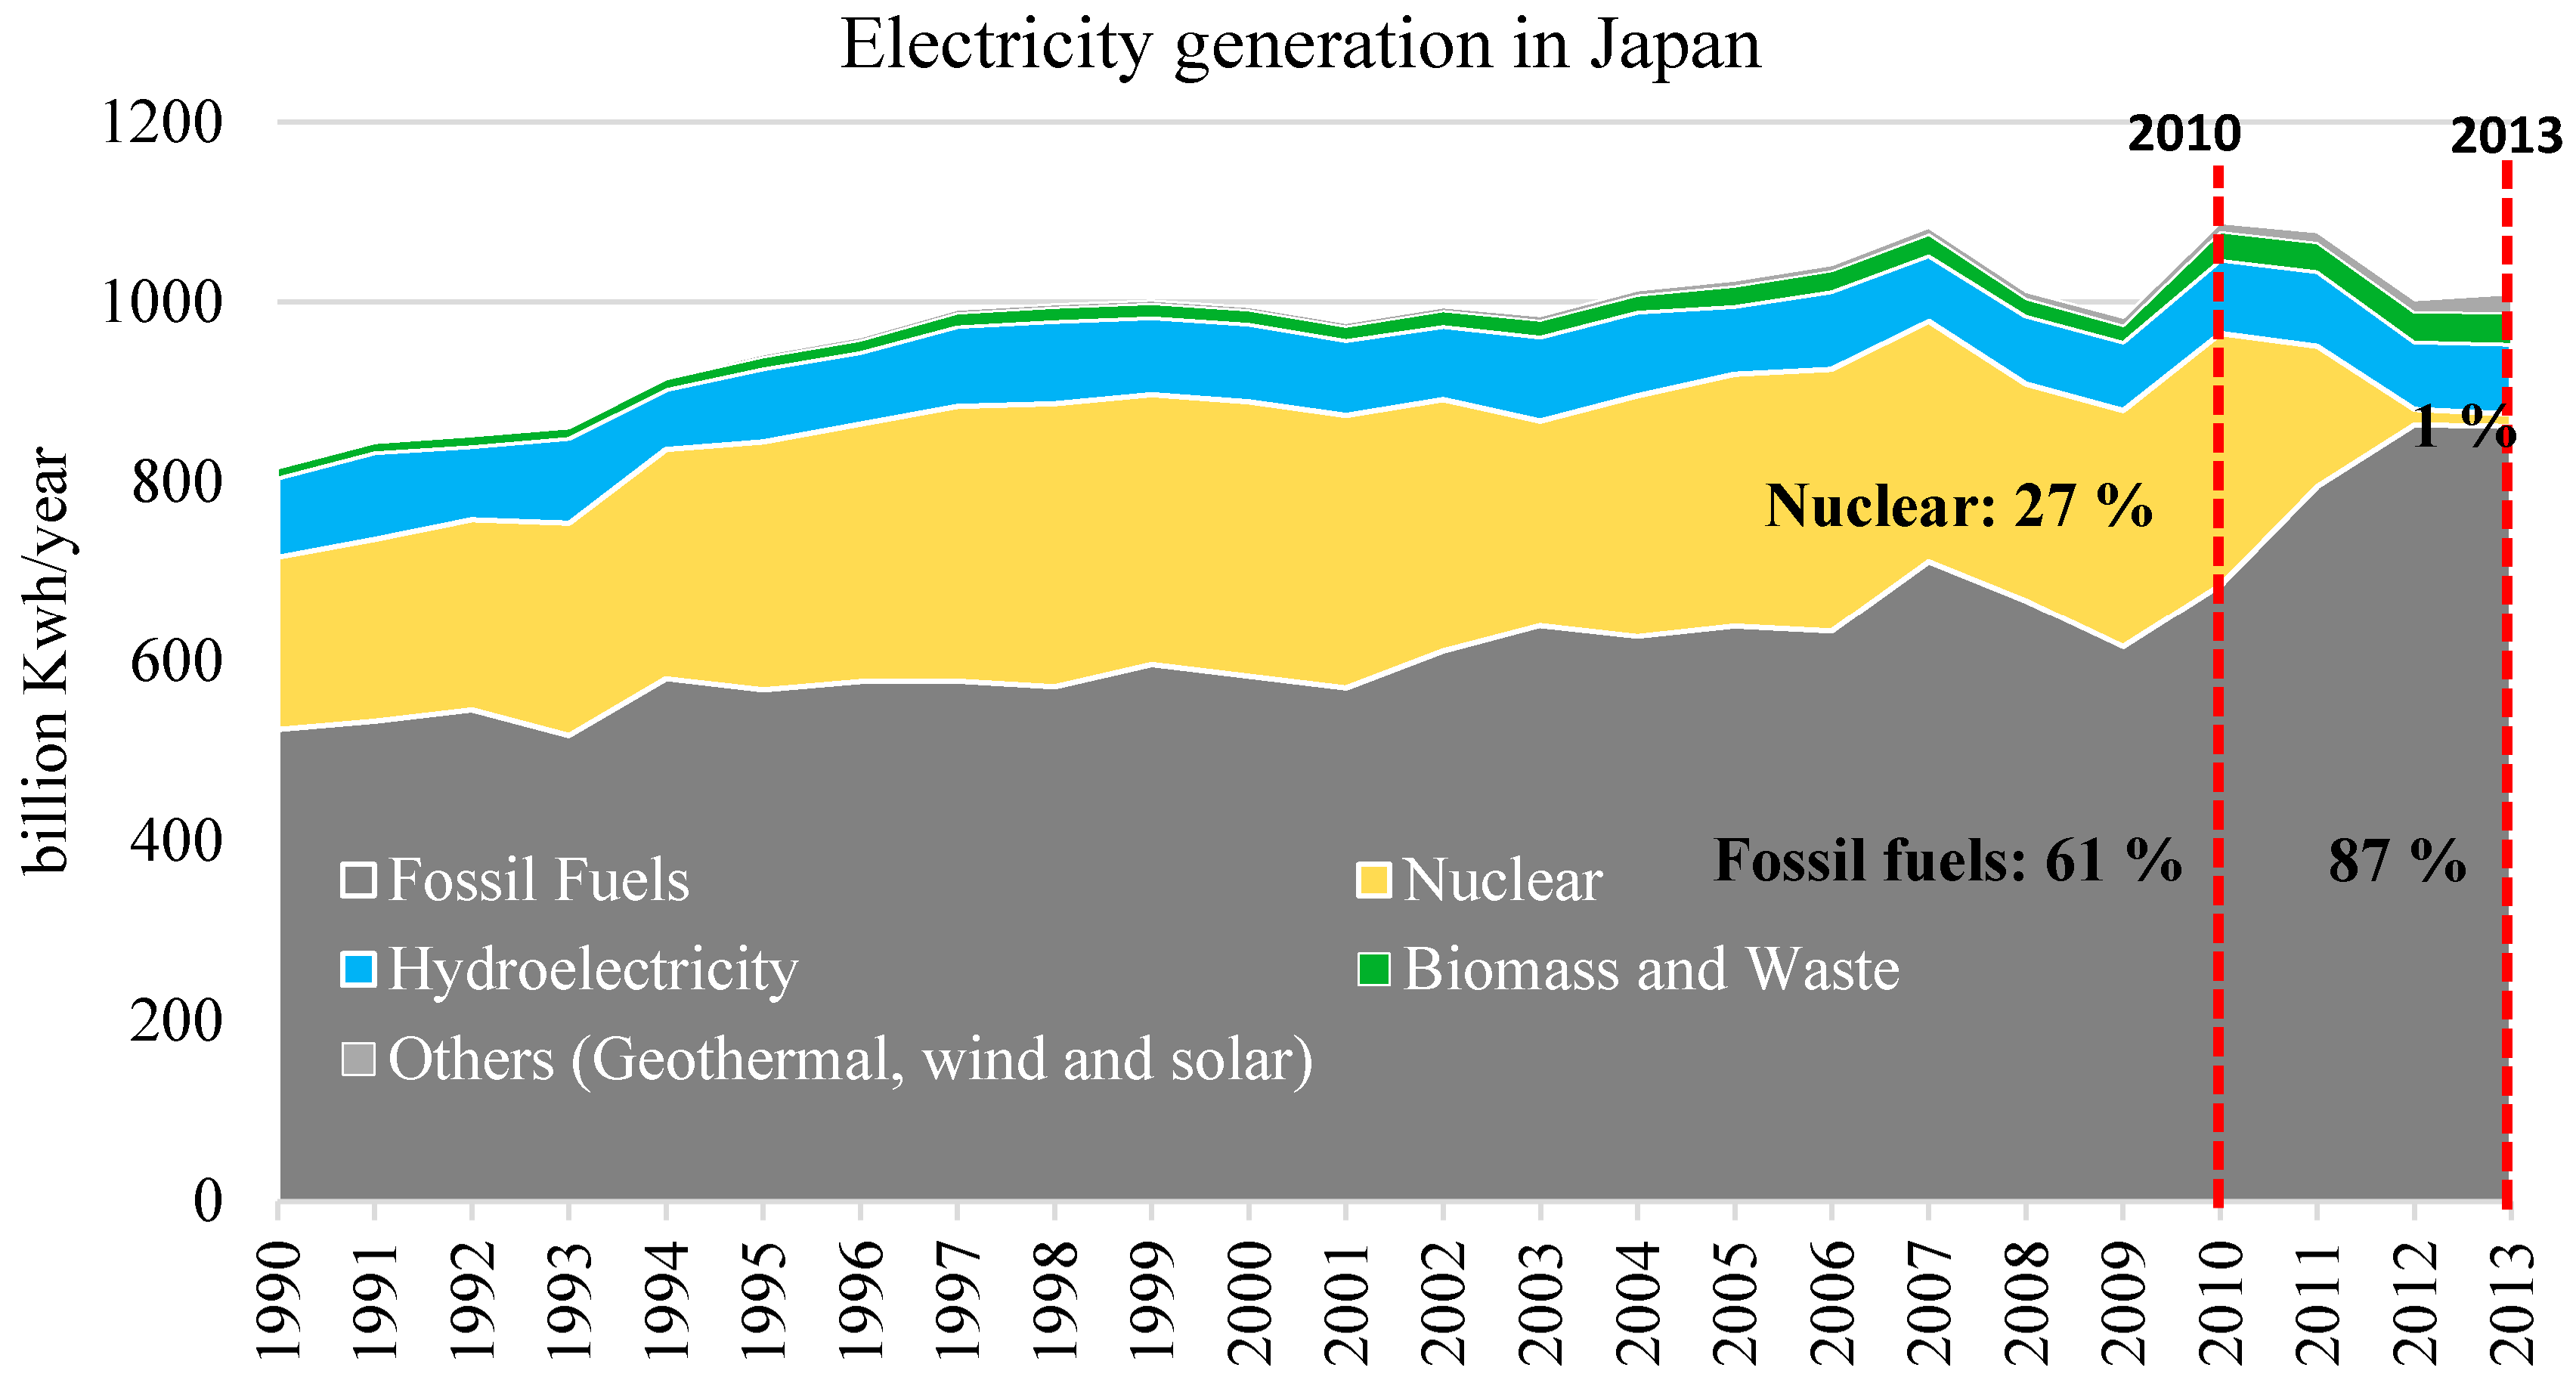
2 emissions are based on the sources of energy in power plants. In Japan, the main sources of electricity generation were natural gas, nuclear power, and coal before the Fukushima accident in 2011 (Figure 4). After the accident, Japan’s dependency on nuclear power sharply declined because the plant was shut down. The proportion of natural gas, coal, and petroleum has increased, as shown in Table 3. For example, the percentage of coal used to provide electricity increased from 24% to 30% after the Fukushima accident [28]; this may produce more CO2 emissions when used to generate electricity in Japan.

3. Results and Discussion

3.1. Analysis of Consumption and Land-Use Trends

Nexus is capable of assessing the way food security is managed in several scenarios by considering different variables. Food consumption, land use, food trade, and food self-sufficiency are variables in these scenarios; a stakeholder (e.g., a resource manager) can combine these variables to create food scenarios. Figure 5 shows consumption in Japan from 1960 to 2016. Both domestic production and consumption have shown a decrease since 1960, but the gap between production and consumption has been less than 1 × 10 6 tons, showing that the majority of rice consumed in Japan is produced domestically. In other words, the SSR for rice in Japan has distinctly fluctuated between 1961 and 2016. More recently, the SSR of rice has been maintained above 90%.
Food consumption can be a key externality used to assess the management of food security; this study has surveyed consumption in Japan from 1960 to 2015. Although consumption has decreased, the slope of the decrease has been gentle. We have analyzed the consumption trend line to estimate future consumption for a target year, as shown in Figure 6a. Polynomial and log equations have been selected to project consumption. The polynomial equation trend for consumption shows a steeper trend than the logarithmic equation projection. Based on the consumption trend, we have estimated food consumption for a target year. Domestic food production, the main variable in food security, has been determined by the harvested areas in this study. We have, therefore, analyzed the trend line for harvested areas to estimate future rice production. The well-fitted trend line in Figure 6b shows the use of land for rice in Japan from 1960 to 2015. It indicates that the area of land used for rice has decreased.

3.2. Quantification of Resource Requirements and CO2 Emissions by Simulated Self-Sufficiency Ratios (SSRs) for 2025

Based on the trends for consumption and the area harvested for rice, we have simulated the SSRs for rice and estimated the resource requirements and CO2 emissions for specific years. Firstly, the current rice-based food-security impacts were assessed by applying historical data in 2016, including food consumption and land use. The projection scenario was based on the projected data in the target year, which has been set as 2025 in this study. In the case of rice exports, the average value of the 2000–2012 period was applied. Table 4 shows that production and consumption were 7.79 and 8.50 × 10 6 tons/year, indicating that the SSR for rice production was 91% in 2016 as a baseline. In addition, 11,677 × 10 6 m3 of water was used for rice cultivation, and 26.7 × 10 6 GJ of energy for irrigation, drainage, and cultivation; electricity plants generated 12.1 × 10 6 GJ of energy, producing 2.0 × 10 6 tons of CO2 emissions. In addition, 14.6 × 10 6 GJ of fuel, such as gasoline and diesel, were used; 1.1 × 10 6 tons of CO2 were emitted directly by the machines used to till, transport, and fertilize rice fields.
As food security is affected by food consumption and land use, we projected consumption and the area harvested for rice in 2025 using polynomial and logarithmic regression equations, as shown in Table 4. The highest SSR appeared in “Projection 2”, which applied a polynomial equation to the trend of consumption and a logarithmic equation to the harvested area. Consumption was predicted to decrease from 8.50 (baseline) to 7.85 × 10 6 tons in 2025, while the area harvested for rice would be 1.62 × 10 6 ha, producing 8.06 × 10 6 tons of rice. Therefore, the SSR for rice production could be over 100% in 2025; all rice consumed domestically would be provided through domestic production. The lowest level of food security based on rice was simulated by “Projection 3”, which applied the logarithmic and polynomial equations to the trends of consumption and the area harvested for rice. In “Projection 3”, the SSR for rice production was predicted to drop to 87% in 2025 as rice production declined more steeply than consumption between the years of 2016 and 2025. The decreasing SSR would reduce water and energy use in 2025. The total water used to cultivate rice would decrease to 11,104 × 10 6 m3, saving about 573 × 10 6 m3 of water. In terms of energy, 0.59 × 10 6 GJ of electricity and 0.72 × 10 6 GJ of fuel would be saved in comparison with the baseline, creating a reduction of 154,000 tons of CO2 emissions. These results show that consumption trends and changes to the area harvested for rice impact food security, water-energy requirements, and CO2 emissions.

3.3. Assessment of the Impact of Target SSRs for Rice in 2025

Food security is the most significant factor in food policy; thus, the key question about these scenarios is how food security affects resources and CO2 emissions. To establish this, we set low and high SSRs for rice production as scenarios and assessed their impact on water-energy requirements and CO2 emissions within the trend of consumption.
Using logarithmic and polynomial equations to follow the trends of consumption and changes in the areas harvested for rice, we found that the SSR for rice production would decrease to 87% in 2025, causing the smallest decrease in consumption. We set SSRs ranging from 80% to 100% as low, with a high level of food security within the trend of consumption through the logarithmic equation. For example, “Scenario 1” set an 80% SSR for rice production as its food security target in 2025; this showed how much water and energy would be used to achieve an 80% SSR for rice production as consumption decreased to 8.46 × 10 6 tons in 2025. By contrast, “Scenario 5” stipulated an SSR of 100%, indicating the highest level of food security, as shown in Table 5. We then assessed the impact of low and high SSRs on resource requirements and CO2 emissions, and compared the results with the 2016 baseline, shown in Figure 7.
“Scenario 1” represents a low-level SSR (80%) in 2025, which is less than the baseline (91%) in 2016. This estimates that rice production will decrease to 6.80 × 10 6 tons in 2025, 0.99 × 10 6 tons less than the baseline. By contrast, “Scenario 5” aims for an SSR of 100% in rice production to ensure food security; thus, 8.49 × 10 6 tons of rice should be produced (Table 5). This means that an additional 0.7 × 10 6 tons of rice will be required in comparison with the baseline, as shown in Figure 7a. If rice production is maintained at baseline levels, an SSR between 90% and 95% could be achieved. However, the SSR increase will also increase resource requirements for water, energy, and land. Table 5 and Figure 7b show how much water could be saved or used to achieve each SSR; for example, 10,195 × 10 6 m3 of water will be used in “Scenario 1”, saving 681 × 10 6 m3 of green water and 801 × 10 6 m3 of blue water in comparison with the baseline, despite the drop in food security based on rice. By contrast, 12,732 × 10 6 m3 of water is required in “Scenario 5” to achieve an SSR of 100% for rice production, adding 485 × 10 6 m3 of green water and 507 × 10 6 m3 of blue water to the baseline. Figure 7c demonstrates how much more energy is required in each scenario, in comparison with the baseline. × 10 6 use is also related to CO2 emissions. For example, “Scenario 1” shows that an 80% SSR for rice production in 2025 will use 23.31 × 10 6 GJ of energy (Table 5), saving 3.39 × 10 6 GJ of energy in comparison with the baseline, and reducing CO2 emissions by 398,000 tons, as shown in Figure 7d. By contrast, an additional 2.41 × 10 6 GJ of energy will be needed in “Scenario 5”. In particular, an additional 1.32 × 10 6 GJ of fuel will be used; this could result in an energy security issue in Japan in which a high proportion of fuel is imported. Furthermore, an extra 101,000 tons of CO2 will be emitted from rice fields and an extra 182,000 tons of CO2 emissions will be emitted from electricity plants in 2025, in comparison with the baseline. The increased SSR also reflects an increase in production, suggesting the need for more land. Therefore, about 0.14 × 10 6 ha of rice fields will be required to meet the 100% SSR for rice production in 2025 in “Scenario 5”, as shown in Figure 7e.
Although the SSR is the key factor in food security, there is a tradeoff between food security and water-energy-land-CO2 savings. A sustainable food policy should consider how much extra water will be needed to achieve food security.

4. Conclusions

The main function of the Nexus approach is to act as a support system for decision-makers, enhancing their ability to assess the short- and long-term impacts of current and future resource management and food security strategies sustainably. In particular, agriculture faces water shortages due to recurring droughts, declining groundwater levels, and increased municipal demands for water. The Nexus approach can provide a holistic perspective on the environmental, social, and economic impacts caused by resource management.
The present study has used the Nexus approach to illustrate a way of quantifying resource consumption for the complex relationship between water, energy, food, and land. In addition, it suggests a way of assessing the holistic impact of rice-based food security in Japan. However, this framework is an analytical model and is based on a theoretical methodology rather than a field study. In addition, most of the data and coefficients in the complex diagram were produced on the basis of past literature. An assessment of the environmental and socioeconomic impacts should be required for the holistic assessment of food security; however, this study focused more upon the quantification of scenarios based on the relationship among the resources. The environmental and socioeconomic impacts could be treated as a more complicated relationship with not only resources but also price, society, and environment. This study was based on a national-scale database and analysis, thus it is limited to represent regional characteristics, such as different resource endowments, economic structure and population density, and food demand. In addition, this study focused on scenarios in the year 2025 but some databases, such as the water footprint and land productivity, were based on data simulated from historical periods. Thus, uncertainty of data could occur if the future scenarios are assessed.
However, this study could be the beginning of Nexus development and future research is required for a high resolution of spatial and temporal analysis in the Nexus. Although there were limitations such as data availability, lack of environmental and socioeconomic impacts, and high dependence on theoretical methodology, the framework developed in this study demonstrated how the Nexus approach could be used from the viewpoint of integrating food policy and sustainable resource management. In addition, it is a scenario-based framework, and thus the user could create various scenarios about food security and compare them. This framework is also adaptable; for example, the coefficients or profiles, such as the water footprint, could be updated through field studies.
It is clear that the high level of food security could lead to more water, energy, and land use for an increasing domestic production; however, it is important to quantify the amount of resources required for achieving the target food security. Without quantification, cooperation among resource managers, stakeholders, and policy makers could not be expected. The first step in collaborating on food policy and other forms of resource management could start with the quantification of the impacts of food policy. Therefore, this study focused on rice, the most important food in Japan, as the study crop and developed the framework based on the Nexus approach for quantifying the water-energy-land use and CO2 emissions by energy. We believe that this study helps to develop a common framework for scientists and policy-makers to evaluate sustainable resource management. It also has the potential to achieve integrated water, energy, and food security.

Author Contributions

S.-H.L. (Sang-Hyun Lee), R.H.M., and S.-H.Y. (Seung-Hwan Yoo); Methodology, S.-H.L. (Sang-Hyun Lee), J.-Y.C., and S.-H.Y. (Seung-Hwan Yoo); Software, S.-H.L. (Sang-Hyun Lee), and S.-H.Y. (Seung-Hwan Yoo); Resources, M.T., R.H.M., and S.-H.Y. (Seung-Hwan Yoo); Writing-Original Draft Preparation, S.-H.L. (Sang-Hyun Lee); Writing-Review & Editing, M.T., and J.-Y.C.; Project Administration, S.-H.Y. (Seung-Hwan Yoo); Funding Acquisition, S.-H.Y. (Seung-Hwan Yoo).

Funding

This study was carried out with the support of the “Research Program for Agricultural Science & Technology Development (Project No. PJ013435)”, National Institute of Agricultural Science, Rural Development Administration, Republic of Korea.

Conflicts of Interest

The authors declare that there are no conflicts of interest regarding this publication.

References

  1. Mohtar, R.H.; Daher, B. Water, energy, and food: The ultimate Nexus. Encyclopedia of Agricultural, Food and Biological Engineering; Taylor & Francis: Milton Park, UK, 2012; pp. 1–15. [Google Scholar]
  2. Weitz, N.; Nilsson, M.; Davis, M. A Nexus approach to the post-2015 agenda: Formulating integrated water, energy, and food SDGs. SAIS Rev. Int. Aff. 2014, 34, 37–50. [Google Scholar] [CrossRef]
  3. Hoff, H. Understanding the Nexus. Background Paper for the Bonn2011 Conference: The Water, Energy and Food Security Nexus; Stockholm Environment Institute: Stockholm, Sweden, 2011. [Google Scholar]
  4. World Economic Forum. Global Risks: An Initiative of the Risk Response Network, 6th ed.; World Economic Forum: Cologne, Germany; Geneva, Switzerland, 2011. [Google Scholar]
  5. Bhaduri, A.; Ringler, C.; Dombrowski, I.; Mohtar, R.; Scheumann, W. Sustainability in the water-energy-food Nexus. Water Int. 2015, 40, 723–732. [Google Scholar] [CrossRef]
  6. Daher, B.; Mohtar, R.H. Water-energy-food (WEF) Nexus Tool 2.0: Guiding integrative resource planning and decision-making. Water Intl. 2015, 40, 748–771. [Google Scholar] [CrossRef]
  7. Food and Agriculture Organization (FAO). The Water-Energy-Food Nexus. A New Approach in Support of Food Security and Sustainable Agriculture; Food and Agriculture Organization (FAO): Rome, Italy, 2014. [Google Scholar]
  8. Ferroukhi, R.; Nagpal, D.; Lopez-Peña, A.; Hodges, T.; Mohtar, R.H.; Daher, B.; Mohtar, S.; Keulertz, M. Renewable Energy and the Water, Energy and Food Nexus; International Renewable Energy Agency (IRENA): Abu Dhabi, UAE, 2015. [Google Scholar]
  9. Kungliga Tekniska högskolan (KTH) Royal Institute of Technology. CLEWs—Climate, Land, Energy and Water Strategies to Navigate the Nexus; Kungliga Tekniska högskolan (KTH) Royal Institute of Technology: Stockholm, Sweden, 2013. [Google Scholar]
  10. Stockholm Environment Institute. Long Range Energy Alternatives Planning System; Stockholm Environment Institute: Stockholm, Sweden, 2013. [Google Scholar]
  11. Stockholm Environment Institute. Water Evaluation and Planning; Stockholm Environment Institute: Stockholm, Sweden, 2014. [Google Scholar]
  12. Howells, M.; Hermann, S.; Welsch, M.; Bazilian, M.; Segerström, R.; Alfstad, T.; Gielen, D.; Rogner, H.; Fischer, G.; van Velthuizen, H.; et al. Integrated analysis of climate change, land-use, energy and water strategies. Nat. Clim. Chang. 2013, 3, 621. [Google Scholar] [CrossRef]
  13. Biggs, E.M.; Bruce, E.; Boruff, B.; Duncan, J.M.; Horsley, J.; Pauli, N.; McNeill, K.; Neef, A.; van Ogtrop, F.; Curnow, J.; et al. Sustainable development and the water–energy–food nexus: A perspective on livelihoods. Environ. Sci. Policy 2015, 54, 389–397. [Google Scholar] [CrossRef]
  14. Giampietro, M.; Aspinall, R.J.; Bukkens, S.G.F.; Benalcazar, J.C.; et al. Innovative Accounting Framework for the Food-Energy-Water Nexus; Food and Agriculture Association of the United Nations: Rome, Italy, 2013. [Google Scholar]
  15. Ministry of Agriculture, Forestry and Fisheries. Basic Plan for Food, Agriculture and Rural Areas; Ministry of Agriculture, Forestry and Fisheries: Tokyo, Japan, 2015.
  16. Ministry of Land, Infrastructure, Transport and Tourism. Statistics of Japan; Ministry of Land, Infrastructure, Transport and Tourism: Tokyo, Japan, 2018. Available online: https://www.e-stat.go.jp (accessed on 1 March 2018).
  17. Koga, N.; Tajima, R. Assessing energy efficiencies and greenhouse gas emissions under bioethanol-oriented paddy rice production in northern Japan. J. Environ. Manag. 2011, 92, 967–973. [Google Scholar] [CrossRef] [PubMed]
  18. Lu, Y.; Wassmann, R.; Neue, H.U.; Huang, C. Dynamics of dissolved organic carbon and methane emissions in a flooded rice soil. Sci. Soc. of Am. J. 2000, 64, 2011–2017. [Google Scholar] [CrossRef]
  19. Naser, H.M.; Nagata, O.; Tamura, S.; Hatano, R. Methane emissions from five paddy fields with different amounts of rice straw application in central Hokkaido, Japan. Soil Sci. Plant Nutr. 2007, 53, 95–101. [Google Scholar] [CrossRef] [Green Version]
  20. World Bank Open Data. Available online: https://data.worldbank.org (accessed on 30 March 2018).
  21. Sugiura, T.; Sumida, H.; Yokoyama, S.; Ono, H. Overview of recent effects of global warming on agricultural production in Japan. Jpn. Agric. Res. Q. 2012, 46, 7–13. [Google Scholar] [CrossRef]
  22. Hoekstra, A.Y.; Chapagain, A.K.; Aldaya, M.M.; Mekonnen, M.M. Water footprint manual: State of the art. Water Footpr. Netw. 2009, 8–9, 20–35. [Google Scholar]
  23. Chapagain, A.K.; Hoekstra, A.Y. The blue, green and grey water footprint of rice from production and consumption perspectives. Ecol. Econ. 2011, 70, 749–758. [Google Scholar] [CrossRef]
  24. Mekonnen, M.M.; Hoekstra, A.Y. The Green, Blue and Grey Water Footprint of Crops and Derived Crop Products; Value of Water Research Report Series No. 47; UNESCO-IHE: Delft, The Netherlands, 2010. [Google Scholar]
  25. Association of Agriculture. Unit Energy Consumption at the Main Process in Agricultural System. Seneca 21st. Available online: http://seneca21st.eco.coocan.jp (accessed on 1 January 2018).
  26. Yoshida, S. Paddy Field Agriculture and Energy Problems; Seneca 21st. Available online: http://seneca21st.eco.coocan.jp (accessed on 1 January 2018).
  27. World Nuclear Association. Comparison of Lifecycle Greenhouse Gas Emissions of Various Electricity Generation Sources; World Nuclear Association: London, UK, 2011. [Google Scholar]
  28. U.S. Energy Information Administration. Available online: https://www.eia.gov (accessed on 1 February 2018).
Figure 1. Diagram of the relationships between water, energy, and food in terms of food security.
Sustainability 10 03354 g001
Figure 2. The productivity of land used to grow rice in Japan from 1961 to 2016.
Sustainability 10 03354 g002
Figure 3. Energy for (a) irrigation and (b) drainage in paddy fields in the Nishikanbara and Nishikanbara areas of Japan, respectively [26].
Sustainability 10 03354 g003
Figure 4. Japan’s net electricity generation, categorized by fuel, from 2000 to 2013 [28].
Sustainability 10 03354 g004
Figure 5. Domestic rice production, consumption, and self-sufficiency in Japan from 1960 to 2016.
Sustainability 10 03354 g005
Figure 6. (a) Domestic consumption trends and (b) the harvested area for rice in Japan.
Sustainability 10 03354 g006aSustainability 10 03354 g006b
Figure 7. (a) Additional rice production by SSR in comparison with the baseline; (b) green and blue water required for additional rice production; (c) energy required for additional rice production; (d) direct and indirect CO2 emissions by energy use for additional rice production; (e) area harvested for rice for additional rice production; Additional required resources and CO2 emissions, categorized by 2025 scenarios in comparison with the baseline (a negative value indicates resources saved).
Sustainability 10 03354 g007aSustainability 10 03354 g007bSustainability 10 03354 g007c
Table 1. Water footprint and percolation per unit of paddy rice in Japan.
ItemsMethodology and ValueReference
Period2000–2004[23]
Cultivation typeWetland system
Crop water requirementCROPWAT4
EvapotranspirationFAO Penman–Monteith
Effective rainfallUSDA SCS method
Water footprint (m3/ton)742
Green water footprint (m3/ton)341
Blue water footprint (m3/ton)401
Total percolation (m3/ton)757
Percolation of rain water (m3/ton)348
Percolation of irrigation water409
Table 2. Direct energy consumption for rice production in the western Kanto area of Japan [25].
ProcessEnergy InputProcessEnergy Input
SeedlingElectricity 26 kWh/haAdditional fertilizingBlend oil 83 MJ/ha
Gasoline 48 MJ/ha
FertilizingDiesel 75 MJ/haPest controlBlend oil 24 MJ/ha
Gasoline 10 MJ/haGasoline 97 MJ/ha
TillingDiesel 1545 MJ/ha
Gasoline 3 MJ/ha
Water managementBlend oil 1384 MJ/ha
PuddlingDiesel 336 MJ/haLevee weedingGasoline 76 MJ/ha
Gasoline 3 MJ/ha
Transportation of seedlingsGasoline 55 MJ/haHarvestingDiesel 773 MJ/ha
Rice transplantationGasoline 170 MJ/haRice-dryingKerosene 4404 MJ/ha
Electricity 90 kWh/ha
Herbicide applicationBlend oil 24 MJ/ha
Gasoline 97 MJ/ha
Table 3. CO2 emissions caused by burning fuel and generating electricity.
CO2 Emissions from Various Types of Fuel
Source of fuel(ton of CO2/gal) ¹(ton CO2/GJ)Reference
Gasoline0.00980.0755¹ [28]
Diesel (oil)0.01120.0765
CO2 Emissions Produced by Generating Electricity
Source of electricity(ton of CO2/106 kWh) ¹Proportion (%) ²Reference
Coal102630%¹ [27]
² [28]
Nuclear power27.51%
Renewables (wind)15.85%
Natural gas50443%
Petroleum1026 *14%
Hydroelectricity19.78%
Total CO2 emissions647.8100%
* ¹ indicates that the reference of data was [27]
** ² indicates that the reference of data was [28]
Table 4. Projection of production, consumption, SSR, resource use, and CO2 emissions in 2025 within the trends of consumption and the area harvested for rice.
VariablesBaseline
2016
Projection
1
Projection
2
Projection
3
Projection
4
Consumption trend-PolynomialPolynomialLogarithmLogarithm
Harvested area trend-PolynomialLogarithmPolynomialLogarithm
Self-sufficiency ratio (SSR) for rice production (%)91941028795
Production ( × 10 6 tons)7.797.418.067.418.06
Consumption ( × 10 6 tons)8.507.857.858.468.46
Export ( × 10 6 tons)0.03030.030.030.03
Requirements for imports ( × 10 6 tons)0. × 10 6 0.44−0.211.060.41
Harvested area ( × 10 6 ha)1.571.491.621.491.62
Water use ( × 10 6 m3)11,67711,10412,07611,10412,076
Green water ( × 10 6 m3)53675104555151045551
Blue water ( × 10 6 m3)63106000652560006525
Energy use ( × 10 6 GJ)26.7025.3927.6125.3927.61
Electricity ( × 10 6 GJ)12.1011.5112.5111.5112.51
Fossil fuels ( × 10 6 GJ)14.6013.8815.1013.8815.10
Direct CO2 emissions (1000 ton)11161061115410611154
Indirect CO2 emissions (1000 ton)20171918208619182086
Table 5. Resource requirements and CO2 emissions needed to achieve each SSR in 2025, within logarithmic consumption trends.
VariablesScenario
1
Scenario
2
Scenario
3
Scenario
4
Scenario
5
Target SSR for rice production (%)80859095100
Production ( × 10 6 tons)6.807.227.658.078.49
Consumption ( × 10 6 tons)8.468.468.468.468.46
Export ( × 10 6 tons)0.030.030.030.030.03
Required imports ( × 10 6 tons)1.631.210.790.36−0.06
Harvested area ( × 10 6 . ha)1.371.461.541.631.71
Water use ( × 10 6 m3)10,195 × 10 6 146312,09812,732
Green water ( × 10 6 m3)46864978526955615852
Blue water ( × 10 6 m3)55095852619465376880
Energy use (106 GJ)23.3124.7626.2127.6629.11
Electricity ( × 10 6 GJ)10.5611.2211.8812.5313.19
Fossil fuels ( × 10 6 GJ)12.7513.5414.3315.1315.92
Direct CO2 emissions (1000 ton)9741035109511561217
Indirect CO2 emissions (1000 ton)17611871198020902199

