Article

Evaluation of the Potential Change to the Ecosystem Service Provision Due to Industrialization

by
Arturo Sanchez-Porras
1,
María Guadalupe Tenorio-Arvide
1,
Ricardo Darío Peña-Moreno
1,
María Laura Sampedro-Rosas
2 and
Sonia Emilia Silva-Gómez
1,*
1
Posgrado en Ciencias Ambientales, Instituto de Ciencias, Benemérita Universidad Autónoma de Puebla, Puebla 72570, Mexico
2
Unidad Académica de Ciencias del Desarrollo Regional, Universidad Autónoma de Guerrero, Acapulco de Juárez 39640, Mexico
*
Author to whom correspondence should be addressed.
Sustainability 2018, 10(9), 3355; https://0-doi-org.brum.beds.ac.uk/10.3390/su10093355
Submission received: 2 August 2018 / Revised: 5 September 2018 / Accepted: 13 September 2018 / Published: 19 September 2018
(This article belongs to the Special Issue Rural Population and Social Sustainability)

Abstract

:
The provision of ecosystem services (ES) in a particular region is strongly related to land use. In 2013, San José Chiapa, México, was selected as the new operations base for an automotive company. The installation of the new automotive plant will encourage population growth from 8000 to 200,000 inhabitants by 2050. Consequently, the rise in the demand for land to urbanize will increase at a rate expected to have a significant impact in terms of land-use change, affecting the provision of ES in the region. This paper aims to characterize the ES provision that was present in the region before industrialization and to evaluate the potential effect of land-use change on ES provision. This study analyzed geographic and demographic information and involved a series of field trips to characterize the services present in the area. The ES budget is positive regarding the production of biomass, due to the rural nature of most of the study area. However, this picture is changing with the continuous growth of urban areas due to economic development. This is a critical point for the region regarding ES provision, and only a joint effort between municipalities and industry will make it possible for the region to seize on development while maintaining ES provision.

1. Introduction

There is much debate regarding ecosystem services (ES) [1,2,3,4,5,6]. Even though the environment started to be considered as relevant to the global agenda as early as the 1970s [7], it was not until the end of the 20th century that ES started to be studied and described [1,8,9]. Moreover, the most common definition of ES—the benefits people obtain from ecosystems—was not declared until 2005 [10]. This definition establishes that there is a complex relationship between humans and the environment that makes them interdependent [8,11,12]: Without human benefits, there would not be services but merely ecosystem functions and structures [8].
Ecosystems are considered as complex systems: collections of components that are related to each other through dynamic interactions [13,14]. These collections involve biotic and abiotic elements (in the form of stocks and state variables), which, through their interactions, generate the dynamic processes that result in ES. The statement that ES are emergent properties of system flows and processes reinforces a couple of ideas: (1) Ecosystems account for more than merely the sum of their components; and (2) The interaction between these components has additional, and sometimes hidden, consequences [2,15].
The natural conditions needed for the provision of ES are affected by the possibility of them flowing towards human communities, as well as by human demand. These source/sink relations are frequently treated as the supply and demand sides of ES [16,17,18,19,20], and by comparing both it is possible to quantify an ES budget [21] that provides additional information regarding the potential presence of ES in any given location.
This paper is part of a larger study focused on analyzing the presence, use, and demand of ES in the sub-basin that contains San José Chiapa, Mexico. In 2013, a German automotive company announced a new assembly plant that is eventually expected to employ more than 20,000 people in the vicinity of the town [22]. The industrialization plan involves the construction of a manufacturing hub and a planned city, the so-called Ciudad Modelo, which is expected to house more than 200,000 people by the year 2050. Such a population increase has never been seen in the region and, to our knowledge, there is not enough data to document or analyze the effect of this population growth on ES provision.
The objective of this paper is to characterize the region based on the consideration of environmental, social, and economic sustainability dimensions. This is achieved by compiling information sources from different knowledge areas and expanding on the almost nonexistent literature regarding the industrialization process in the San José Chiapa region. The environmental aspect is analyzed using a basin approach (which will be further explored in Section 2.1) based on land use/land cover (LULC) information, since this reflects the potential for the provision of ES in the region [18,23,24,25]. For the social and economic components, demographic and industrial changes are considered in terms of the effects that industrialization and urbanization have over small towns linking economic and social aspects (e.g., [26,27,28]).
This paper is structured as follows: The materials and methods include the definition of the study area and the description of data collection and assessment methods. The results section presents demographic changes, as well as the outcomes of the matrix assessment; the discussion introduces the change matrices and compares these assessments with observations and ES theory. Finally, the conclusions provide insights and recommendations. Two research questions motivated this work:
(1)
How is the ES budget present in the sub-basin that includes San José Chiapa, Mexico?
(2)
How relevant are demographic changes to the provision of ES?

2. Materials and Methods
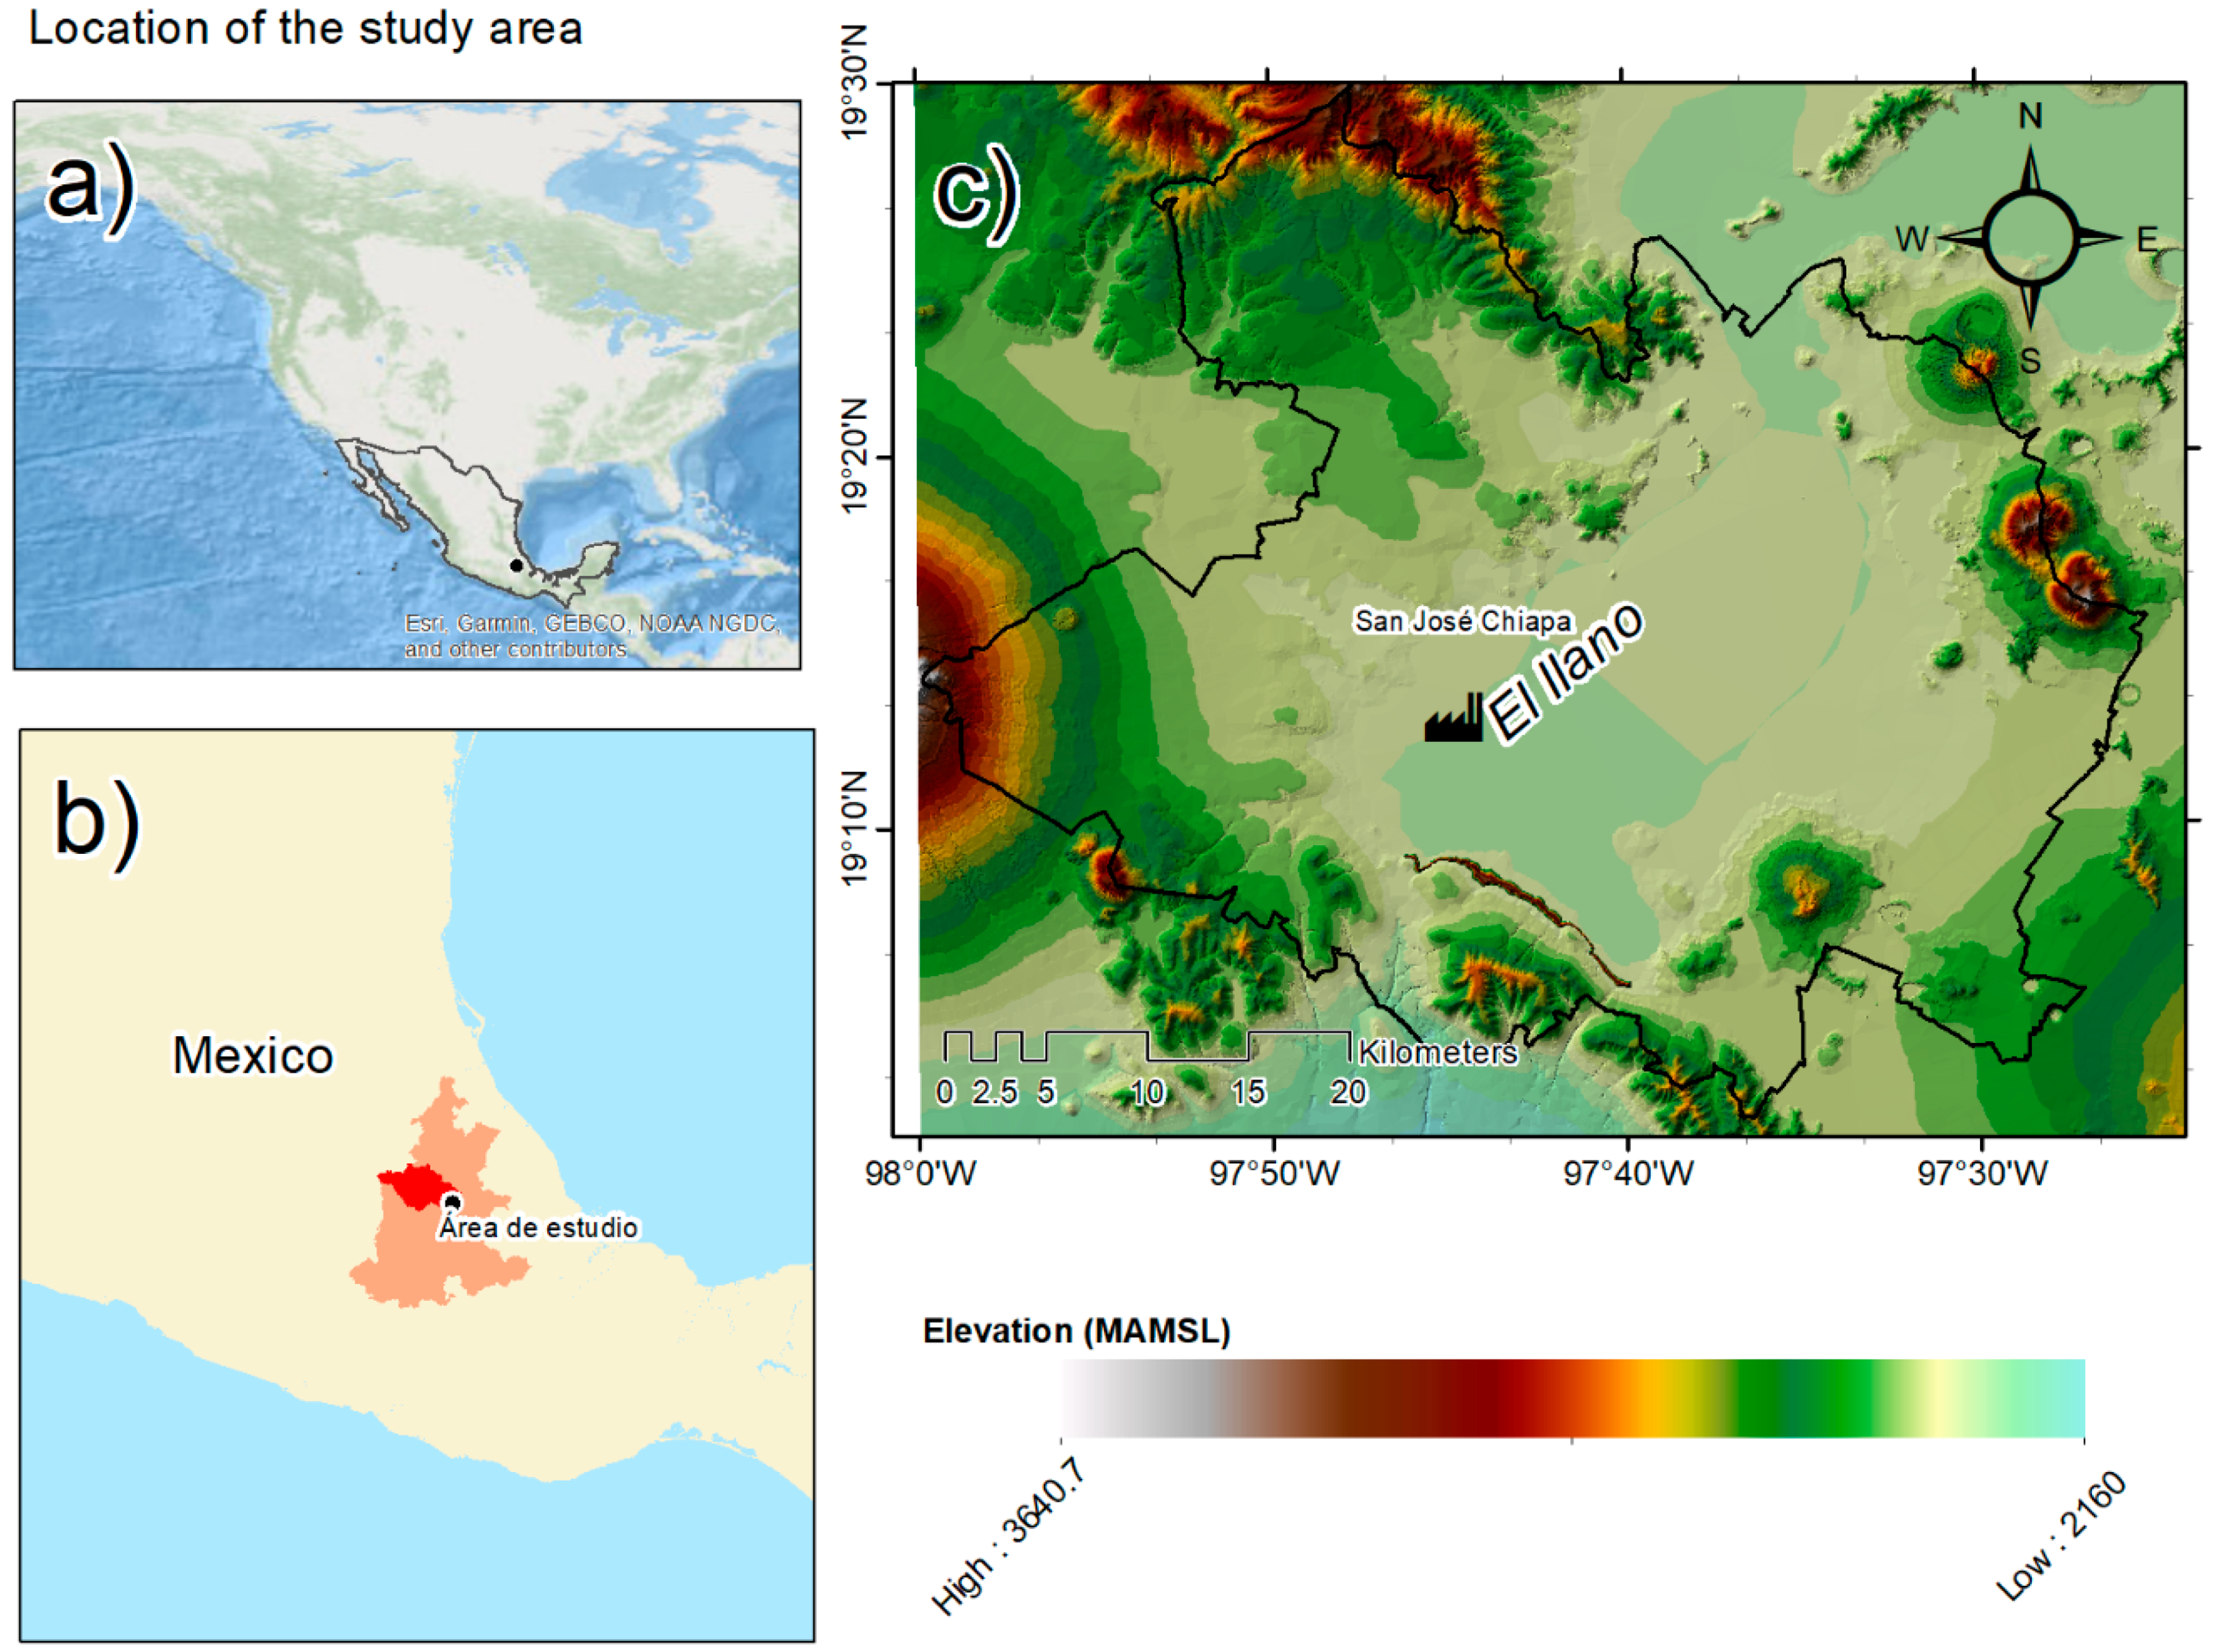
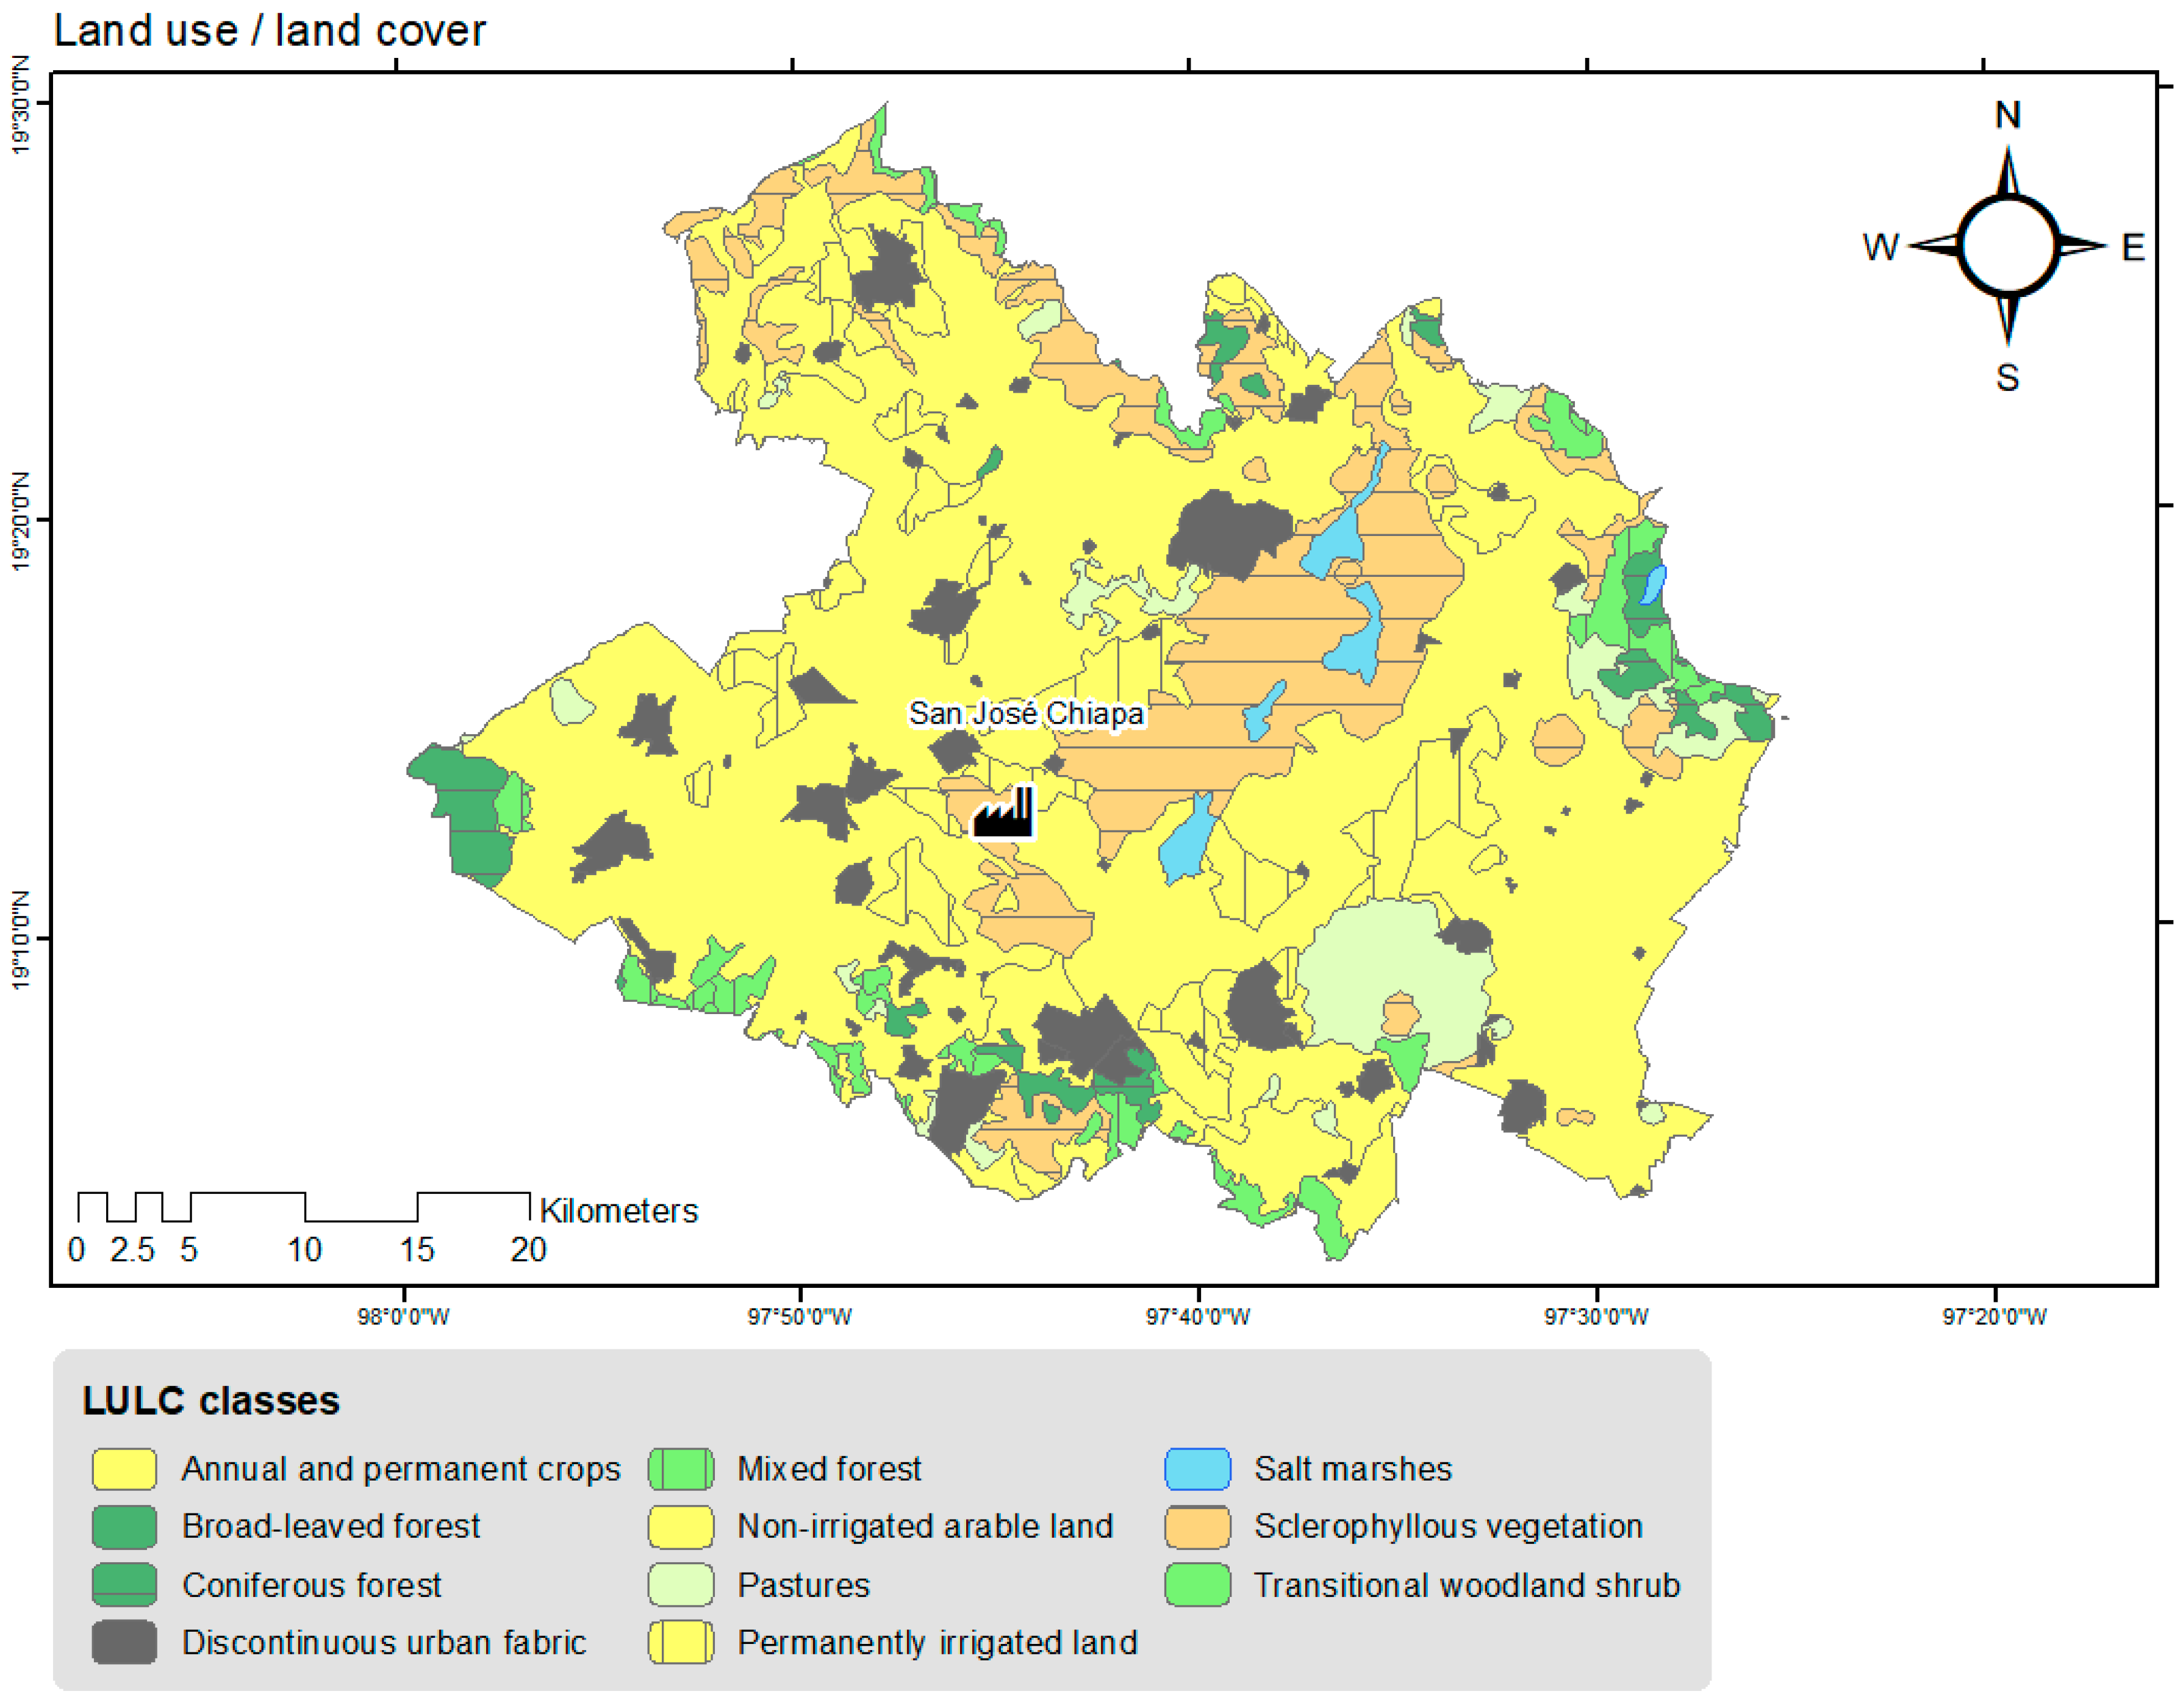
2.1. Study Area

The municipality of San José Chiapa is located in the state of Puebla, in central Mexico, within the RH18Ah Laguna de Totolcingo hydrographic subcatchment of the Río Atoyac watershed [29] in a wide plain located between the Malintzin and Citlaltepetl volcanoes, as can be seen in Figure 1. The town sits at an altitude of about 2350 MAMSL near the bottom of an endorheic drainage basin where water transport occurs mainly due to the differences in the level of the water table [30]. To the south of this locality is “el llano” (“the plain”), an area of about four hectares of halophytic pasture, which, according to the Instituto Nacional de Estadística y Geografía (INEGI) (Spanish for National Institute of Statistics and Geography in Mexico) [31], cannot be used for agriculture or animal husbandry due to the high salinity of the soil. This patch of land located at the bottom of the sub-catchment is of natural importance, since it gets flooded during the rainy season by surface runoff: This runoff subsequently drains underground, making this location an important recharge point for groundwater aquifers. The new automotive industrial park is located within el llano and will cover this recharge area with concrete and warehouses.
The proposal of basing research on a basin approach to investigate the importance of human–environmental relations in the region has been presented in other studies [33,34,35]. The main elevations within the subcatchment are used as boundaries. Subsequently, the extension of the study region is restricted by considering the political limits of the municipalities located within it. The considered region starts with San José Chiapa at the bottom of the valley and encompasses 13 additional municipalities that we propose will be affected by the industrial development focused in San José Chiapa.
Before the announcement of the industrialization project, the region was not particularly notable for its participation in state industry. Some large companies had been established in Rafael Lara Grajales for years, with two involved in packing canned food and another one in processing barley malt for an international beer company. The economic influence of such companies has been focused on Rafael Lara Grajales and Nopalucan, two municipalities next to San José Chiapa that are strongly interdependent due to the industry and connectivity between both. There are also two industrial animal farms in the region, one of cows and one of pigs, that use significant amounts of water and have been part of the local economy for more than 20 years.

2.2. Data Collection

Geographical information, such as topography and LULC maps, was mainly obtained from INEGI [31,36]. Using the topographic information published on their website, it was possible to determine the differences in altitude throughout the region, as can be seen in Figure 1. This information was used to define a basin that was determined as the working scale of the project. Additionally, surface water information was reviewed; however, since there are no relevant streams or rivers in the area, and there is no available information about groundwater for Puebla or Tlaxcala, hydrology was not considered in this research.
The land cover map from INEGI was used to determine the diversity of LULC present in the region. This information was compared to the Coordination of Information on the Environment (CORINE) LULC classes to determine equivalences and was then processed using ArcGIS 10.3 (Environmental Systems Research Institute, Inc. (Esri), Redlands, CA, USA) to develop Figure 2. The downloaded information was then processed using ArcGIS 10.3 to determine the areas covered by each land-use type and to extract the information to the project database. The equivalences between the CORINE and INEGI land cover classes are presented in the Supplementary Material.
To determine demographic changes in the region, the general population censuses [37] were reviewed. This information has been collected every 10 years since 1930 by the government through INEGI. This study considered data from 1960 to 2010, thus considering fifty years of changes with information detailed at the municipality level. The information was downloaded from the INEGI website and was subsequently processed using Microsoft Excel 2013 to determine trends regarding population growth by fitting the data with different mathematical models.

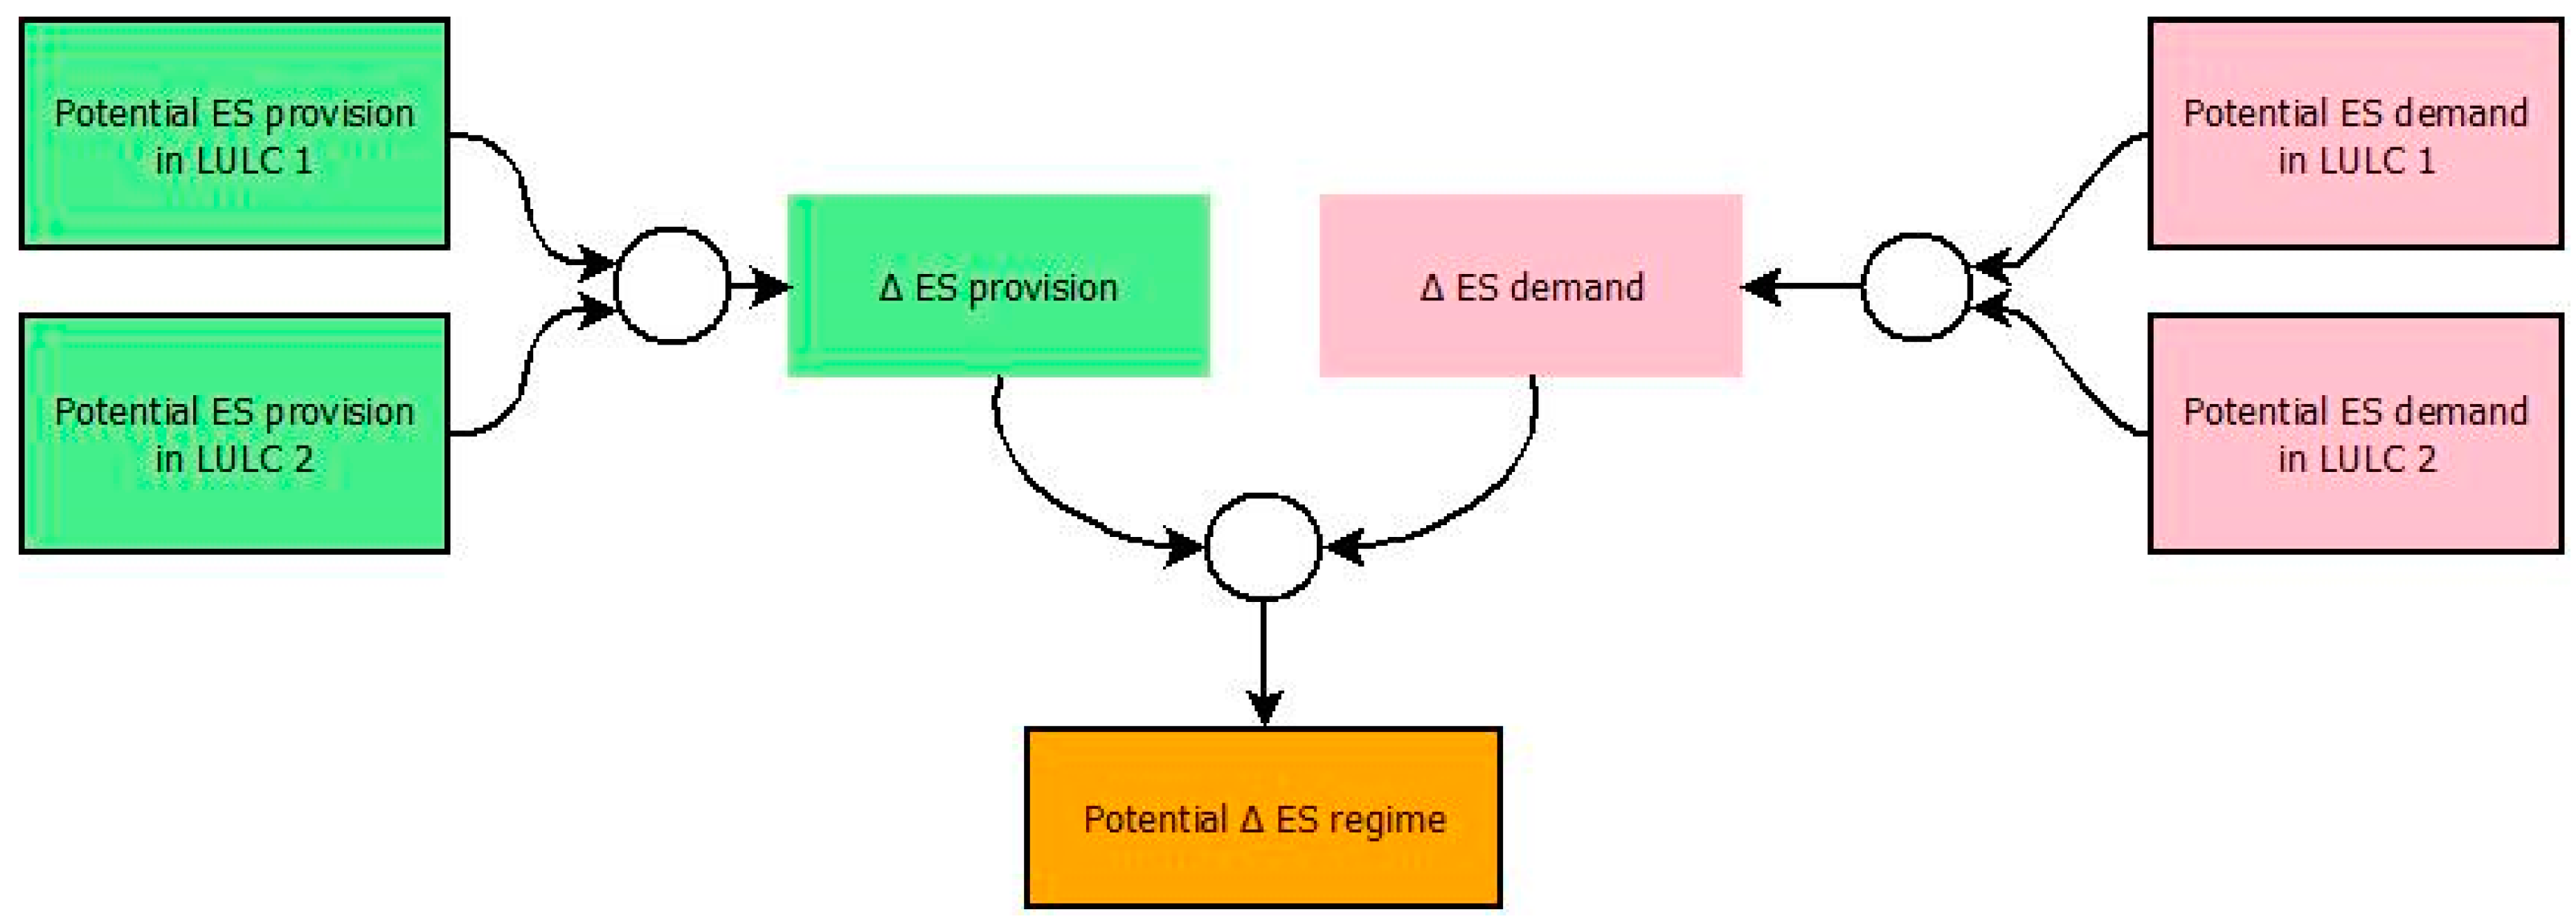
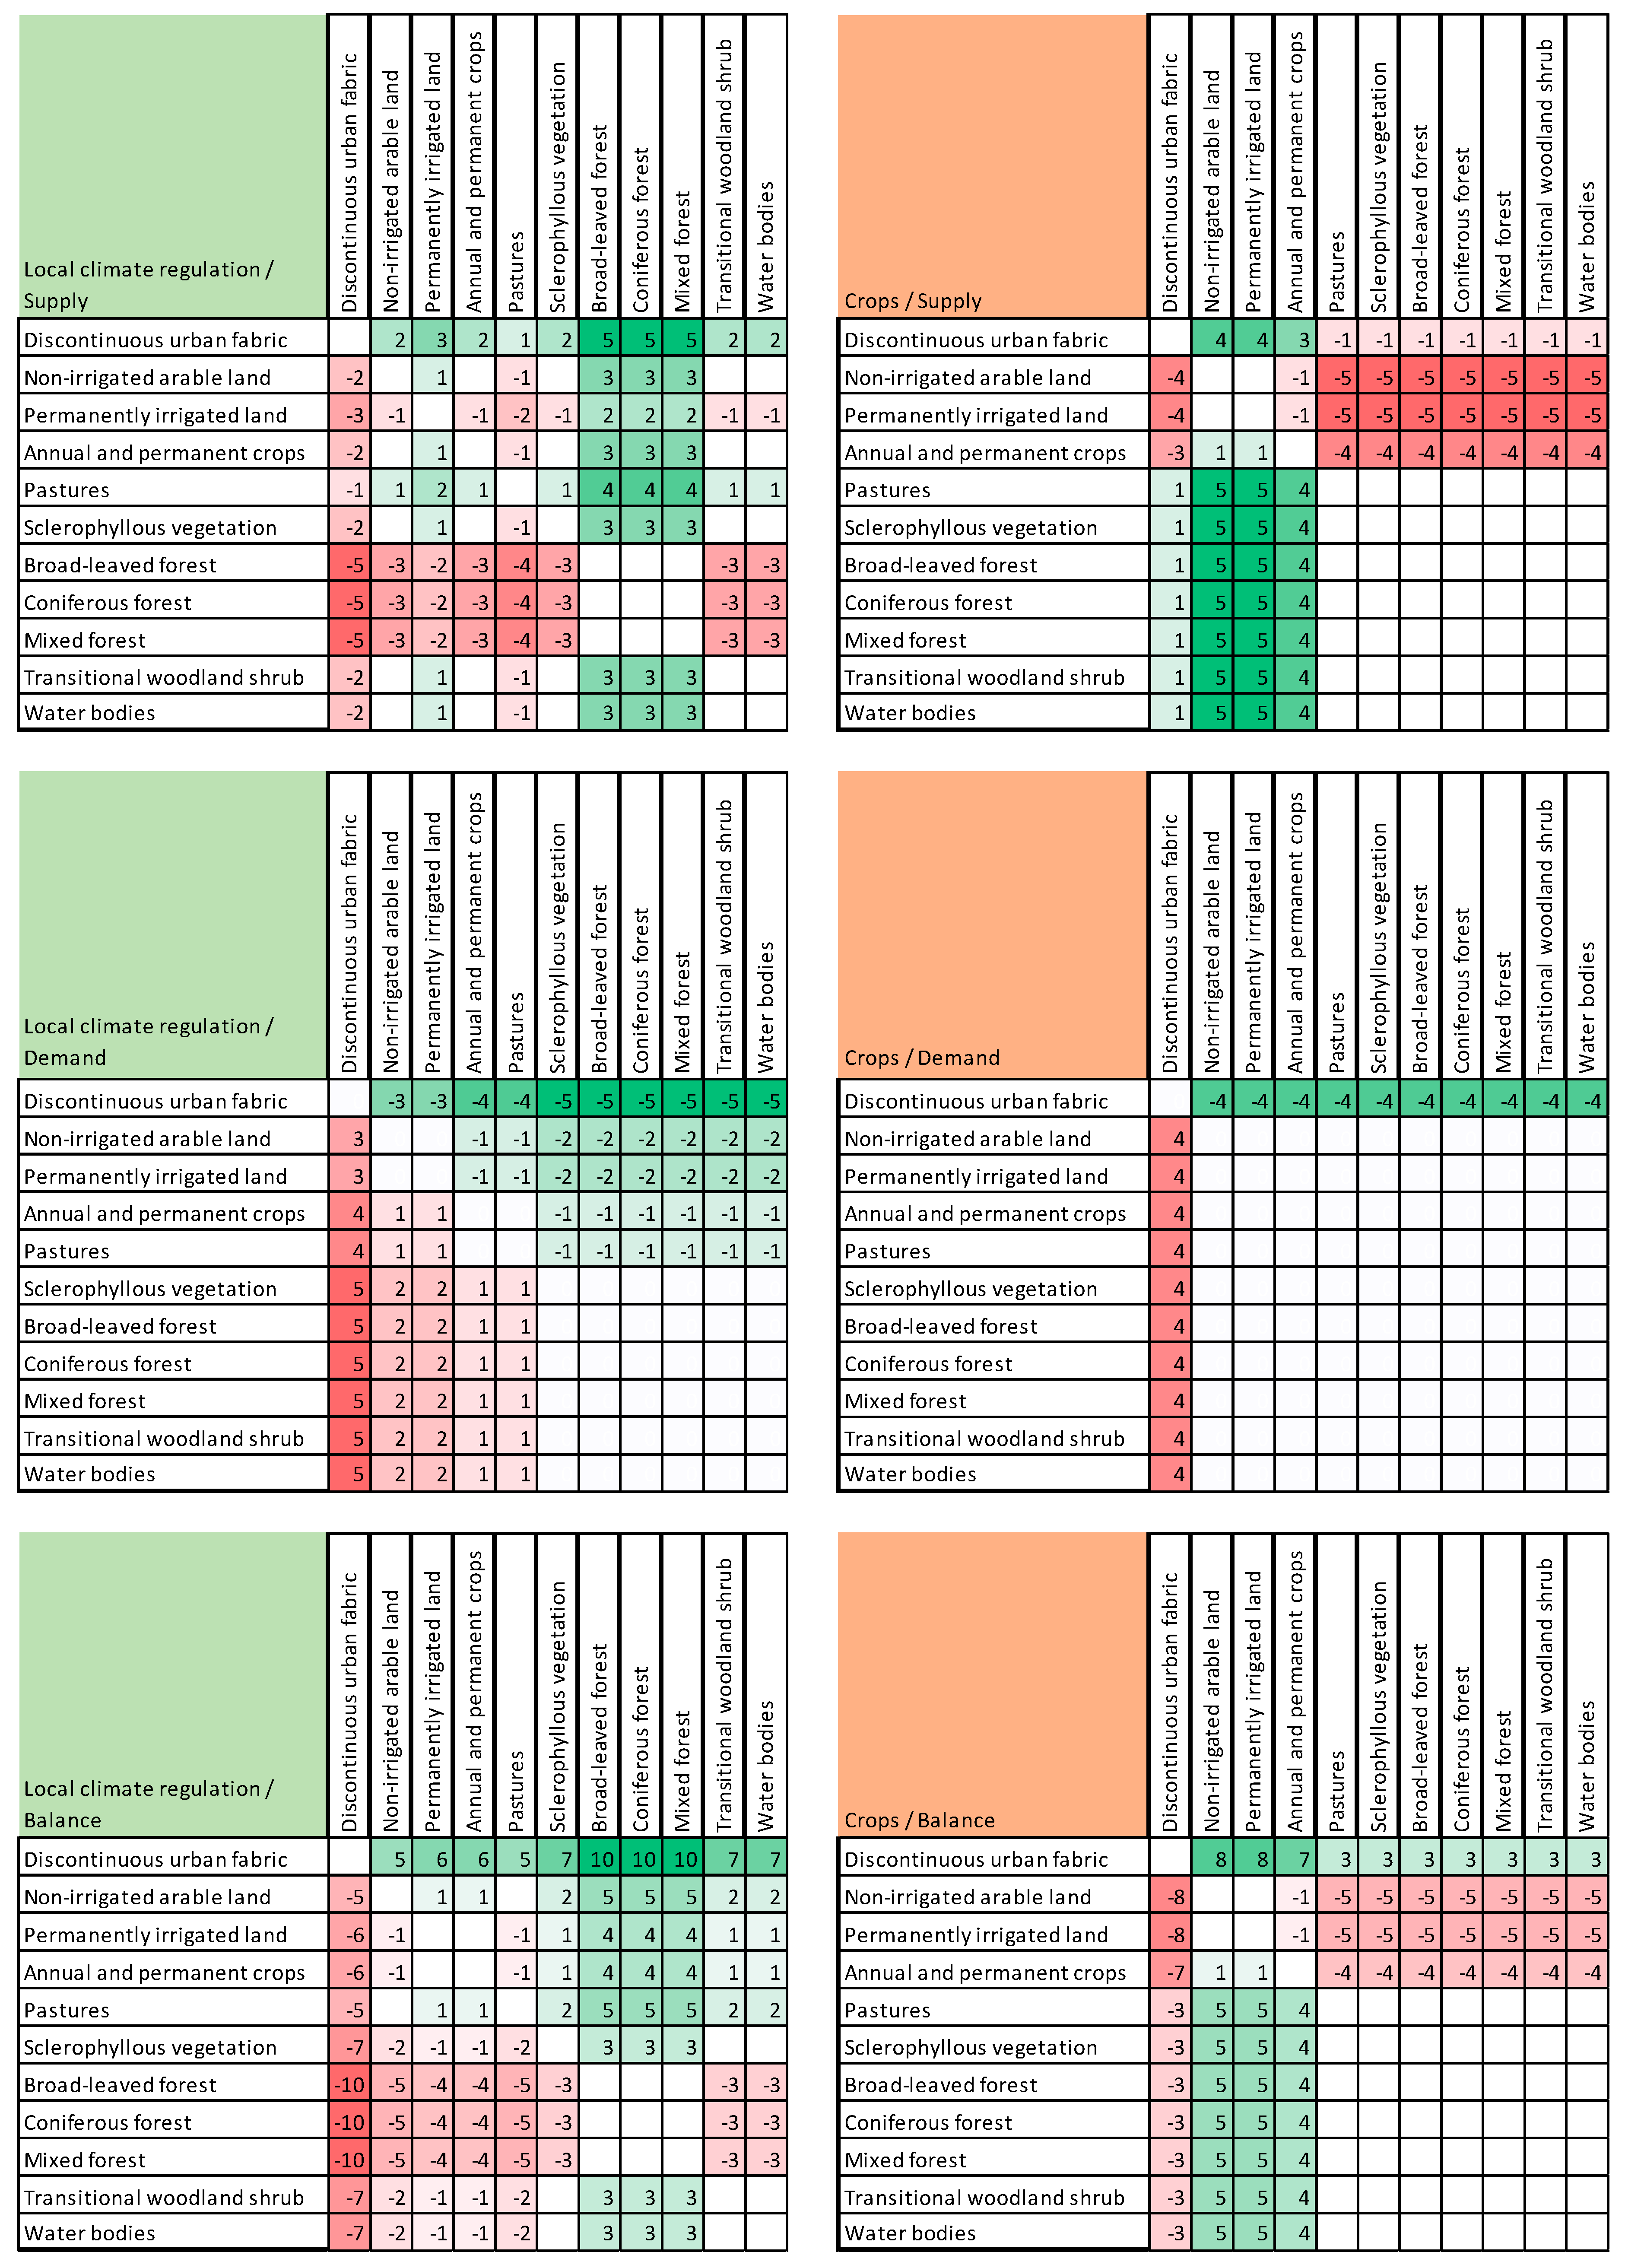
2.3. Assessing Ecosystem Services

As a first approach for determining the presence of ES, the study area was visited monthly over the course of a year to identify ecosystem functions and flows in the region. Prior to the first trip, 10 points distributed along the main highways in the region were selected and used as observation sites to assess physical changes that would be visible from the road. Additionally, four landmarks were selected to photograph and compare the development of the industrial complex and the local community in San José Chiapa [38,39].
The matrix assessment developed by Burkhard et al. [40] was used to identify the potential provision of ES from different LULCs. The basis for these matrices was a consensus of several ES experts (an expert is a person with extensive knowledge within a field of study acquired due to experiences such as research, field work, or being a stakeholder, who can provide educated guesses about the field about which they are being consulted [41]), who were asked to examine the list of LULC types and set a value from 0 to 5 to represent the level of provision of any given ES type (out of those listed in the MEA). The advantages of using Burkhard et al.’s method include the possibility of setting a geographic reference for the provision and demand of ES. One debatable disadvantage is that the basic matrix was created with a European landscape in mind, and as the provision of certain ES depends on climate-determining factors such as latitude or altitude, the matrix is somewhat constrained by that framework. However, the matrix approach has been applied to non-European countries such as Nepal where Tamang [42] assessed the changes to the provision and demand of ES and Argentina, and where Weyland et al. [43] developed matrices that show the importance of local conditions to the provision of ES and compared them with the occurrence of ecosystem functions. The application of the matrix method requires a match between the LULC types defined for the original study with those used by INEGI. A comparison between the CORINE LULC types and the ones present on the INEGI map are shown in Table 1 and expanded in the supplementary material.
One limitation of this approach is that matrices are static when referring to spatio-temporal dynamics [40,44,45]. To alleviate this drawback for projects that deal with changes in land use, a new set of matrices is proposed. Based on the Burkhard et al. [40] matrix model, the new matrices are designed to compare the LULC that are present in the region and assess how supply and demand could change when development transforms one type of land cover into another. After developing the supply and demand matrices, the exercise was expanded by subtracting one from the other to calculate a final balance matrix that indicates whether a change in LULC improves or deteriorates the ES regime in a region (see Figure 3).

2.4. Data Analysis and Interpretation

The geographic information obtained from INEGI was used to determine the presence of ES potential provision and demand. The matrix assessment developed by Burkhard et al. [40] estimates these parameters on a scale ranging from 0 to 5, in which 0 stands for “no relevant potential provision or demand”, and 5 stands for “very high relevant potential provision or demand”. It is important to point out that this seemingly simple approach allows for a quick assessment that is easy to interpret. Nevertheless, the information provided by these matrices is stored in a fixed timeframe, which constitutes one of its shortcomings. The change matrices establish an extension of the easy-to-use approach developed by Burkhard and his team by presenting the results of a LULC transformation at a glance.
Demographic information was used to estimate natural growth rates in a “business as usual” scenario that has been altered ever since the industrialization was announced. The census data was projected for 30 years into the future with the purpose of comparing these numbers with governmental declarations that estimate population figures for 2050. The combined figures for San José Chiapa, Rafael Lara Grajales, and Nopalucan, the three municipalities that are embedded in the industrialization process, account for half of the population expected to settle in this area. This increase in population size will see a parallel growth in the number and extent of urban areas, which will result in an increased demand for ES in the region.

3. Results

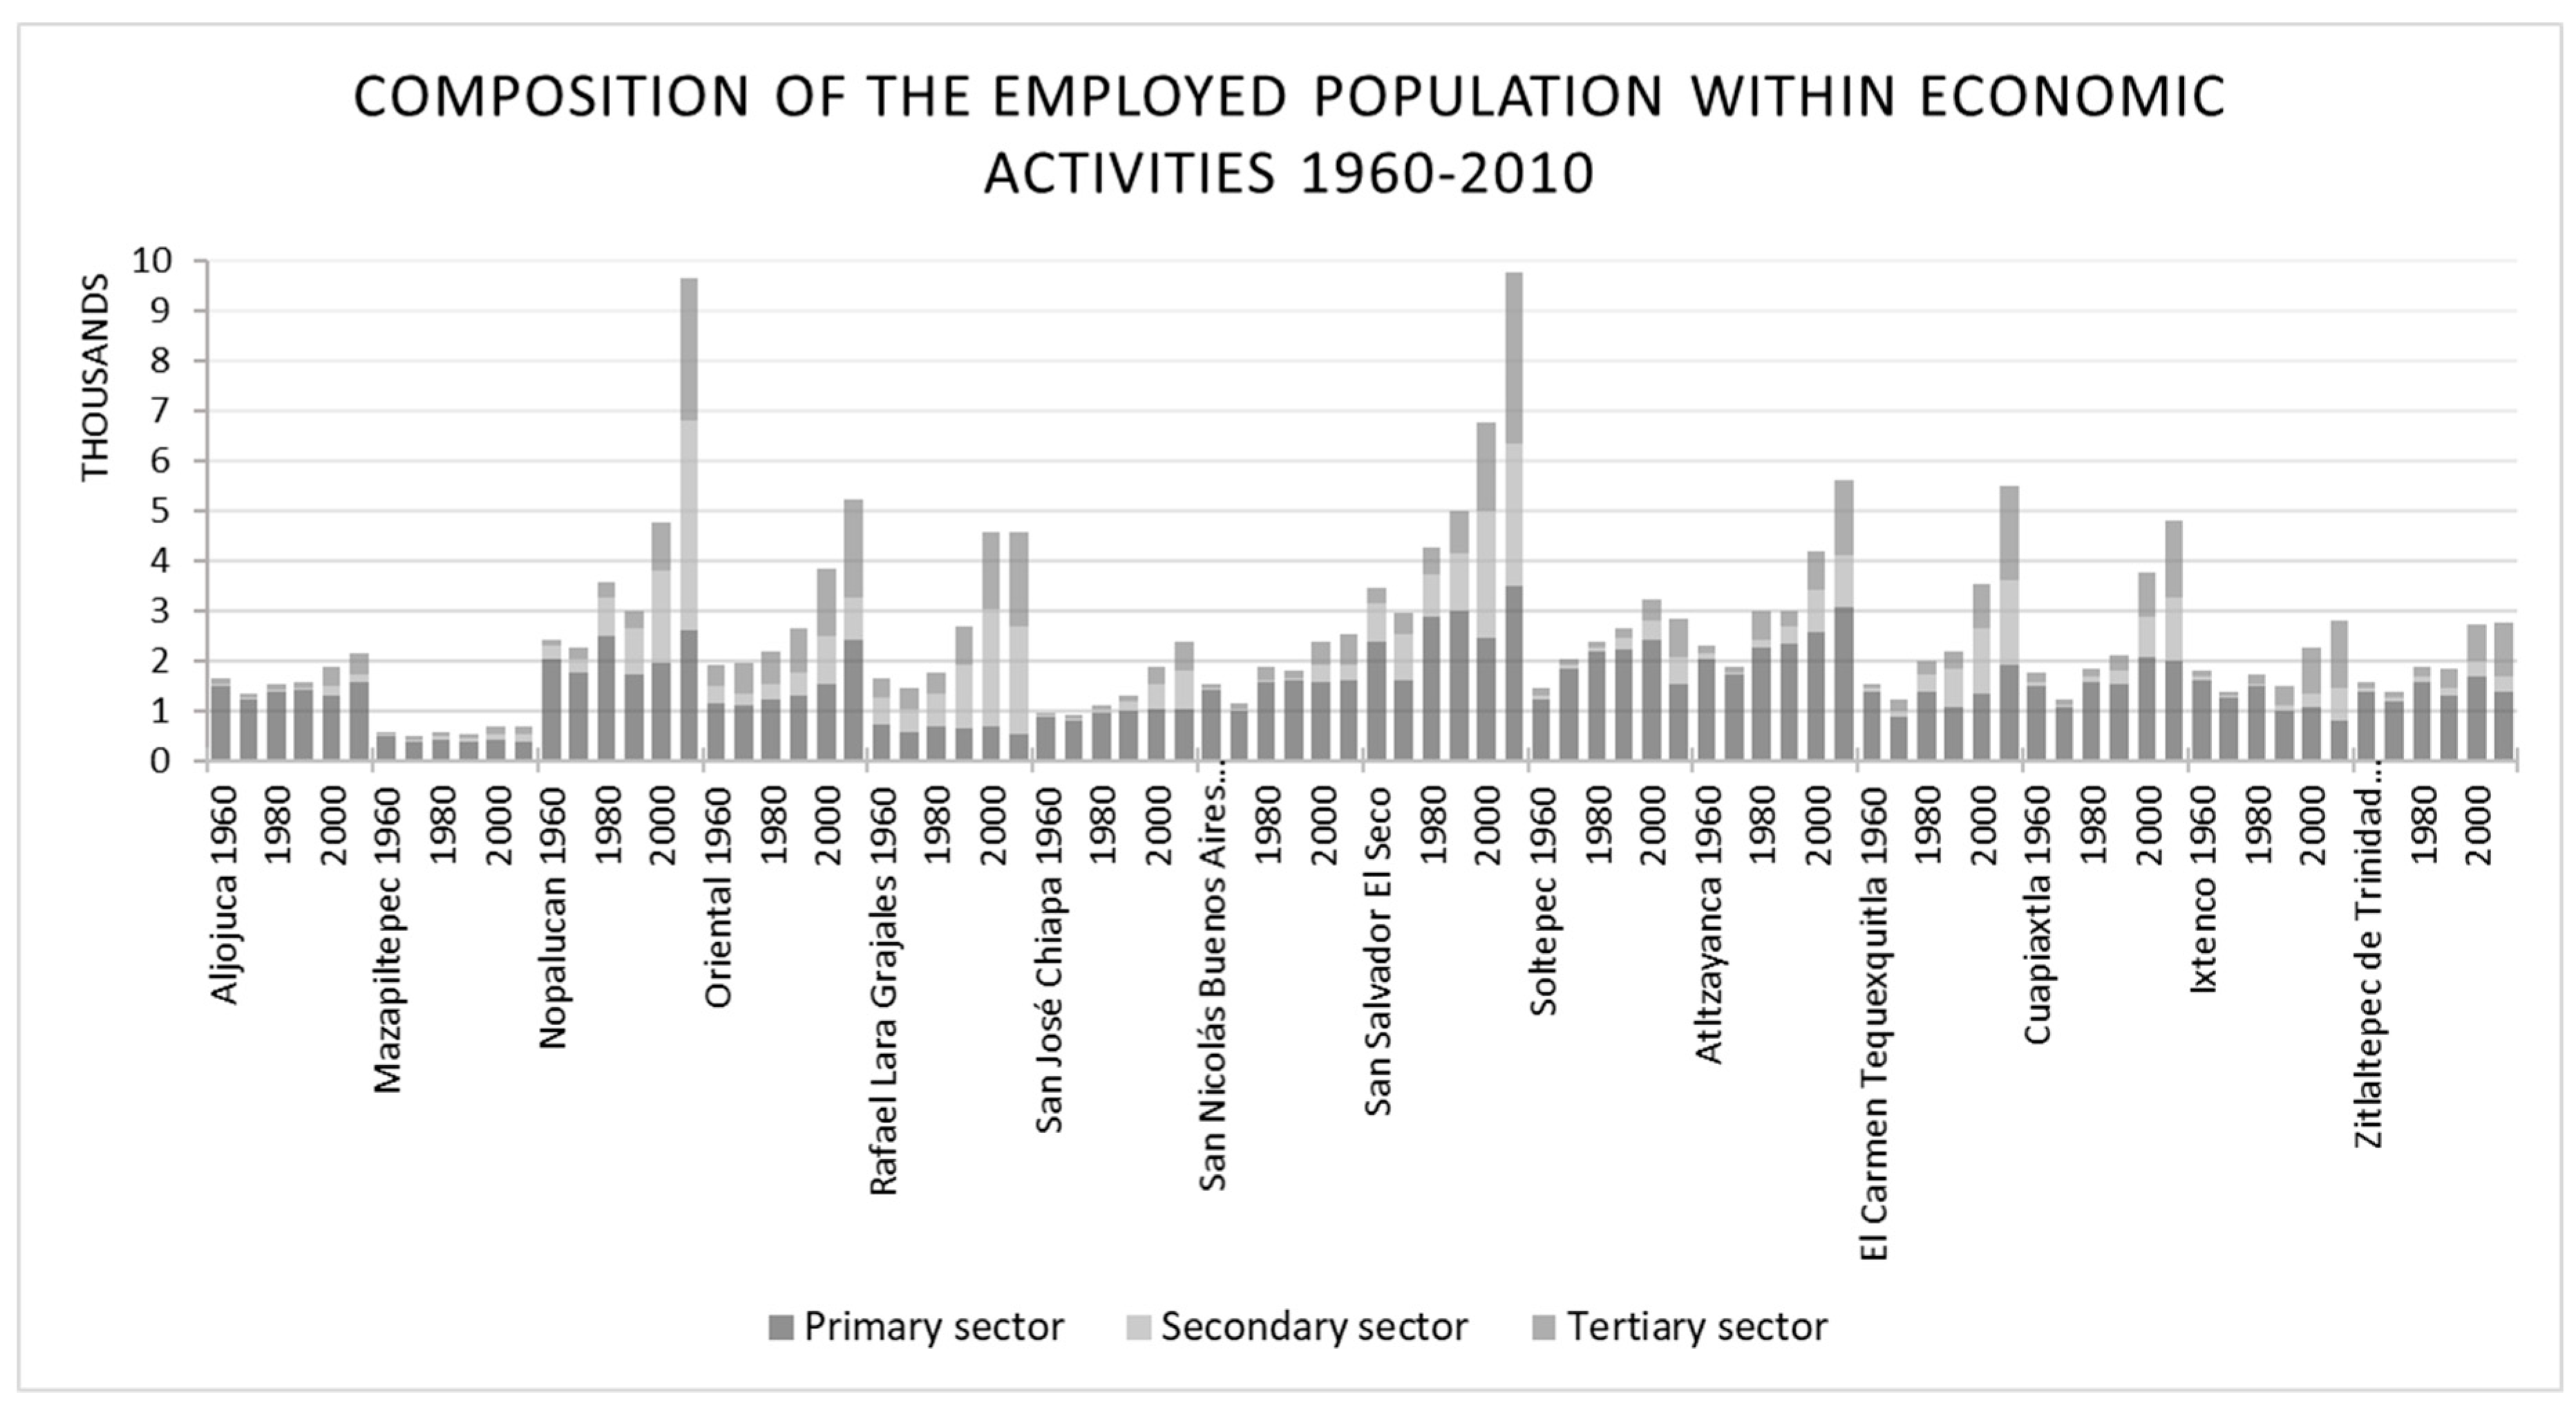
3.1. Population and Urban Growth

Population growth will be accompanied by a growth in the demand for ES, and it is therefore important to assess how this parameter may change over time. The total population figures from INEGI databases for 1960 to 2010 were adjusted based on the best fit and then projected over time, as shown in the Supplementary Material. The populations of the different municipalities in the basin were projected over time using models that produced the best adjustment for each one. The results indicate heterogeneity in growth, a phenomenon which has been observed in Mexico by other studies, for example those of Azuz and Rivera [46], Narro-Robles et al. [47], and Anzaldo and Barrón [48]. It is important to consider that the fitting was performed to investigate the behavior of population growth in the past, and that the reasons for such behavior are not known. However, the models may be useful as a first approximation to estimate the total population increase that the industrialization process will bring by the end of 2018 (45,000 people) and 2050 (200,000 people) [49,50]. These increases are significantly higher than those expected before the announcement of the industrialization process. The forthcoming change in the economic structure of the population will impact the appreciation and demand for ES. To date, the primary sector has been the main work force in the region, but the current trend is towards the tertiarization of local economies.

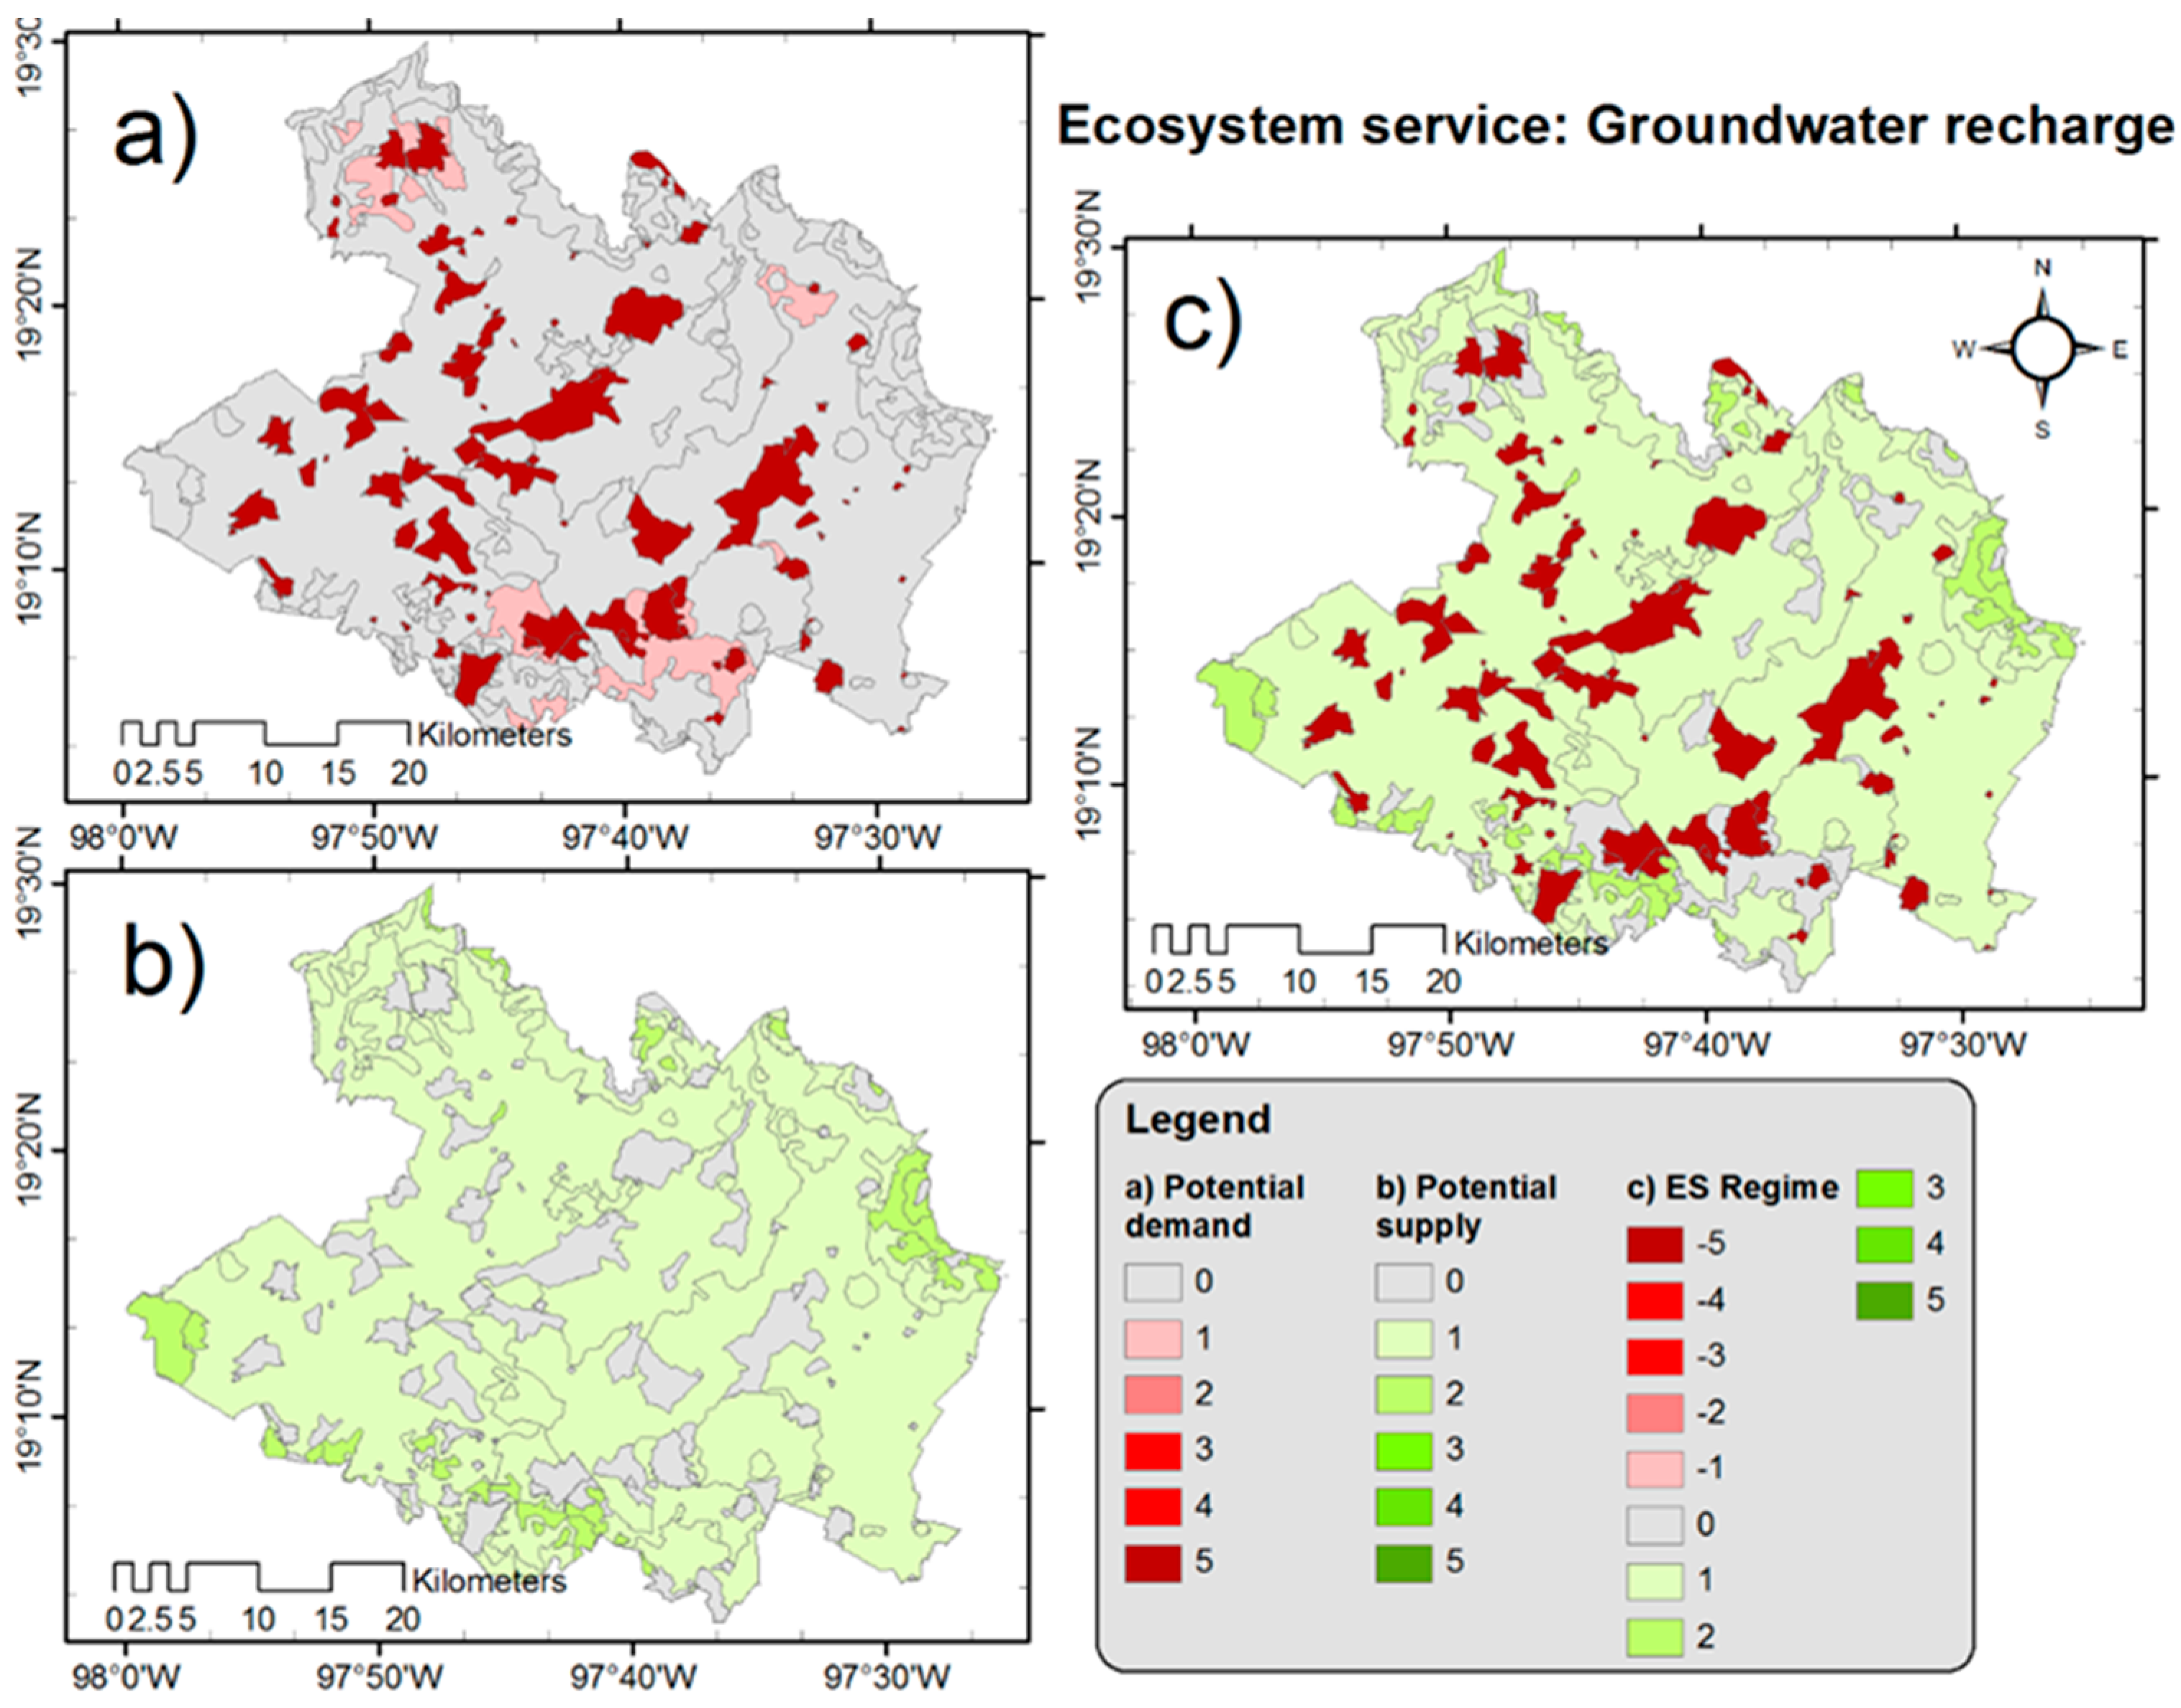
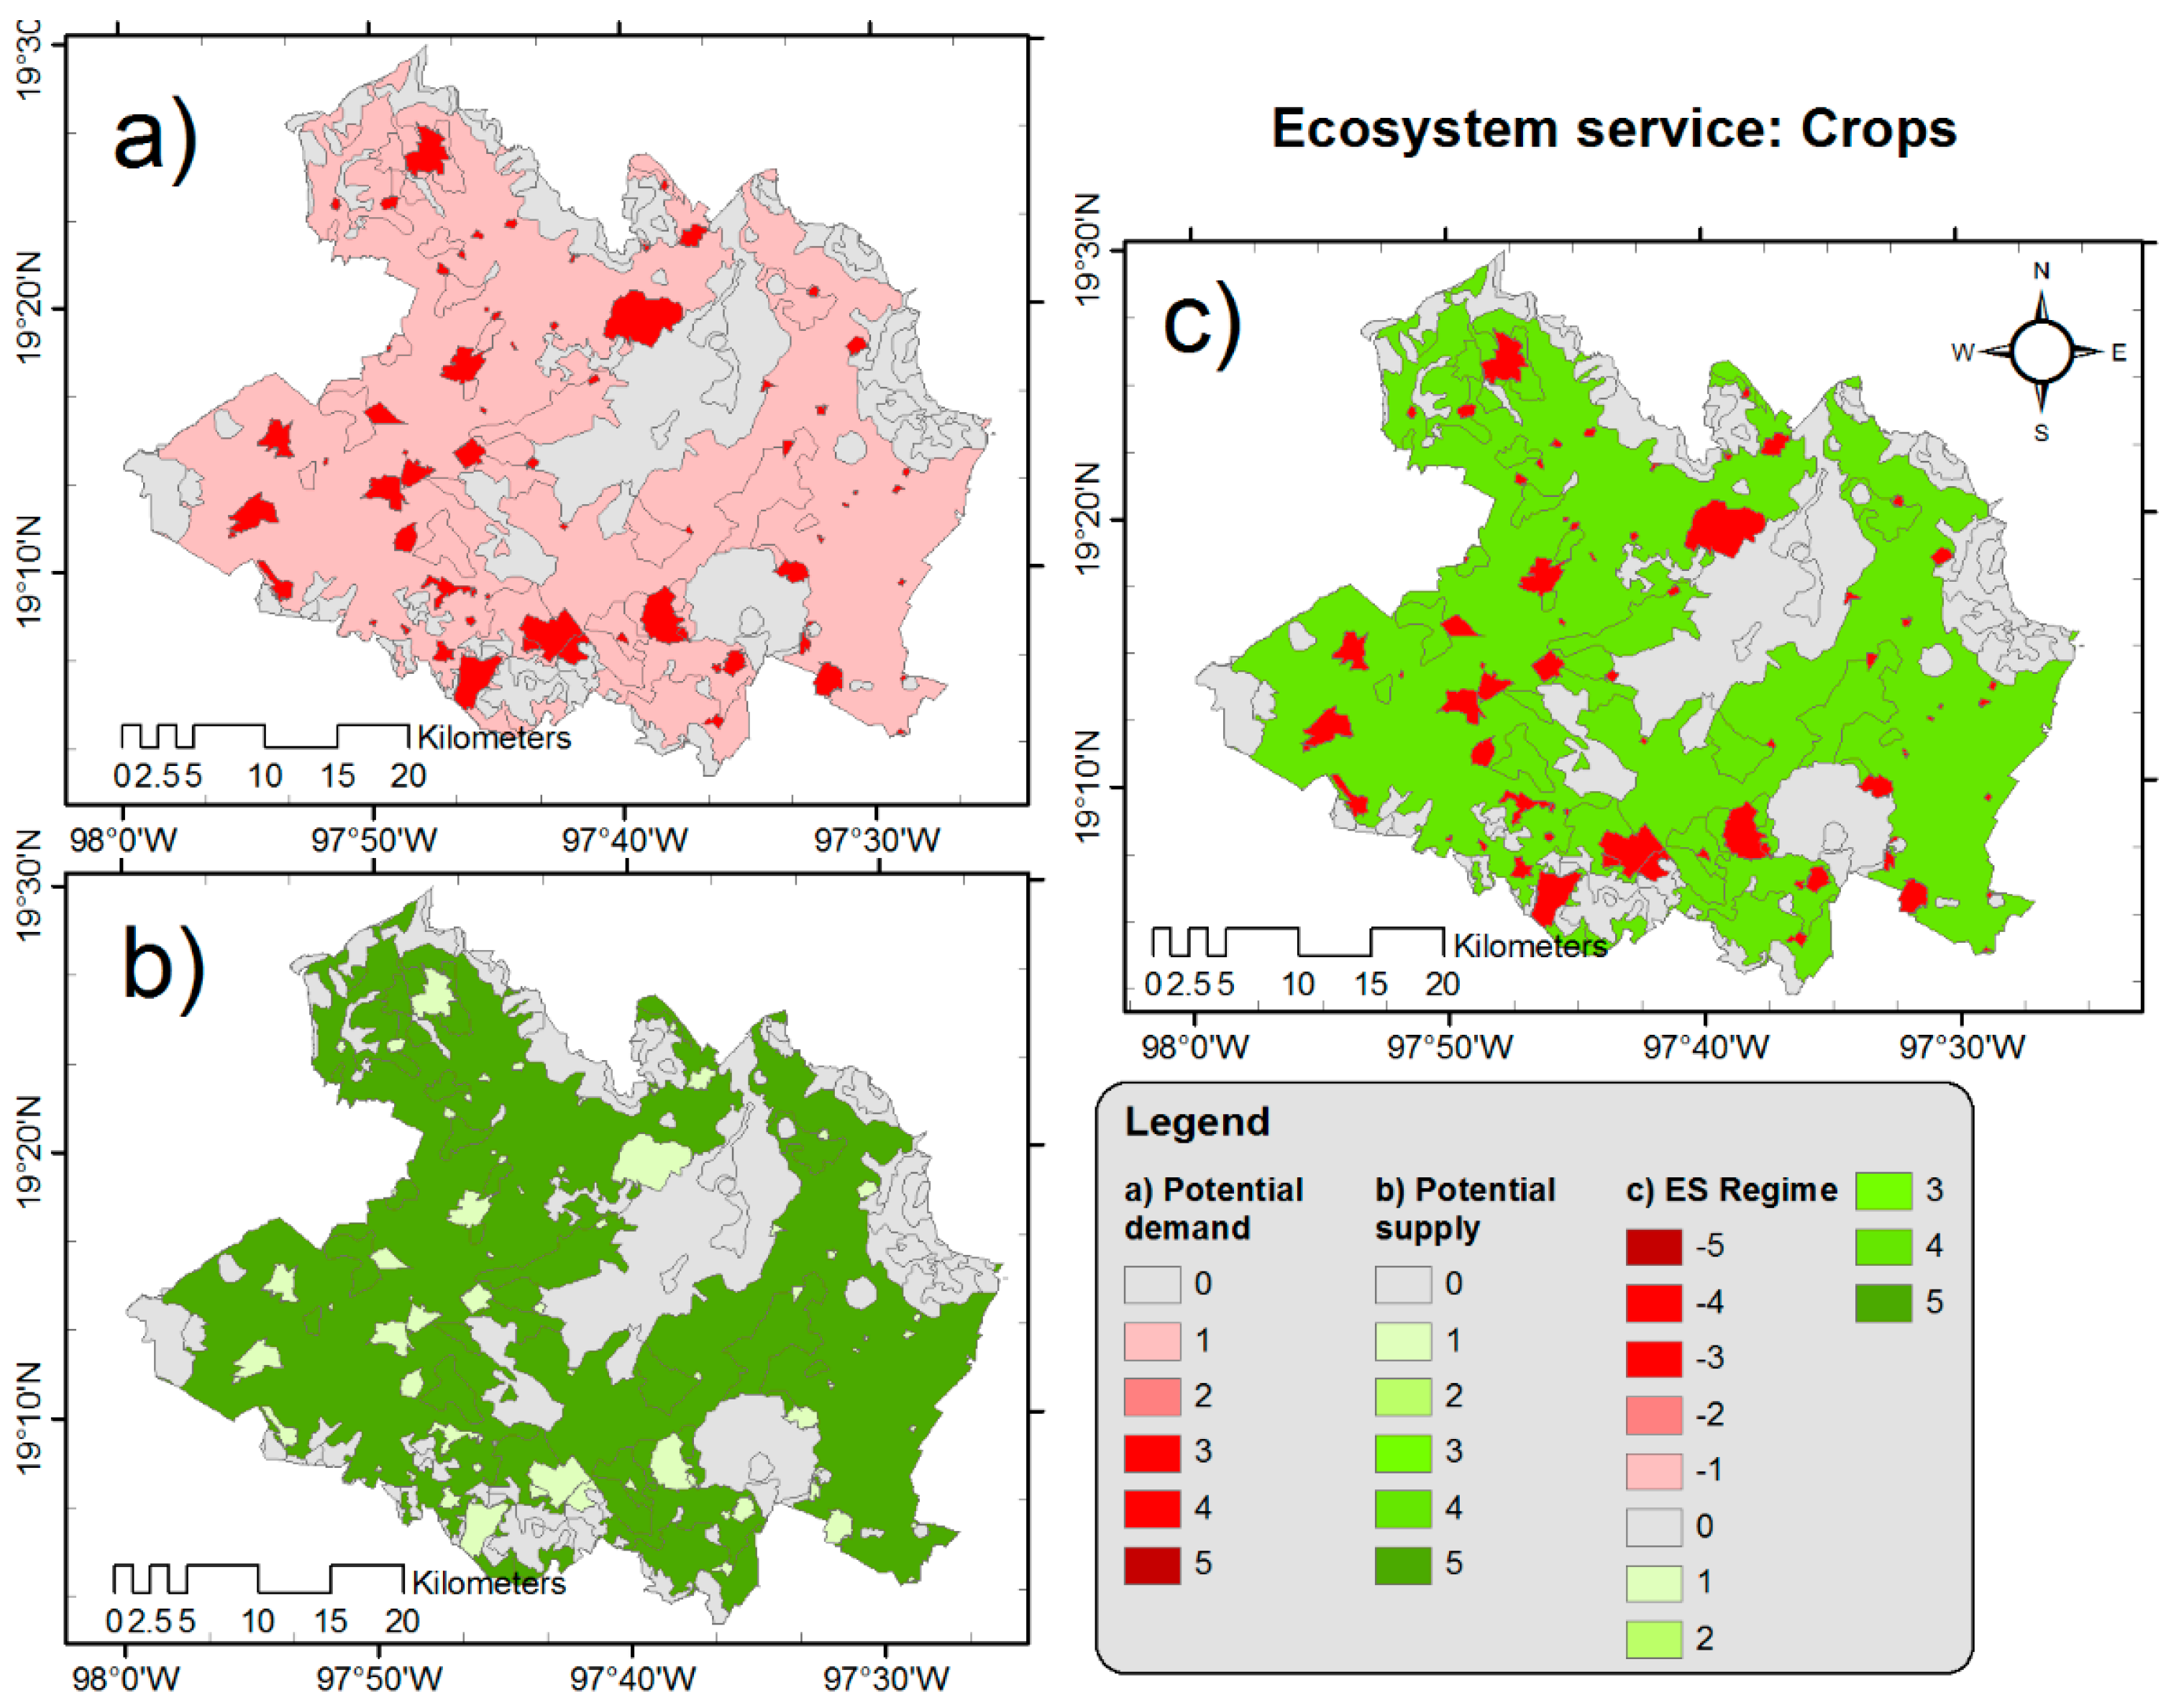
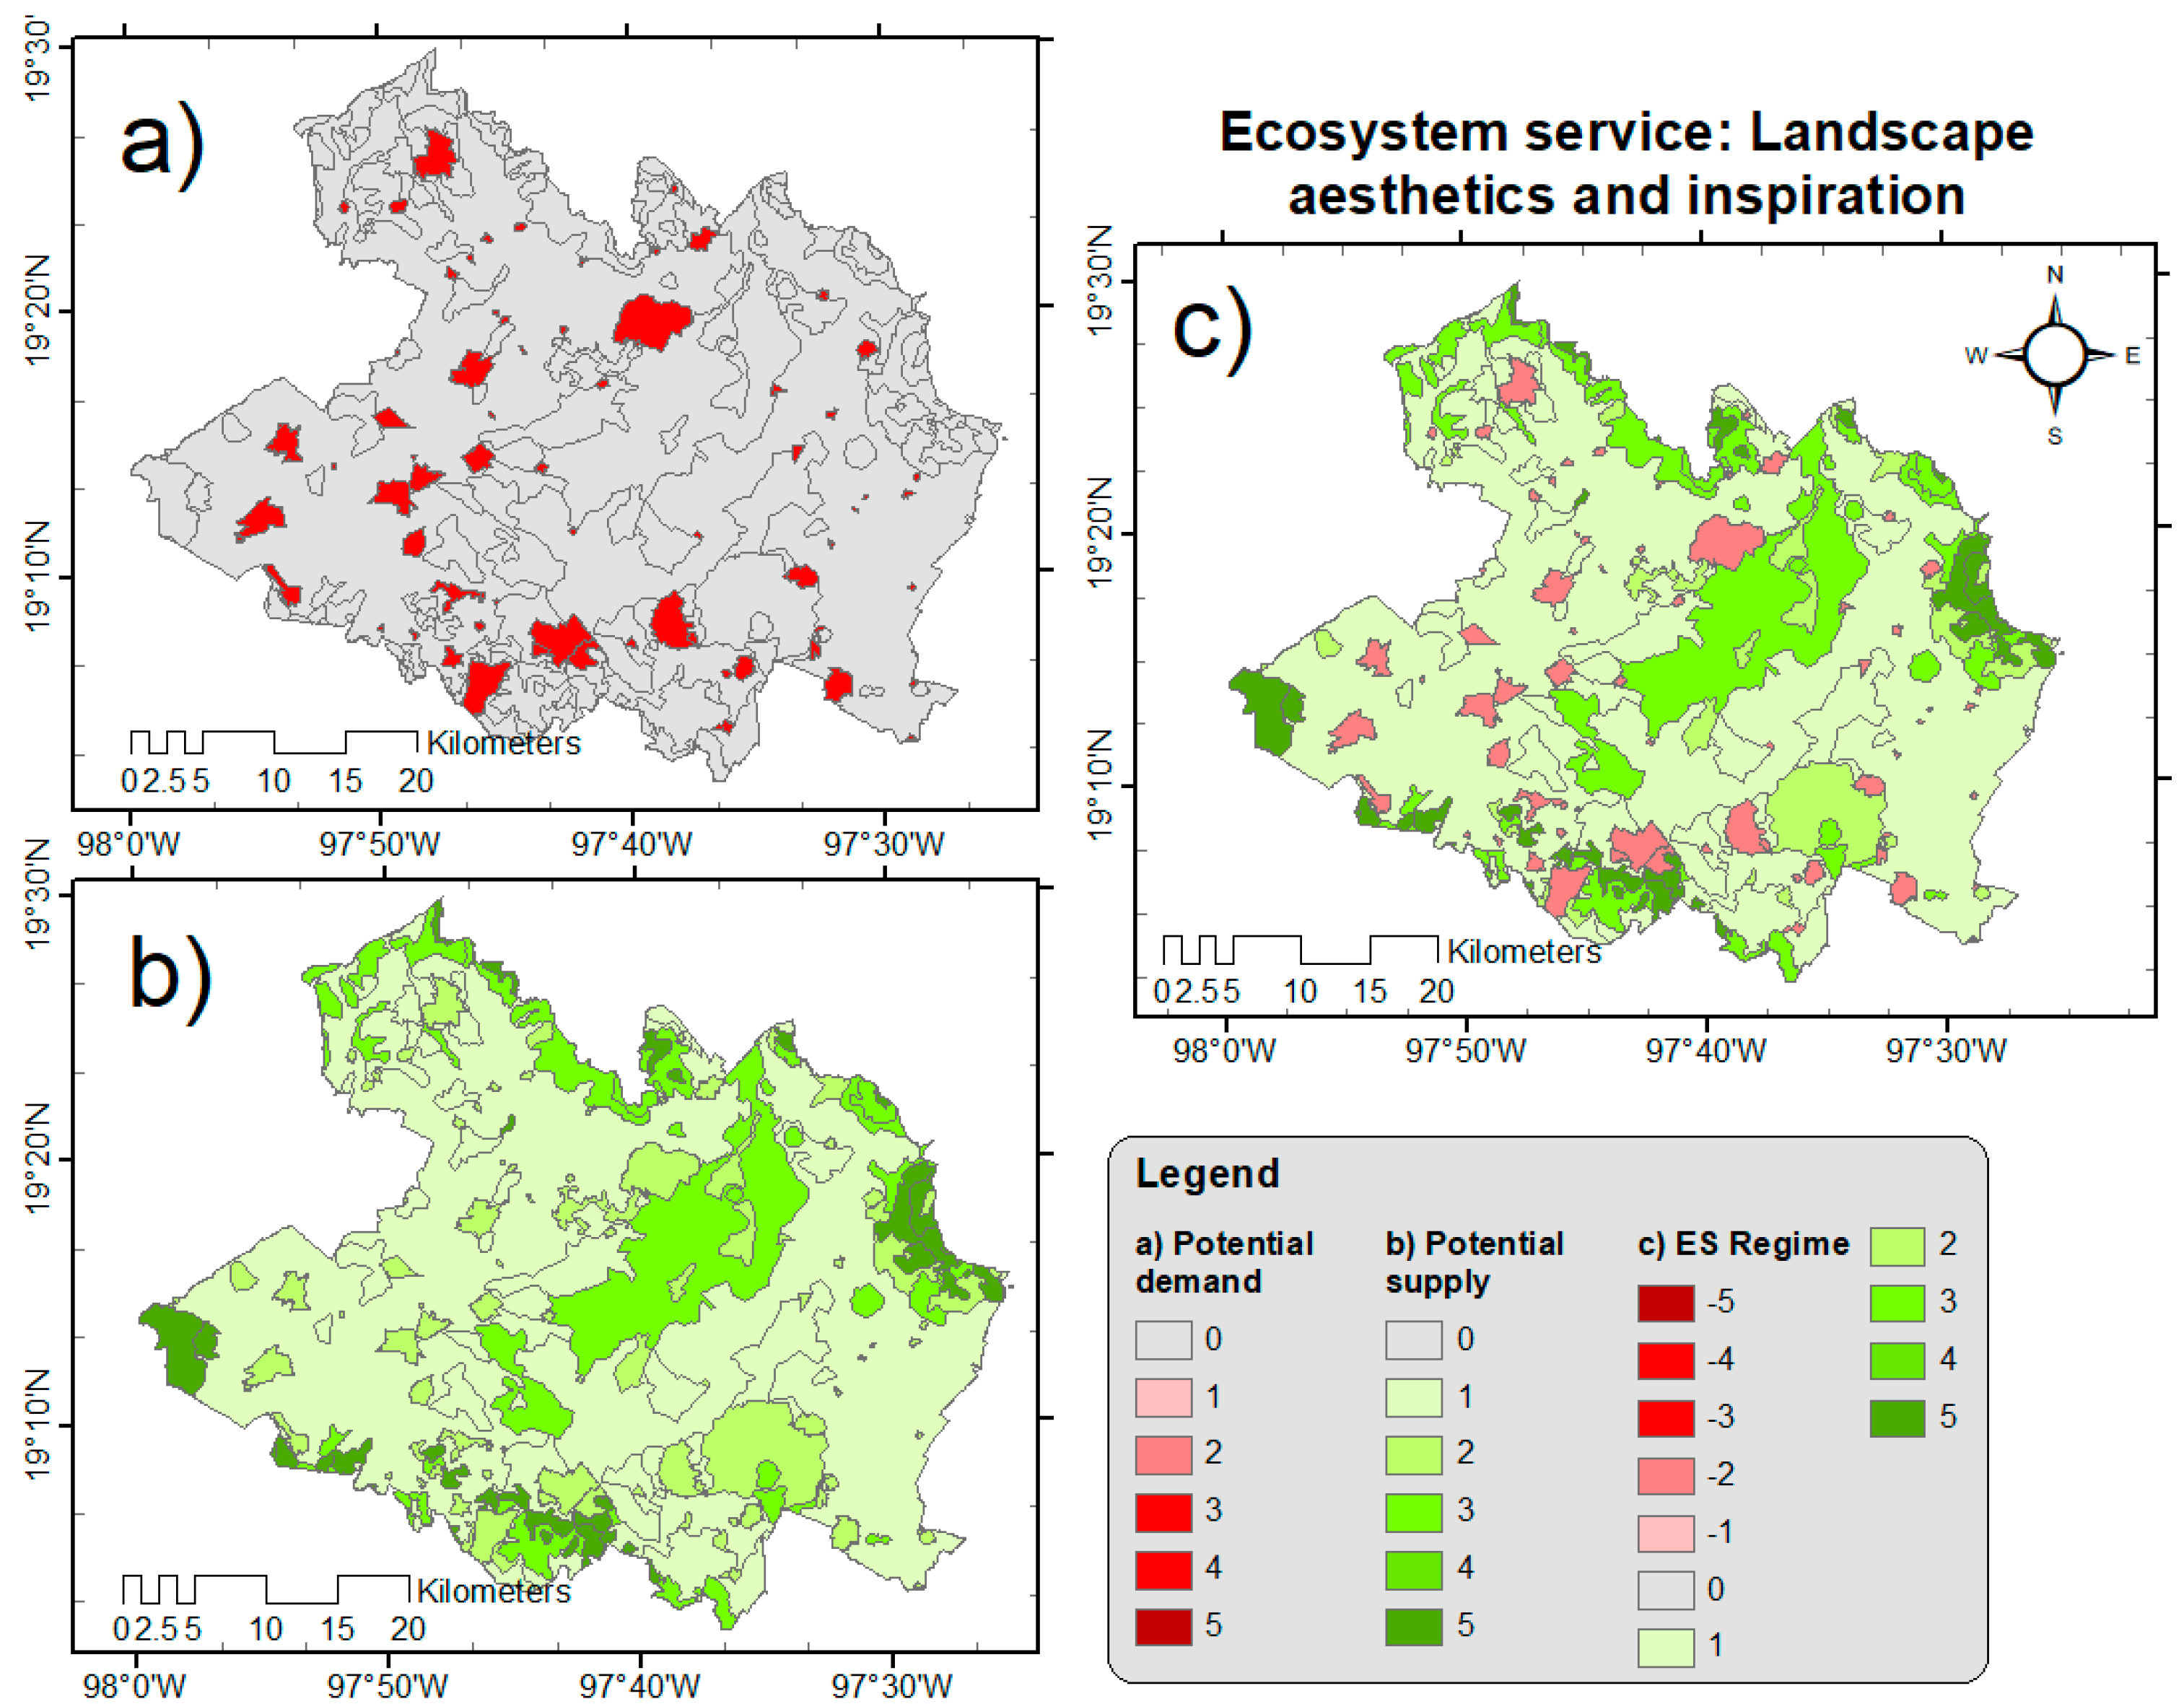
3.2. Presence of Ecosystem Services Due to Land-Use/Land-Cover Assessment

Using the data from the ES assessment matrix developed by Burkhard et al. [40], maps for the supply, demand, and regime of ES were developed in order for the study to be spatially explicit. To exemplify this, the maps for supply, demand, and the regimes of groundwater recharge (i.e., a regulating service), crops (i.e., a provisioning service), and landscape aesthetics (i.e., a cultural service) are presented in Figure 4, Figure 5 and Figure 6.
In these figures, it is possible to discern the areas that concentrate a higher potential for the supply of or demand for ES, as well as a comparison between areas with a net demand for ES next to areas that could potentially provide them and cover their needs. For instance, in the “groundwater recharge” map, demand (a) is concentrated in urban and irrigated agricultural areas, while supply (b) is provided at a rather low level by temporal agricultural lands, such that the regime (c) is somewhat balanced in terms of green and red areas. Conversely, the “landscape aesthetics and inspiration” map shows a concentration of demand (a) in urban areas while also providing (b) some inspiration at a lower level, such that the regime map (c) presents demand at a lower level than that shown in the demand map.
Under the category of “Regulating Services”, the ES prevalent in the region was found to be local climate regulation, according to the matrix. A study by Jenerette et al. [51] in conditions similar to those of San José Chiapa found that large non-urbanized areas allow natural cycles to take place with few or no interruptions, while rapid urbanization affects the microclimate due to loss of vegetation, thus coinciding with values 2–5 in the first columns of the matrix assessment, which present the contribution of undeveloped land to regulating services.
Regarding other services, such as “Water flow regulation” or “Erosion regulation”, Nedkov [20] explains how the level of provision depends on regional characteristics, such as the type of runoff present or the level of annual precipitation. In the case of San José Chiapa, there is virtually no surface runoff, and precipitation is not abundant throughout the year, meaning that these types of services are less relevant, and the value assigned in the matrix should be recalculated to reflect this lower relevance.
Conversely, groundwater recharge is a topic of the utmost importance in the studied communities. Most of the water used by the inhabitants of towns comes from public wells built and administered by local governments, while private companies have their own wells to cover their need for larger volumes of water. The assessment values the provision of this service as lowly relevant to relevant (i.e., 1–2), and as there is not a compromise between private and public water usage, there have been reports of recent shortages in public wells [52,53] being attributed to the industrial overuse of groundwater.
“Provisioning services” are determinant when analyzing the ES regime in the region given that the predominant types of land use to date have been several types of arable land (i.e., with a high to very high capacity for crops), mixed with pasture plots used for animal husbandry (i.e., with a high capacity for livestock), which are used either for profit or self-consumption. The rural setting also allows for the extraction of wood as a fuel for home use.
A reduction in the quality of the natural environment is being observed by the inhabitants of the study region, mainly because of the large number of construction trucks and the increasing amount of concrete where before there was sand, cacti, and tall grasses. These changes have deeper effects, as the use of water will be dramatically increased in the region. While water is a vital resource that should be available to everyone, the fact is that it is not equally distributed between residential, agricultural, and industrial use, which interferes with the adequate provision of ES to the public [52,54,55,56].
In the matrix assessment, the presence of cultural services was found to be strongly related to the natural landscape, which makes up the least abundant land cover types. During the field trips, it was detected that there are few places that are considered as either aesthetically or recreationally attractive by local people [57] (N. Sánchez, 2015 Personal communication). Considering natural diversity, there are three axolotl species (Ambystoma taylori, A. velasci, and A. leorae) endemic to the region, and it has been reported by Alcocer et al. [56] and Yanes et al. [58] that these have been negatively impacted by the introduction of invasive species, and their use as ingredients in cooking and traditional medicine.
After deriving the supply, demand, and regime matrices and maps, a new set of matrices was developed by comparing potential supply and demand for the different LULC classes present in the study region. The trends are not surprising: natural areas that have been transformed into managed areas lose ES provision, whereas the demand for ES increases. Conversely, cultural areas that might be converted into natural areas (e.g., by abandonment or reforestation) increase their potential provision of ES as the demand decreases. However, most of the study area is composed of managed landscape (i.e., annual agriculture) that will become urbanized, due to population increase. As a result, the potential changes in ES provision are a decrease in the supply of provisioning services, especially those related to agricultural land use, and a decrease in the supply of regulating services, given that these are closely related to the effects of having continuous vegetation cover. Figure 7 shows the LULC change matrices for two services. A review of the other ES changes is given in the Supplementary Material.

4. Discussion

The new matrices can be considered as tools to demonstrate the potential effects that changes in land use can have on the functioning of the natural ecosystem. By examining the rows and columns, it is clear that there is a trend of red cells in the matrix when changing anything to urban space, as well as how changing anything towards a forest would potentially cause a positive effect of green cells in the matrix. It is then necessary to consider landscape ecology in order to determine the better option for a community that is planning to adjust and transform its physical space. In some cases, it may be important to have industrial development followed by economic growth. However, it is worth considering the balance between what is being lost by favoring the economy: climate regulation, the production of food for people who are not able to work in the nascent industrial sector, and the reduced possibility of hiking in the open air because a nearby mountain was excavated to obtain materials for the basement of the industrial polygon.
The use of the ES-matrix has been tested and validated in several studies that confirm the assumption that the LULC conditions determine the capacity of an area to provide ES [23,24]. Nonetheless, this assumption has to be carefully considered given that there is a level of uncertainty that needs to be addressed while using this method. Authors such as Maes et al. [38], Rounsevell et al. [59], and van Zanten et al. [60] state that the ES-matrix should be used only to assess relatively large areas for which detailed information is not available. However, the matrix has been replicated successfully in several contexts in different countries such as Germany [21], Italy [61], Bulgaria [62], Bangladesh [39], and Argentina [43]. It will be necessary to test and validate these new matrices with more studies in order for them to gain the same validity as the original matrix assessment.
Figure 8 shows demographic and economic changes that can be discerned in the region surrounding San José Chiapa from 1960 to 2010. These are: (1) a reduction in the population participating in the primary sector caused either by migration or displacement, as observed by Lopez et al. [63], which is related to the growth of urban areas as was observed in the aforementioned studies and Tobias [64]; (2) the fact that participation in secondary sector activities has been growing and will continue to grow as foreigners keep moving to the region to work in the newly established manufacturing companies as has been reported in the news [65,66,67]; and (3) the fact that the tertiary sector is growing and will incorporate local people who are not working in automotive enterprises [68,69,70] given that it does not require either land productivity or specialized education.
The expected change in the structure and size of the population will result in a shift in the way people perceive and use the available ES, moving towards what Rees [71] defines as a society of industrial and urban characteristics: “the one which uses more resources than those available and produces more waste than what can be naturally processed within its own area”. The knowledge systems of the population are disconnected from natural spaces and cycles and, as stated by Mayer et al. [72], Tobias [64], and Burkhard et al. [40], urbanization marks a stronger dependence on the import of natural resources and services from surrounding regions that, as the urban space expands, will be located further away from its center.
The observed change in LULC suggests another reason for the reduction in ES provision. On the one hand, a large portion of el llano is being covered by the main installations of the manufacturing plant. On the other hand, many more areas that were formerly agricultural land are being bought by individuals and private companies for either industrial or residential purposes [73,74,75]. The absence of planning and long-term vision can exclude these lands from potential ES provision, just as it increases the demand for ES, in a situation similar to that which Mayer et al. [72] described as the need for a compromise between natural and developed areas; the desire to have both types of area puts additional pressure on a different and more distant area, because ES will still be required [71,73].
The development of new residential and industrial urban areas that replace the agricultural lands and pastures that existed previously in the region will decrease the groundwater recharge rate and increase the surface runoff rate, as described by Tang et al. [76]. Similarly, the model used by Bhaduri et al. [77] estimates large increases in surface runoff and a decrease in nutrient loads due to the loss of agricultural land. These results agree with those of the matrix assessment and the empirical evidence reported in academic studies and news reports [52,53,55,56,78].
Above-ground vegetation cover is relevant for the provision of regulating services including the generation of microclimates, carbon capture, and water retention, as described in Appendix 2 of Petter et al. [79]. Although the environmental standards of the assembly plant would suggest a responsible renovation of the vegetation that is being removed, it remains to be seen how they will offset other environmental impacts across the region. Additionally, urbanization and suburbanization are likely to allow the occurrence of the “luxury-effect”, described by Hope et al. [80]. This refers to the arrival of new plant and animal species that will fill or create ecological niches, thus threatening local biodiversity and interfering with the natural dynamics of the local ecosystem.
Nowadays, sustainability is a relevant issue for cities, and it will continue to be so in the future. The 8th and 11th objectives in the Global Goals for Sustainable Development are good jobs and economic growth, and the development of sustainable cities and communities, which are focused on socioeconomic factors. It is necessary to find a compromise between these and environment-focused goals such as clean water, climate action, or life on land (i.e., the 6th, 13th, and 15th objectives), which are intertwined with the flow of ES. It is important to develop tools that provide accurate and punctual information that is easy to understand and that can help decision makers to realize the consequences of not considering every factor in development plans. By placing the focus of development on one or two sustainability dimensions, it is possible to neglect unintended consequences that could possibly endanger the future lives of the communities being planned.
After getting decision-makers to understand the potential consequences of the plans they develop, it is advisable to present them with examples from cities in which urbanization has led to undesired transformations, as well as how have they dealt with those unintended consequences. The inclusion of ideas for mitigation during the planning phase can save new urban developments the necessity of patching or implementing ex-post solutions that can be more expensive or difficult to establish. Some of these ideas are presented in Table 2, which also indicates towards which ES these ideas are focused.

5. Conclusions

To answer the research questions, it can be concluded that the overall provision of ES in the region of San José Chiapa will change abruptly, since most of the plots surrounding urban areas contain agriculture that provides very specific ES (i.e., crops and fodder) and imposes particular demands for other ES (e.g., groundwater for irrigated agriculture). As these areas change to urban and industrial areas, the demand for ES will be higher, with less provisioning areas available to supply them. Both local people and incomers attracted by the new industrial development will have to adapt to such conditions, while population increase will result in an ever-growing demand for services. Decision-makers are urged to start working on these issues to prevent hardships in the near future.
It is advisable that neighboring municipalities coordinate efforts to plan and implement afforestation strategies. On the one hand, vegetation cover will greatly improve regulating services and help to compensate for the impacts that industrialization will have on a local scale. A coordinated effort will have an enhanced effect that will impact ES provision on a larger scale, thus improving the wellbeing of the larger population. Investigating the effect that the partitioning of landscape units will have on the provision of ES is a required follow-up to this research. Given that ES depend on the functioning of natural structures and functions, the shrinkage of providing areas-either agricultural, pastoral, or non-cultured- in the wake of new urban and industrial areas will cause interruptions in the flows of material and energy that maintain the functioning of ES. It is necessary to foster the development of tools that can provide adequate descriptions of the ES regime, for example, the design and application of mathematical models that compare present conditions with those predicted to occur once the industrialization project in the region becomes fully operational. Such tools can deliver punctual information that would be relevant and useful for decision-makers to set the tone of development in the region.

Supplementary Materials

Author Contributions

Conceptualization, A.S.-P. and S.E.S.-G.; Data curation, A.S.-P.; Formal analysis, A.S.-P. and M.G.T.-A.; Investigation, A.S.-P. and S.E.S.-G.; Methodology, A.S.-P. and S.E.S.-G.; Supervision, M.G.T.-A., R.D.P.-M., and S.E.S.-G.; Validation, M.G.T.-A., R.D.P.-M., and M.L.S.-R.; Writing—original draft, A.S.-P., S.E.S.-G.; Writing—review and editing, M.G.T.-A., R.D.P.-M., and M.L.S.-R.

Funding

This research project was funded by the PhD Grant Number 403141 from CONACYT.

Acknowledgments

The authors wish to thank to the anonymous informants that received and introduced us to the region of study, as well as Eduardo Torres Ramírez for his valuable input on the preparation of this manuscript. We would also like to acknowledge the comments of anonymous reviewers, whose contributions have greatly improved the quality of this document.

Conflicts of Interest

The authors declare no conflicts of interest.

References

  1. De Groot, R. Functions of Nature: Evaluation of Nature in Environmental Planning, Management and Decision Making; Wolters Noordhoff: Groningen, The Netherlands, 1992; ISBN 9001355943. [Google Scholar]
  2. Lyytimäki, J.; Sipilä, M. Hopping on one leg—The challenge of ecosystem disservices for urban green management. Urban For. Urban Green. 2009, 8, 309–315. [Google Scholar] [CrossRef]
  3. Balvanera, P.; Uriarte, M.; Almeida-Leñero, L.; Altesor, A.; DeClerck, F.; Gardner, T.; Hall, J.; Lara, A.; Laterra, P.; Peña-Claros, M.; Silva Matos, D.M.; et al. Ecosystem services research in Latin America: The state of the art. Ecosyst. Serv. 2012, 2, 56–70. [Google Scholar] [CrossRef]
  4. Costanza, R.; de Groot, R.; Braat, L.; Kubiszewski, I.; Fioramonti, L.; Sutton, P.; Farber, S.; Grasso, M. Twenty years of ecosystem services: How far have we come and how far do we still need to go? Ecosyst. Serv. 2017, 28, 1–16. [Google Scholar] [CrossRef]
  5. Díaz, S.; Pascual, U.; Stenseke, M.; Martín-López, B.; Watson, R.T.; Molnár, Z.; Hill, R.; Chan, K.M.A.; Baste, I.A.; Brauman, K.A.; et al. Assessing nature’s contributions to people. Science 2018, 359, 270–272. [Google Scholar] [CrossRef] [PubMed]
  6. Peterson, G.D.; Harmáčková, Z.V.; Meacham, M.; Queiroz, C.; Jiménez-Aceituno, A.; Kuiper, J.J.; Malmborg, K.; Sitas, N.; Bennett, E.M. Welcoming different perspectives in IPBES: “nature’s contributions to people” and “ecosystem services”. Ecol. Soc. 2018, 23. [Google Scholar] [CrossRef]
  7. United Nations. Declaration of the United Nations Conference on the Human Environment. In Proceedings of the United Nations Conference on the Human Environment, Stockholm, Sweden, 5–16 June 1972. [Google Scholar]
  8. Costanza, R.; D’Arge, R.; De Groot, R.; Farber, S.; Grasso, M.; Hannon, B.; Limburg, K.; Naeem, S.; O’Neill, R.V.; Paruelo, J.; et al. The value of the world’s ecosystem services and natural capital. Nature 1997, 387, 253–260. [Google Scholar] [CrossRef]
  9. Daily, G.C. Introduction: What are ecosystem services? In Nature’s Services: Societal Dependance on Natural Ecosystems; Daily, G.C., Ed.; Island Press: Washington, DC, USA, 1997; pp. 1–10. [Google Scholar]
  10. Millennium Ecosystem Assessment. Ecosystems and Human Well-Being: Synthesis; Sarukhán, J., Whyte, A., MA Board of Review Editors, Eds.; Island Press: Washington, DC, USA, 2005; ISBN 1597260401. [Google Scholar]
  11. Gómez-Baggethun, E.; de Groot, R.; Lomas, P.L.; Montes, C. The history of ecosystem services in economic theory and practice: From early notions to markets and payment schemes. Ecol. Econ. 2010, 69, 1209–1218. [Google Scholar] [CrossRef]
  12. Potschin-Young, M.; Haines-Young, R.; Görg, C.; Heink, U.; Jax, K.; Schleyer, C. Understanding the role of conceptual frameworks: Reading the ecosystem service cascade. Ecosyst. Serv. 2018, 29, 428–440. [Google Scholar] [CrossRef]
  13. Enger, E.D.; Smith, B.F. Environmental Science: A Study of Interrelationships, 12th ed.; McGraw-Hill: New York, NY, USA, 2010; ISBN 978-0-07-338320-0. [Google Scholar]
  14. Kandziora, M.; Burkhard, B.; Müller, F. Interactions of ecosystem properties, ecosystem integrity and ecosystem service indicators—A theoretical matrix exercise. Ecol. Indic. 2013, 28, 54–78. [Google Scholar] [CrossRef]
  15. Lobo, I. Biological Complexity and Integrative Levels of Organization. Nat. Educ. 2008, 1, 141. [Google Scholar]
  16. Troy, A.; Wilson, M.A. Mapping ecosystem services: Practical challenges and opportunities in linking GIS and value transfer. Ecol. Econ. 2006, 60, 435–449. [Google Scholar] [CrossRef]
  17. Egoh, B.; Reyers, B.; Rouget, M.; Richardson, D.M.; Le Maitre, D.C.; van Jaarsveld, A.S. Mapping ecosystem services for planning and management. Agric. Ecosyst. Env. 2008, 127, 135–140. [Google Scholar] [CrossRef]
  18. Burkhard, B.; Kroll, F.; Müller, F.; Windhorst, W. Landscapes‘ Capacities to Provide Ecosystem Services—A Concept for Land-Cover Based Assessments. Landsc. Online 2009, 15, 1–22. [Google Scholar] [CrossRef]
  19. Villa, F.; Bagstad, K.; Johnson, G.; Voigt, B. Scientific instruments for climate change adaptation: Estimating and optimizing the efficiency of ecosystem service provision. Econ. Agrar. Recur. Nat. 2011, 11, 83–98. [Google Scholar]
  20. Nedkov, S.; Burkhard, B. Flood regulating ecosystem services—Mapping supply and demand, in the Etropole municipality, Bulgaria. Ecol. Indic. 2012, 21, 67–79. [Google Scholar] [CrossRef]
  21. Burkhard, B.; Kroll, F.; Nedkov, S.; Müller, F. Mapping ecosystem service supply, demand and budgets. Ecol. Indic. 2012, 21, 17–29. [Google Scholar] [CrossRef]
  22. Valadez, J. Comunicación Audi México Audi México Comprometido Con Sus Proveedores Para El Inicio De Producción; Audi Media Info: Ingolstadt, Germany, 2015. [Google Scholar]
  23. Kroll, F.; Müller, F.; Haase, D.; Fohrer, N. Rural–urban gradient analysis of ecosystem services supply and demand dynamics. Land Use Policy 2012, 29, 521–535. [Google Scholar] [CrossRef]
  24. Meacham, M.; Queiroz, C.; Norström, A.V.; Peterson, G.D. Social-ecological drivers of multiple ecosystem services: What variables explain patterns of ecosystem services across the Norrström drainage basin? Ecol. Soc. 2016, 21. [Google Scholar] [CrossRef]
  25. Clerici, N.; Paracchini, M.L.; Maes, J. Land-cover change dynamics and insights into ecosystem services in European stream riparian zones. Ecohydrol. Hydrobiol. 2014, 14, 107–120. [Google Scholar] [CrossRef]
  26. Hall, C.A.S. Integrating concepts and models from development economics with land use change in the tropics. Environ. Dev. Sustain. 2006, 8, 19–53. [Google Scholar] [CrossRef]
  27. Hoynes, H.W.; Page, M.E.; Stevens, A.H. Poverty in America: Trends and Explanations. J. Econ. Perspect. 2006, 20, 47–68. [Google Scholar] [CrossRef]
  28. Rimal, B.; Zhang, L.; Stork, N.; Sloan, S.; Rijal, S. Urban expansion occurred at the expense of agricultural lands in the Tarai region of Nepal from 1989 to 2016. Sustainability 2018, 10. [Google Scholar] [CrossRef]
  29. Instituto Nacional de Estadística y Geografía. Red Hidrográfica 1:50,000; Edición 2.0; Instituto Nacional de Estadística y Geografía: Aguascalientes, Mexico, 2010.
  30. Saldaña Munive, J.A. Medio físico. In La biodiversidad en Puebla: Estudio de Estado; Comisión Nacional para el Conocimiento y Uso de la Biodiversidad (CONABIO), Gobierno del Estado de Puebla, Benemérita Universidad Autónoma de Puebla: Puebla, Mexico, 2011; pp. 27–45. ISBN 9786077607540. [Google Scholar]
  31. Instituto Nacional de Estadística y Geografía. Conjuntos topográficos 1:50,000; Instituto Nacional de Estadística y Geografía: Aguascalientes, Mexico, 2014.
  32. Esri. “Ocean Basemap” [basemap]. Scale 1:577k. “World Ocean Map”. 27 June 2018. Available online: http://www.arcgis.com/home/item.html?id=5ae9e138a17842688b0b79283a4353f6 (accessed on 20 July 2018).
  33. Lin, Z.; Ye, X.; Wei, Q.; Xin, F.; Lu, Z.; Kudva, S.; Dai, Q. Ecosystem Services Value Assessment and Uneven Development of the Qingjiang River Basin in China. Sustainability 2017, 9, 2356. [Google Scholar] [CrossRef]
  34. Mendoza, M.E.; Granados, E.L.; Geneletti, D.; Pérez-Salicrup, D.R.; Salinas, V. Analysing land cover and land use change processes at watershed level: A multitemporal study in the Lake Cuitzeo Watershed, Mexico (1975–2003). Appl. Geogr. 2011, 31, 237–250. [Google Scholar] [CrossRef]
  35. Bagstad, K.J.; Semmens, D.J.; Winthrop, R. Comparing approaches to spatially explicit ecosystem service modeling: A case study from the San Pedro River, Arizona. Ecosyst. Serv. 2013, 5, 40–50. [Google Scholar] [CrossRef]
  36. Instituto Nacional de Estadística y Geografía. Conjunto de Datos Vectoriales de Uso del Suelo y Vegetación Escala 1:250 000; Serie V (Capa Unión); Instituto Nacional de Estadística y Geografía: Aguascalientes, Mexico, 2013.
  37. Instituto Nacional de Estadística y Geografía. Censos y conteos de población y vivienda; Instituto Nacional de Estadística y Geografía: Aguascalientes, Mexico, 2010.
  38. Maes, J.; Egoh, B.; Willemen, L.; Liquete, C.; Vihervaara, P.; Schägner, J.P.; Grizzetti, B.; Drakou, E.G.; La Notte, A.; Zulian, G.; et al. Mapping ecosystem services for policy support and decision making in the European Union. Ecosyst. Serv. 2012, 1, 31–39. [Google Scholar] [CrossRef]
  39. Mukul, S.A.; Sohel, M.S.I.; Herbohn, J.; Inostroza, L.; König, H. Integrating ecosystem services supply potential from future land-use scenarios in protected area management: A Bangladesh case study. Ecosyst. Serv. 2017, 26, 355–364. [Google Scholar] [CrossRef]
  40. Burkhard, B.; Kandziora, M.; Hou, Y.; Müller, F. Ecosystem Service Potentials, Flows and Demands Quantification—Concepts for spatial localisation, indication and quantification. Landsc. Online 2014, 34, 1–32. [Google Scholar] [CrossRef]
  41. Campagne, C.S.; Roche, P.K. May the matrix be with you! Guidelines for the application of expert-based matrix approach for ecosystem services assessment and mapping. One Ecosyst. 2018, 3, 24. [Google Scholar] [CrossRef]
  42. Tamang, B. An Assessment of Ecosystem Services of the Everest Region, Nepal; Christian-Albrechts-Universität zu Kiel: Kiel, Germany, 2011. [Google Scholar]
  43. Weyland, F.; Barral, M.P.; Laterra, P. Assessing the relationship between ecosystem functions and services: Importance of local ecological conditions. Ecol. Indic. 2017, 81, 201–213. [Google Scholar] [CrossRef]
  44. Villa, F.; Ceroni, M.; Bagstad, K.; Johnson, G.; Krivov, S. ARIES (ARtificial Intelligence for Ecosystem Services): A new tool for ecosystem services assessment, planning, and valuation. In Proceedings of the 11th Annual BIOECON Conference on Economic Instruments to Enhance the Conservation and Sustainable Use of Biodiversity, Venice, Italy, 21–22 September 2009. [Google Scholar]
  45. Hou, Y.; Burkhard, B.; Müller, F. Uncertainties in landscape analysis and ecosystem service assessment. J. Environ. Manag. 2013, 127, 117S–S131. [Google Scholar] [CrossRef] [PubMed]
  46. Azuz Adeath, I.; Rivera Arriaga, E. Estimación del crecimiento poblacional para los estados costeros de México. Pap. Población 2007, 51, 187–211. [Google Scholar]
  47. Narro-Robles, J.; Hernández-Bringas, H.H.; Flores-Arenales, R. El censo de población de 2010: Cuatro millones más de mexicanos de lo previsto, ¿el final de una política de Estado? Pap. Población 2012, 74, 1–39. [Google Scholar]
  48. Anzaldo, C.; Barrón, E.A. La transición urbana de México, 1900–2005. In La situacion demografica de Mexico 2009; Consejo Nacional de Poblacion: Mexico DF, Mexico, 2009; pp. 53–66. ISBN 970628947X. [Google Scholar]
  49. Cruz, E. En Dos Años Habitarían 45 Mil Personas En Ciudad Modelo Audi; Diario Cambio: Puebla, México, 2015. [Google Scholar]
  50. Hernández, M. Arranca Vivienda En Ciudad Modelo De Audi; El Economista: Madrid, Spain, 2016. [Google Scholar]
  51. Jenerette, G.D.; Harlan, S.L.; Brazel, A.; Jones, N.; Larsen, L.; Stefanov, W.L. Regional relationships between surface temperature, vegetation, and human settlement in a rapidly urbanizing ecosystem. Landsc. Ecol. 2007, 22, 353–365. [Google Scholar] [CrossRef]
  52. Rappo Miguez, S. La Cuenca De Libres-Oriental Y Las Disputas Por El Agua; La Jornada de Oriente: Tlaxcala, Mexico, 2016. [Google Scholar]
  53. Serrano, M. Denuncian Desabasto De Agua En San José Chiapa; MunicipiosPuebla: Texmelucan, Mexico, 2017. [Google Scholar]
  54. Comisión Nacional del Agua. Consulta a la base de datos del REPDA; Comisión Nacional del Agua: Mexico City, Mexico, 2018.
  55. Meléndez, D. Audi Acabó Con El Suministro De Agua De Cinco Municipios, Acusan Pobladores; Diario Cambio: Puebla, Mexico, 2017. [Google Scholar]
  56. Alcocer, D.J.; Escolero, F.Ó.A.; Marín, S.L.E. Problemática del agua de la cuenca oriental, estados de Puebla, Veracruz y Tlaxcala. In El agua en México vista desde la academia; Jiménez, B., Marín, L., Eds.; Academia Mexicana de Ciencias: Mexico DF, Mexico, 2005; pp. 57–77. ISBN 968-7428-22-8. [Google Scholar]
  57. Sánchez Hernández, A.A.; Teutli Léon, M.; Hurtado Mireles, M.; Saloma Cano, M. de los Á.; Mendoza, P.E. Status of the issue of the region of San José Chiapa, Puebla, Mexico, before the arrival of AUDI. Procedia Environ. Sci. 2016, 34, 641–650. [Google Scholar] [CrossRef]
  58. Yanes Gómez, G.; Castañeda Hernández, C.; Gutiérrez Mayén, G.; Villar Salaza, C. Amenazas a la biodiversidad. In La biodiversidad en Puebla: Estudio de Estado; Comision Nacional para el Conocimiento y Uso de la Biodiversidad, Gobierno del Estado de Puebla, Benemérita Universidad Autónoma de Puebla: Puebla, Mexico, 2011; pp. 285–310. ISBN 9786077607540. [Google Scholar]
  59. Rounsevell, M.D.A.; Pedroli, B.; Erb, K.H.; Gramberger, M.; Busck, A.G.; Haberl, H.; Kristensen, S.; Kuemmerle, T.; Lavorel, S.; Lindner, M.; et al. Challenges for land system science. Land use policy 2012, 29, 899–910. [Google Scholar] [CrossRef]
  60. Van Zanten, B.T.; Verburg, P.H.; Scholte, S.S.K.; Tieskens, K.F. Using choice modeling to map aesthetic values at a landscape scale: Lessons from a Dutch case study. Ecol. Econ. 2016, 130, 221–231. [Google Scholar] [CrossRef]
  61. Egarter Vigl, L.; Depellegrin, D.; Pereira, P.; de Groot, R.; Tappeiner, U. Mapping the ecosystem service delivery chain: Capacity, flow, and demand pertaining to aesthetic experiences in mountain landscapes. Sci. Total Environ. 2017, 574, 422–436. [Google Scholar] [CrossRef] [PubMed]
  62. Nedkov, S.; Zhiyanski, M.; Dimitrov, S.; Borisova, B.; Popov, A.; Ihtimanski, I.; Yaneva, R.; Nikolov, P.; Bratanova-Doncheva, S. Mapping and assessment of urban ecosystem condition and services using integrated index of spatial structure. One Ecosyst. 2017, 2, e14499. [Google Scholar] [CrossRef]
  63. López, E.; Bocco, G.; Mendoza, M.; Velázquez, A.; Aguirre-Rivera, J.R. Peasant emigration and land-use change at the watershed level: A GIS-based approach in Central Mexico. Agric. Syst. 2006, 90, 62–78. [Google Scholar] [CrossRef]
  64. Tobias, S. Preserving ecosystem services in urban regions: Challenges for planning and best practice examples from Switzerland. Integr. Environ. Assess. Manag. 2013, 9, 243–251. [Google Scholar] [CrossRef] [PubMed] [Green Version]
  65. Ayala Martínez, A. Hasta ahora, la llegada de Audi a Chiapa es “la gloria y el infierno”. Available online: http://ladobe.com.mx/2015/08/hasta-ahora-la-llegada-de-audi-a-chiapa-es-la-gloria-y-el-infierno/ (accessed on 18 November 2016).
  66. Almanza, E. Planta De Audi Detonaría Infraestructura En San José Chiapa, Prevén Autoridades. Available online: http://www.elfinanciero.com.mx/empresas/planta-de-audi-detonaria-infraestructura-en-san-jose-chiapa-preven-autoridades.html (accessed on 18 November 2016).
  67. Fernández, K. Se Instalarán ocho Empresas en el Parque Industrial AUDI; Diario Cambio: Puebla, Mexico, 2016. [Google Scholar]
  68. Castillo, K. Truenan Pobladores De San José Chiapa Ante Falta De Empleo En Obras De Audi. Available online: www.centronline.mx/contenido//2015/08/26/25531/truena-san-jose-chiapa-ante-falta-de-empleo-en-obras-de-audi (accessed on 27 June 2016).
  69. Góchez, G. Brilla Ciudad Modelo De Audi Pero Pobreza Aún Cobija A San José Chiapa; Municipios Puebla: Puebla, Mexico, 2016. [Google Scholar]
  70. Vega, C. Audi no llevó el progreso a San José Chiapa: Pobladores; El Sol de Puebla: Puebla, Mexico, 2017. [Google Scholar]
  71. Rees, W.E. Urban ecosystems: The human dimension. Urban Ecosyst. 1997, 1, 63–75. [Google Scholar] [CrossRef]
  72. Mayer, A.L.; Kauppi, P.E.; Angelstam, P.K.; Zhang, Y.; Tikka, P.M. Importing timber, exporting ecological impact. Science 2005, 308, 359–360. [Google Scholar] [CrossRef] [PubMed]
  73. Sánchez, G. Construcción De Audi Ocasiona Daños En Tierras De Chiapa Y Nopalucan; MunicipiosPuebla: Puebla, Mexico, 2016. [Google Scholar]
  74. Tirzo Santos, I. Del socavón Express, al Socavón Ambiental; Milenio: Michoacan, Mexico, 2017. [Google Scholar]
  75. Campos, S. Excavaciones De Constructora Provocan Daños Ecológicos En Ixtiyucan; El Sol de Puebla: Puebla, Mexico, 2016. [Google Scholar]
  76. Tang, Z.; Engel, B.A.; Pijanowski, B.C.; Lim, K.J. Forecasting land use change and its environmental impact at a watershed scale. J. Environ. Manag. 2005, 76, 35–45. [Google Scholar] [CrossRef] [PubMed]
  77. Bhaduri, B.; Harbor, J.; Engel, B.; Grove, M. Assessing watershed-scale, long-term hydrologic impacts of land-use change using a GIS-NPS model. Environ. Manag. 2000, 26, 643–658. [Google Scholar] [CrossRef] [PubMed]
  78. Can-Chulim, Á.; Ortega-Escobar, H.M.; García-Calderón, N.E.; Reyes-Ortigoza, A.L.; González-Hernández, V.A.; Flores-Román, D. Origen y calidad del agua subterránea en la cuenca Oriental de México. Terra Latinoam. 2011, 29, 189–200. [Google Scholar]
  79. Petter, M.; Mooney, S.; Maynard, S.M.; Davidson, A.; Cox, M.; Horosak, I. A Methodology to Map Ecosystem Functions to Support Ecosystem. Ecol. Soc. 2013, 18, 31. [Google Scholar] [CrossRef]
  80. Hope, D.; Gries, C.; Zhu, W.; Fagan, W.F.; Redman, C.L.; Grimm, N.B.; Nelson, A.L.; Martin, C.; Kinzig, A. Socioeconomics drive urban plant diversity. Proc. Natl. Acad. Sci. USA 2003, 100, 8788–8792. [Google Scholar] [CrossRef] [PubMed] [Green Version]
  81. Vailshery, L.S.; Jaganmohan, M.; Nagendra, H. Effect of street trees on microclimate and air pollution in a tropical city. Urban For. Urban Green. 2013, 12, 408–415. [Google Scholar] [CrossRef]
  82. Armson, D.; Stringer, P.; Ennos, A.R. The effect of street trees and amenity grass on urban surface water runoff in Manchester, UK. Urban For. Urban Green. 2013, 12, 408–415. [Google Scholar] [CrossRef]
  83. Berland, A.; Shiflett, S.A.; Shuster, W.D.; Garmestani, A.S.; Goddard, H.C.; Herrmann, D.L.; Hopton, M.E. The role of trees in urban stormwater management. Landsc. Urban Plan. 2017, 162, 167–177. [Google Scholar] [CrossRef]
  84. Strohbach, M.W.; Haase, D. Above-ground carbon storage by urban trees in Leipzig, Germany: Analysis of patterns in a European city. Landsc. Urban Plan. 2012, 104, 95–104. [Google Scholar] [CrossRef]
  85. Zhao, C.; Sander, H.A.; Bond-Lamberty, B. Quantifying and mapping the supply of and demand for carbon storage and sequestration service from urban trees. PLoS ONE 2015, 10. [Google Scholar] [CrossRef] [PubMed]
  86. Rosol, M.; Schweizer, P. Ortoloco Zurich: Urban agriculture as an economy of solidarity. City 2012, 16, 713–724. [Google Scholar] [CrossRef]
  87. Opitz, I.; Berges, R.; Piorr, A.; Krikser, T. Contributing to food security in urban areas: Differences between urban agriculture and peri-urban agriculture in the Global North. Agric. Hum. Values 2016, 33, 341–358. [Google Scholar] [CrossRef]
  88. Toparlar, Y.; Blocken, B.; Maiheu, B.; van Heijst, G.J.F. The effect of an urban park on the microclimate in its vicinity: A case study for Antwerp, Belgium. Int. J. Climatol. 2018, 38, e303–e322. [Google Scholar] [CrossRef]
  89. Lovell, S.T.; Taylor, J.R. Supplying urban ecosystem services through multifunctional green infrastructure in the United States. Landsc. Ecol. 2013, 28, 1447–1463. [Google Scholar] [CrossRef]
  90. Buchel, S.; Frantzeskaki, N. Citizens’ voice: A case study about perceived ecosystem services by urban park users in Rotterdam, the Netherlands. Ecosyst. Serv. 2015, 12, 169–177. [Google Scholar] [CrossRef]
  91. Jujnovsky, J.; Almeida-Leñero, L.; Bojorge-García, M.; Monges, Y.L.; Cantoral-Uriza, E.; Mazari-Hiriart, M. Hydrologic ecosystem services: Water quality and quantity in the Magdalena River, Mexico City. Hidrobiológica 2010, 20, 113–126. [Google Scholar]
  92. Garcia, X.; Barceló, D.; Comas, J.; Corominas, L.; Hadjimichael, A.; Page, T.J.; Acuña, V. Placing ecosystem services at the heart of urban water systems management. Sci. Total Environ. 2016, 563–564, 1078–1085. [Google Scholar] [CrossRef] [PubMed]
  93. Olguín, E.J.; Sánchez-Galván, G.; Melo, F.J.; Hernández, V.J.; González-Portela, R.E. Long-term assessment at field scale of Floating Treatment Wetlands for improvement of water quality and provision of ecosystem services in a eutrophic urban pond. Sci. Total Environ. 2017, 584–585, 561–571. [Google Scholar] [CrossRef] [PubMed]
Figure 1. Location of the study area (a) in relation to North America, (b) to the center of Mexico, and (c) as the bottom of a basin el llano in San José Chiapa. Prepared by the authors with information from INEGI [31] and Esri [32].
Sustainability 10 03355 g001
Figure 2. Land-use/land-cover map in the municipalities surrounding San José Chiapa. Prepared by the authors with information from INEGI [36].
Sustainability 10 03355 g002
Figure 3. Process used to determine potential changes to the ES regime due to LULC changes and the elaboration of the change matrices. Prepared by the authors.
Sustainability 10 03355 g003
Figure 4. Demand (a), supply (b), and budget (c) of ecosystem service “groundwater recharge”, according to the land-use/land-cover matrix assessment by Burkhard et al. [40]. Prepared by the authors with information from INEGI [31].
Sustainability 10 03355 g004
Figure 5. Demand (a), supply (b), and budget (c) of ecosystem service “crops”, according to the land-use/land-cover matrix assessment by Burkhard et al. [40]. Prepared by the authors with information from INEGI [31].
Sustainability 10 03355 g005
Figure 6. Demand (a), supply (b), and budget (c) of ecosystem service “landscape aesthetics and inspiration”, according to the land-use/land-cover matrix assessment by Burkhard et al. [40]. Prepared by the authors with information from INEGI [31].
Sustainability 10 03355 g006
Figure 7. LULC change matrices for two ecosystem services. On the left side “Local climate regulation” and on the right side “Crops”. The matrix is to be read as a comparison between an initial LULC (on the first column) towards a final LULC (on the first row), and thus the number in which they cross represents the amount of change in supply, demand, or final balance for the chosen service at different LULC changes.
Sustainability 10 03355 g007
Figure 8. Historic distribution of the employed population divided by economic sectors. Prepared by the authors with information from INEGI [37].
Sustainability 10 03355 g008
Table 1. Assessment matrix for the potential supply of ecosystem services. The 0–5 scale stands for 0 being “Non-relevant participation on the supply of an ecosystem service” and 5 being “Relevant participation on the supply of an ecosystem service”. Based on Burkhard et al. [13,23], after the ES list published by MEA [10].
Regulating ServicesProvisioning ServicesCultural Services
CORINE ClassificationINEGI ClassificationGlobal climate regulationLocal climate regulationAir quality regulationGroundwater rechargeWater flow regulationWater purificationNutrient regulationErosion regulationNatural hazard regulationPollinationPest and disease controlRegulation of wasteCropsBiomass for energyFodderLivestockFibreTimberWood fuelFish, seafood and edible algaeAquacultureWild foods and resourcesBiochemicals and medicineFreshwaterMineral resourcesAbiotic energy sourcesRecreation and tourismLandscape aesthetics and inspirationKnowledge systemsReligious and spiritual experienceCultural heritage and cultural diversityNatural heritage and natural diversity
Discontinuous urban fabricZONA URBANA00000001011010000000000001322220
Non-irrigated arable landAGRICULTURA DE TEMPORAL ANUAL12112010112255505000013002112030
Permanently irrigated landAGRICULTURA DE RIEGO ANUAL Y SEMIPERMANENTE13101010112251204000013001112030
Annual and permanent cropsAGRICULTURA DE TEMPORAL ANUAL Y PERMANENTE12111012112242415000011002112030
PasturesPASTIZAL INDUCIDO21011011102401550000020005222031
Sclerophyllous vegetationPASTIZAL HALÓFILO; MATORRAL DESERTICO ROSETOFILO22111121122301111220013001234124
Broad-leaved forestBOSQUE DE ENCINO55523555444401101550053000555345
Coniferous forestBOSQUE DE PINO; BOSQUE DE TÁSCATE; BOSQUE DE OYAMEL55523555444401101550053000555344
Mixed forestBOSQUE DE ENCINO-PINO; BOSQUE DE PINO-ENCINO55523555445501102550053000555345
Transitional woodland shrubVEGETACIÓN SECUNDARIA ARBUSTIVA Y ARBÓREA22101121122302111120011001234122
Salt marshesSIN VEGETACIÓN APARENTE11001121412200220000010000323022
Water bodiesCUERPO DE AGUA12025230303501000004540501544233
Table 2. Examples of infrastructure that has been developed in urban settings to enhance ES provision.
Possible SolutionEcosystem ServicesExamples/References
Afforestation of the streetsLocal-climate regulation
Air-quality regulation
Water-flow regulation
Groundwater recharge
Vailshery et al., 2013 [81];
Armson et al., 2013 [82];
Berland et al., 2017 [83]
Green belts or urban forestsCarbon storage
Local-climate regulation
Strohbach and Haase, 2012, [84];
Zhao and Sander, 2015 [85]
Patches dedicated to urban agricultureCropsRosol and Schweizer, 2012 [86];
Opitz et al., 2016 [87]
Urban park networkLocal-climate regulation
Recreation
Landscape aesthetics
Toparlar et al., 2018 [88];
Lovell and Taylor, 2013 [89];
Buchel and Frantzeskaki, 2015 [90]
Re-establishment of surface water channelsWater-flow regulation
Water purification
Recreation and tourism
Jujnovsky et al., 2010 [91];
García et al., 2016 [92];
Olguín, et al., 2017 [93]

