Evidence on the Impact of Winter Heating Policy on Air Pollution and Its Dynamic Changes in North China


1
Sun Wah International Business School, Liaoning University, Shenyang 110036, China
2
Research Center for the Economies and Politics of Transitional Countries, Liaoning University, Shenyang 110036, China
3
Department of AFIRM, Scott College of Business, Indiana State University, Terre Haute, IN 47809, USA
*
Author to whom correspondence should be addressed.
Sustainability 2019, 11(10), 2728; https://0-doi-org.brum.beds.ac.uk/10.3390/su11102728
Submission received: 22 April 2019
/
Accepted: 8 May 2019
/
Published: 14 May 2019
(This article belongs to the Section Environmental Sustainability and Applications)
Abstract
:Environmental pollution, especially air pollution, is an alarming issue for the public, which is extensively debated among academic scholars. During the winter heating season, “smog” has become somewhat a normal phenomenon to local residents’ livelihood in northern China. Based on the daily air pollution data of regional cities in China from 2014 to 2016, and using a regression discontinuity design (RDD), the study finds that winter heating makes the air quality worse in the northern part of China. With the start of the winter heating, it increases the Air Quality Index (AQI) by 10.4%, particulate matter smaller than 10 μm (PM10) by 9.77%, particulate matter smaller than 2.5 μm (PM2.5) by 17.25%, CO by 9.84%, NO2 by 5.23%, and SO2 by 17.1%. Furthermore, dynamic changes demonstrate that air quality has gradually improved due to a series of heating policy changes implemented by the central government in recent years. Specifically, from 2014 to 2016, major indicators measuring the air pollution decrease dramatically, such as AQI by 92.36%, PM10 by 91.24%, PM2.5 by 84.06%, CO by 70.97%, NO2 by 52.76%, and SO2 by 17.15%.
JEL Classification:
Q01; Q55; Q51; Q53; O131. Introduction
Air pollution has become one of the greatest environmental problems faced by society today, causing enormous undesirable effects. According to the World Health Organization (WHO), “as the world gets hotter and more crowded, and engines continue to pump out dirty emissions, and half the world has no access to clean fuels or technologies (e.g. stoves, lamps), the very air we breathe is growing dangerously polluted: nine out of 10 people now breathe polluted air, which kills seven million people every year. The health effects of air pollution are serious—one third of deaths from stroke, lung cancer and heart disease are due to air pollution” (https://www.who.int/air-pollution/news-and-events/how-air-pollution-is-destroying-our-health). The increase of concentrations of suspended particulate matter such as PM2.5 in the haze has significantly decreased the level of happiness and health of human [1,2,3,4]; they also cause neonatal health problems [5], increase the cancer risks [6], and elevate the risk of infantile autism and asthma attacks [7,8]. Air pollution also damages firm performances [9], agricultural production [10], and even affects the growth of urban trees, which can be considered as important tools for the mitigation and adaptation of cities to climate change [11]; hence, air pollution is impeding regional development and economic growth in the long run [12,13].
Most of the literature works focus on studying the causes of urban air pollution. Few research works have examined the effect of emissions, energy consumption, climate changes, and other determinants on particulate matter (PM) [14,15,16,17]. Some believe that the industrial structure and urbanization rate are positively associated with carbon emissions and are thereby increasing air pollution [18]. Meanwhile, the impact of meteorological conditions, residential heating, and road traffic on urban PM10 concentrations have been assessed [19,20,21,22]. Some other works focus on the fuel combustion process and renewable energy, suggesting that correct attention should be given to the entire process to reduce the dangerousness of emissions and improve their energy efficiency [23,24,25].
With China’s rapid economic growth, people are gradually realizing the importance of a sustainable and sound ecological environment for their livelihood [26]; therefore, China’s current environmental problem, especially the air pollution, is of great public concern [27,28,29,30]. Based on housing market data, studies have shown the property buyers’ marginal willingness to pay for the improvement of air quality, and confirmed the existence of the value of “clean air” [31,32]. Although the Clean Air Action launched by the central government in recent years has substantially controlled the “dirty” industrial factories [33], there are still large differences in the air quality between the north and south. Compared with southern China, the cities of northern China suffer more from heavy smog every winter; subsequently, local residents have been advised to stay indoors [34]. Relevant studies have pointed out that the haze in northern China is largely associated with winter heating [35,36,37,38,39].
During the 1950s, when economic resources were allocated via central planning, and due to the limited fiscal budget, the central government instituted a differentiated heating policy in the south and north of China with a boundary line of the Huai River. The difference consisted of providing winter heating via coal-fired boilers in the areas north of the Huai River, but not for the south. However, the burning of coal in the boilers increases the concentrations of airborne particulate matter such as PM10 and PM2.5, as well as SO2, NO2, CO, and so on, leading to heavy air pollution. Based on the daily air quality data of regional cities in China from 2014 to 2016, this study finds that winter heating indeed causes more air pollution in the north of China, increasing the Air Quality Index (AQI) by 10.4%, PM10 by 9.77%, PM2.5 by 17.25%, CO by 9.84%, NO2 by 5.23%, and SO2 by 17.1%. Furthermore, when we further examine the dynamic changes, it reveals that air pollution has gradually been reduced, as a series of aggressive environmental protection measures have been carried out in recent years.
In fact, the Ministry of Environmental Protection and State General Administration of Quality Supervision, Inspection, and Quarantine of China jointly issued Ambient Air Quality Standards (GB 3095-2012 Revision) in 2012, stipulating the ceiling value for the items of pollutants within an average amount of time. The limits for the major pollutants discussed in this paper are presented in Table 1. Meanwhile, the State Council released an action plan for air pollution prevention and control in 2013, setting up targets for decreasing the urban concentration of particulate matters (PM10) by 10% and the fine particulate matter (PM2.5) concentration in Beijing–Tianjin–Hebei, the Yangtze River Delta, and the Pearl River Delta region by about 25%, 20%, and 15% respectively by 2017, compared with 2012.
We believe our study, when compared with previous studies in the literature, has several improvements. First, most existing works use a regression discontinuity (RD) design based on distance from the Huai River [35,36,37]. Such a cross-sectional design cannot help us fully understand the extent to which winter heating policy is associated with the air pollution in the north. Hence, we choose a RD design based on the heating start time, which allows for a direct investigation of the impact of the winter heating policy in the north. Second, we used a comprehensive dataset, collecting the daily air quality data of almost all the regional cities in the north of China from 2014 to 2016, including multiple indicators measuring air pollution and relevant weather variables. Finally, our findings reveal the dynamic changes of the winter air quality in the north of China. To be specific, following the approach adopted in the latest research [40], we divide the sample data into three sub-samples according to their year difference, and use the RD design to evaluate these sub-samples separately. In recent years, the central government has been implementing a series of heating policy changes; therefore, to a certain degree, our study contributes to evaluating the effectiveness of these policies and provides a few suggestions on the current environmental protection policies. Although the study focuses on the winter heating problem of China, it also provides guidance regarding environmental governance for other developing countries, especially those with heavy air pollution caused by coal burning.
2. Methodology and Data Sources
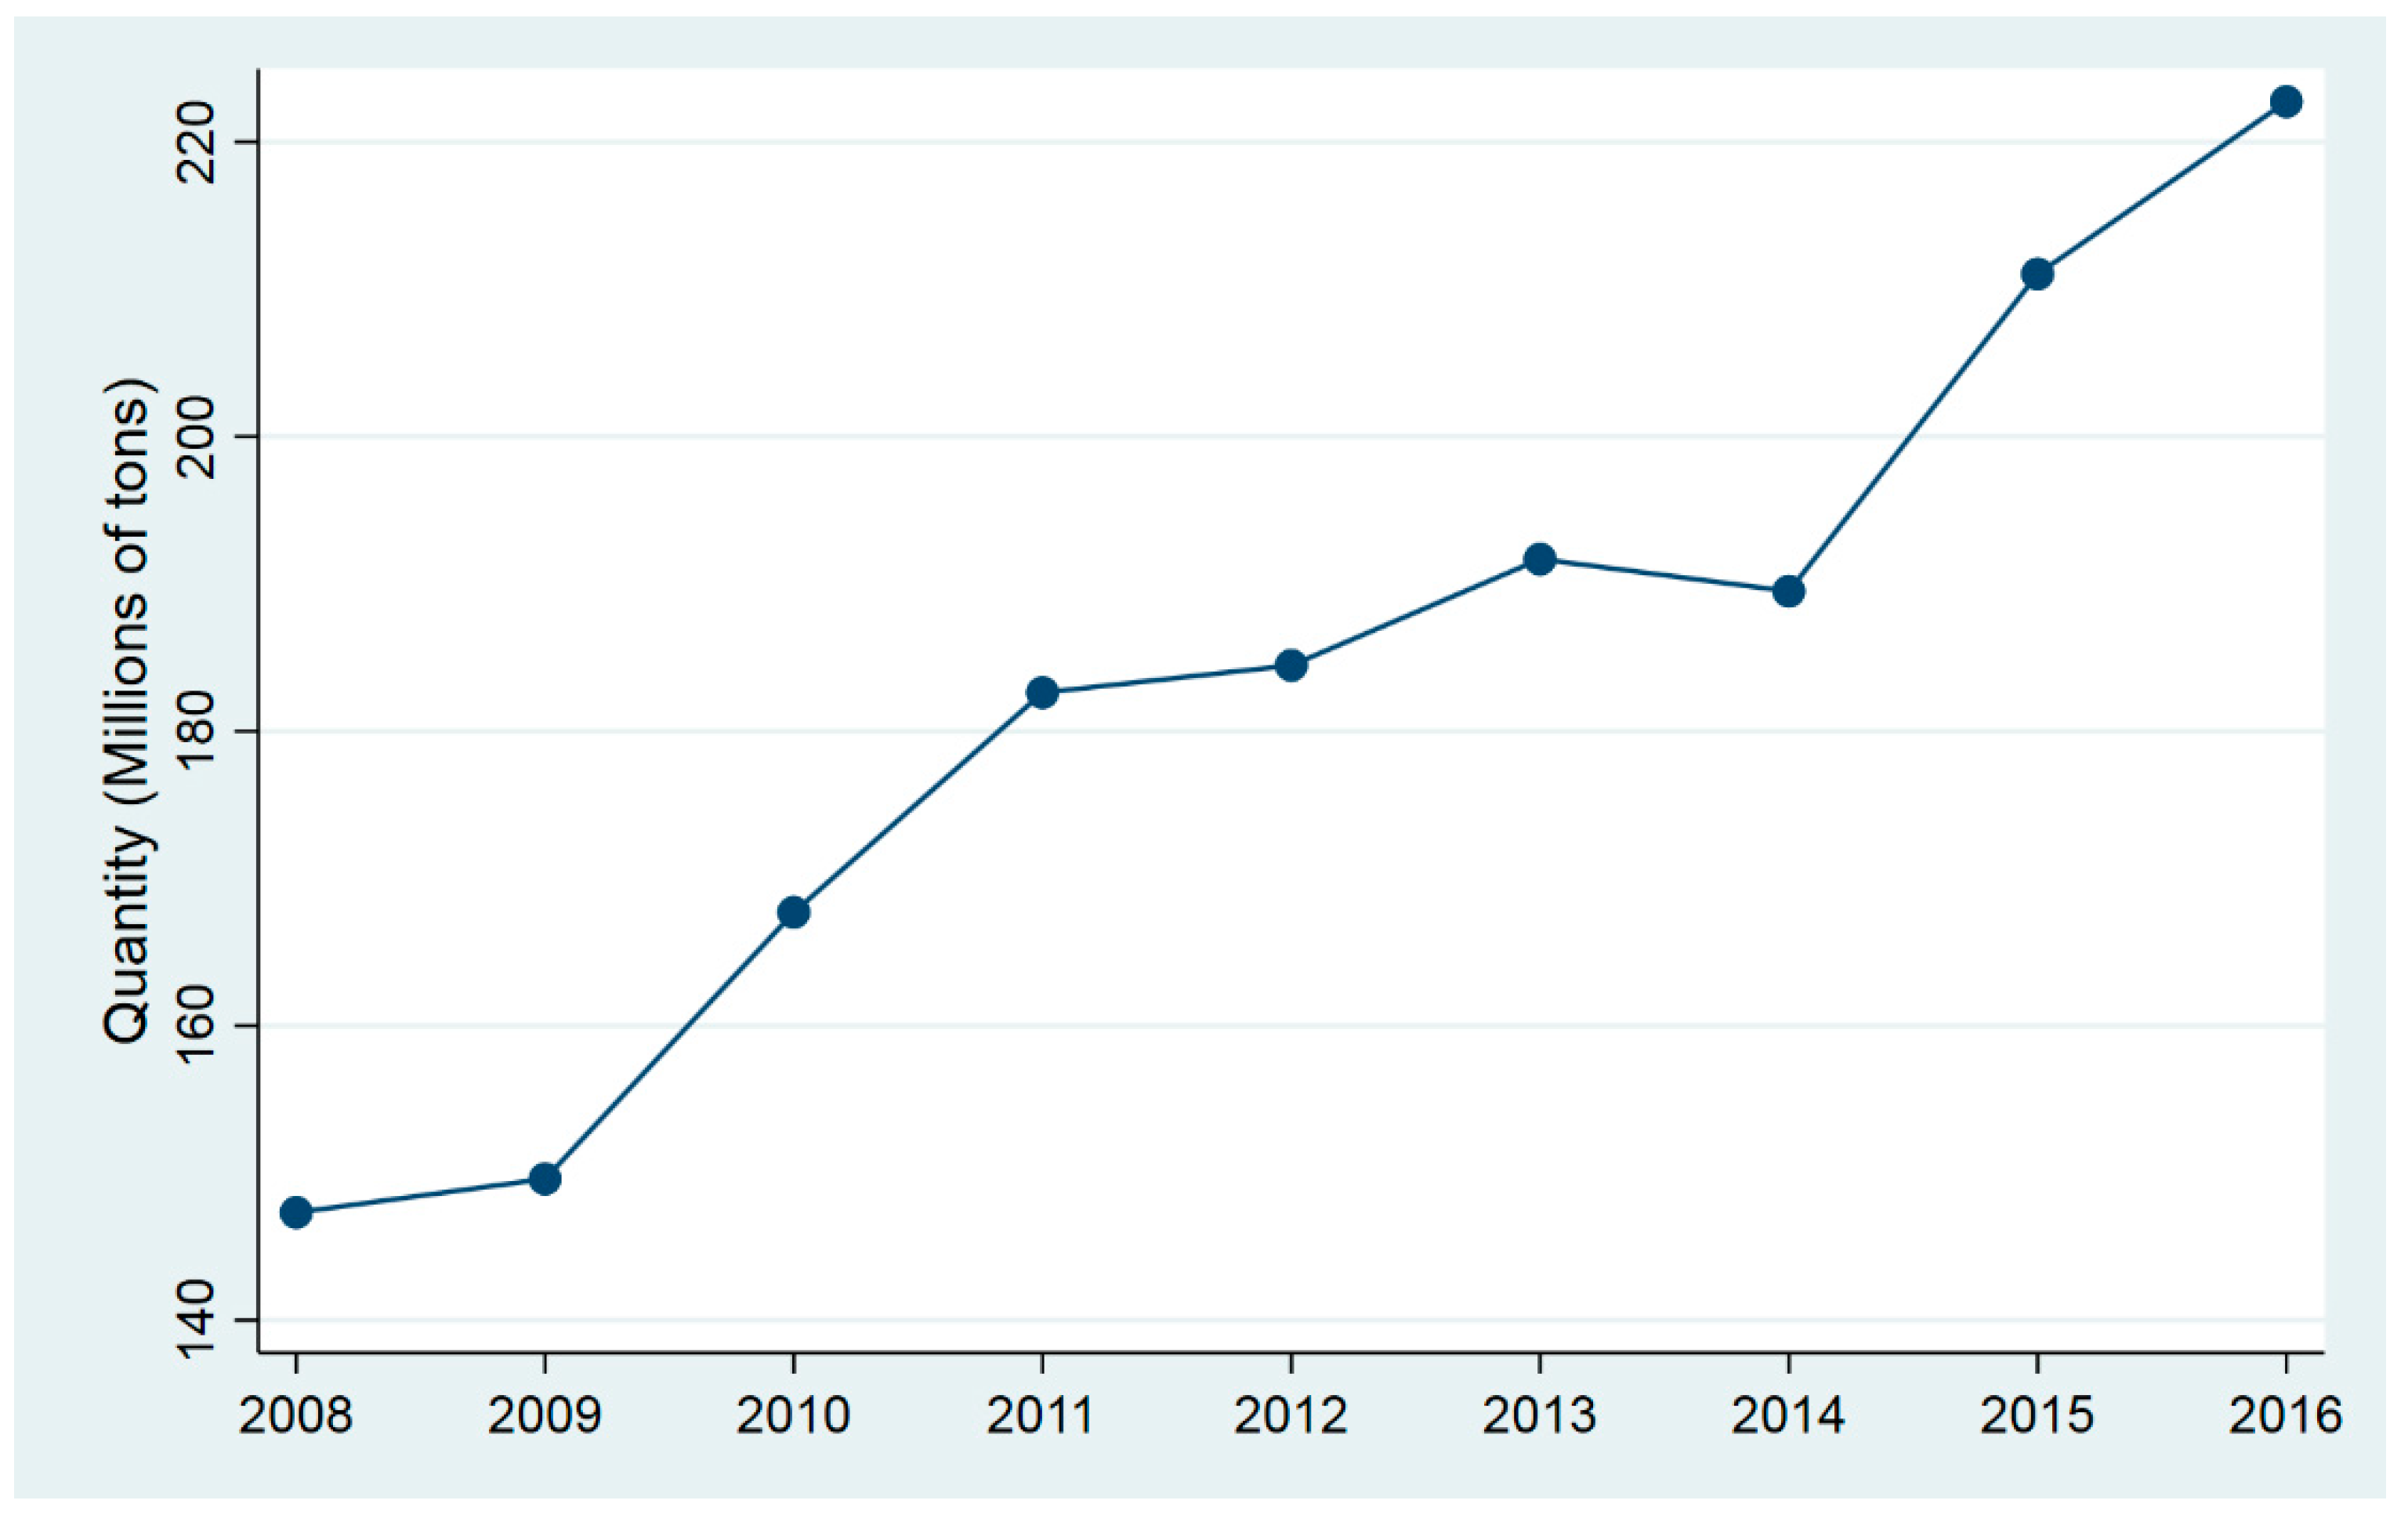
Winter heating in northern China has a boundary line of the Huai River. It covers 17 provinces, municipalities, and autonomous regions that specifically include the municipalities of Beijing and Tianjin, the provinces of Hebei, Shanxi, Liaoning, Jilin, Heilongjiang, Shandong, Shaanxi, Gansu, Qinghai, Jiangsu (partial area), and Henan (partial area), and the autonomous regions of Inner Mongolia, Ningxia Hui, Xinjiang Uygur, and Tibet. To increase the heating efficiency as well as reduce the total amount of air pollution, China has implemented the centralized heating system since the 1950s. Heating devices are installed inside of the houses and public buildings in accordance with the uniformed central heating development plan. Compared with combined heat and power (CHP), boiler heating has been developed earlier with technology that is more modern; therefore, it has become the most important heating method in northern China. Meanwhile, due to the high expense of natural gas, electricity, and other types of clean energy, coal remains the main heating fuel in China [38]. Since 2003, more than 300 cities in the north have set up the coal-fired heating arrangements. Figure 1 illustrates the quantity of raw coal used for urban heating from 2008 to 2016. We can observe a gradual increase in the coal consumption together with China’s rapid urbanization. Further, the heating area has also increased at an average annual rate of 14.7% during the period from 1993 to 2013 [38]. The winter heating period usually lasts four months: from November to March. This time span can vary from different cities. For instance, Shenyang, the capital city of Liaoning Province, usually starts heating in the end of October and stops in the end of March.
This study investigates the impact of urban winter central heating on the air pollution using a RD design. In recent years, the instrumental variable (IV), difference-in-differences (DID), and RD design have been widely used in the applied economic research. Compared with IV and DID, RD is more similar to a random experiment, and therefore is considered to be the most reliable quasi-experimental method to evaluate the program or policy effects [41,42]. The policy rule assigns individual subjects to the “treatment” group. To be specific, in our study, the implementation of winter heating complies with the heating period set by local governments. After the heating starts, outcome variables such as air quality will be assigned to the “treatment” group.
2.1. Econometric Model
Our RD design aims to test whether the winter central heating has caused a discontinuous change in the air quality in the north of China. Specifically, following Chen et al. [36] and Ebenstein et al. [37], the estimation equation (Equation (1)) is as follows:
where is a regional city, refers to the year, and is a particular day. represents different indicators measuring air pollution. Following Imbens and Lemieux [43], is a discontinuity dummy variable that is equal to 1 if the city has started winter heating on that day; otherwise, it is valued at 0. To assess the impact of winter heating more accurately, our study strictly limits the period to 30 days before/after the heating starts. Following Chen et al. [38] and Li et al. [39], we further choose as the control variable. represents a vector of covariates, which may also affect air pollution such as weather, wind direction, and so on. Following Gelman and Imbens [44], is a second-order polynomial in the days before and after the heating starts, while is the year fixed effect, is the city fixed effect, and is the random disturbance.
2.2. Data Sources
This study utilizes the RD design to probe the influence of winter heating policy on the air pollution. Therefore, dependent variables are the indicators measuring air pollution, especially consisting of AQI (Air Quality Index), PM10 (Particulate matter smaller than 10 μm), PM2.5 (Particulate matter smaller than 2.5 μm), SO2 (sulfur dioxide), CO (carbon monoxide), NO2 (nitrogen dioxide), and so on. The data are collected from the National Urban Air Quality Real-Time Release Platform of the China National Environmental Monitoring center (http://www.cnemc.cn/). A larger value of the variable indicator implies more serious air pollution. Controlling variables (covariates) include temperature, wind strength, and so on. These data are from the weather website (http://lishi.tianqi.com/). The above are daily data from the period between 2014–2016, which were collected via web scraping with Python.
We also collected the real winter heating start dates of 76 cities of the north 17 provinces, municipalities, and autonomous regions. These data are from the local municipal government official websites. Usually, local governments schedule the heating date of their own cities. However, the starting date of winter heating could be adjusted a bit according to the local temperature changes. Therefore, our study sets the RD design based on the real starting date of winter heating rather than the scheduled one. Descriptive statistics for variables are presented in Table 2.
3. Empirical Results
3.1. Balance Test
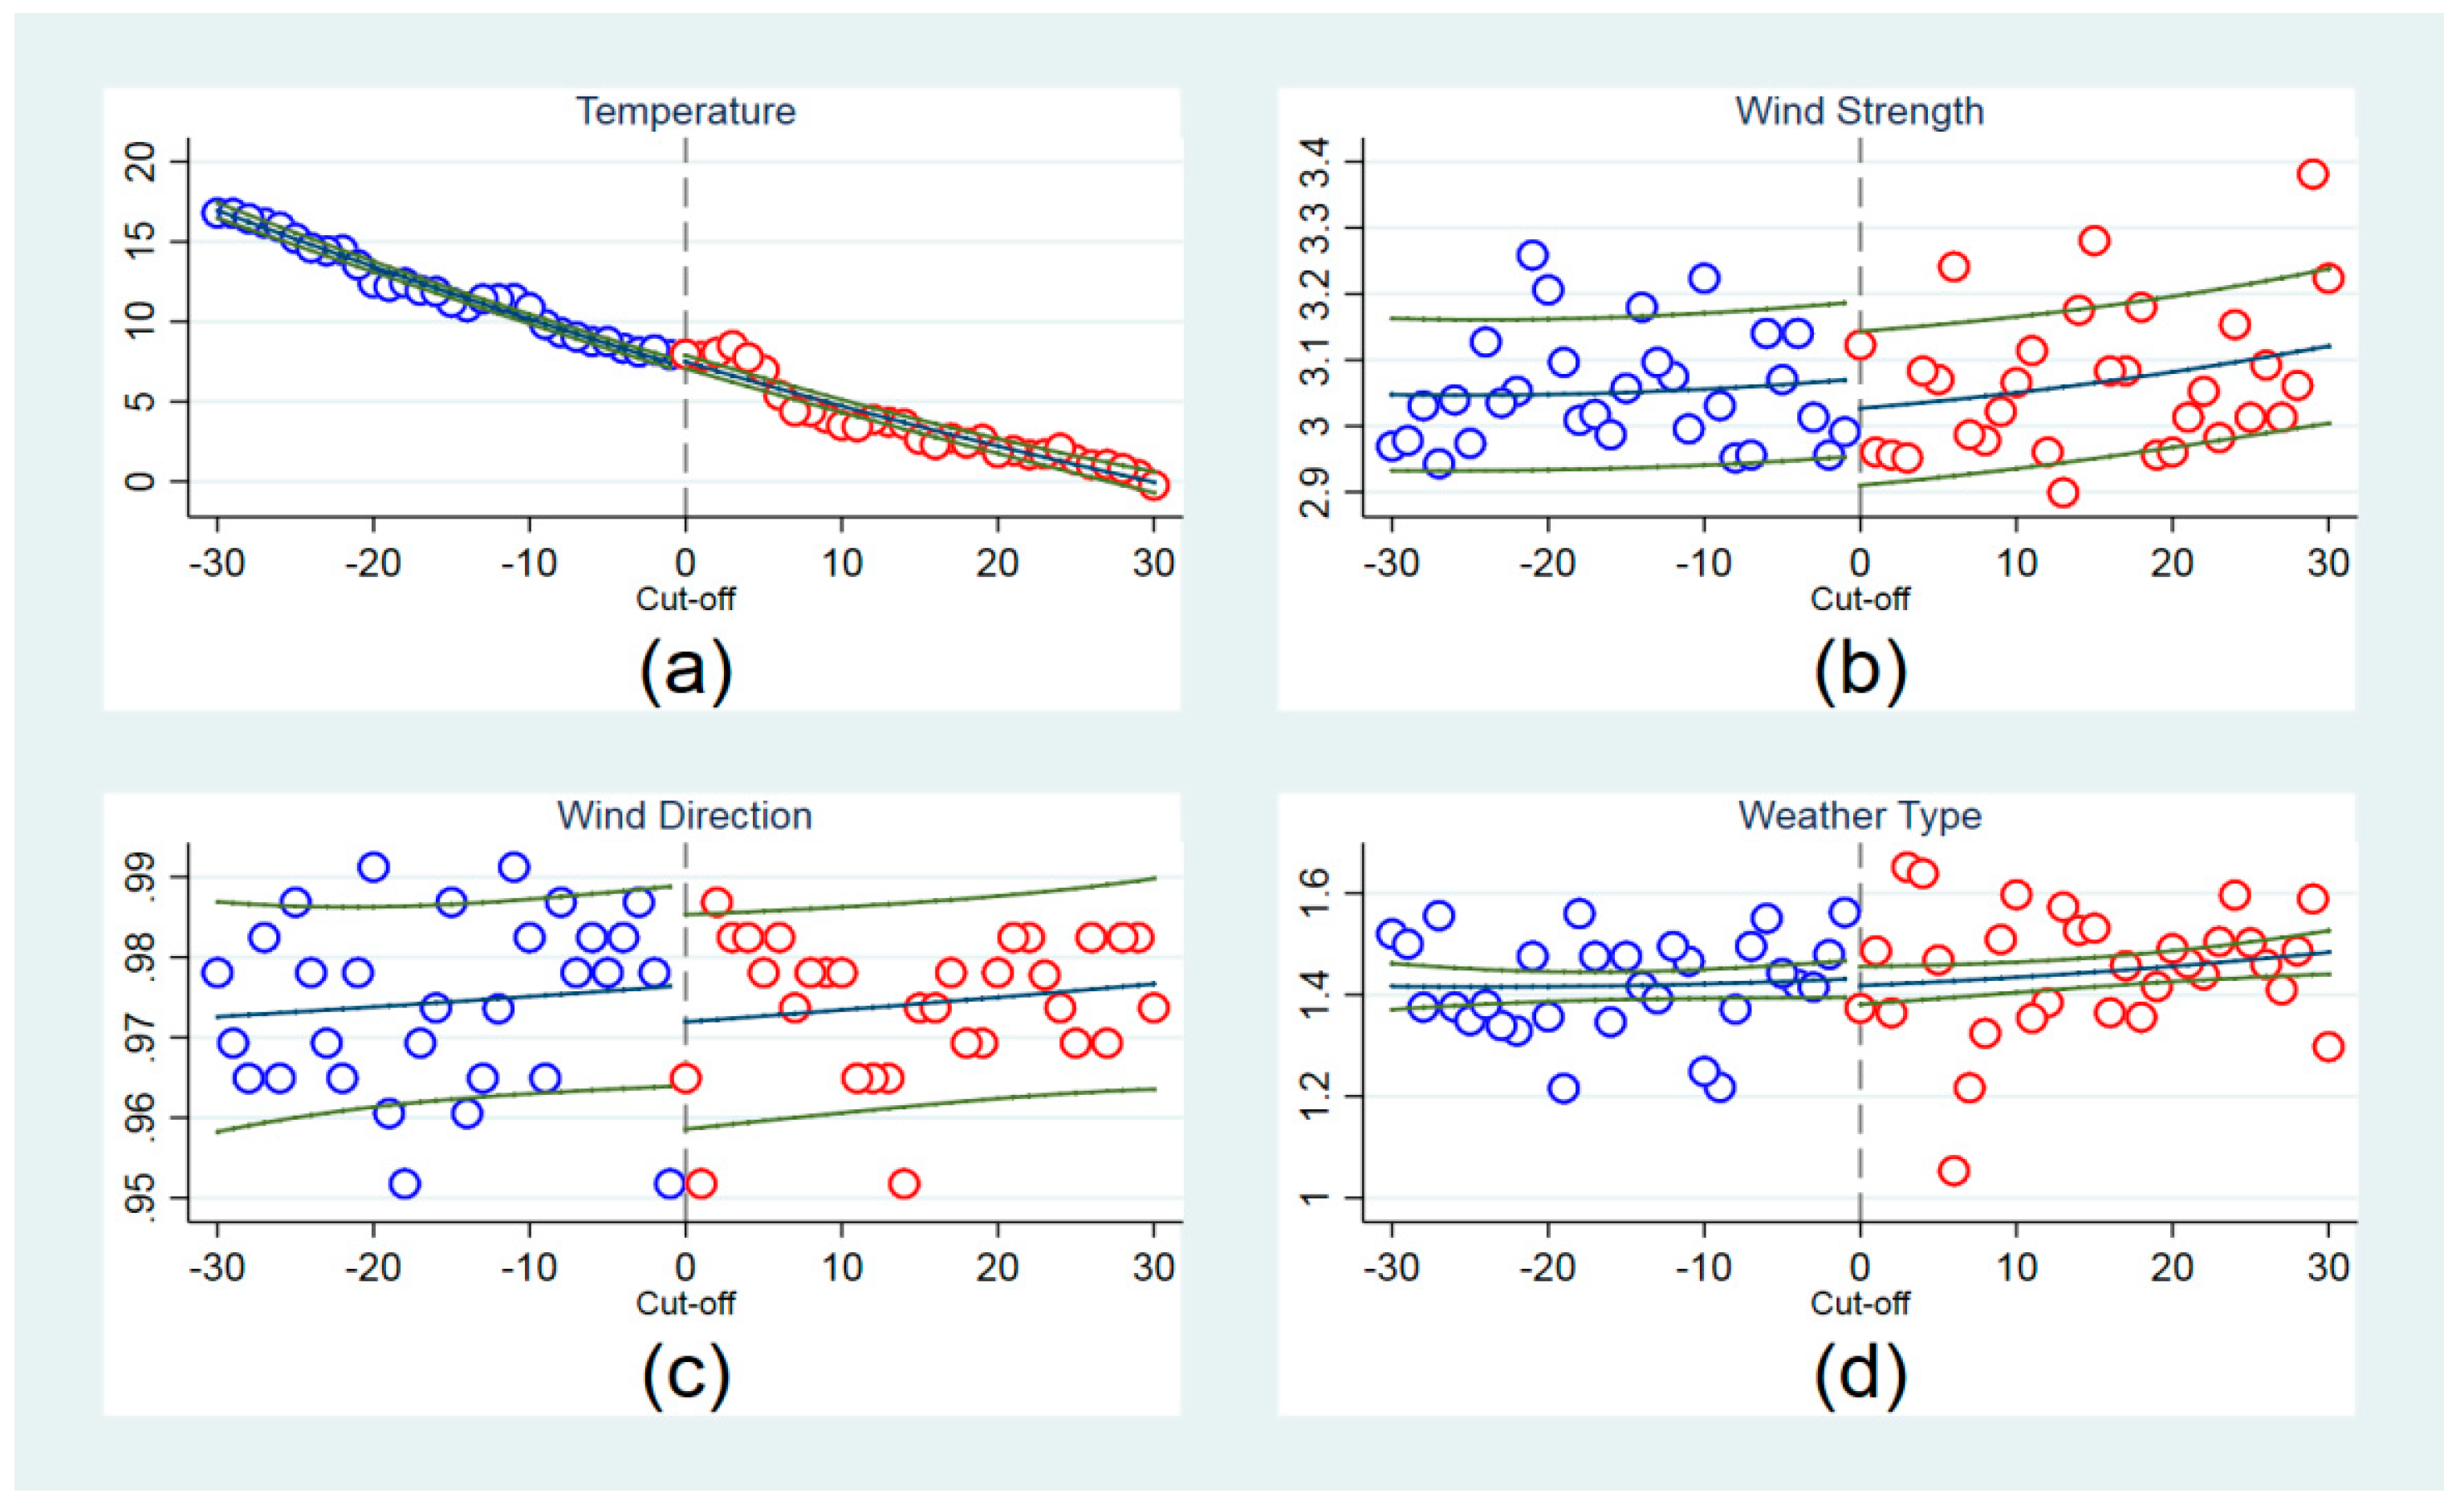
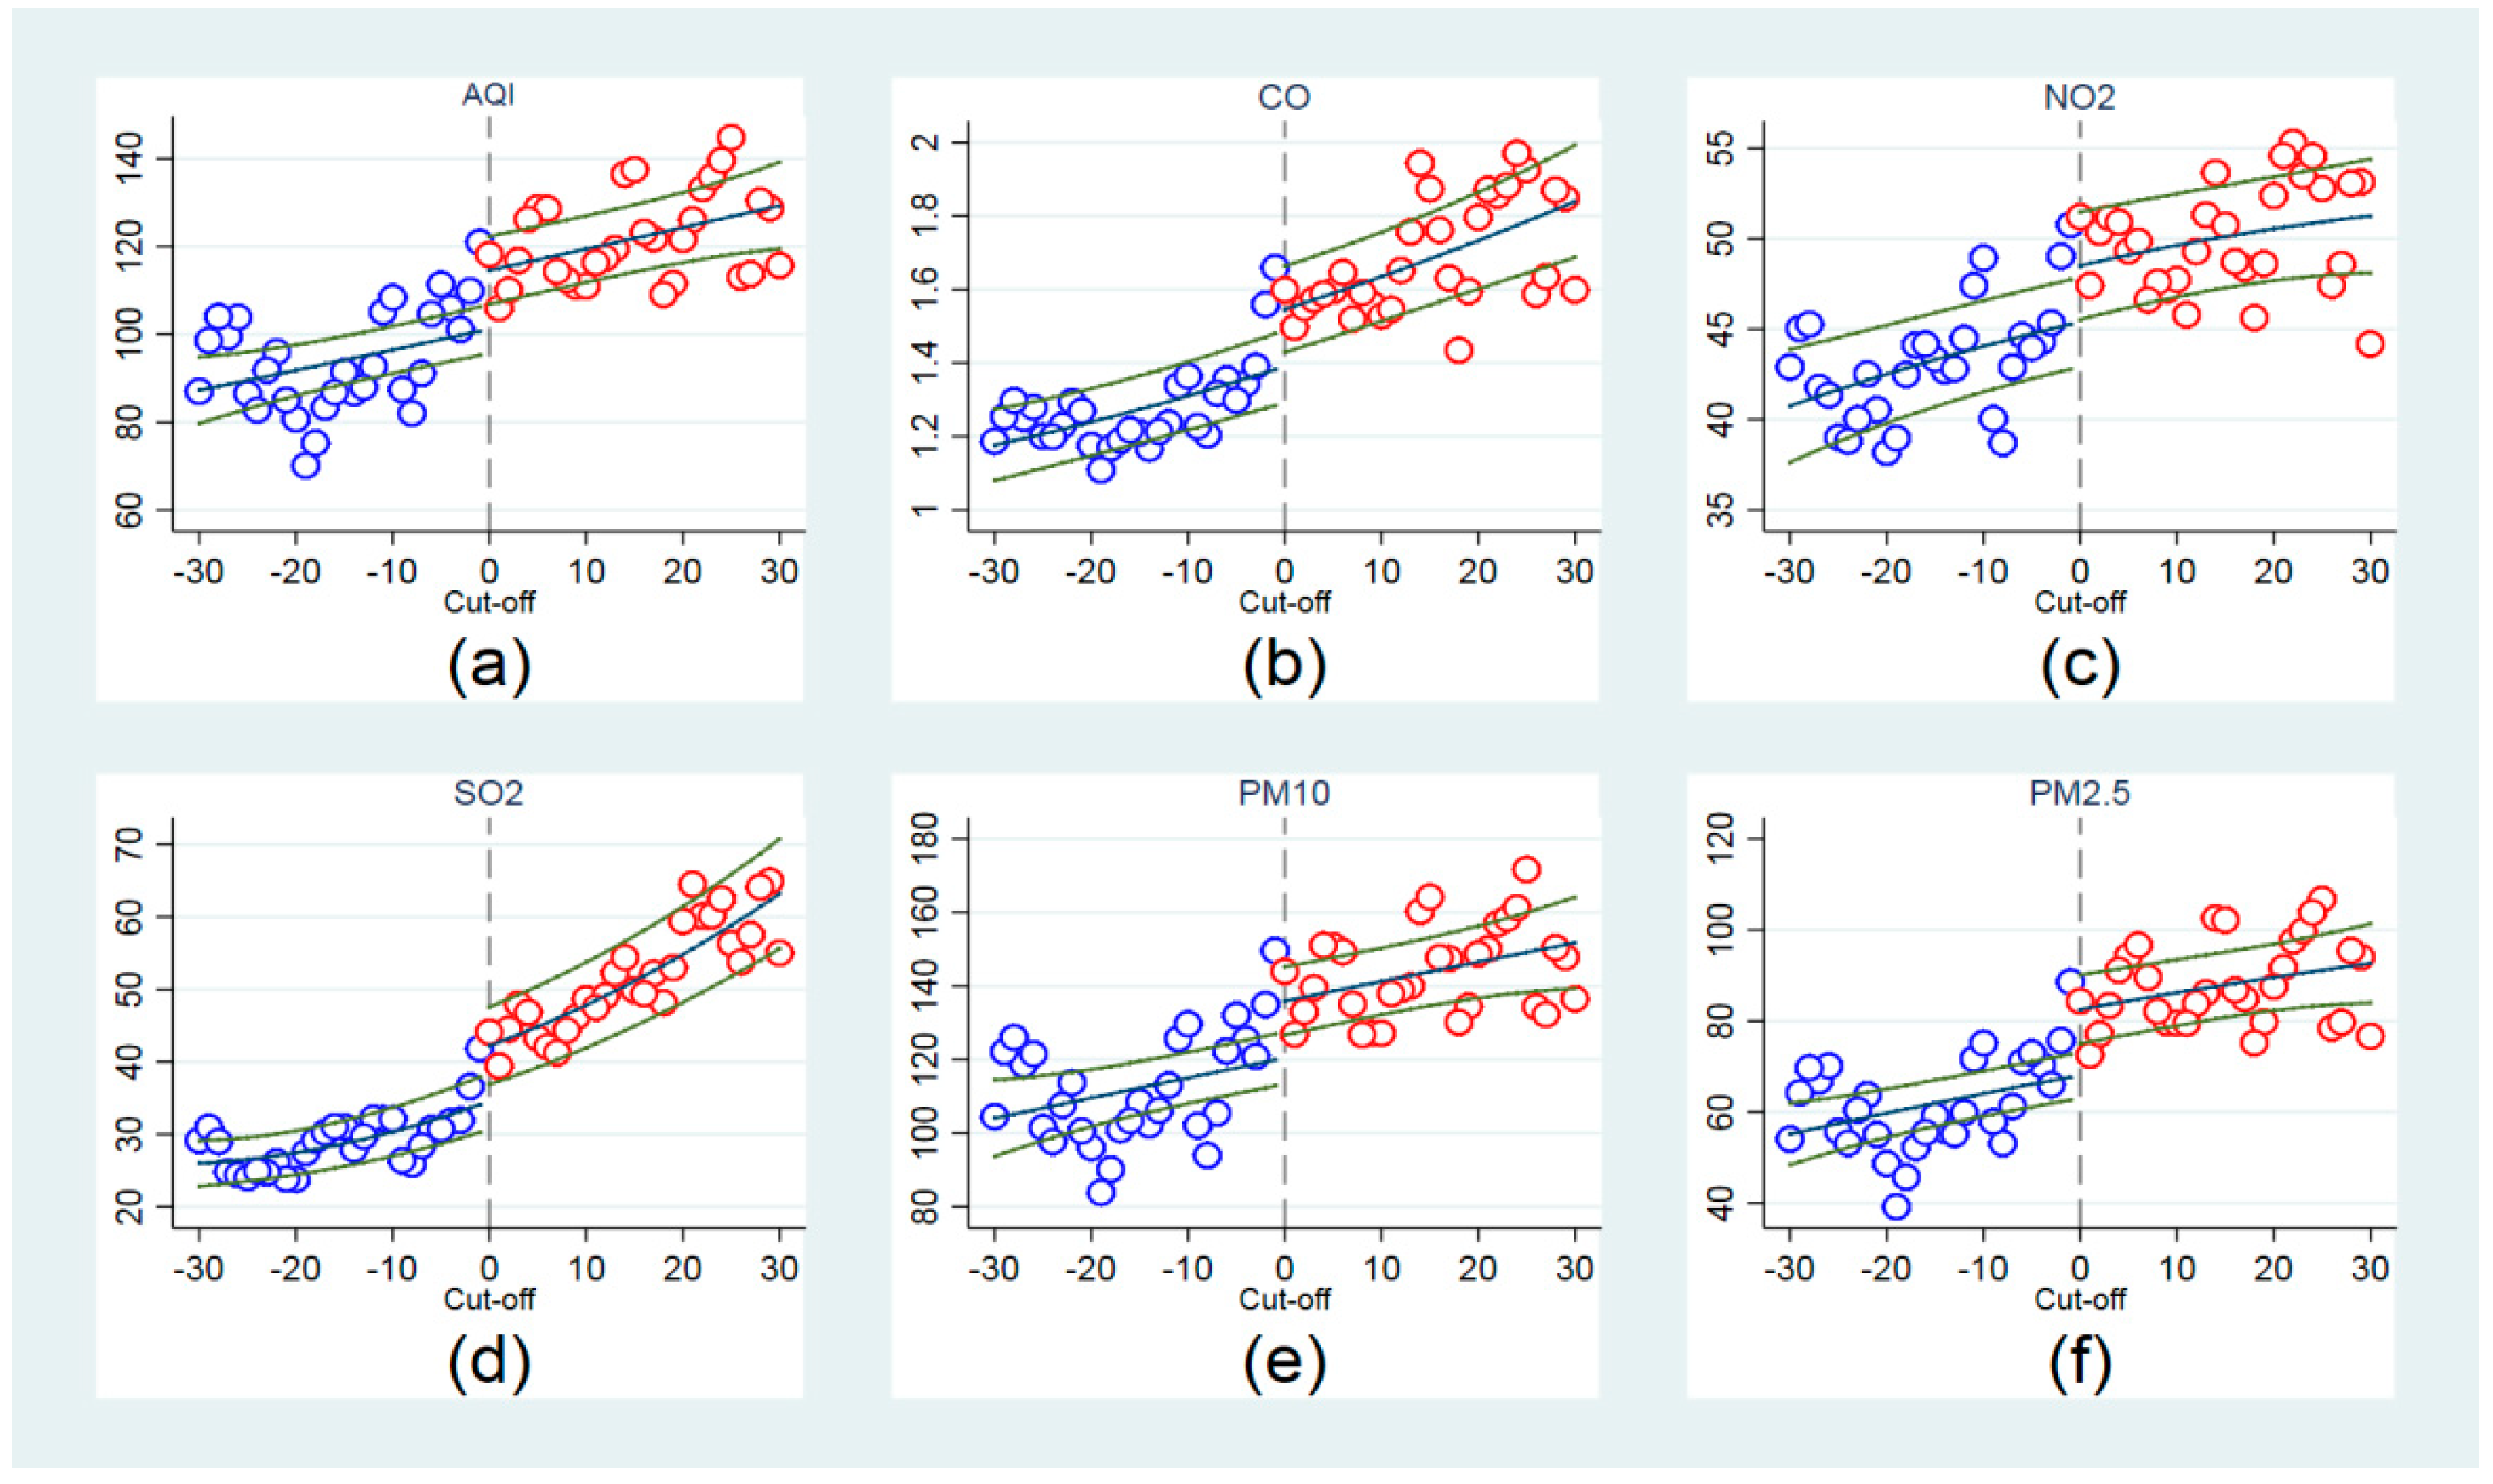
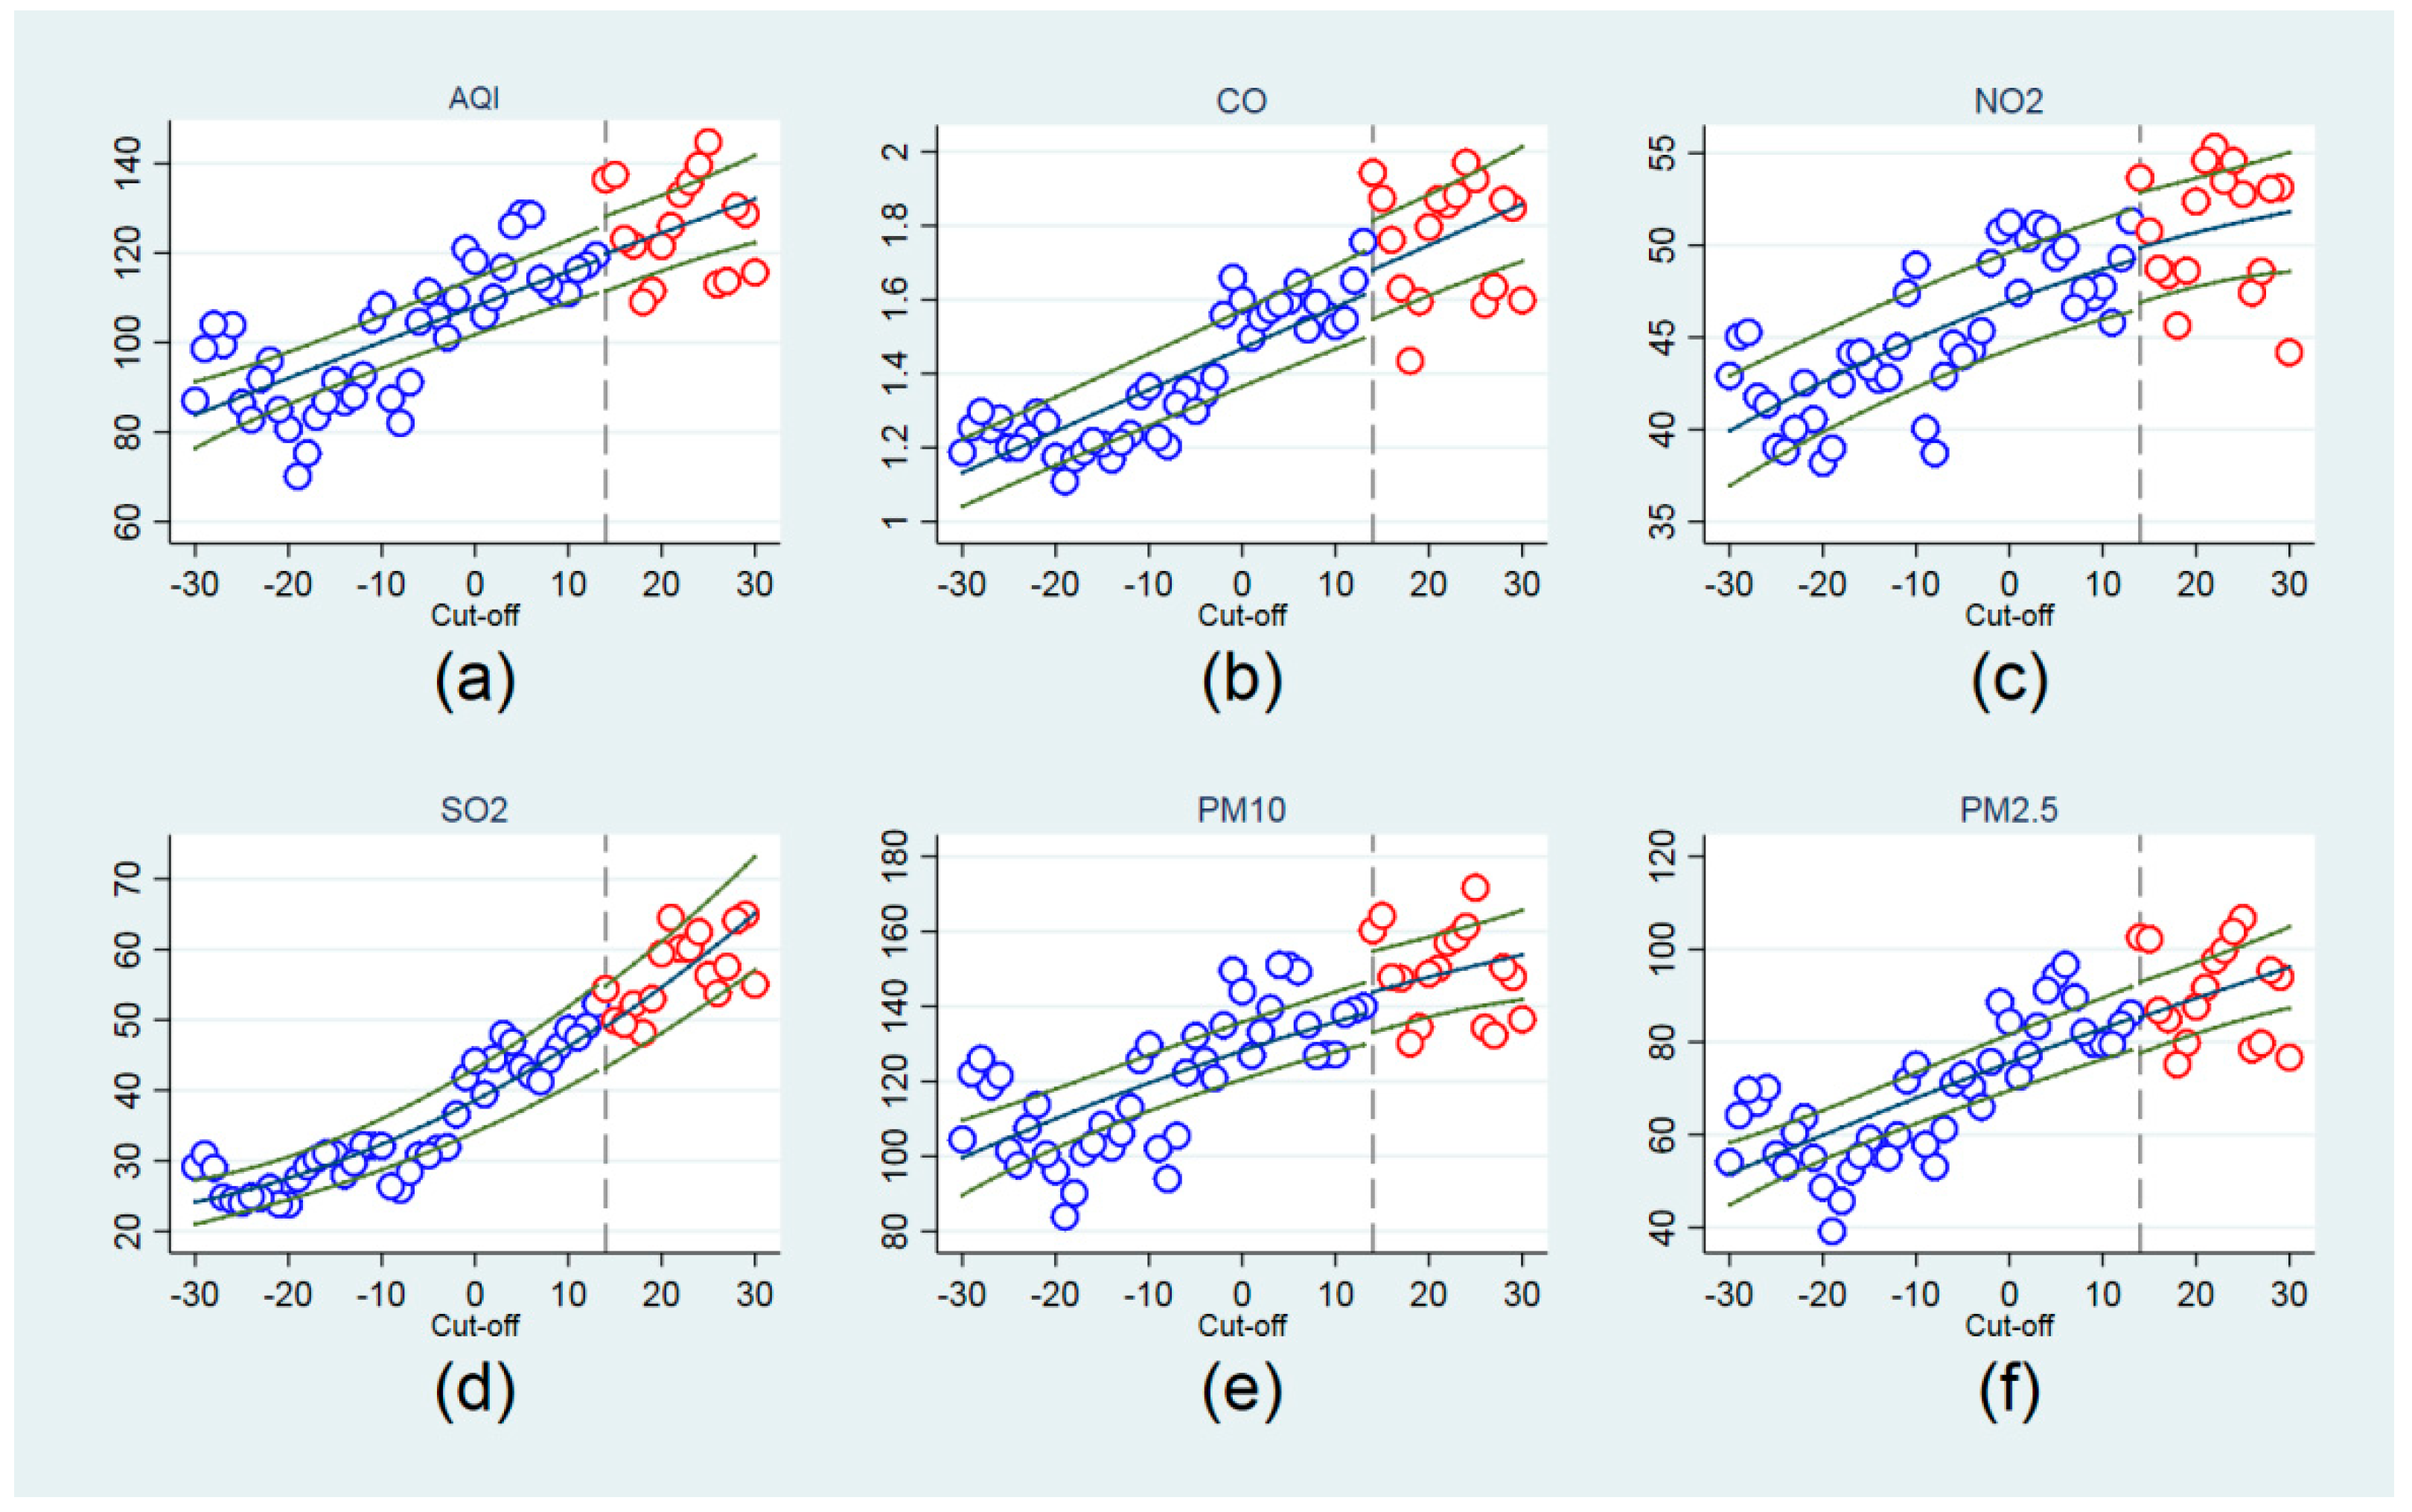
One necessary assumption of RD design is that relevant covariates change smoothly, while dependent variables exhibit discontinuous changes over the cut-off point. The results of the balance test on covariates and dependent variables are shown in Figure 2 and Figure 3, respectively. The plotted line reports the fitted values from a regression of weather covariates (Figure 2) or air pollution variates (Figure 3) on a linear polynomial with robust standard error (SE) clustered on cities.
From Figure 2, we found that the weather covariates, such as temperature, wind strength, wind direction, and weather type, change smoothly on the two sides of the starting date of winter heating. In Figure 3, we observe a distinct discontinuous change in the air pollution variates over the cut-off point. Thus, Figure 3 provides the evidence of the validity of the application of a RD design.
3.2. Regression Results
First, we estimate the impact of central heating on air pollution with ordinary least squares (OLS), and Table 3 reports the results. The independent variable is a dummy variable that is equal to one if the city has started winter heating on that day; otherwise, it is valued at 0. The control variables are identical, as listed in Table 2. The regression results suggest that winter heating deteriorates the air quality in the north.
Table 4 demonstrates the results from RD estimation equations. Comparing Table 3 and 4, we find that the estimated coefficients are generally larger from the OLS regression than from RD design. Subject to omitted variables bias, results from OLS may overestimate the impact of winter heating on the air quality.
Table 4 shows that the implementation of winter heating policy increases AQI, PM10, PM2.5, SO2, CO, and NO2 at a 1% significance level. Specifically, the winter heating policy leads to an increase of AQI by 10.4%, PM10 by 9.77%, PM2.5 by 17.25%, CO by 9.84%, NO2 by 5.23%, and SO2 by 17.1%. Note that these basic results still hold in models with control variables (covariates) and using different polynomials.
Our empirical findings indicate that winter heating worsens the air quality in the north, which is consistent with the existing research [35,36,37,38,39,45,46]. However, our estimated results are lower than those of other studies; for instance, Almond et al. [35] ascertained that the concentration of total suspended particulates (TSPs) increased by about 300 mg/m3 in the north of China with the sample data from 1991 to 1993. Chen et al. [36] used the data from 1981 to 2001 and found that the TSPs concentration increased by 184 μg/m3 in the winter heating season. Xiao et al. [45] used aerosol optical depth (AOD) to measure the concentration of PM2.5, and found that air pollution in the heating season in the north was five times higher than that in non-heating season. Using the data from 2003 to 2012, Ebenstein et al. [37] pointed out that winter heating made the concentration of PM10 increase 27–32 μg/m3, compared with the 12–15 mg/m3 in the north of China with the sample data from 1991 to 1993. Chen et al. [36] used the data from 1981 to 2001 and found that the TSPs concentration increased by 184 μg/m3 in the winter heating season. Xiao et al. [45] used aerosol optical depth (AOD) to measure the concentration of PM2.5, and found that air pollution in the heating season in the north was five times higher than that in non-heating season. Using the data from 2003 to 2012, Ebenstein et al. [37] pointed out that winter heating made the concentration of PM10 increase 27–32 μg/m3, compared with the 12–15 μg/m3 estimated by our study. Chen et al. [38] noted that winter heating aggravated haze pollution by 20% based on 39 cities in northern China during a period from 2013 to 2014. Li and Cao [39] found that the concentrations of PM10, PM2.5, CO, NO2, and SO2 rose by 14.73%, 26.79%, 20.85%, 30.45%, and 74.10% respectively in the heating season based on the data from 2013 to 2015. Liang et al. [46] illustrated that central heating led to an increase of the PM2.5 concentration in Beijing by about 50% from 2010 to 2015.
The lower estimated results could be attributed to the sample data and research design used in our study. First, compared with the previous works using year panel data, our study adopted the daily panel data. Subsequently, our study further controls the other determinants of haze pollution such as weather, temperature, wind direction, and so on, to better solve the omitted variable bias. In addition, compared with OLS, the RD design is more rigorous to identify the policy effect. Therefore, the RD design used in our study could estimate a more accurate result. Finally, ever since 2013, China has aggressively implemented a series of environmental protection measures such as fuel switching from coal to natural gas or electricity and a wide application of air pollution control equipment to tackle the air pollution caused by winter heating. Using the dataset from 2014–2016, our estimated results imply that the winter air quality has been gradually improved, and the current measures are effective to some extent.
3.3. Robustness Test
We additionally conduct three alternative approaches to cross-check the credibility of our findings. Specifically, they are a pseudo-heating time RD design, pseudo-location RD design, and placebo test. In our study, the pseudo-heating time refers to choosing a new date as a pretend heating start date and testing whether there is a discontinuity in the air pollution variates. The pseudo-location RD design means implementing an RD based on the sample from areas where there is no such winter heating. In the placebo test, we choose ozone as the placebo variate, since the combustion of coal has no effect on the ozone emission.
3.3.1. Pseudo-Heating Time RD Design
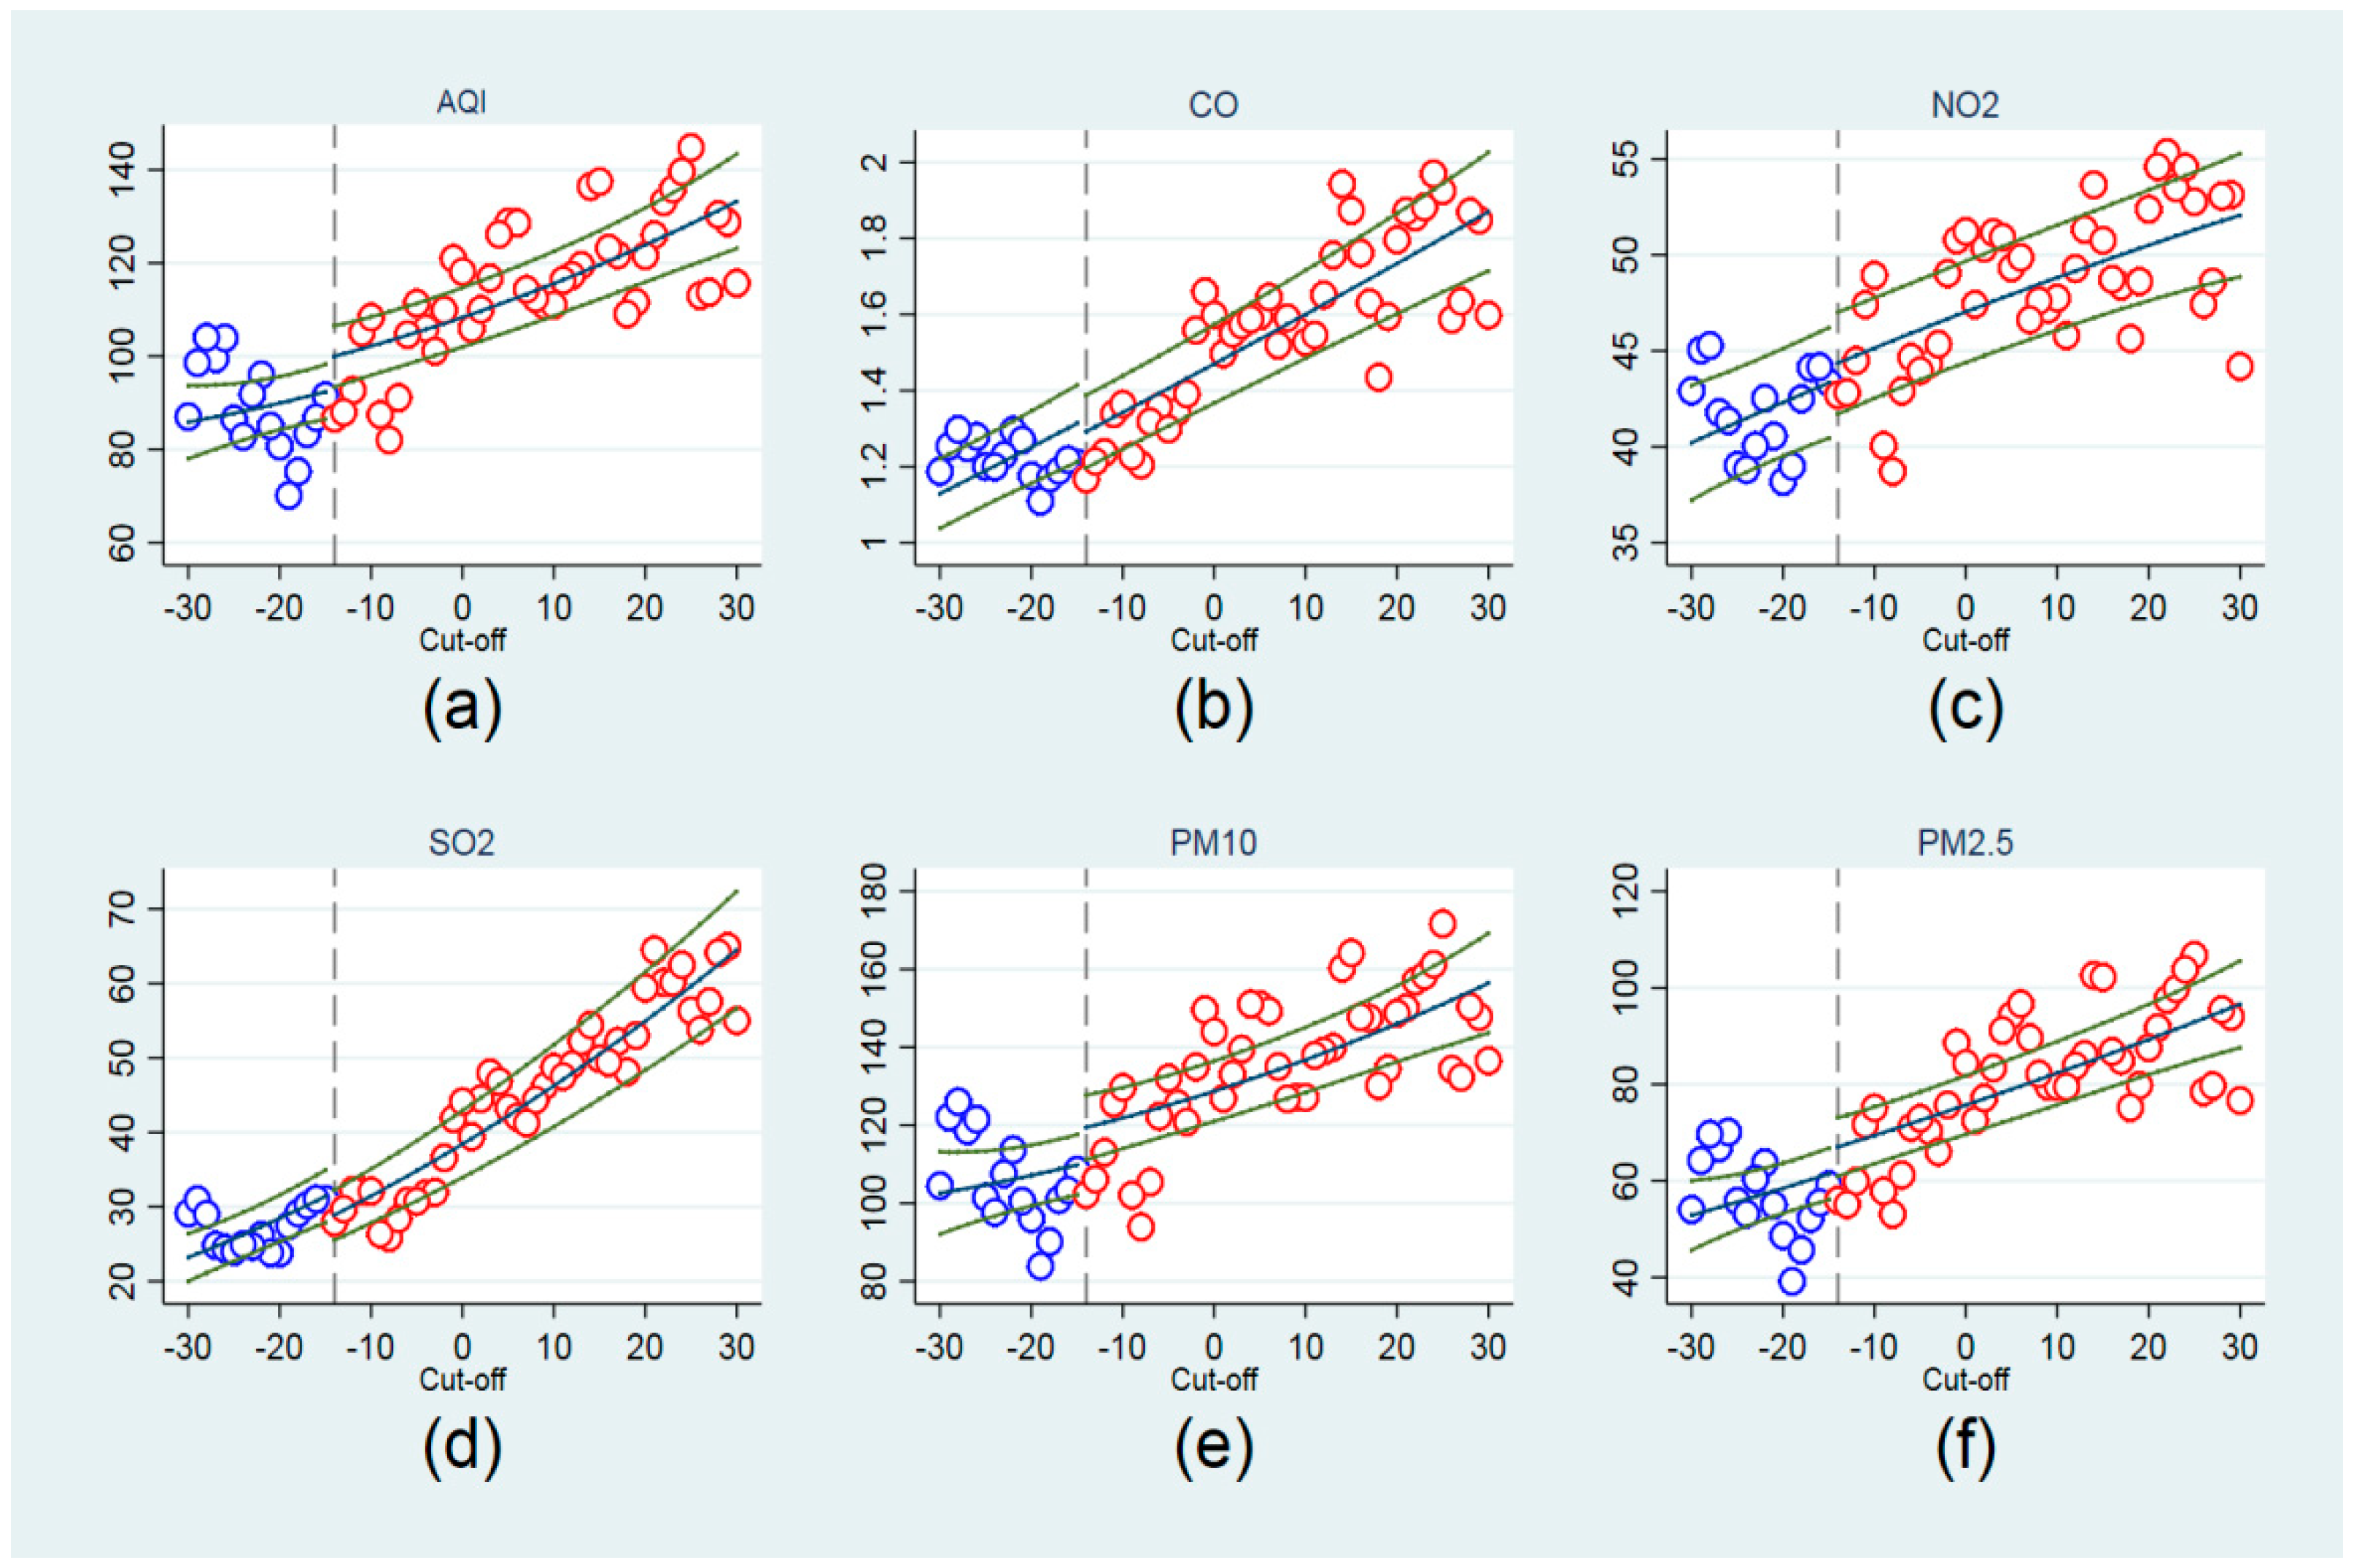
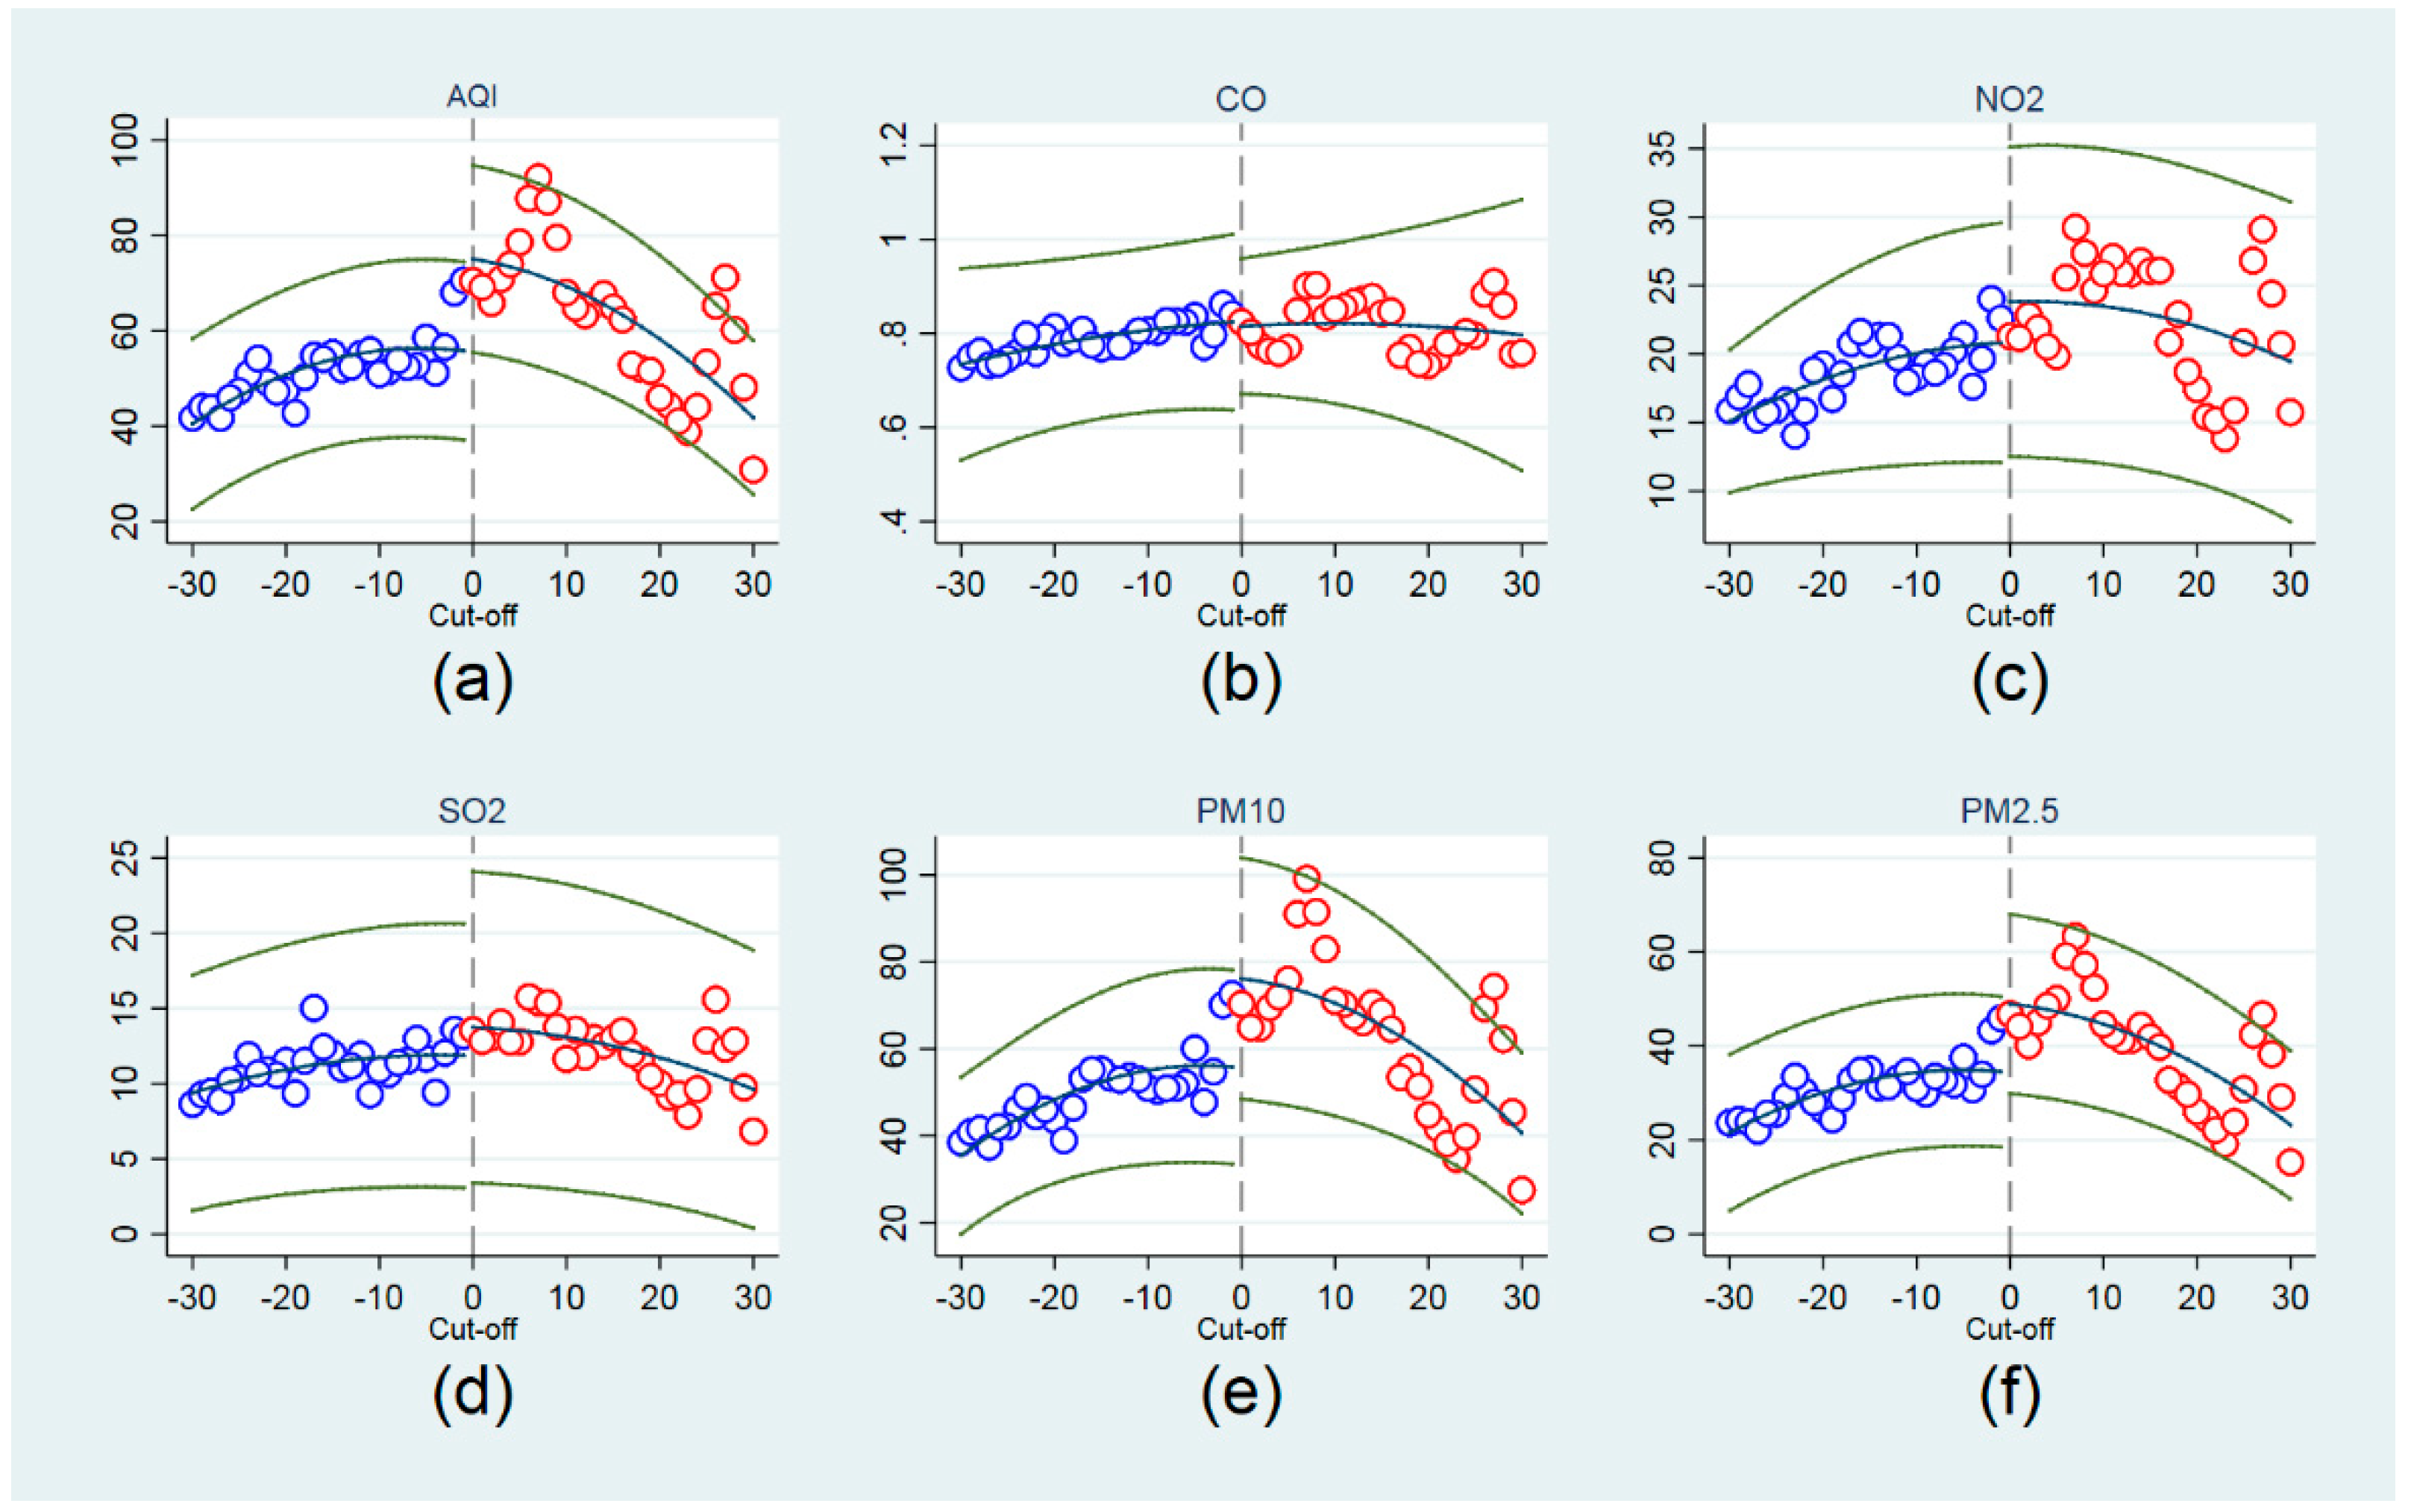
To explore the robustness of the basic results, we select a different date to replace the real start of heating as the new cut-off point. In this way, we conduct a pseudo-heating time RD design to examine whether the air pollution variates still demonstrate discontinuous changes. The new cut-off point could be either before or after the real start of winter heating. To be specific, our study selects two alternative cut-offs: 14 days ahead of and behind the real heating date. The results are illustrated in Figure 4 and Figure 5, using the same RD design as shown in Figure 3.
Figure 4 sets the cut-off as 14 days ahead of the real winter heating, and in Figure 5, the cut-off point is 14 days later behind the heating date. However, from neither Figure 4 nor Figure 5 can we verify a distinct discontinuity on the air pollution variates, as observed in Figure 3. Consequently, it supports our previous findings on the impact of the heating policy.
3.3.2. Pseudo-Location RD Design
The winter heating policy has only been implemented in the north of China. If the sample data were from cities in the south where there is no such policy, then when we continue to use the winter heating date as the cut-off point, we should not observe any “jump” in the air pollution variates, as shown in Figure 3. In the study, we choose the sample data from cities in two southern provinces (Guangxi and Hainan) to implement the same RD design. Compared with Figure 3, Figure 6 does not exhibit an obvious discontinuity on air pollution variates, and supports our previous finding that the winter heating policy makes the air condition worse in the north.
3.3.3. Placebo Test
The main components of coal are carbon, hydrogen, oxygen, nitrogen, sulfur, and so on. It does not contain substances of CFCs (chlorofluorocarbon). In general, coal burning will not affect the ozone emission. Therefore, in the placebo test, we use the same RDD estimation equation model and independent variables as shown in Table 3. The results are presented in Table 5. It proves that winter heating does not significantly influence the ozone emission and the results are qualitatively unchanged by adding controlling variables and using different polynomials. These findings contrast sharply with those in Table 3, hence further evidencing the credibility of our research conclusion.
4. Dynamic Changes of Air Pollution Caused by Winter Heating
Winter heating deteriorates the air pollution and is associated with a reduction in life expectancy [31,32]. Therefore, in recent years, the Chinese government has actively explored various measures to combat the winter air pollution problem. In 2011, China’s State Council established its Twelfth Five-Year Plan (2011–2015) for energy conservation and emission reduction gradually reducing coal consumption and speeding up the pace of energy transformation. In 2016, the State Council further issued the Thirteen Five-Year Plan (2016–2020), stressing that by 2020, China will cut its energy use per unit (10,000 CNY) of gross domestic product by 15% compared with that of 2015 (both using 2005 price levels), and rein in its energy consumption to within 5 billion tons of standard coal. The proportion of coal consumption will drop to 58% of the total primary energy consumption. The total emission of chemical oxygen demand, ammonia nitrogen, sulfur dioxide, and nitrogen oxide will be controlled within 20.01, 2.07, 15.8, and 15.74 million tons, respectively.
Regarding the particular measures taken, China released a series of environmental protection policies, such as the projects of fuel switching from coal to natural gas or electricity. Governments also strengthened the environmental inspection during winter heating, expedited the technical upgrading of highly polluting enterprises and a wide application of air pollution control equipment, and imposed restrictions on the production of polluting enterprises on the days with high levels of air pollution.
Are the above-mentioned policies effective in reducing the air pollution caused by winter heating? By answering this question, we can not only give some guidance for China’s future environmental governance, but also provide a reference to other coal-based energy-consuming developing countries. Meanwhile, as the largest developing country in the world, China produces 26% of the global carbon emissions, and effectively reducing China’s toxic air pollution can enormously contribute to the conservation of the global environment.
Follow the latest research [35], our study divides the total sample dataset into three sub-samples by the year, and uses the identical RD equation model as shown in column 3 of Table 4. The detailed results are presented in Table 6.
Based on the sub-sample results, we find that the air pollution caused by winter heating has been gradually lowered. For instance, the regression result from 2014 shows that winter heating positively influences the value of AQI at a 1% significance level. However, according to the regressions from 2015 and 2016, the coefficient becomes smaller by the year, and it is not statistically significant.
Next, winter heating is also positively related with PM10 at a 1% significance level based on the sample of 2014. The regression from 2015 shows that the relation between winter heating and PM10 is significant at the 10% level and the coefficient is 8.238 compared with 27.50 in 2014. The 2016 results show that the coefficient is getting even smaller without statistical significance. Similar findings are also in the dynamic results of PM2.5 and CO. Regarding NO2 and SO2, overall, the regression coefficients are smaller in 2016 compared with those in 2014, in spite of some fluctuations over the three years.
The above analysis demonstrates that air pollution caused by winter heating has gradually been lowered since a series of fuel-switch projects were carried out. Particularly, during the period from 2014 to 2016, major indicators measuring the air pollution decreased dramatically, such as AQI by 92.36%, PM10 by 91.24%, PM2.5 by 84.06%, CO by 70.97%, NO2 by 52.76%, and SO2 by 17.15%.
In addition, based on the previous research findings that a 10 μg/m3 increase in PM10 can reduce life expectancy by 0.64 years [32], our study also discovers that relevant environmental protection policies effectively alleviate the side effect of air pollution on people’s health condition and life expectancy reduction caused by inhaling PM10 drops from 1.76 (according to sample data of 2014) to 0.15 years (sample data of 2016).
5. Conclusions
Due to the acceleration of industrialization and urbanization in recent years, air quality continues to deteriorate in China, resulting in increased threats to human health and sustainable economic development. Since 2013, several large-scale and long-duration haze incidents have taken place in China, and the whole society is now more concerned about air pollution problems, especially PM2.5. A sustainable ecological environment is of significant importance to people’s livelihood. As the largest developing country in the world, China produces 26% of the global carbon emissions. Winter heating is considered as one of the major causes of winter air pollution in northern China. Using daily air pollution data from 2014 to 2016 collected via web scraping with Python, the study exploits the RD design based on the winter heating date and proves that winter heating makes the air quality worse in the north. According to the regression results from different pollution indicators chosen, the air quality has deteriorated by about 5% to 20%. Meanwhile, the study also finds that air pollution caused by winter heating has gradually been lowered by about 20% to 90% over the three years as a series of environmental policies have been carried out, such as heating renovation, fuel-switch projects, winter environmental inspection, and so on.
Similar to any other study, our study has some limitations. First, it does not discuss the formation of haze, which is a complex process. Our study aims to assess the impact of the winter heating policy on the air quality changes from an econometric perspective, and hereby a RD design is used to identify such a policy effect. Second, it does not distinguish the emission sources of coal and gas-fired heating. Indeed, ever since the implementation of the winter heating system, almost all the cities in the north have set up the coal-fired boilers. The Action Plan of air pollution prevention and control released in October 2013 demanded an increasing control of small coal-fired boilers and pushes fuel switching, including “coal to gas” and “coal to electricity”. We can examine the efficiency of these measures taken to tackle the air pollution issue from the dynamic changes of air quality by the year.
A new Air Pollution Action Plan was released in 2018 by the State Council, announcing to reduce emissions of sulfur dioxide (SO2) and nitrogen oxide by at least 15% and the urban concentration of PM2.5 by at least 18% for the cities not meeting PM2.5 standards, and decrease the highly polluted days by at least 25% by 2020 compared with 2015. Combining the atmospheric models to identify specific emission sources during winter heating and testing the efficiency of various measures used to control air pollution and improve air quality are the two areas that will be developed in our future research.
From our findings, we have a few recommendations for the policymakers as well. First, since coal burning is the major cause of air pollution, governments need to further boost the use of “clean energy” and provide the subsidies for relevant projects, such as using high-quality coal or natural gas, promoting the implementation of fuel-switch from coal to natural gas or electricity. Second, governments should also consider improving the heating efficiency by removing or rebuilding the primitive boilers, constructing central heating facilities, improving the efficiency of heating pipelines, and so on to reduce pollutant emissions. Third, local governments can also issue staggering peak production policies during the heating period to reduce the air pollution emissions. However, this study researches the coal-powered heating policy of China; it provides some guidance regarding environmental governance for other countries, especially where heavy air pollution is produced by their coal burning.
Author Contributions
Conceptualization, S.W.; Methodology, Y.L and M.H..; Software and data, Y.L; Empirical analysis, S.W. and Y.L. All the authors wrote, reviewed and commented on the manuscript. All authors read and approved the final manuscript.
Funding
This research was funded by the Research Project of Liaoning University [Grant No. LDQN2018007] and the Project of Constructing World First- Class discipline of Applied Economics.
Acknowledgments
We would like to thank Qi Cui, Beijing Normal University for his advice on this paper and Ziyu Ma, Liaoning University for her excellent research assistant work. We like to express our sincere thanks and gratitude to three anonymous reviewers whose insightful comments and valuable suggestions greatly helped to improve this manuscript during the review process. We also take the opportunity to thank the Editor of the journal for giving us the opportunity to revise and resubmit. Any errors or omissions are our own.
Conflicts of Interest
The authors declare no conflict of interest.
References
- Zheng, S.; Wang, J.; Sun, C.; Zhang, X.; Kahn, M.E. Air pollution lowers Chinese urbanites’ expressed happiness on social media. Nat. Hum. Behav. 2019, 3, 237–243. [Google Scholar] [CrossRef] [PubMed]
- Brunekreef, B.; Holgate, S.T. Air pollution and health. Lancet 2002, 360, 1233–1242. [Google Scholar] [CrossRef]
- Alvarez-Pedrerol, M.; Rivas, I.; López-Vicente, M.; Suades-González, E.; Donaire-Gonzalez, D.; Cirach, M.; de Castro, M.; Esnaola, M.; Basagaña, X.; Dadvand, P.; et al. Impact of coming exposure to traffic-related air pollution on cognitive development in children walking to school. Environ. Pollut. 2017, 231, 837–844. [Google Scholar] [CrossRef] [PubMed]
- Liu, W.; Xu, Z.; Yang, T. Health Effects of Air Pollution in China. Int. J. Environ. Res. Public Health 2018, 15, 1471. [Google Scholar] [CrossRef]
- Cesur, R.; Tekin, E.; Ulker, A. Air pollution and infant mortality: Evidence from the expansion of natural gas infrastructure. Econ. J. 2017, 127, 330–362. [Google Scholar] [CrossRef]
- Schiavon, M.; Redivo, M.; Antonacci, G.; Rada, E.C.; Ragazzi, M.; Zardi, D.; Giovannini, L. Assessing the air quality impact of nitrogen oxides and benzene from road traffic and domestic heating and the associated cancer risk in an urban area of Verona (Italy). Atmos. Environ. 2015, 120, 234–243. [Google Scholar] [CrossRef]
- Guo, Z.; Xie, H.; Zhang, P.; Luo, Y.; Xu, T.; Liu, Y.; Fu, H.; Xu, L.; Valsami-Jones, E.; Boksa, P.; et al. Dioxins as potential risk factors for autism spectrum disorder. Environ. Int. 2018, 121, 906–915. [Google Scholar] [CrossRef] [PubMed]
- Anenberg, S.C.; Henze, D.K.; Tinney, V.; Kinney, P.L.; Raich, W.; Fann, N.; Malley, C.S.; Roman, H.; Lamsal, L.; Duncan, B.; et al. Estimates of the Global Burden of Ambient PM2.5, Ozone, and NO2 on Asthma Incidence and Emergency Room Visits. Environ. Health Perspect. 2018, 126, 107004. [Google Scholar] [CrossRef]
- Li, C.; Li, H. Effects of air pollution on business inventory: An empirical analysis based on China manufacturing business data. Manag. World 2017, 8, 95–105. [Google Scholar]
- Aragon, F.M.; Rud, J.P. Polluting industries and agricultural productivity: Evidence from mining in Ghana. Econ. J. 2015, 126, 1980–2011. [Google Scholar] [CrossRef]
- Locosselli, G.M.; Camargo, E.P.D.; Moreira, T.C.L.; Todesco, E.; Andraded, M.D.F.; Andre, C.D.S.D.; Andre, P.A.D.; Singer, J.M.; Ferreira, L.S.; Saldiva, P.H.N.; et al. The role of air pollution and climate on the growth of urban trees. Sci. Total Environ. 2019, 666, 652–661. [Google Scholar] [CrossRef] [PubMed]
- Zivin, J.G.; Neidell, M. Environment, health, and human capital. J. Econ. Lit. 2013, 51, 689–730. [Google Scholar] [CrossRef]
- Hussain, M.E.; Haque, M. Is there any link between economic growth and earth’s environment? Evidence from 127 countries for the period 2007–2015. J. Environ. Econ. Policy 2018, 8, 193–208. [Google Scholar] [CrossRef]
- Zhan, D.; Kwan, M.P.; Zhang, W.; Wang, S.; Yu, J. Spatiotemporal Variations and Driving Factors of Air Pollution in China. Int. J. Environ. Res. Public Health 2017, 14, 1538. [Google Scholar] [CrossRef] [PubMed]
- Teng, B.; Zhang, X.; Yi, C.; Zhang, Y.; Ye, S.; Wang, Y.; Tong, D.Q.; Lu, B. The Association between Ambient Air Pollution and Allergic Rhinitis: Further Epidemiological Evidence from Changchun, Northeastern China. Int. J. Environ. Res. Public Health 2017, 14, 226. [Google Scholar] [CrossRef]
- Li, D.; Zhao, Y.; Wu, R.; Dong, J. Spatiotemporal Features and Socioeconomic Drivers of PM2.5 Concentrations in China. Sustainability 2019, 11, 1201. [Google Scholar] [CrossRef]
- Doherty, R.M.; Heal, M.R.; O’Connor, F.M. Climate change impacts on human health over Europe through its effect on air quality. Environ. Health A Glob. Access Sci. Source 2017, 16, 118. [Google Scholar] [CrossRef] [PubMed] [Green Version]
- Tang, D.; Zhang, Y.; Bethel, B.J. An Analysis of Disparities and Driving Factors of Carbon Emissions in the Yangtze River Economic Belt. Sustainability 2019, 11, 2362. [Google Scholar] [CrossRef]
- Gualtieri, G.; Toscano, P.; Crisci, A.; Di Lonardo, S.; Tartaglia, M.; Vagnoli, C.; Zaldei, A.; Gioli, B. Influence of road traffic, residential heating and meteorological conditions on PM10 concentrations during air pollution critical episodes. Environ. Sci. Pollut. Res. 2015, 22, 19027–19038. [Google Scholar] [CrossRef]
- Chirakijja, J.; Jayachandran, S.; Ong, P. Inexpensive Heating Reduces Winter Mortality; NBER Working Paper No. 25681; National Bureau of Economic Research (NBER), 1050 Massachusetts Avenue: Cambridge, MA, USA, 2019. [Google Scholar]
- Torretta, V.; Raboni, M.; Copelli, S.; Rada, E.C.; Ragazzi, M.; Ionescu, G.; Apostol, T.; Badea, A. Application of strategies for particulate matter reduction in urban areas: An Italian case. UPB Sci. Bull. Ser. D Mech. Eng. 2013, 75, 221–228. [Google Scholar]
- Liu, L.; Yang, H.; Duan, R.; Liu, M.; Zhang, R.; Ding, Y.; Sun, H. Effect of Non-Coal Heating and Traditional Heating on Indoor Environment of Rural Houses in Tianjin. Int. J. Environ. Res. Public Health 2019, 16, 77. [Google Scholar] [CrossRef] [PubMed]
- Cioca, L.I.; Giurea, R.; Moise, I.A.; Precazzini, I.; Ragazzi, M.; Rada, E.C. Local Environmental Impact of Wood Combustion in Agro-Tourism Structures. In Proceedings of the 8th International Conference on Energy and Environment, Bucharest, Romania, 19–20 October 2017. [Google Scholar]
- Rada, E.C.; Ragazzi, M.; Malloci, E. Role of levoglucosan as a tracer of wood combustion in an alpine region. Environ. Technol. 2012, 33, 989–994. [Google Scholar] [CrossRef]
- Young, J.D.; Anderson, N.M.; Naughton, H.T. Influence of Policy, Air Quality, and Local Attitudes toward Renewable Energy on the Adoption of Woody Biomass Heating Systems. Energies 2018, 11, 2873. [Google Scholar] [CrossRef]
- Ma, B.; Zhang, L.; Zheng, X. Income level, pollution density and environmental demand in China. J. World Econ. 2017, 40, 95–105. [Google Scholar]
- Zheng, S.; Wan, G.; Sun, W.; Luo, D. Public appeals and urban environmental governance. Manag. World 2013, 6, 72–84. [Google Scholar]
- Englert, N. Fine particles and human health—A review of epidemiology studies. Toxicol. Lett. 2004, 149, 235–242. [Google Scholar] [CrossRef] [PubMed]
- Pope, C.A.; Dockery, D.W. Health effects of fine particulate air pollution: Lines that connect. J. Air Waste Manag. Assoc. 2006, 56, 709–742. [Google Scholar] [CrossRef] [PubMed]
- Dominici, F.; Greenstone, M.; Sunstein, C.R. Particulate matter matters. Science 2014, 344, 257–259. [Google Scholar] [CrossRef]
- Chen, Y.; Chen, L. Price of clean air: An empirical evidence from Qingdao, China. J. World Econ. 2012, 4, 140–160. [Google Scholar]
- Liu, R.; Yu, C.; Liu, C.; Jiang, J.; Xu, J. Impacts of Haze on Housing Prices: An Empirical Analysis Based on Data from Chengdu (China). Int. J. Environ. Res. Public Health 2018, 15, 1161. [Google Scholar] [CrossRef]
- Li, X.; Qiao, Y.; Shi, L. Has China’s war on pollution slowed the growth of its manufacturing and by how much? Evidence from the Clean Air Action. China Econ. Rev. 2019, 53, 271–289. [Google Scholar] [CrossRef]
- Liu, H.; Alberto, S. Severe air pollution and child absences when schools and parents respond. J. Environ. Econ. Manag. 2018, 92, 300–330. [Google Scholar] [CrossRef]
- Almond, D.; Chen, Y.; Greenstone, M.; Li, H. Winter heating or clean air? unintended impacts of China’s Huai River policy. Am. Econ. Rev. 2009, 99, 184–190. [Google Scholar] [CrossRef]
- Chen, Y.; Ebenstein, A.; Greenstone, M.; Li, H. Evidence on the impact of sustained exposure to air pollution on life expectancy from China’s Huai River policy. Proc. Natl. Acad. Sci. USA 2013, 110, 12936–12941. [Google Scholar] [CrossRef] [Green Version]
- Ebenstein, A.; Fan, M.; Greenstone, M.; He, G.; Zhou, M. New evidence on the impact of sustained exposure to air pollution on life expectancy from China’s Huai River policy. Proc. Natl. Acad. Sci. USA 2017, 114, 10384–10389. [Google Scholar] [CrossRef]
- Chen, Q.; Sun, F.; Xu, Y. Does winter heating cause smog? Evidence from a city panel in north China. Nankai Econ. Stud. 2017, 4, 25–40. [Google Scholar]
- Li, J.; Cao, J. Empirical analysis of the effect of central heating on air pollution in China. China J. Econ. 2017, 4, 138–150. [Google Scholar]
- Campante, F.; Yanagizawa-Drott, D. Long-range Growth: Evidence development in the global network of air links. Q. J. Econ. 2008, 133, 1395–1458. [Google Scholar] [CrossRef]
- Imbens, G.; Angrist, J. Identification and Estimation of Local Average Treatment Effects. Econometrica 1994, 62, 467–475. [Google Scholar] [CrossRef]
- Hahn, J.; Todd, P.; Van der Klaauw, W. Identification and Estimation of Treatment Effects with a Regression Discontinuity Design. Econometrica 2001, 69, 201–209. [Google Scholar] [CrossRef]
- Imbens, G.; Lemieux, T. Regression Discontinuity Designs: A Guide to Practice. J. Econom. 2008, 142, 615–635. [Google Scholar] [CrossRef]
- Gelman, A.; Imbens, G. Why High-Order Polynomials Should Not Be Used in Regression Discontinuity Designs. J. Bus. Econ. Stat. 2018. [Google Scholar] [CrossRef]
- Xiao, Q.; Ma, Z.; Li, S.; Liu, Y. The impact of winter heating on air pollution in China. PLoS ONE 2015, 10, e0117311. [Google Scholar] [CrossRef] [PubMed]
- Liang, X.; Zou, T.; Guo, B.; Li, S.; Zhang, H.; Zhang, S.; Huang, H.; Chen, S. Assessing Beijing’s PM2.5 Pollution: Severity, Weather Impact, APEC and Winter Heating. Proc. R. Soc. A Math. Phys. Eng. Sci. 2015, 471, 20150257. [Google Scholar] [CrossRef]
Figure 1.
The quantity of raw coal used for urban heating from 2008 to 2016. Data Sources: China Electricity Council (measurement units: Millions of tons).
Figure 1.
The quantity of raw coal used for urban heating from 2008 to 2016. Data Sources: China Electricity Council (measurement units: Millions of tons).

Figure 2.
The changes of weather covariates over cut-off. (a) Temperature changes; (b) Wind Strength changes; (c) Wind Direction changes; (d) Weather Type changes. Point 0 on the horizontal axis is the cut-off point, representing the starting date of winter heating. The left and right to point 0 refer to the days before/after heating starts. The vertical axis represents the indicator values of weather covariates (temperature, wind strength, wind direction, and weather type). Red and blue circles are the mean values of the relevant weather covariates on two sides of the cut-off point. The middle blue line is the fitting line. The upper and lower green lines show the 95% CI.

Figure 3.
The changes of air pollution variates over cut-off. (a) Air Quality Index (AQI) changes; (b) CO changes; (c) NO2 changes; (d) SO2 changes; (e) PM10 changes; and (f) PM2.5 changes. Point 0 on the horizontal axis is the cut-off point, representing the starting date of winter heating. The left and right to point 0 refer to the days before/after the start of heating. The vertical axis represents the indicator values of the air pollution variates. The red and blue circles are the mean values of the relevant variates on two sides of the cut-off point. The middle blue line is the fitting line. The upper and lower green lines show the 95% CI. PM10: Particulate matter smaller than 10 μm; PM2.5: particulate matter smaller than 2.5 μm.

Figure 4.
The changes of air pollution variates over the pseudo cut-off (14 days ahead of the heating time). The vertical dotted line is the constructed pseudo-heating time cut-off, which is two weeks (14 days) earlier than the real heating date. Point 0 on the horizontal axis represents the real winter heating date. The vertical axis represents the indicator values of air pollution variates (AQI, PM10, PM2.5, SO2, CO, and NO2). Red and blue circles are the mean values of the relevant variates on two sides of the pseudo-heating time. The middle blue line is the fitting line. The upper and lower green lines show the 95% CI.

Figure 5.
The changes of air pollution variates over the pseudo cut-off (14 days behind the heating time). The vertical dotted line is the constructed pseudo-heating time cut-off, which is two weeks (14 days) later than the real heating date. Point 0 on the horizontal axis represents the real winter heating date. The vertical axis represents the indicator values of air pollution variates (AQI, PM10, PM2.5, SO2, CO, and NO2). Red and blue circles are the mean values of the relevant variates on two sides of the pseudo-heating time. The middle blue line is the fitting line. The upper and lower green lines show the 95% CI.

Figure 6.
Changes of air pollution variates over cut-off in Guangxi and Hainan. Sample data are from cities of the Guangxi Zhuang Autonomous Region and Hainan Province. The cut-off point is the nationwide earliest winter heating date of that year among all the northern cities (Karamay City). Point 0 on the horizontal axis represents the cut-off point. The left and right to point 0 refer to the days before/after the earliest start of heating. The vertical axis represents the indicator values of air pollution variates (AQI, PM10, PM2.5, SO2, CO, and NO2). Red and blue circles are the mean values of the relevant variates on the two sides of the cut-off point. The middle blue line is the fitting line. The upper and lower green lines show the 95% CI.


Table 1.
Maximum allowable concentration of pollutants in atmosphere.
| No. | Pollutants | Average Time | Concentration Limits | Measurement Unit | |
|---|---|---|---|---|---|
| Level 1 | Level 2 | ||||
| 1 | PM10 | Annual mean | 40 | 70 | μg/m3 |
| 24-hour average | 50 | 150 | |||
| 2 | PM2.5 | Annual mean | 15 | 35 | |
| 24-hour average | 35 | 75 | |||
| 3 | SO2 | Annual mean | 20 | 60 | |
| 24-hour average | 50 | 150 | |||
| 1-hour average | 150 | 500 | |||
| 4 | NO2 | Annual mean | 40 | 40 | |
| 24-hour average | 80 | 80 | |||
| 1-hour average | 200 | 200 | |||
| 5 | CO | 24-hour average | 4 | 4 | mg/m3 |
| 1-hour average | 10 | 10 | |||
Data source: Ambient air quality standards (GB 3095-2012 Revision). Level 1 standard is applicable to the special areas such as nature reserves and scenic sites. Level 2 is applicable to residential, cultural, commercial, industrial, and rural areas.
Table 2.
Descriptive statistics for variables.
| Symbols | Description | Observation N | Mean | SD | Min | Max | |
|---|---|---|---|---|---|---|---|
| Dependent Variables | AQI | Air Quality Index | 13,908 | 108.2 | 66.71 | 16.87 | 500 |
| PM10 | Particulate matter smaller than 10 μm | 13,907 | 128.2 | 84.33 | 10 | 980.5 | |
| PM2.5 | Particulate matter smaller than 2.5 μm | 13,908 | 74.94 | 61.28 | 3.450 | 881.8 | |
| CO | Carbon monoxide | 13,908 | 1.484 | 0.857 | 0.125 | 12.62 | |
| NO2 | Nitrogen dioxide | 13,908 | 46.65 | 21.04 | 3.409 | 196.9 | |
| SO2 | Sulfur dioxide | 13,908 | 40.59 | 36.13 | 2 | 579.8 | |
| O3 | Ozone | 13,908 | 35.96 | 20.96 | 1.292 | 178.8 | |
| Covariates | Temp | Temperature | 13,904 | 7.717 | 6.154 | −14 | 26 |
| Wstr | Wind strength | 13,904 | 3.061 | 1.330 | 0 | 8 | |
| Wdir | Wind direction | 13,904 | 0.974 | 0.158 | 0 | 1 | |
| Wtyp | Weather type | 13,625 | 1.434 | 0.704 | 0 | 3 |
Note: The above statistics are based on daily data. Our study strictly limits the sample time length to 30 days before/after the heating starts. Wind strength, wind direction, and weather are all dummy variables. Air Quality Index is a dimensionless index, which describes air condition quantitatively. The measurement unit of PM10, PM2.5, SO2, NO2 and O3 is . The unit of CO is . Wind strength, wind direction, and weather type are dummy variables. Wind strength values are from 0 to 8 according to the reported wind strength of that day, where 0 means breeze, 1 means wind strength level 1, and so forth. The wind direction equals 1 if there is a reported wind direction; otherwise, it is 0. Weather type will be coded as 0 when it is rain or snow, 1 when it is a sunny day, 2 when it is a cloudy day, or 3 when it is foggy.
Table 3.
The effects of winter heating policy on air pollution (OLS: ordinary least squares).
| (1) | (2) | (3) | (4) | (5) | (6) | |
|---|---|---|---|---|---|---|
| VARIABLES | AQI | PM10 | PM2.5 | CO | NO2 | SO2 |
| D | 48.28 *** | 62.05 *** | 42.95 *** | 0.567 *** | 14.02 *** | 23.95 *** |
| (3.493) | (4.219) | (3.186) | (0.0464) | (0.968) | (2.795) | |
| Observations | 13,625 | 13,624 | 13,625 | 13,625 | 13,625 | 13,625 |
| R-squared | 0.105 | 0.111 | 0.098 | 0.089 | 0.096 | 0.113 |
| Control variables | YES | YES | YES | YES | YES | YES |
| Clusters | 76 | 76 | 76 | 76 | 76 | 76 |
Notes: *, **, and *** indicate significance at 10%, 5%, and 1%.
Table 4.
The regression discontinuity design (RDD) analysis of winter heating policy.
| (1) | (2) | (3) | (4) | (5) | (6) | (7) | (8) | (9) | |
| AQI | AQI | AQI | PM10 | PM10 | PM10 | PM2.5 | PM2.5 | PM2.5 | |
| Winter heating policy | 13.33 *** | 13.35 *** | 11.25 *** | 15.52 *** | 15.51 *** | 12.53 *** | 14.58 *** | 14.51 *** | 12.93 *** |
| (2.426) | (2.386) | (2.472) | (3.203) | (3.177) | (3.211) | (2.305) | (2.253) | (2.356) | |
| Observation number | 13,908 | 13,908 | 13,625 | 13,907 | 13,907 | 13,624 | 13,908 | 13,908 | 13,625 |
| R square | 0.048 | 0.048 | 0.330 | 0.039 | 0.039 | 0.341 | 0.049 | 0.049 | 0.320 |
| Polynomial | 1 | 2 | 2 | 1 | 2 | 2 | 1 | 2 | 2 |
| Cluster on cities | 76 | 76 | 76 | 76 | 76 | 76 | 76 | 76 | 76 |
| Control variables | Yes | Yes | Yes | ||||||
| Fixed effects | Yes | Yes | Yes | ||||||
| (1) | (2) | (3) | (4) | (5) | (6) | (7) | (8) | (9) | |
| CO | CO | CO | NO2 | NO2 | NO2 | SO2 | SO2 | SO2 | |
| Winter heating policy | 0.153 *** | 0.155 *** | 0.146 *** | 3.162 *** | 3.119 *** | 2.441 *** | 7.360 *** | 7.639 *** | 6.940 *** |
| (0.0325) | (0.0326) | (0.0321) | (0.730) | (0.732) | (0.676) | (1.392) | (1.380) | (1.335) | |
| Observation number | 13,908 | 13,908 | 13,625 | 13,908 | 13,908 | 13,625 | 13,908 | 13,908 | 13,625 |
| R square | 0.066 | 0.066 | 0.427 | 0.029 | 0.030 | 0.456 | 0.113 | 0.116 | 0.476 |
| Polynomial | 1 | 2 | 2 | 1 | 2 | 2 | 1 | 2 | 2 |
| Cluster on cities | 76 | 76 | 76 | 76 | 76 | 76 | 76 | 76 | 76 |
| Controlling variables | Yes | Yes | Yes | ||||||
| Fixed effects | Yes | Yes | Yes |
Note: Robust SEs clustered on cities in parentheses. Fixed effects include city and year fixed effects. *, **, and *** indicate significance at 10%, 5%, and 1%. Omit the constant coefficient to save table space.
Table 5.
The RDD analysis of ozone (placebo effect test).
| (1) | (2) | (3) | |
|---|---|---|---|
| O3 | O3 | O3 | |
| Winter Heating policy | −0.546 | −0.238 | −0.465 |
| (0.557) | (0.570) | (0.534) | |
| Observation Number | 13,908 | 13,908 | 13,625 |
| R square | 0.108 | 0.118 | 0.462 |
| Polynomial | 1 | 2 | 2 |
| Cluster on cities | 76 | 76 | 76 |
| Controlling variables | Yes | ||
| Fixed effects | Yes |
Note: Robust SEs clustered on cities in parentheses. Fixed effects include city and year fixed effects. *, **, and *** indicate significance at 10%, 5%, and 1%. Omit the constant coefficient.
Table 6.
The dynamic results of RDD analysis for Winter Heating.
| (1) | (2) | (3) | (4) | (5) | (6) | (7) | (8) | (9) | |
| AQI | AQI | AQI | PM10 | PM10 | PM10 | PM2.5 | PM2.5 | PM2.5 | |
| Winter heating policy | 27.85 *** | 4.111 | 2.127 | 27.50 *** | 8.238* | 2.408 | 28.16 *** | 6.133 | 4.488* |
| (5.888) | (4.294) | (2.962) | (7.264) | (4.810) | (4.210) | (5.330) | (4.133) | (2.466) | |
| Observation number | 4602 | 4577 | 4446 | 4602 | 4576 | 4446 | 4602 | 4577 | 4446 |
| R square | 0.098 | 0.133 | 0.275 | 0.093 | 0.149 | 0.299 | 0.114 | 0.111 | 0.240 |
| Polynomial | 2 | 2 | 2 | 2 | 2 | 2 | 2 | 2 | 2 |
| Controlling variables | Yes | Yes | Yes | Yes | Yes | Yes | Yes | Yes | Yes |
| 2014 | Yes | Yes | Yes | ||||||
| 2015 | Yes | Yes | Yes | ||||||
| 2016 | Yes | Yes | Yes | ||||||
| Cluster on cities | 76 | 76 | 76 | 76 | 76 | 76 | 76 | 76 | 76 |
| (1) | (2) | (3) | (4) | (5) | (6) | (7) | (8) | (9) | |
| CO | CO | CO | NO2 | NO2 | NO2 | SO2 | SO2 | SO2 | |
| Winter heating policy | 0.248 *** | 0.118 *** | 0.0720** | 5.517 *** | -0.642 | 2.606 *** | 8.829 *** | 4.224** | 7.315 *** |
| (0.0752) | (0.0418) | (0.0306) | (1.632) | (0.890) | (0.957) | (2.472) | (1.603) | (1.539) | |
| Observation number | 4602 | 4577 | 4446 | 4602 | 4577 | 4446 | 4602 | 4577 | 4446 |
| R square | 0.118 | 0.167 | 0.162 | 0.139 | 0.117 | 0.233 | 0.182 | 0.149 | 0.132 |
| Polynomial | 2 | 2 | 2 | 2 | 2 | 2 | 2 | 2 | 2 |
| Controlling variables | Yes | Yes | Yes | Yes | Yes | Yes | Yes | Yes | Yes |
| 2014 | Yes | Yes | Yes | ||||||
| 2015 | Yes | Yes | Yes | ||||||
| 2016 | Yes | Yes | Yes | ||||||
| Cluster on cities | 76 | 76 | 76 | 76 | 76 | 76 | 76 | 76 | 76 |
Note: Robust SEs clustered on cities in parentheses. *, **, and *** indicate significance at 10%, 5%, and 1%. Omit the constant coefficient.
© 2019 by the authors. Licensee MDPI, Basel, Switzerland. This article is an open access article distributed under the terms and conditions of the Creative Commons Attribution (CC BY) license (http://creativecommons.org/licenses/by/4.0/).
Share and Cite
MDPI and ACS Style
Wang, S.; Li, Y.; Haque, M. Evidence on the Impact of Winter Heating Policy on Air Pollution and Its Dynamic Changes in North China. Sustainability 2019, 11, 2728. https://0-doi-org.brum.beds.ac.uk/10.3390/su11102728
AMA Style
Wang S, Li Y, Haque M. Evidence on the Impact of Winter Heating Policy on Air Pollution and Its Dynamic Changes in North China. Sustainability. 2019; 11(10):2728. https://0-doi-org.brum.beds.ac.uk/10.3390/su11102728
Chicago/Turabian StyleWang, Shulin, Yongtao Li, and Mahfuzul Haque. 2019. "Evidence on the Impact of Winter Heating Policy on Air Pollution and Its Dynamic Changes in North China" Sustainability 11, no. 10: 2728. https://0-doi-org.brum.beds.ac.uk/10.3390/su11102728
Note that from the first issue of 2016, this journal uses article numbers instead of page numbers. See further details here.