Article

LCA of a Consortium-Based MSW Management System to Quantify the Decrease in Environmental Impacts Achieved for Increasing Separate Collection Rates and Other Modifications

Laboratory of Environmental Engineering, DICII, University of Rome “Tor Vergata”, Via del Politecnico 1, 00133 Rome, Italy
*
Author to whom correspondence should be addressed.
Sustainability 2019, 11(10), 2810; https://0-doi-org.brum.beds.ac.uk/10.3390/su11102810
Submission received: 28 March 2019 / Revised: 25 April 2019 / Accepted: 3 May 2019 / Published: 16 May 2019
(This article belongs to the Collection Trends in Municipal Solid Waste Management)

Abstract

:
In this study, the collection, transport, and treatment phases (including the management of products and processing residues) of six fractions of municipal solid waste (MSW) generated in the Sinistra Piave Basin (Veneto, Italy), a consortium of 44 municipalities, were analyzed by life-cycle assessment (LCA). Specifically, two different scenarios were assessed for paper and cardboard, glass, multi-material (plastics and metals), food waste, garden waste, and dry residual fraction management, one referring to the year 2015 and the other to 2004. The primary aim was to investigate what consequences the increase in separate collection rates progressively achieved by the consortium (65% in 2004 versus to 80% in 2015) exerted on the management system and its potential environmental impacts. For each scenario, the type of separate collection method employed (door-to-door in 2015, and mixed door-to-door and curbside collection in 2004), the collected amounts, the geographic location of the main sorting/treatment plants, and the type of treatments applied to manage the products and processing residues were considered. The results of the study indicate that, among the variations that occurred in the management system for the two considered years, the increase in separate collection rate achieved was the factor that most affected all of the potential environmental impacts taken into account. In particular, for the 2015 scenario, differently from the 2004 one, all of the categories considered (apart from ecotoxicity) were negative, indicating savings instead of impacts. Treatment was the stage that by far mostly affected potential environmental savings, with regard to paper and cardboard recycling in particular.

1. Introduction

Italy generated around 29.6 million tons of municipal solid waste (MSW) in 2017 [1]. As for the management systems adopted, very pronounced differences may be noted depending on the geographic area considered, and in general between northern and central or southern regions, both in terms of collection methods and treatment strategies applied. As for collection, increasing targets for the separate collection of specific waste streams to achieve by set timeframes were established [2]. Specifically, by 2012, the separate collection rate was set to reach 65%. The current national waste report states that, in 2017, 16.4 million tons of MSW was intercepted by separate collection, which means that an overall collection rate of just over 55.5% was attained countrywide [1], still below the 2012 target. However, northeast regions such as Veneto, Lombardy, and Trentino Alto Adige reached, and in some areas even greatly exceeded, this target [3,4]. High separate collection rates should lead to higher material recycling and, hence, lower overall environmental impacts of the waste management system (e.g., References [5,6]). Material recycling and recovery in fact divert waste from landfills and thermal treatment, thus leading to a reduction in impacts, including leachate production (in the case of landfilling) and greenhouse gas emissions [7]. Furthermore, recycled materials replace (at least partially) virgin raw materials and, therefore, lead to resource savings (e.g., energy, materials, and water), as well as avoiding emissions to the environment, related to extraction and processing. In a long-term perspective, recycling should lead to a decrease in the requirement of raw materials needed for production and, thus, postpone the exhaustion of scarce resources; however, in addition to the recycling rate, product lifetime and the production growth rate are important factors [8].
The European Union (EU) waste policy, hence, placed increasing emphasis on material recycling and set, within its recent circular economy package legislation, targets on recycling and preparation for reuse of MSW (e.g., 55% by 2025) and for the recycling of packaging materials [9,10]. Specifically, EU member states will be expected to achieve the following recycling rates by 2025: all packaging waste 65%, plastics 50%, wood 25%, ferrous metals 70%, aluminum 50%, glass 70%, and paper and cardboard 75% [10]. In addition, by 2035, MSW landfilling should be reduced to 10% or less of the total amount of generated municipal waste [11]. This means that, in the next few years, EU countries will need to develop and implement integrated waste management strategies (e.g., Reference [12]) that allow to reach high yields not only in terms of separate collection, but also of actual recycling and reuse of selected fractions.
In this study, we chose to focus on one of the most advanced waste management systems applied at a sub-regional level currently in Italy, the Sinistra Piave Basin, made up by 44 small- to medium-size municipalities of the province of Treviso (Veneto region). In 2015, the consortium that runs the waste management service in this area, serving a total population of around 300,000 inhabitants, was awarded first place as a waste recycling consortium in Italy by the environmental association Legambiente, since it achieved an 80% separate collection rate on average for its whole territory. The attainment of this result was made possible by the adoption of multiple measures, both technical and managerial, such as an efficient door-to-door collection service for the main waste fractions and the presence of 38 eco-centers located close to the main towns (average availability of one center per 3500 households) for the collection of the remaining fractions. In addition, the consortium developed communication strategies targeted both at citizens (also in foreign languages) and educational campaigns for children and students at schools, discouraging incorrect practices via regular controls, remote monitoring, and fines.
The main objective of this study was to quantitatively analyze the whole integrated management system applied in the Sinistra Piave Basin—from collection to recycling of specific MSW fractions and treatment of the residual ones—to evaluate the effects of the applied strategies and in particular of the separate collection yields achieved. Specifically, we decided to assess, for two different years for which different separate collection yields were achieved, the potential environmental impacts associated with the consortium-based management system.
The environmental performance of an integrated waste management system is typically evaluated by life-cycle assessment (LCA), a decision support tool that can be used in policy and decision-making to identify the system with the best performance through a comparative analysis of different scenarios that refer to a specific district or region (see Reference [13] and references within). For example, LCA was employed to compare 12 management scenarios, 10 of which differed only in the separate collection yields of specific fractions, in order to identify the system leading to the lowest environmental impacts for Avellino province in southern Italy; the results showed that the best performance could be achieved for the highest separate collection yield, with regard to paper and cardboard recycling in particular [5]. In another study, LCA was employed to analyze the environmental impacts of different integrated waste management strategies for two provinces in northern Italy (Piedmont region); separate collection and downstream recycling resulted in both cases as the most effective tools to improve energy efficiency and to lower environmental impacts [14]. Another LCA carried out for different provinces of Lombardy region in northern Italy analyzed both the environmental impacts related to the actual integrated waste management scenarios at the time of the analysis and those resulting from future modifications; an increase in the separate collection of recyclable fractions (and consequent decrease in residual waste for disposal) again yielded an overall great improvement and benefits at both the environmental and energy level [15].
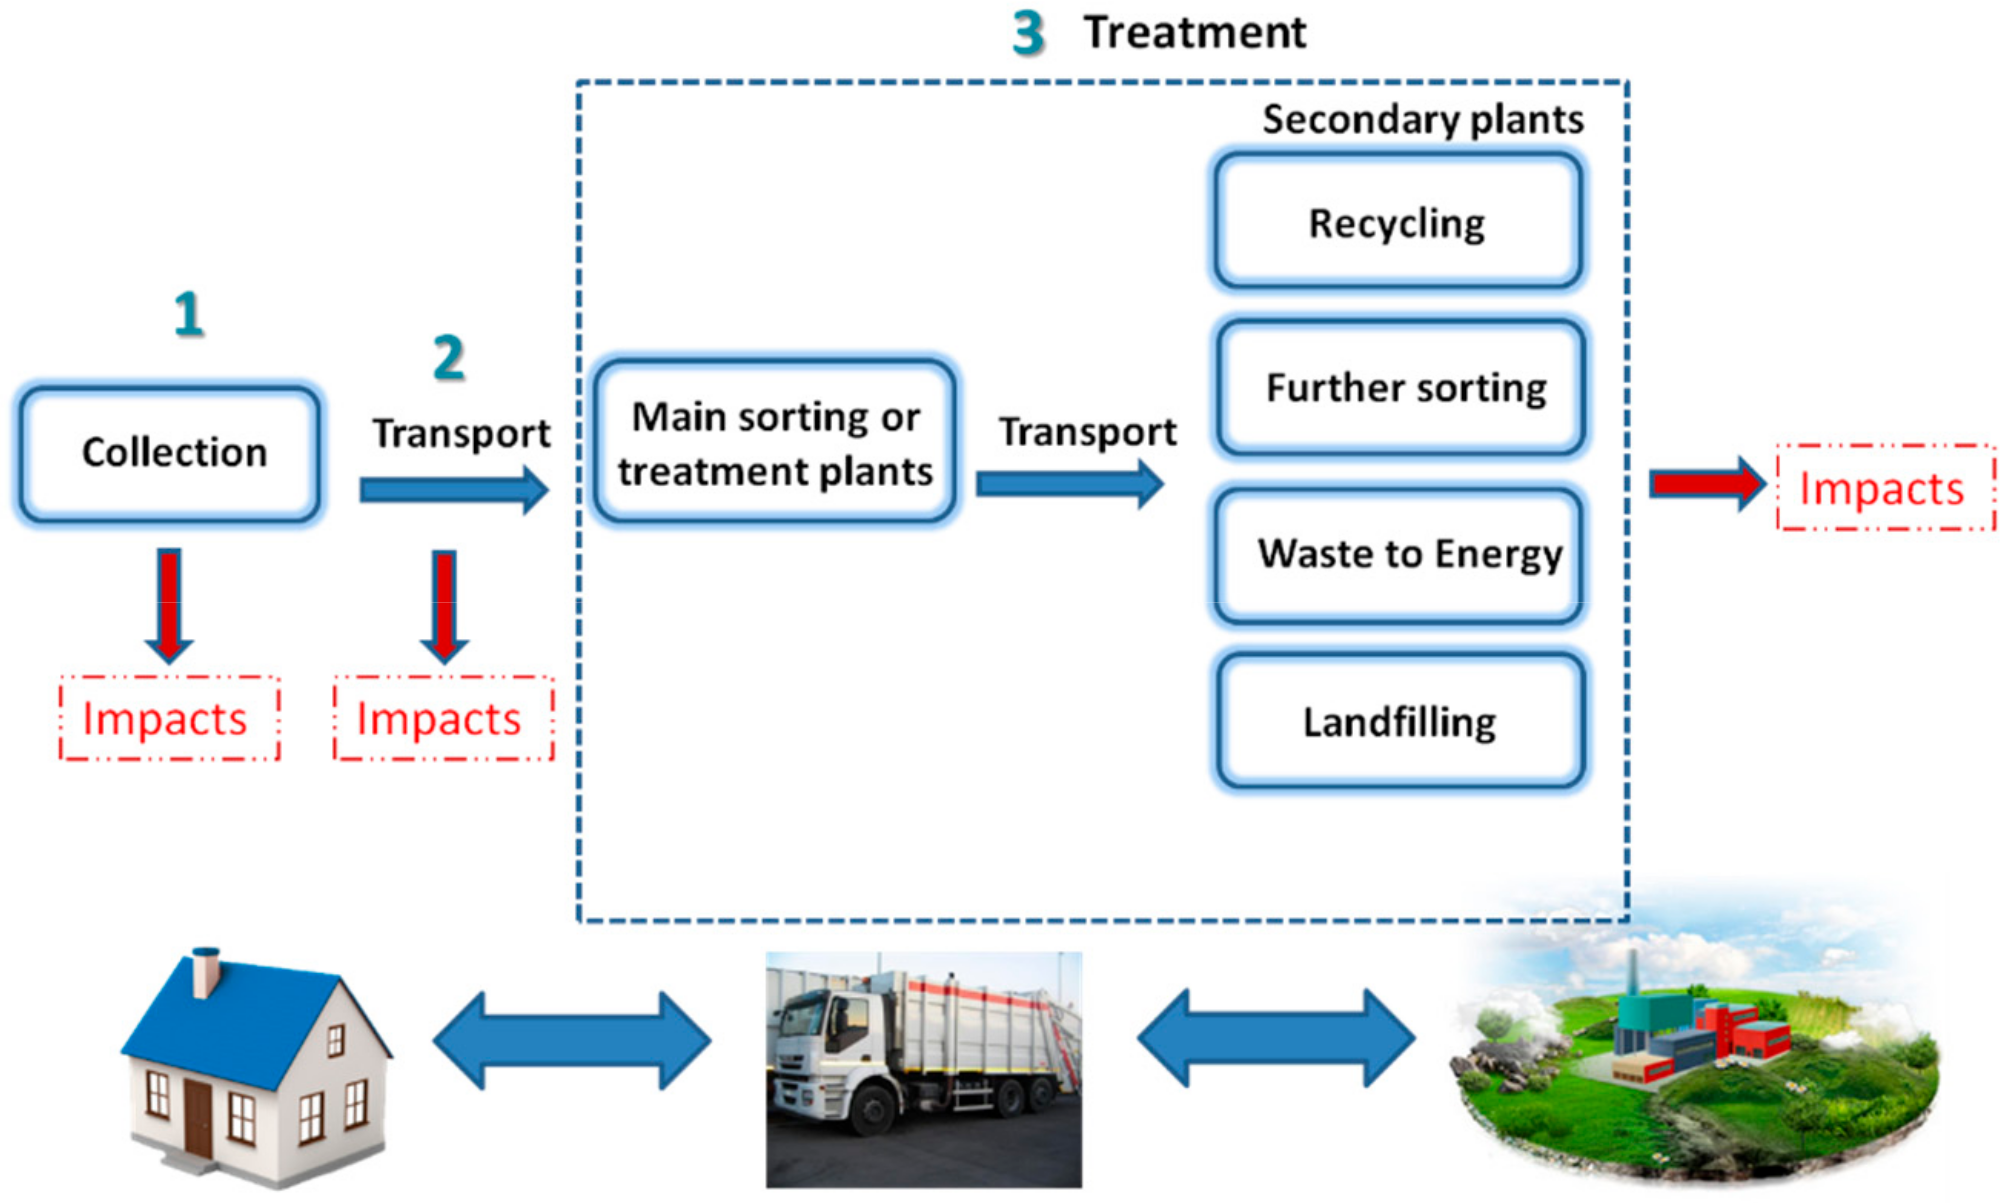
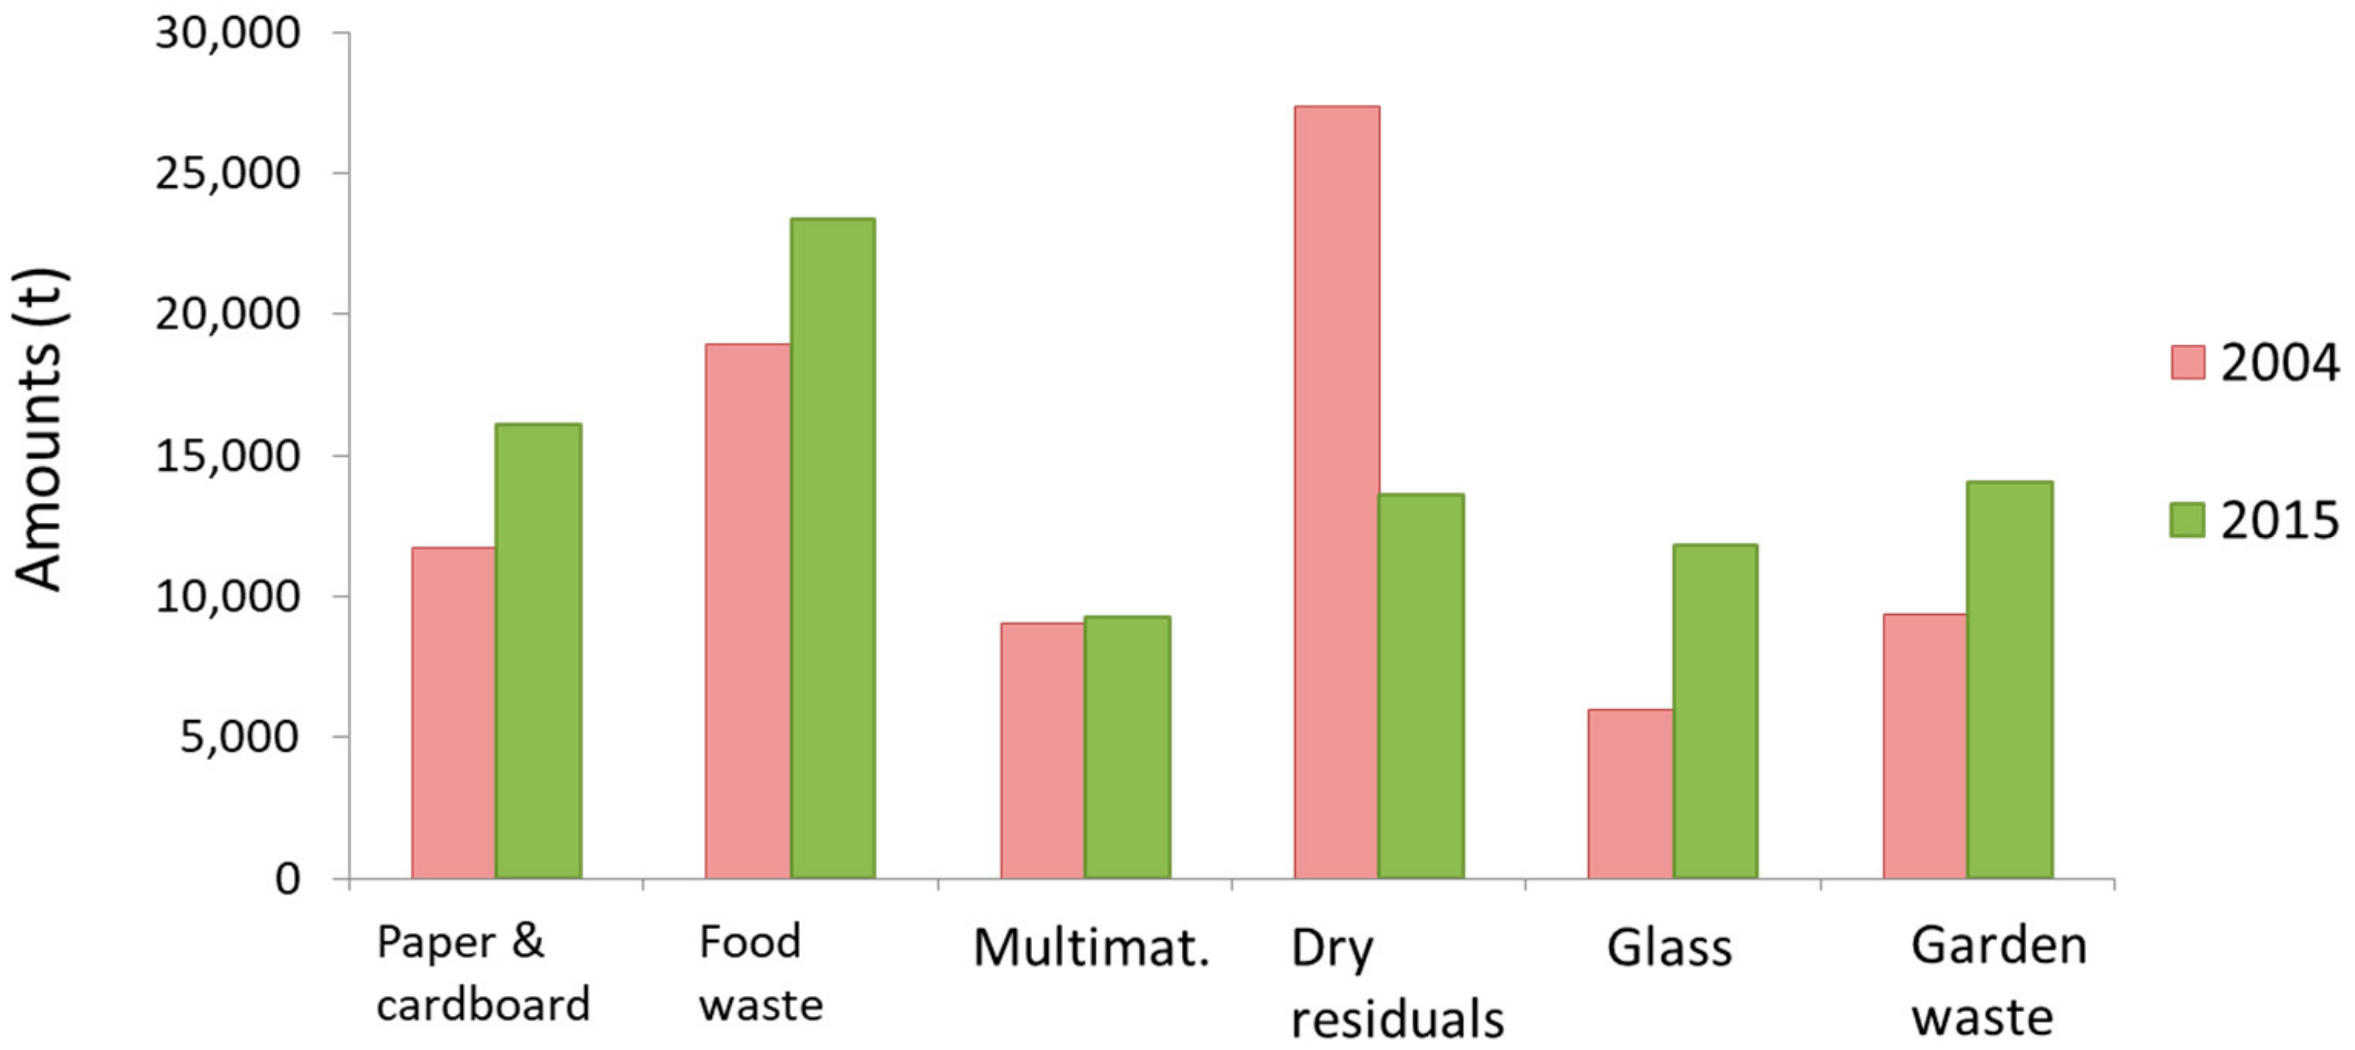
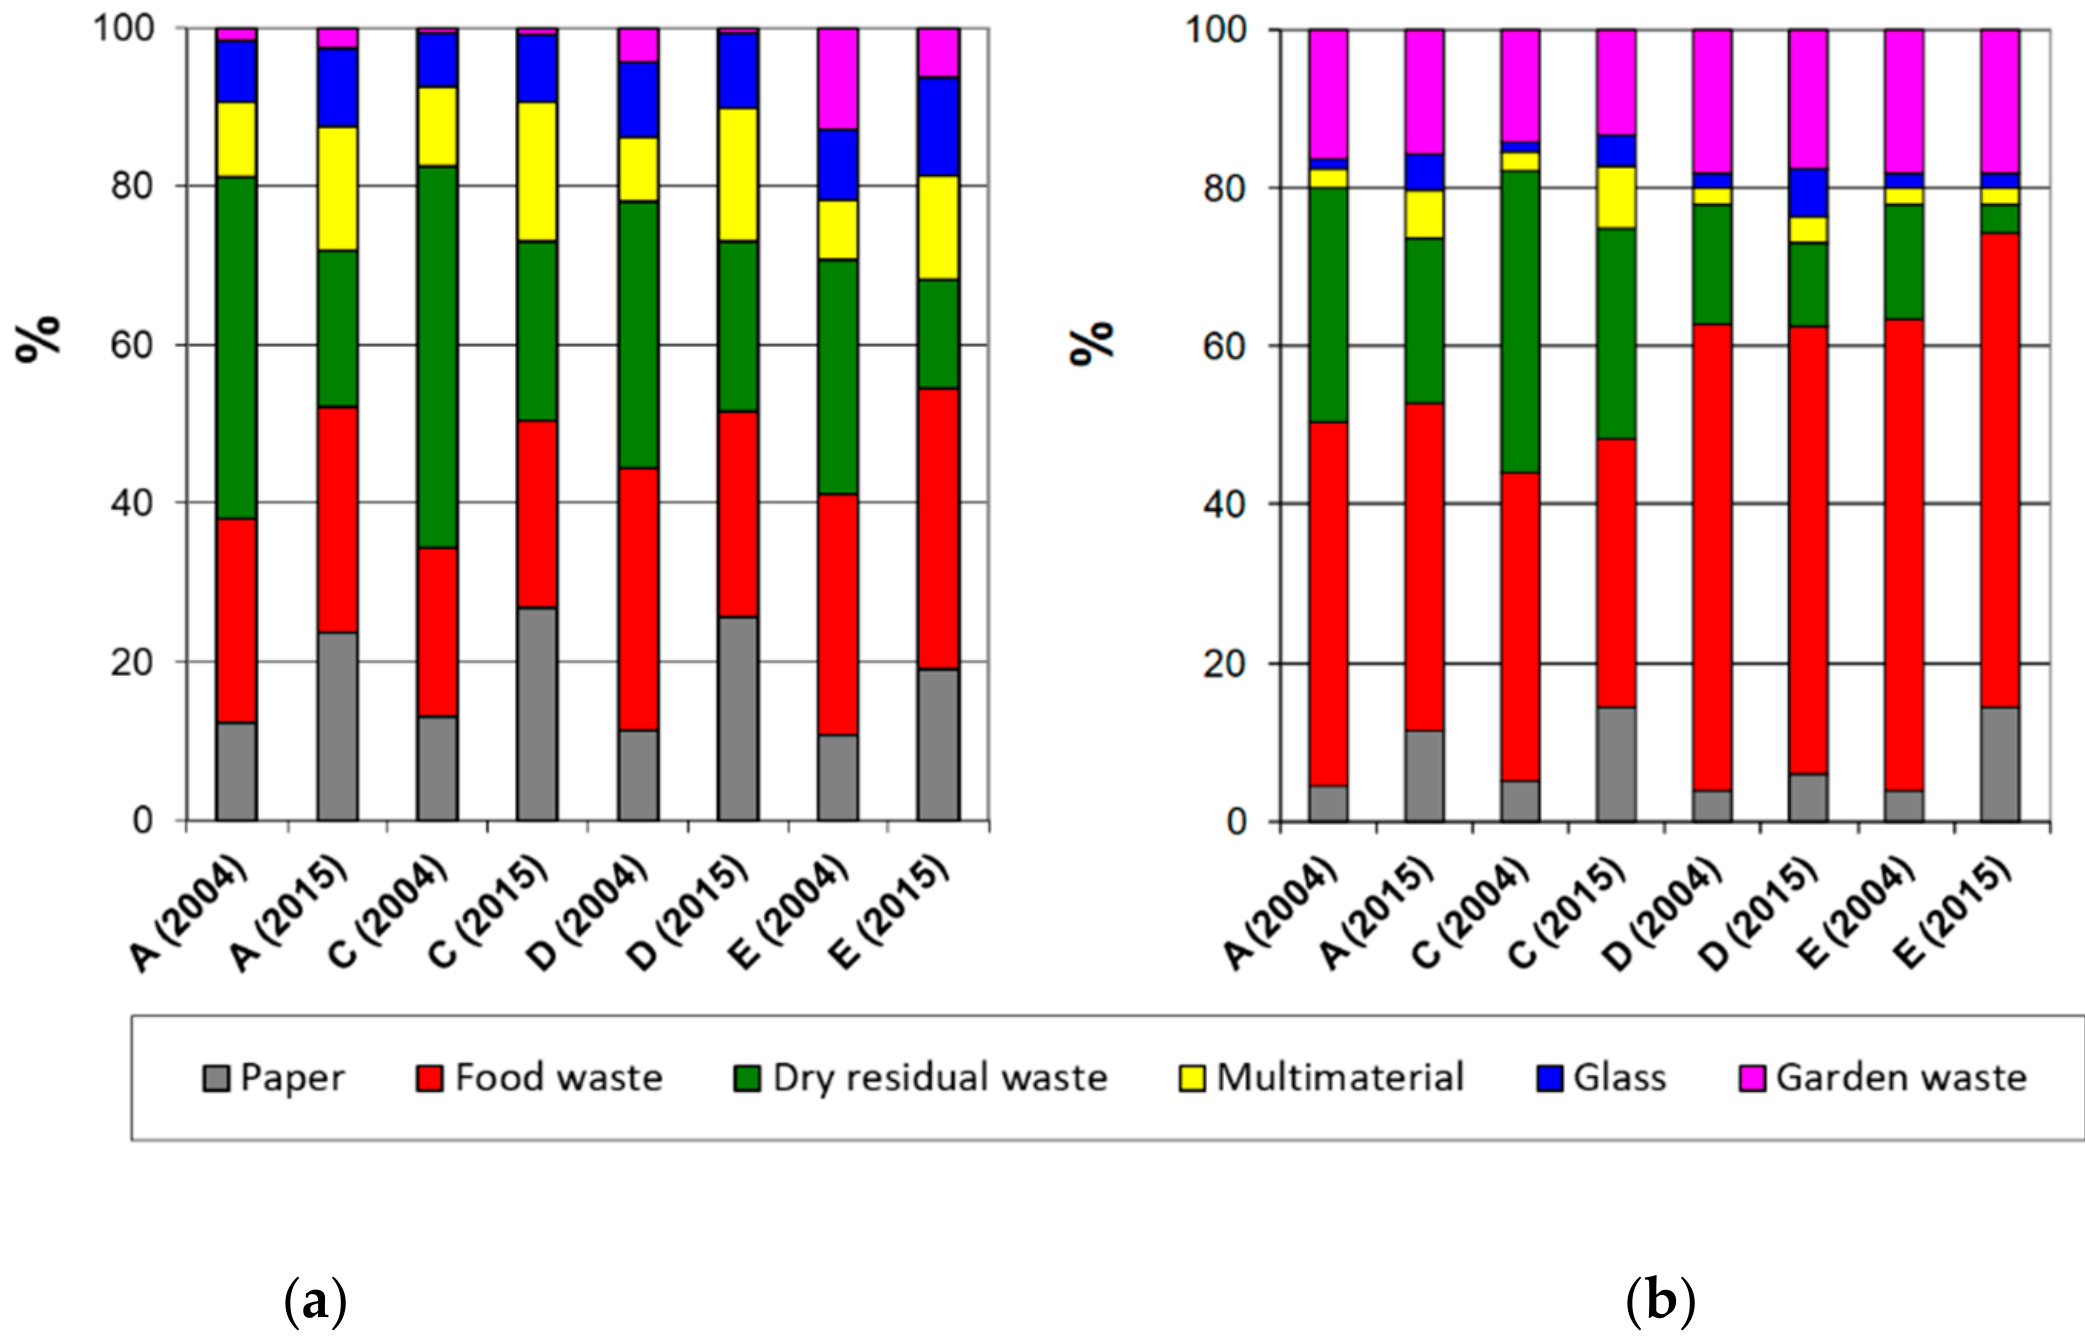
LCA was employed also in this study to analyze the potential environmental impacts associated with an integrated system adopted to manage, in this case, the waste generated in the Sinistra Piave Basin. However, here, the two analyzed scenarios are not different options or future scenarios based on specific assumptions, but two past scenarios referring to two specific years characterized mainly by differences with regard to the type of waste collection system adopted and consequent separate collection yield achieved, as well as other differences concerning the location of treatment plants and the treatments adopted for residual fractions. Specifically, the analysis regarded the evaluation of the impacts related to the management of the following fractions: paper and cardboard, glass, multi-material (plastics and metals), food waste, garden waste, and the dry residual fraction. In the year 2015 (scenario 1), the collection of the abovementioned materials was carried out almost exclusively (98%) by a door-to-door system, whereas, in the year 2004 (scenario 2), a mixed collection method, leading to a lower separate collection yield, was adopted. The aim of this study was to quantify the environmental benefits resulting from the system for which the higher separate collection yields were achieved and to identify the system modifications that lead to the greatest savings in terms of impacts, in order to propose strategies that may yield further potential improvements. The results of the study can be of interest both for MSW management stakeholders and for citizens to motivate their contribution in increasing separate collection yields.

2. Materials and Methods

2.1. Scenarios and Assumptions

This study focused on three main elements of an integrated management system: collection, transport to the main sorting/treatments plants, and recycling/treatment/disposal carried out in both main and secondary plants. In Figure 1, a scheme of the analyzed system is reported. The treatment phase included the transport and sorting or treatment of the residues of the first plant to other specific facilities and the impacts of these second treatment units. Instead, the manufacturing of the containers employed for waste collection and the personnel mobility or construction and maintenance of offices were not included in the analysis.
Data regarding the collection, transport, and treatment of the six types of fractions considered in the study were supplied by the consortium and the local Environmental Protection Agency (ARPAV), as well as by the main plants that received and treated the waste generated in the Sinistra Piave Basin during the two years considered. These data include the following:
  • The amounts and main composition of the waste collected in each of the 44 municipalities of the consortium;
  • For the collection stage, the amounts collected, the type and frequency of collection, and the distances traveled by the different types of collection vehicles in 28 of the municipalities of the consortium;
  • For the transport stage, the geographic location of the main treatment plants and the types of vehicles employed in 28 of the municipalities of the consortium;
  • For the treatment phase, the specific characteristics of each type of plant, including energy consumption (or generation), the quantities of recovered materials or generated residues, and their final destination (recycling, treatment, or disposal).

2.1.1. Main Data on MSW Production

In Table 1, total MSW production data for the 44 municipalities of the Sinistra Piave Basin are reported with reference to the two years considered in this study. As can be noted, the population and total amount of waste collected in this area were quite similar in 2004 and 2015, yielding amounts of around 330–340 kg per inhabitant per year, significantly lower than national average values (i.e., 489 kg per inhabitant per year in 2017) [1], indicating the success of waste prevention and reduction activities carried out in the area.
The total amounts of the six fractions collected for the two selected years (see Table 1 and Figure 2) were also comparable, and both corresponded to 84% of the total amount of MSW collected in the consortium, while the other 16% was made up by bulky materials, batteries, and other items not collected at the household level. Except for the multi-material fraction, the amounts of the six main MSW fractions analyzed in this study varied significantly for the two years considered. In particular, glass almost doubled, while a 20–30% increase was found for paper and cardboard, food waste, and garden waste. Correspondingly, the amount of residual dry waste was less than half of that of the amount collected and managed in 2004.
Since the total amount of selected fractions did not vary substantially in the two scenarios and, therefore, the decrease in residual waste was compensated by the increase of specific fractions such as glass, paper, and food waste, it can be concluded that the observed differences in waste composition can be ascribed to the different collection system adopted, in addition to changes in consumer habits.

2.1.2. Collection Stage

In 2015, a door-to-door collection system was applied for all 44 municipalities of the consortium with regard to the six considered fractions, except for garden waste which was predominantly (85%) collected at municipal eco-centers (or collection points). The door-to-door collection frequency applied was twice a month for all fractions, excluding food waste (twice a week) and glass (once a month).
For 28 municipalities, specific data regarding the collection of each of the five fractions collected door-to-door, i.e., type of vehicle employed, length of route, presence of a transfer station, etc., were available (see example reported in Table A1 of Appendix A for one municipality). For the other 16 municipalities, the kilometers traveled by vehicles for collecting each type of waste fraction were estimated on the basis of correlations between the length of the collection route and parameters such as the number of inhabitants, extension of the municipality, or amount of waste produced, on the basis of the data available for the other 28 municipalities. In Figure 3, two examples of such interpolations are reported. On the basis of these data, the frequency and capacity of the different types of collection vehicles considered, the amounts of each waste fraction transported, and the collection distance traveled were estimated. For garden waste, it was assumed that citizens went to the eco-center 12 times a year by car (50% gasoline, 35% diesel, and 15% methane), transporting each time around 35–45 kg of garden waste for a 1.5–5.5 km distance (depending on the extension of the municipality).
In 2004, the door-to-door collection system was applied only to collect food waste and the dry residual fraction, and it covered 65% of the population of the consortium, i.e., 29 municipalities out of 44. The remaining fractions (in addition to food waste and the dry residual fraction in 15 municipalities) were collected in curbside bins, except for garden waste, which was mostly collected in eco-centers. In this case, the frequency of collection of the door-to-door system was twice a week for food waste and once a week for the dry residual fraction. The curbside collection frequency was instead three times a week for the abovementioned waste types, while it was weekly for paper and cardboard and twice a week for multi-material and glass. Not having information on the collection routes employed in 2004, the same distances considered in 2015 were assumed for door-to-door collection for corresponding municipalities and waste fractions, while a 30% reduction was hypothesized in the case of curbside collection. This assumption was made on the basis of information provided by service operators and considering that the municipalities of the Bacino di Sinistra Piave are mostly in rural/agricultural areas and, hence, are characterized by a significant fraction of scattered houses.
Also the type of collection vehicles considered in the case of curbside collection differed; in this latter case, it was assumed that only vehicles with a transport capacity above one ton were employed, i.e., it was hypothesized that the small tipper, small dumper, and midi-compactor vehicle types were substituted by dumpers (capacity of 1.9 tons).
In Table A2 (Appendix A), the impacts in terms of ton × km related to the collection of each waste fraction and scenario as a function of the type of vehicle are reported. Figure 4a reports the percentage contribution to these impacts of each vehicle type.

2.1.3. Transport Stage

From the analysis of the destination of each of the waste fractions collected in the Sinistra Piave Basin, it was observed that, in both 2015 and 2004, the six examined fractions were sent to several types of plants, located in or outside the consortium. Regarding the type of plants, paper and cardboard, multi-material, and glass were sent to sorting plants, the residual dry waste was sent to sorting plants (different from the ones to which the other fractions were sent), and food and garden waste was sent to composting plants, eventually equipped with anaerobic digestion. Hence, it was decided to simplify the analysis considering that each type of fraction would be sent only to one plant, selecting the location and characteristics of the plant to which most of each fraction was sent in each considered year. Specifically, it was assumed that paper and cardboard, multi-material, and glass were sent to the same sorting plant, the dry residual fraction to another sorting plant, and the food waste and garden waste fractions to a combined composting and anaerobic digestion plant.
With regard to the transport stage, for each of the waste fractions considered, the amounts of waste collected in each municipality and transported to the sorting or treatment plant, the transport frequency (which was assumed to be the same as the collection one), the type of vehicle employed, and the distance between the municipality and the plant were considered (see example reported in Table A1 of Appendix A).
For the 2015 scenario, the average distance between the plant treating the dry residual fraction and each municipality was 25 km, and that of the sorting facility receiving paper and cardboard, multi-material, and glass was 20 km, whereas the average distance of the composting and anaerobic digestion plant was 63 km. With regard to the 2004 scenario, the plant considered for the treatment of the dry residual fraction was the same as the one of 2015; hence, the same distances were considered. Also, the selection facility considered for the other materials was close to the current one (average distance of 23 km), while the plant treating food and garden waste presented an average distance from each municipality of 120 km. In the calculation, it was considered that each waste vehicle returned (empty) to the municipality after transporting the waste.
In Table A2 of Appendix A, the impacts in terms of ton × km related to the transport of each waste fraction and scenario as a function of the type of vehicle are reported. Figure 4b reports the percentage contribution to these impacts of each type of vehicle type.

2.1.4. Treatment Stage

Based on 2015 data regarding the inputs and outputs of each of the three selection/treatment plants to which the six fractions were sent, the amounts of each type of material prepared for recycling, as well as the amounts of residues sent to treatment/disposal in other types of plants, were estimated, along with transport distances. Specifically, the data considered included the waste codes and amounts of all input and output flows, as well as the destination plants and their geographic location, in the case of outputs.
It should be noted that the treatment plant receiving the food and garden waste fractions in 2004 presented a similar process layout to the one of the 2015 scenario, but a lower fraction of the waste underwent anaerobic digestion (10% instead of 30%). The process consists of a first pressing step involving the input of humid food waste, from which the output solid fraction is mixed with garden waste before undergoing composting in aerated biocells, while the organic-rich liquid is treated by anaerobic digestion, producing heat and electricity. The liquid effluent of this latter treatment is treated biologically and by ultrafiltration and reverse osmosis, and then recirculated in the system. All the produced compost is used in agriculture as soil amendment and landscaping material. As for electricity production, based on data provided from the plants, yearly productions of 701 and 4049 MWh related to the treatment of the food and garden waste of the consortium were estimated for the 2004 and 2015 scenarios, respectively.
For the 2004 scenario, output data were only available for the sorting plant treating the dry residual fraction. Thus, for the other sorting plant, data were estimated based on 2015 data, considering a decrease in selectivity due to the different type of collection method applied. In fact, the results of composition analysis carried out on the collected paper and multi-material streams indicated a significant reduction in the amount of scraps in each of these fractions in 2015 compared to 2004, with scrap contents of 3.7% versus 11% for paper, and 25.6% versus 38% for multi-material, respectively.
For plastics selection, on the basis of data reported for the recycling of dry waste fractions in the Veneto region [18], it was assumed that the recovered plastics were made up by 70% polyethylene terephthalate (PET), 20% high-density polyethylene (HDPE), 7% low-density polyethylene (LDPE), and 3% polypropylene (PP).
To calculate the amounts of each material sent to recycling, the outputs of the main selection plant were multiplied by the reprocessing efficiencies reported by Reference [19] (i.e., 90% for steel, 83.5% for aluminum, 100% for glass, 89% for pulp production from paper, 75.5% for PET, 90% for HDPE, and 60% for LDPE and PP).
As shown in Table 2, regarding the types of treatments applied to the six waste fractions generated by the consortium, in 2004, overall more waste was processed by mechanical sorting, especially by sanitary landfilling. On the other hand, anaerobic digestion was much more applied in 2015, and there was a small increase in composting and incineration. It should be noted that the total amount of treated waste appears to be somewhat higher than the amounts of waste collected for each respective scenario reported in Table 1; this is due to the fact that part of the waste was treated in mechanical sorting plants more than once; for example, the mixed materials from the selection of the packaging waste were treated again for solid recovered fuel production.
As for material recycling, significantly more glass, as well as paper and cardboard, was sent to recycling in 2015. There was only a slight increase in the amounts of plastics and Al sent for recycling, while there was a reduction in the amount of Fe for recycling.

2.2. LCA Methodology

As a functional unit, the total amounts of the six fractions of MSW collected in the Sinistra Piave Basin in each examined year were considered. This unit was chosen even though the total amounts differed slightly for the two analyzed years (88,000 t in 2015 versus 82,000 t in 2004; see Table 1) due basically to a small increase in population in 2015, since the objective was to evaluate and compare the total impacts related to the integrated management system of the consortium for each year.
The LCA analysis was carried out using the Simapro software version 8 (Pré Consultants) and the Ecoinvent database (versions 3 [20] or 2 [21]) for background data (i.e., Italian energy mix, collection vehicles, and waste treatment facilities such as selection plant, sanitary landfill, and waste incinerator with electricity and heat co-generation; see Table A3, Appendix A). For all collection and transport vehicles, Euro 4 diesel models were assumed. Allocational processes were selected, making reference mostly to global or European scenarios, or Italian ones in the case of the energy mix (see Table A3, Appendix A).
For the food and garden waste fractions, the treatment process was modeled since a representative one was not retrieved in the database (see Table A4, Appendix A).
In this analysis, it was assumed that compost would be used in replacement of peat moss for horticultural applications with a 1:1 substitution rate. For the other recycled materials, the following replacements were assumed [19]: recovered Fe would replace liquid steel (1:1); recovered Al would replace Al ingot (1:1); recovered glass would substitute glass containers (1:1); recovered paper and cardboard would replace pulp by thermomechanical processes (1:0.83); and recovered plastics would substitute the respective granules of PET, HDPE, LDPE, and PP (1:0.81). For each of these materials, the production processes reported in the Ecoinvent database were considered (see Table A3, Appendix A).
For the analysis of potential environmental impacts, the International Reference Life-Cycle Data System (ILCD) methodology for impact characterization and assessment [22], recommended for the European context as reported by References [23,24], was employed.
In this paper, we present the results achieved with regard to the following selected impact categories among the 16 included in the ILCD 2011 midpoint method (V1.03): global warming, acidification, photochemical smog production, eutrophication, human toxicity (carcinogenic effects), ecotoxicity, and consumption of non-renewable resources. These categories were selected as being representative of the main different types of impacts included in this impact assessment methodology.

3. Results and Discussion

3.1. Recycling Yields Achieved

On the basis of the data reported in Table 1 and Table 2, the recycling yields resulting for the Sinistra Piave basin, with reference to the six considered waste fractions, were evaluated and compared to the targets established by the recent EU legislation [9,10,11]. The calculation was performed applying the rules reported in the respective directives. In particular, for MSW recycling, apart from the amounts of paper and cardboard, glass, metals, and plastics for recycling, the amount of biodegradable fractions (food and garden waste) entering aerobic or anaerobic treatment was counted as recycled for both scenarios, since the treatment plants generated compost that was used as a recycled product.
As shown in Table 3, a substantial increase in recycling rates from the 2004 to the 2015 scenario was achieved in terms of MSW, packaging waste (calculated as the sum of paper and cardboard, glass, and multi-material for recycling divided by the amounts of these fractions collected in the consortium), and paper and cardboard recycling. Also the four-fold decrease in landfilling attained in 2015 compared to 2004 should be highlighted. As for plastics and metal recycling, it was not possible to calculate the separate recycling yields achieved, since in both scenarios these materials were collected together as multi-material; therefore, even if the amounts of each type of material sent to recycling were estimated, their initial content was not known.
With regard to the recently established circular economy targets, for the 2004 scenario, most 2025 targets were already met (in particular for glass and packaging waste recycling). This was even more true for the 2015 scenario which appeared also to comply with the 2035 target on landfilling.

3.2. LCA Results

3.2.1. Overall Impacts

The comparison of the overall impacts due to the management of the six waste fractions collected in the Sinistra Piave Basin in the considered scenarios is shown in Table 4 and Figure 5a for the selected impact categories. The results for all the impact categories considered in the ILCD 2011 midpoint method are reported in Table A5 of Appendix A. It is very interesting to note that, for the 2015 scenario, all considered categories apart from freshwater ecotoxicity were negative (i.e., indicated savings instead of impacts). Instead, for the scenario referring to 2004 data, the climate change, human toxicity, and resource depletion impacts were positive. It is also interesting to note that the negative impacts attained for the 2015 scenario were higher in absolute value than those of the 2004 scenario, except for eutrophication. The fact that high separate collection rates result in negative impacts is in agreement with the findings reported by many previous studies (e.g., References [5,14,15,25,26]).
As shown in Figure 5b, the treatment stage was the management phase that most influenced impacts (both negative and positive ones), while the collection stage led to almost negligible impacts for both scenarios. The transport to the main treatment/sorting plants resulted in significant impacts in the case of photochemical ozone formation and climate change, especially for the 2004 scenario.
In order to identify the modifications in the waste management system that led to the highest reductions of potential environmental impacts and the strategies that could be applied to further improve the environmental footprint of the consortium’s activities, the contributions of the single processes and waste fractions to the impacts for the selected categories were examined. In the next paragraphs, the comparisons of the impacts determined for each scenario with regard to the collection, transport, and treatment stages, as well as the main phases and/or fractions contributing to the specific impacts for each management phase, are reported and discussed.

3.2.2. Collection and Transport Stages

In Figure 6, the potential impacts of the collection and transport stages for the two scenarios are compared in terms of characterization. As can be noted, for each of the analyzed impact categories, the resulting impacts for collection and transport were quite comparable, with transport for the 2004 scenario always leading to the highest impacts.
Regarding the collection phase, it can be seen how, for air pollution-related categories, the two scenarios gave very similar impacts, while, for the others (freshwater ecotoxicity and resource depletion in particular), higher impacts were found for the 2015 scenario. These results may be linked to the fact that overall the impacts in terms of tons of waste transported multiplied by the distance traveled (t × km) were similar in the two scenarios. However, the types of collection vehicles considered in the two scenarios were different especially for some fractions (see Figure 4). The impacts related to one t × km transport of these vehicles reported in the Ecoinvent database compared to the larger ones considered for curbside collection were higher especially for toxicity, ecotoxicity, and resource use.
As for the transport stage, all impacts determined for the 2015 scenario were at least 15% lower compared to those of 2004. This can be related mostly to the fact that the plant treating the food and garden waste in the 2015 scenario was located closer (on average, half of the distance) than the plant that had the same function in the 2004 scenario. Effects of the distance of plant location were also reported in a recent study comparing the environmental performance over the years of an integrated waste management system for a Brazilian case study [27].
Regarding the contribution to the collection and transport impacts from the single waste fractions (see Figure 7), it can be noted how, for materials such as glass and paper for which a significantly higher collection rate was attained in 2015, higher impacts were achieved with respect to 2004 for both collection and transport. Instead, a significant reduction in the contribution of the dry residual fraction was found for 2015 collection and transport impacts compared to 2004.
Looking at the contribution to collection impacts, it can be seen (Figure 7a) how, for the 2004 scenario, food and garden waste collection led to over 60% of impacts, while, for the 2015 scenario, there was a more equal distribution of the impacts among the paper, residual, and food waste fractions (in particular for photochemical smog formation and eutrophication). As for the contributions of the different fractions to transport impacts, in Figure 7b, it can be noted that, for all impacts (human toxicity and eutrophication in particular), food waste gave by far the highest impacts for both scenarios. This can be ascribed to the amounts collected, and especially to the location of the treatment plant of these fractions, with an average distance from the consortium more than three or six times higher, for the 2015 and 2004 scenarios, respectively, than that of the sorting plant receiving paper, multi-material, and glass.

3.2.3. Treatment Stage

As shown in Figure 8, differently from the other two analyzed stages, treatment led to savings instead of impacts for most categories, in particular for the 2015 scenario. For the 2004 one, overall positive impacts were found for climate change, ecotoxicity, and human toxicity. This can be related, on the one hand, to the lower material recycling and energy recovery obtained in this case due to the different type of collection method adopted, and, on the other hand, to the higher use of landfilling, in agreement with previous studies [25,26,27,28].
From Figure 8b, it is quite evident that, while the management of the dry residual fraction led to impacts for all categories, paper, multi-material, and glass management yielded savings (apart for global warming and human toxicity for the 2004 scenario), while food and garden waste treatment resulted in negative impacts only for global warming and significant impacts for eutrophication. Hence, it can be noted that almost all savings were achieved for the treatment of the fractions that are recycled in substitution of raw materials (apart from the reduction in climate change attributable to energy recovery from the anaerobic digestion of biowaste). The impacts related to residual waste management were much higher in the 2004 scenario due both to the fact that a higher amount of waste was treated and to the higher use of landfilling as a treatment strategy.
Examining more in detail the processes leading to the most significant impacts or savings for the management of packaging materials (see Figure 9a), it can be noted that the recycling of paper in particular, in addition to PET and glass (for climate change), or non-ferrous metals (for human toxicity), gave the highest negative impacts, while landfilling was the process that yielded the most relevant impacts (for the 2004 scenario in particular). For food and garden waste treatment (see Figure 9b), composting yielded negative impacts with regard to climate change, owing to the substitution of peat moss, but yielded positive impacts for photochemical smog and human toxicity, due to air emissions of the composting process. Anaerobic digestion resulted instead in savings for photochemical smog and human toxicity, due to electricity production substituting national grid one; however, it was the main contributor of eutrophication impacts, in relation to the water treatment process. In addition, the recovery of ferrous metals contributed to negative emissions, in particular for photochemical smog in 2004. As for the management of the dry residual fraction, as can be noted in Figure 9c, incineration yielded the most significant contribution to impacts for human toxicity in both scenarios, and eutrophication and climate change for the 2015 scenario. Landfilling was shown to contribute especially to the climate change impacts of the 2004 scenario, whereas the transport of the material to the treatment plants had a major role in photochemical smog impacts for both scenarios. Finally, as for negative impacts, the most relevant, in particular for eutrophication, was non-ferrous metal recycling.

4. Conclusions

This LCA study was aimed at evaluating the environmental impacts of a consortium-based waste management system with regard to six MSW fractions and two different years. The aim was to investigate the effect of the increase in separate collection rates achieved in over 10 years on potential environmental impacts, and to identify the sub-processes that are more critical in terms of impacts for one or more categories, thereby identifying potential further improvements that could be implemented. Overall, the results of the study indicated that an efficient separate collection system, coupled with plants employing technologies that allow obtaining material and energy recovery, may lead to great benefits in terms of the reduction of environmental impacts.
The overall recycling efficiencies achieved appear to already be in line with the EU targets for 2025. An exception may be plastics and metals that were collected together as a multi-material fraction and for which it was not possible to separately evaluate the recycling yields achieved. In order to be able to better monitor the amounts collected, treated, and prepared for recycling for each of these types of materials, dedicated separate collection strategies could be implemented also for specific types of plastics presenting the highest recycling potential (e.g. PET). In this study, a rough estimate was made with regard to the composition of the recovered plastics; therefore, it would be important in the future to analyze the average composition of the collected plastics and the actual recycling rates achieved for each type.
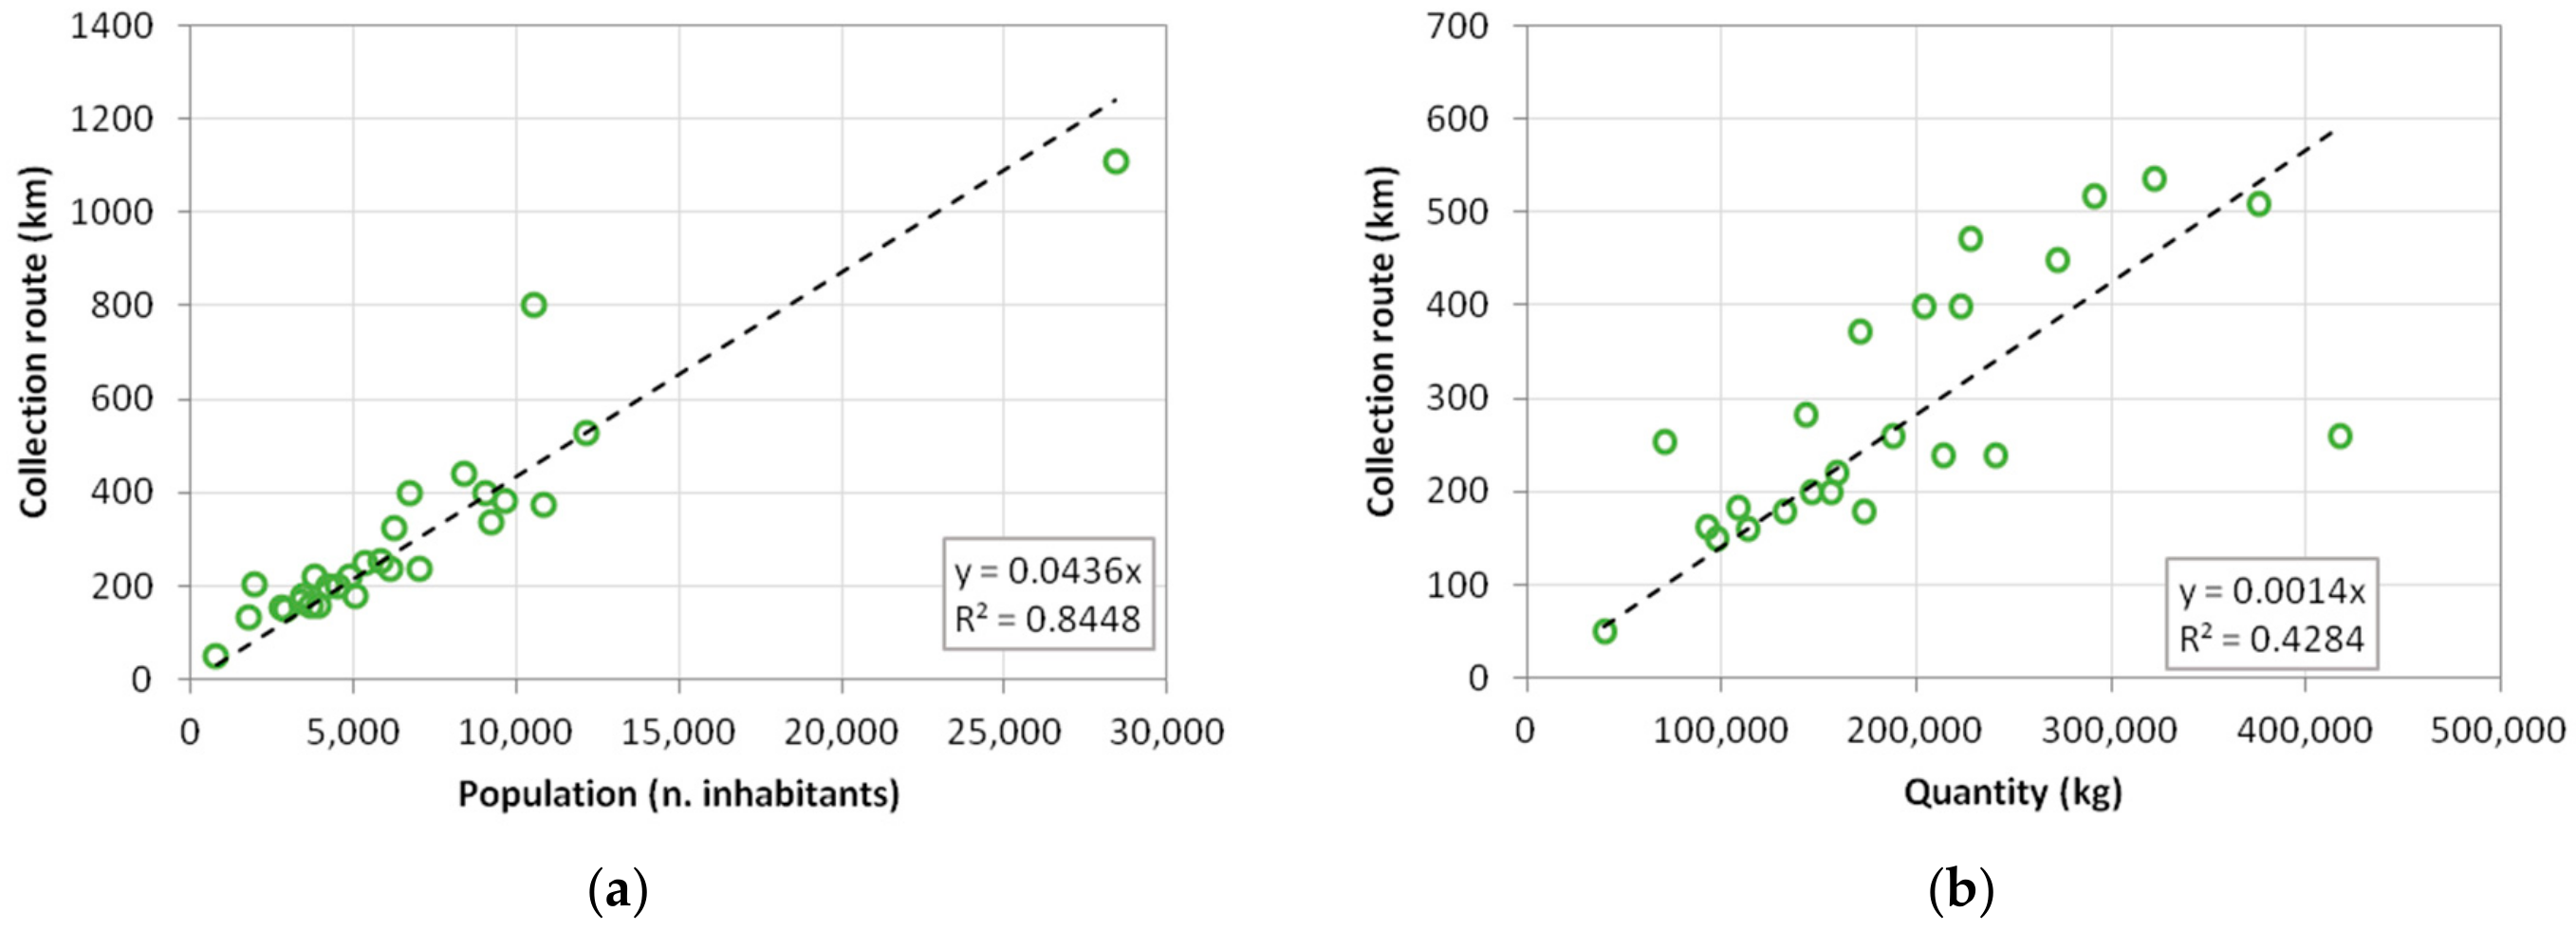
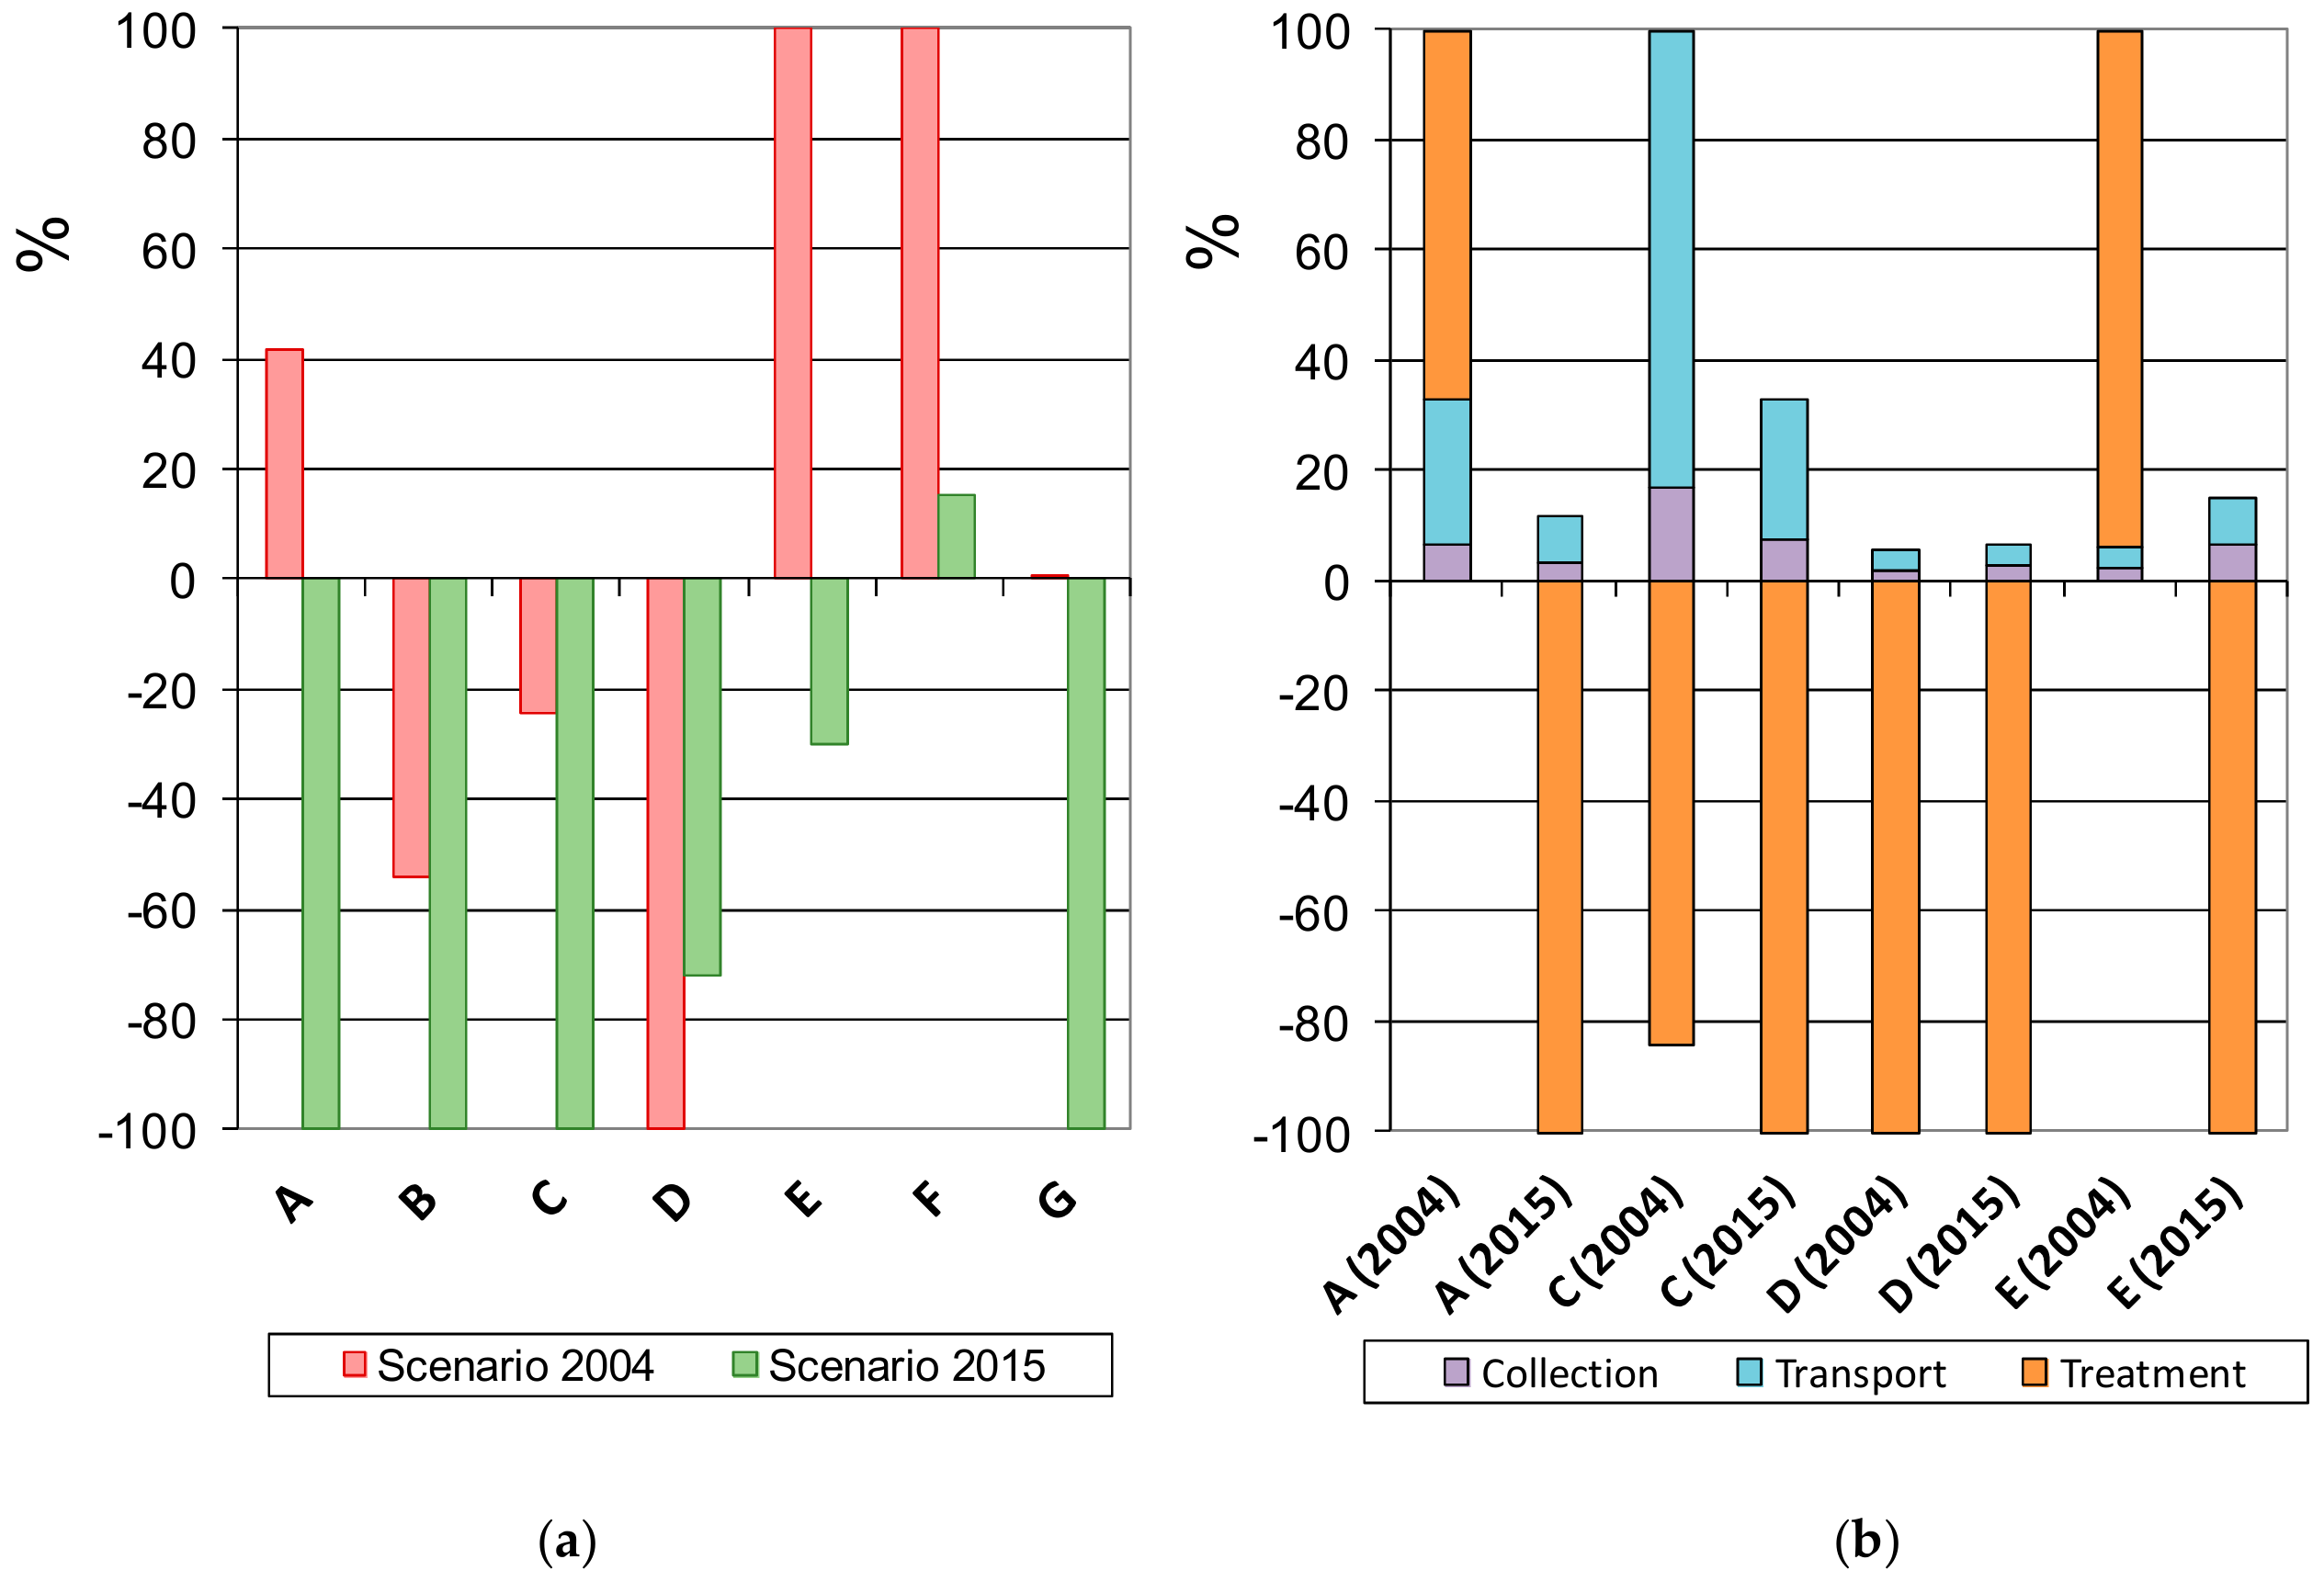
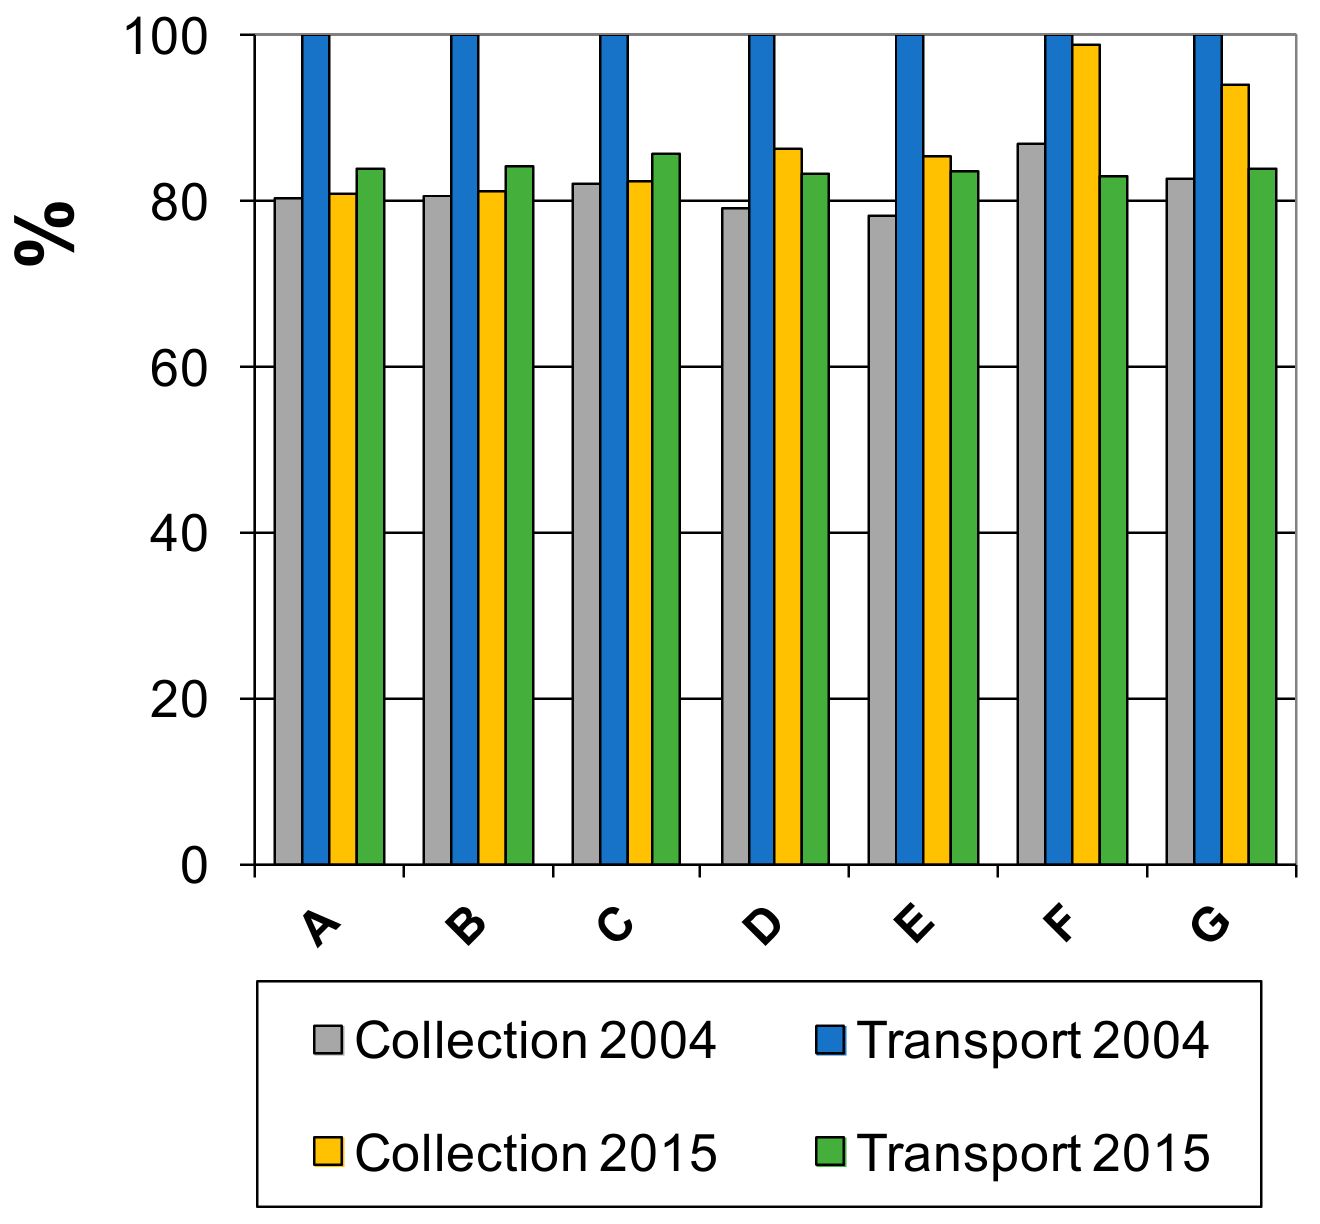
The collection and transport stages were shown to exert a lower contribution to impacts (the former in particular) compared to treatment. However, in addition to the optimization of the geographic location of the treatment plants, another improvement that may reduce the impacts of these phases is the change in type of collection/transport vehicles employed. To this regard, the consortium started substituting its vehicles with biomethane-fueled ones, since the anaerobic digestion plant treating the organic waste fraction was recently equipped with a biogas upgrading unit.
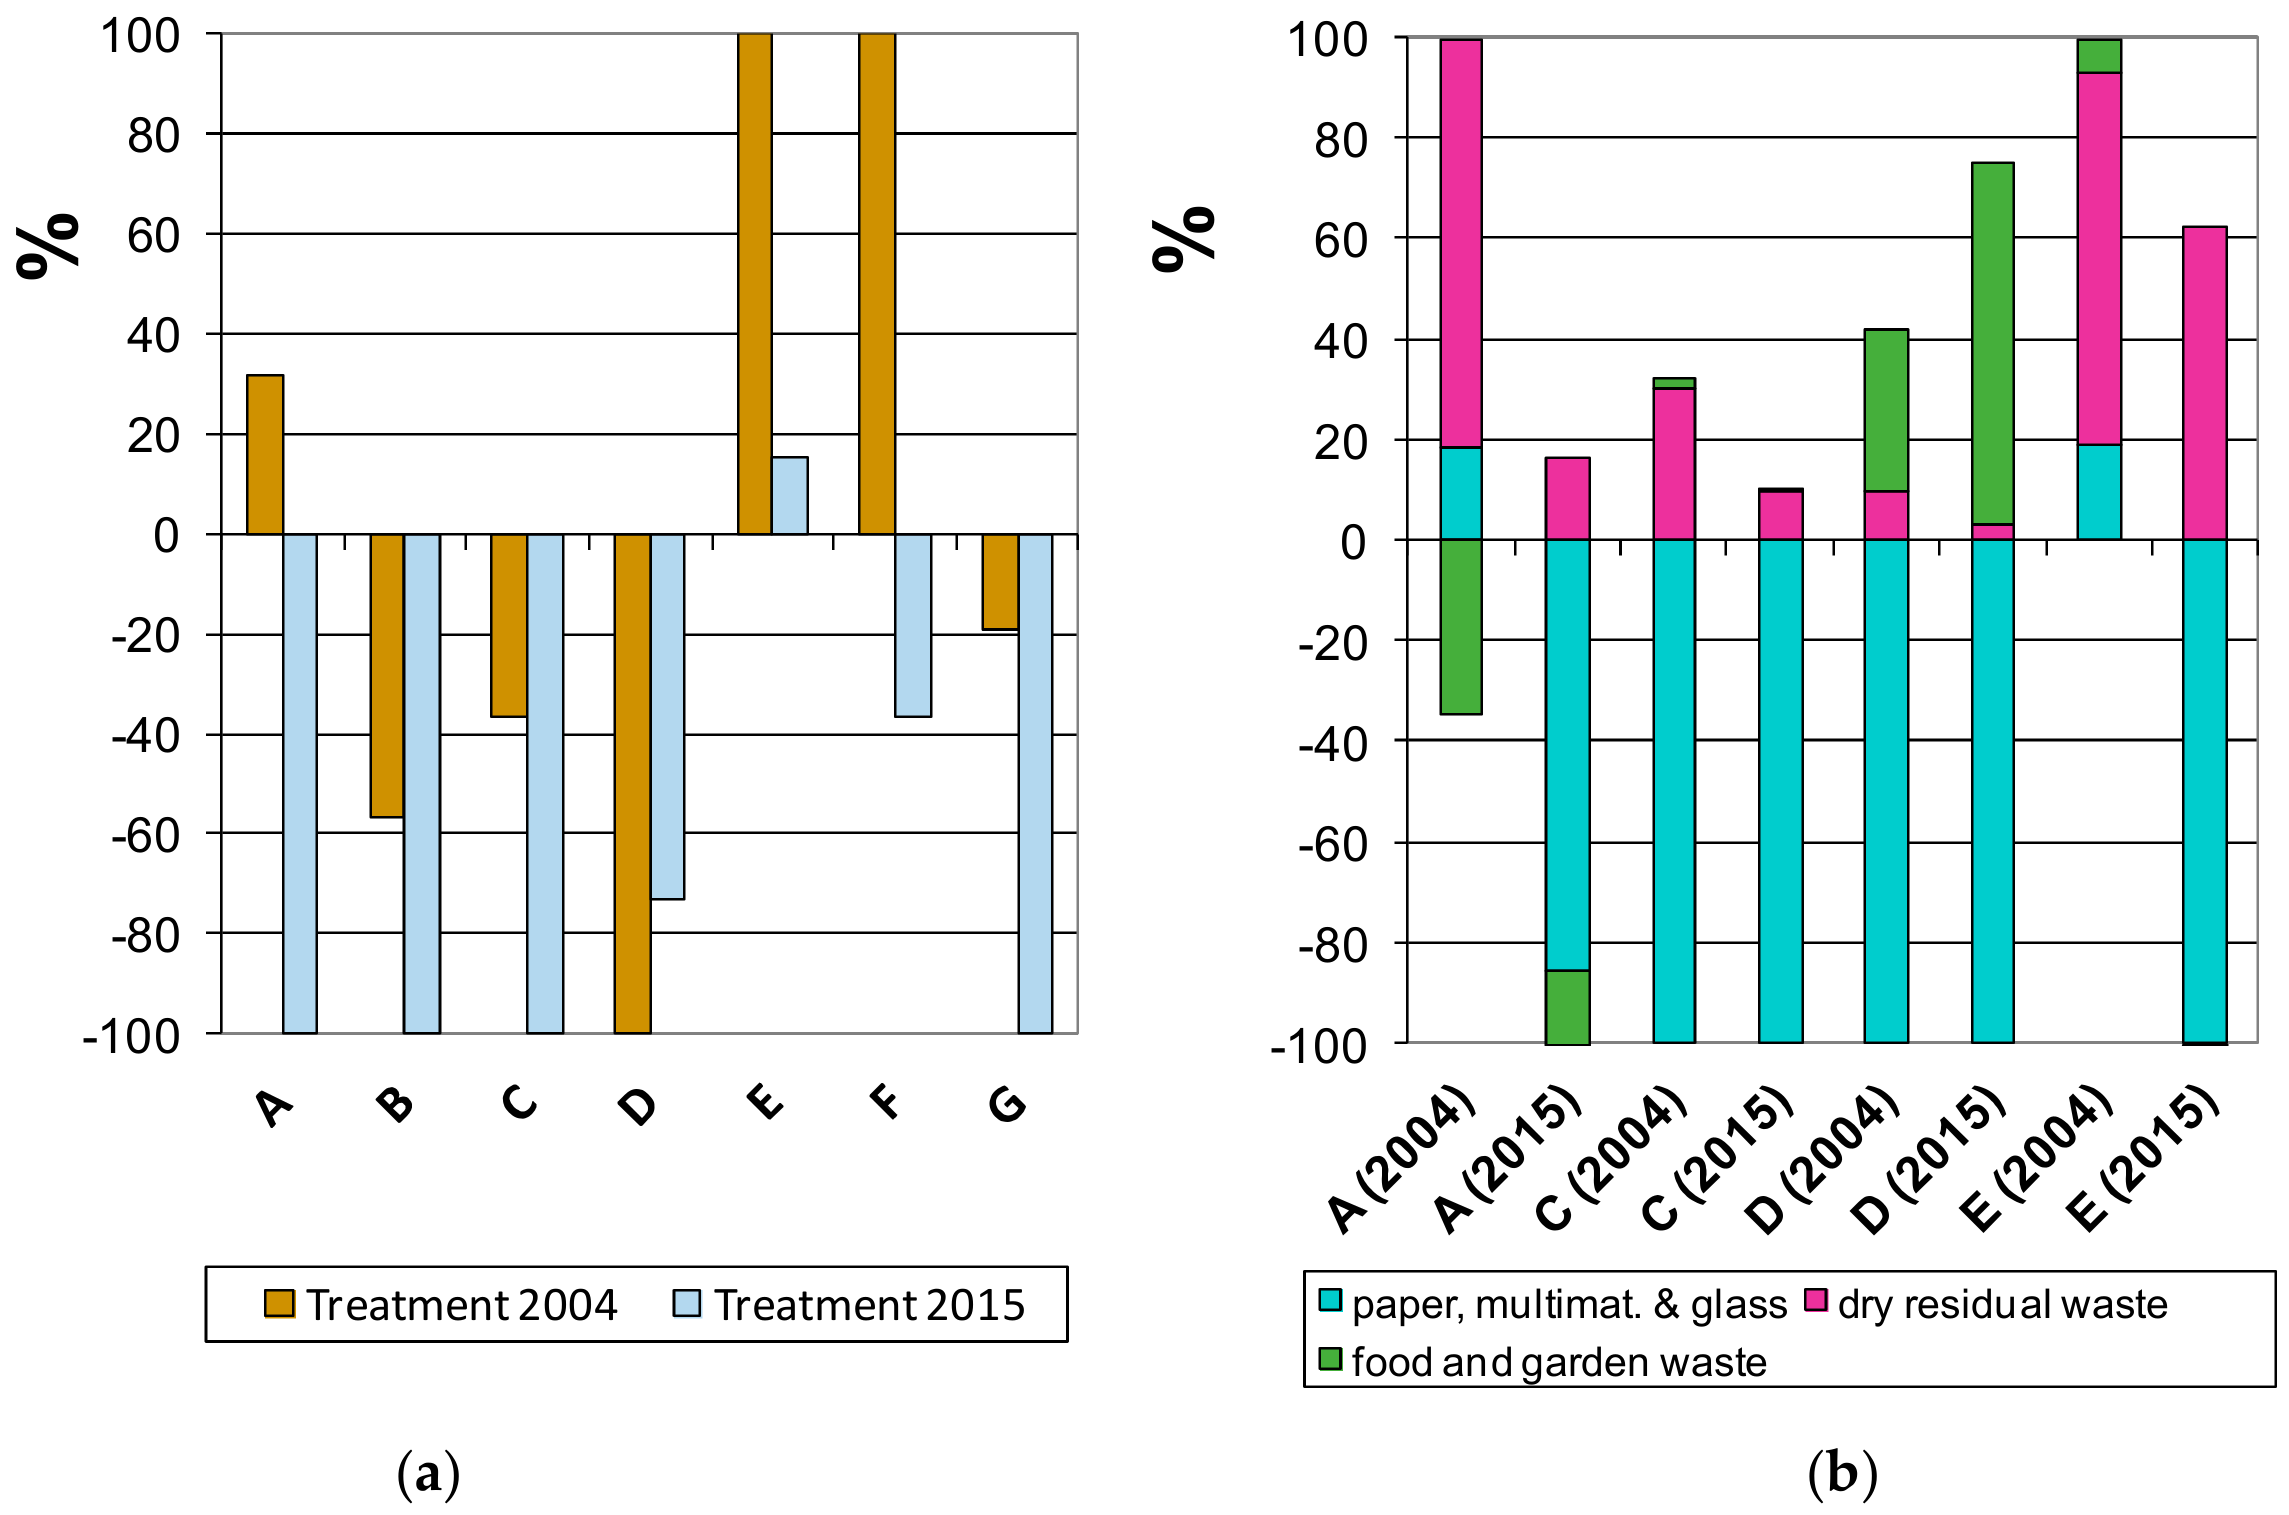
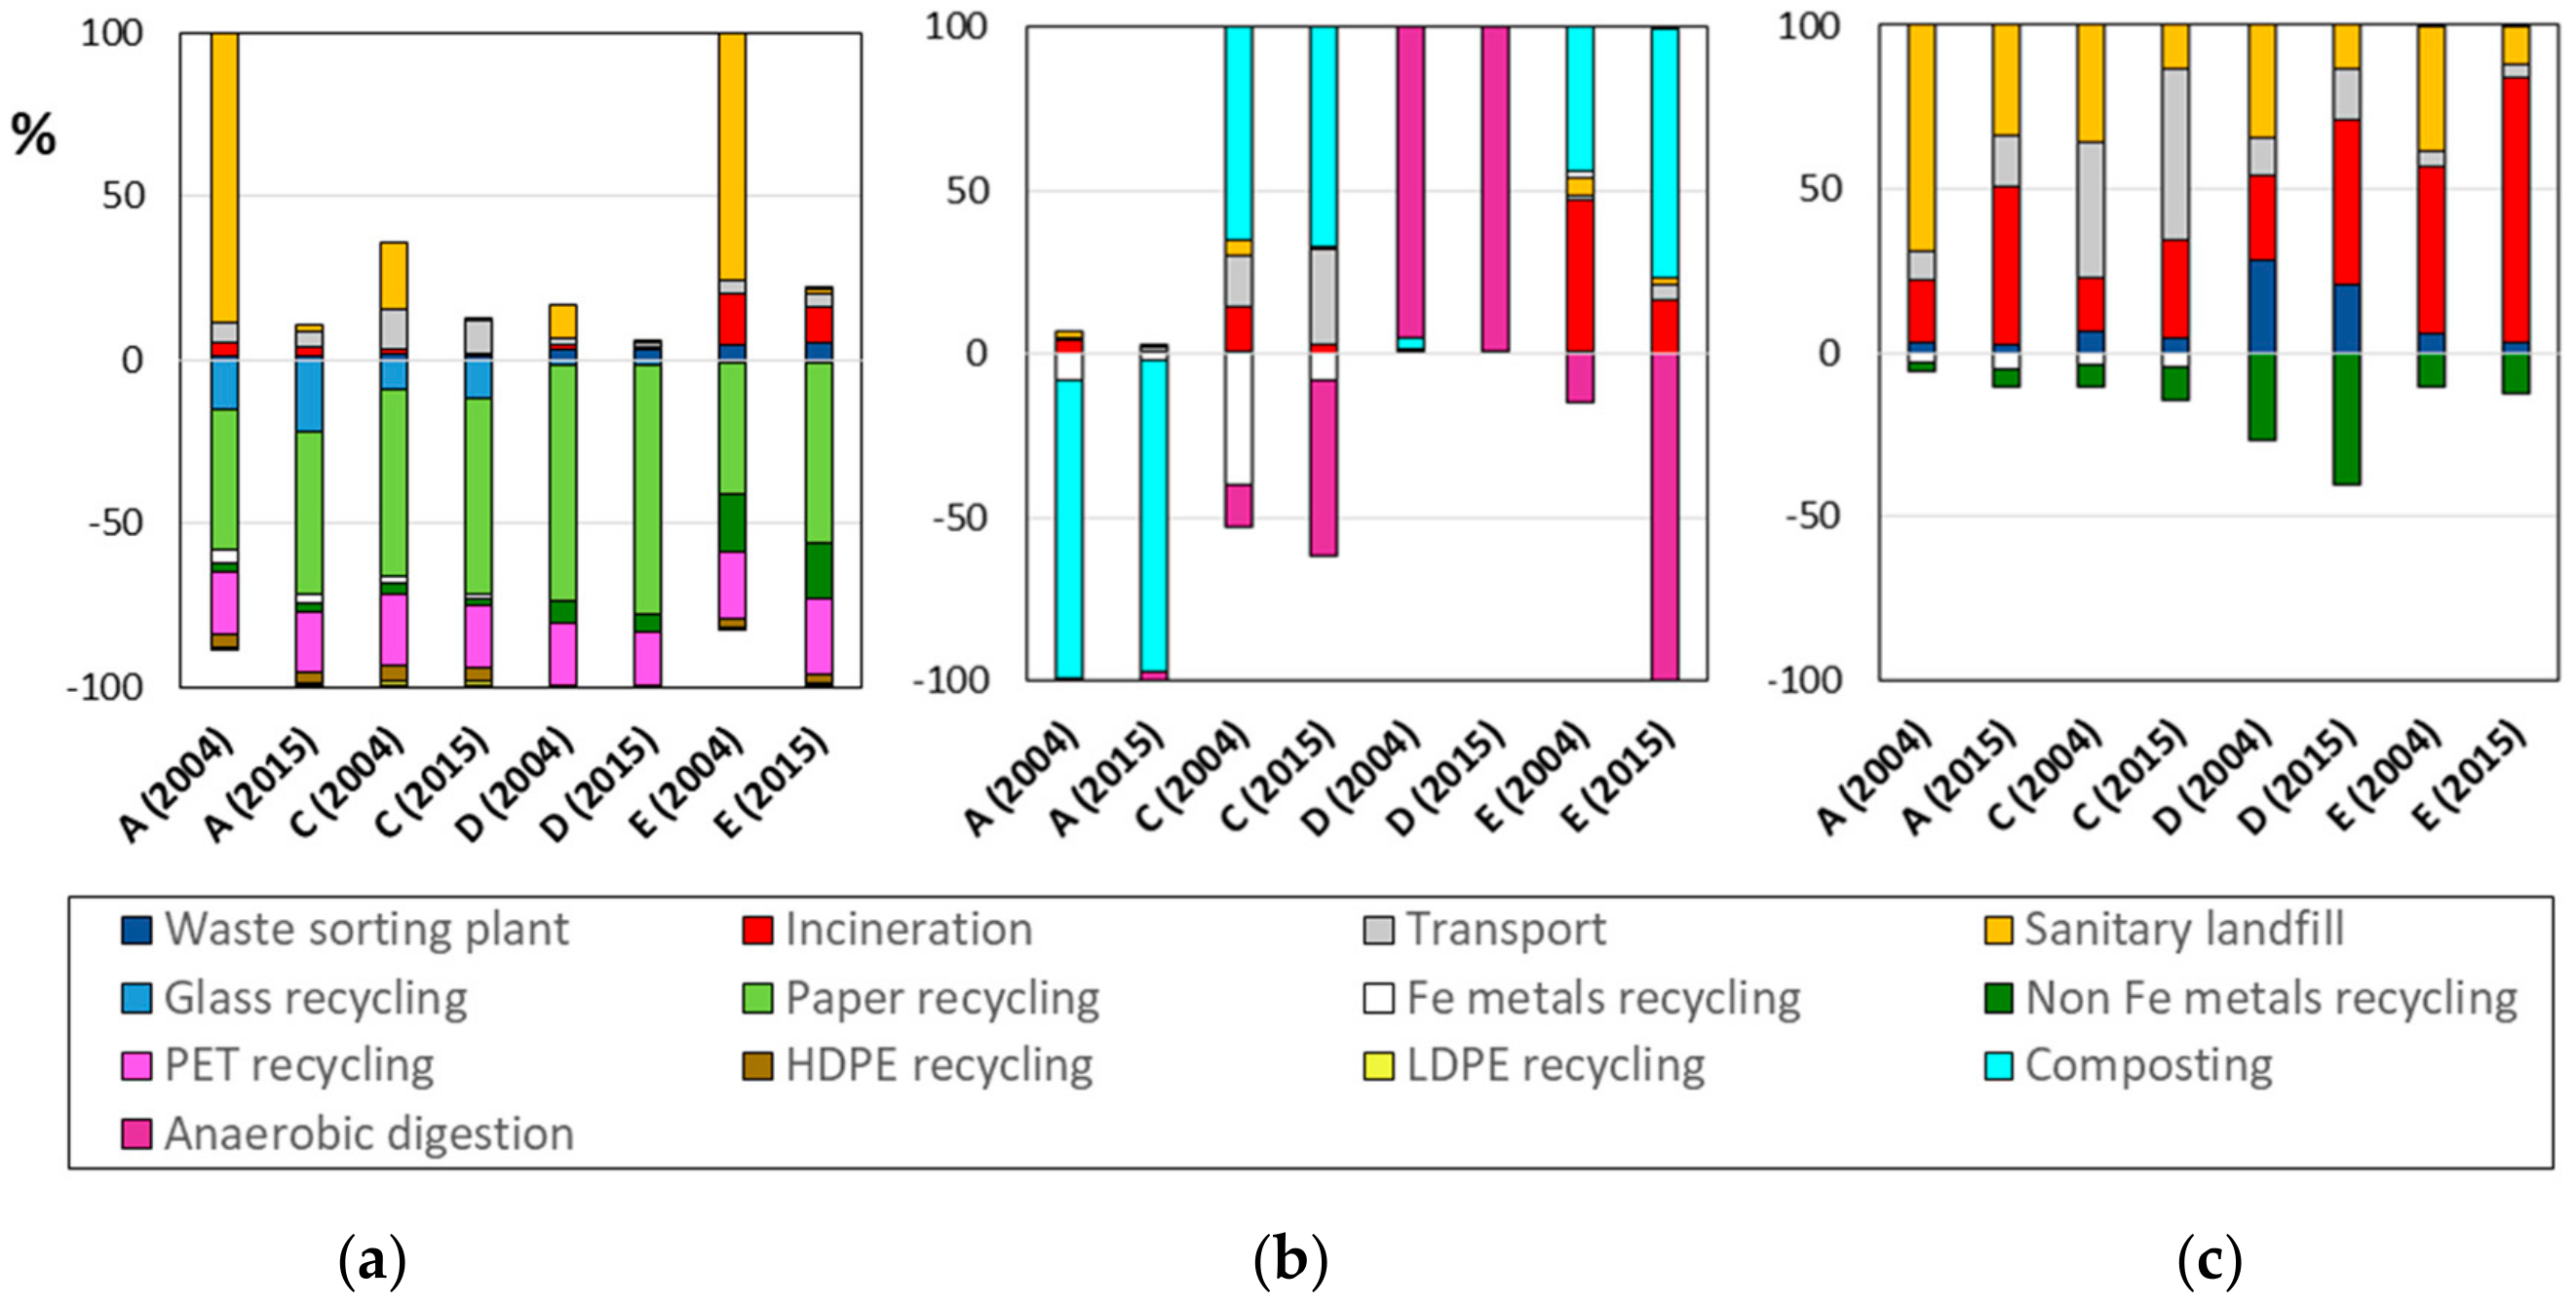
As for the treatment stage, material recycling, which was significantly promoted by the change in type of collection method, was shown to be a key contributor for reducing impacts. As for the treatment/disposal of residues, although there was an almost four-fold decrease in landfilling, ecotoxicity impacts were still positive. Therefore, in order to allow reducing impacts even more, further waste diversion from landfills, if feasible, should be pursued. With regard to the better performance found for eutrophication for the 2004 scenario compared to the 2015 one, it should be considered that the wastewater treatment model process that was used to estimate the emissions is less advanced with respect to the one implemented in the plant receiving the consortium’s organic waste; therefore, the impacts may have been overestimated. Also, in this case, a more accurate modeling of the process based on plant data could be performed.

Author Contributions

G.C. and F.L. conceived and designed the study; G.C., A.L., and F.L. analyzed the data and performed the calculations; G.C., A.L., and F.L. wrote the paper. G.C. revised the paper.

Funding

This research was partly funded by Consorzio per i Servizi di Igiene del Territorio—BacinoTV1.

Acknowledgments

The authors would like to acknowledge the important contributions received by Lorena Franz and Lucio Bergamin (ARPA Veneto), Gianpaolo Vallardi, Piergiorgio Tonon, and Roberta Nardi (Consorzio per i Servizi di Igiene del Territorio and Consiglio di Bacino “Sinistra Piave”), and Paola Muraro (ATIA ISWA Italy) with regard to the data and assumptions of the study. The authors would also like to acknowledge the contribution of the student Marco Popolla for the elaboration of the data.

Conflicts of Interest

The authors declare no conflicts of interest. The funders provided only the data on waste collection and transport and had no role in the design of the study, the analyses, or interpretation of the data, in the writing of the manuscript, or in the decision to publish the results.

Appendix A

Table A1. Example of data on collection and transport of the five considered waste fractions for one municipality referring to the year 2015.
FractionYearly Collected Amount [kg]Type of CollectionAnnual Collection FrequencyType of VehicleVehicle Capacity [kg]Length of Collection Round [km]Waste Transfer to Other VehicleTransfer StationDistance to Treatment Plant [km]Transport Distance [km]
Paper & cardb.140,050door to door243-axis compactor1170080NONO3636
Paper & cardb.140,050door to door24Small tipper65080YESNO36-
Multimaterial113,290door to door243-axis compactor1170080NONO3636
Multimaterial113,290door to door24Small tipper65080YESNO36-
Dry residuals145,700door to door243-axis compactor11700-NOYES3750
Dry residuals145,700door to door24Midi-compactor70090NONO3737
Dry residuals145,700door to door24Small tipper65050YESNO37-
Food waste237,040door to door104Dumper1900100NOYES7891
Food waste237,040door to door104Dumper1900101NOYES7891
Glass112,700door to door12Large tipper12000-NONO3636
Glass112,700door to door12Small tipper65080YESNO36-
Table A2. Impacts in terms of ton × km related to the yearly (a) collection and (b) transport of each type of vehicle, waste fraction, and scenario.
Collection (t*km)
Paper 2004Paper 2015Multimat 2004Multimat 2015Dry res 2004Dry res 2015Food w 2004Food w 2015Glass 2004Glass 2015Garden w 2004Garden w 2015
large tipper00000088,489101,700268,551448,22300
3-axis compactor339,810694,720225,984463,762120,38465,134000000
2-axis compactor39,27277,20834,64850,033102,13442,248000000
compactor031,960018,175102,82267,838000000
midi-compactor021,449015,74793,60967,079000000
small dumper000030422,67474,778128,387038,50500
dumper243,9618581174,2396950501,0620772,267685,074195,50230,04500
small tipper093,714070,175121,75891,917136,634193,734029,50600
porter01,8800144026801909663395170000
private cars000000000028,82044,800
tot623,043929,511434,871626,2821,047,491338,8001,078,8011,118,411464,053546,27928,82044,800
Transport (t*km)
Paper 2004Paper 2015Multimat 2004Multimat 2015Dry res 2004Dry res 2015Food w 2004Food w 2015Glass 2004Glass 2015Garden w 2004Garden w 2015
large tipper000000271,408229,173134,402227,90800
3-axis compactor178,833201,19673,692117,766131,18788,160000000
2-axis compactor21,03831,221943215,773215,76481,35600001,037,617837,896
compactor052,498029,82442,28678,651000000
midi-compactor010,3460551556,76048,051000000
small dumper000000146,263175,3800000
dumper68,192054,0920190,25301,632,360773,54423,159000
small tipper000017,64226,201367,829414,172033,08900
porter000000000000
private cars000000000000
tot268,063295,261137,216168,878653,892322,4182,417,8591,592,268157,560260,9971,037,617837,896
Table A3. Ecoinvent processes selected for inventory modeling.
Modelled ProcessEcoinvent Process Selected
Collection and transport vehicles
Large tipperFreight lorry, 16–32 mt, Euro 4, Glo, alloc def. U
3-axis compactorFreight lorry, >32 mt; Euro 4, Glo, alloc def. U
2-axis compactor21 mt lorry for waste collection service Glo, alloc def. U
Compactor21 mt lorry for waste collection service Glo, alloc def. U
DumperFreight lorry, 7.5–16 mt, Euro 4, Glo, alloc def. U
Midi-compactorFreight lorry, 3.5–7.5 mt, Euro 4, Glo, alloc def. U
Small dumperFreight lorry, 3.5–7.5 mt, Euro 4, Glo, alloc def. U
Small tipperFreight lorry, 3.5–7.5 mt, Euro 4, Glo, alloc def. U
PorterFreight lorry, 3.5–7.5 mt, Euro 4, Glo, alloc def. U
Treatment and recovered materials
SortingWaste sorting plant, RER, alloc def. U
IncinerationMSW incineration treatment, Italy, alloc def. U
LandfillingMSW sanitary landfill, alloc def. U
Transport vehicle to treatment plantFreight lorry, 16–32 mt, Euro 4, Glo, alloc def. U
Recovered glassContainer glass, production mix at plant RER S
Recovered paper and cardboardThermo-mechanical pulp {GLO}Alloc Def, U
Recovered IronSteel, liquid, at plant/RNA
Recovered AluminumAluminum, primary, ingot {GLO}| production alloc def. U
Recovered PETPolyethylene terephthalate, granulate, bottle grade {GLO}| alloc def. U
Recovered HDPEPolyethylene, high density, granulate {RER}| production | alloc def. U
Recovered LDPEPolyethylene, low density, granulate {RER}| production | alloc def. U
Recovered PPPolypropylene, granulate {RER}| production | alloc def. U
Table A4. Modeling of the food and garden waste processing plant treating one ton of waste.
Inputs/Processes/EmissionsAmounts
Biowaste composting
Inputs/processes
Peat moss for horticultural use−2 m3
Diesel1.4 kg
Composting facility4 × 10−6 p
Electricity low voltage, Italy0.024 MWh
Emissions to air
CO2 fossil4.55 kg
CO2 biogenic280 kg
Ammonia0.011 kg
Fine particle matter (PM10)0.021 kg
H2S0.00116 kg
Volatile Organic Compounds (VOC)0.0174 kg
Biowaste anaerobic digestion
Inputs/processes
Electricity low voltage, Italy−0.36 MWh
Treatment of wastewater from anaerobic digestion of whey8.45 m3
Anaerobic digestion plant with methane recovery6 × 10−5 p
Electricity low voltage, Italy0.0102 MWh
Emissions to air
CH41 kg
Table A5. Overall environmental impacts of the two analyzed scenarios for all categories included in the International Reference Life-Cycle Data System (ILCD) 2011 midpoint method.
Impact CategoryUnitScenario 2004 Scenario 2015
Climate changekg CO2 eq14.3 × 106−34.6 × 10⁶
Stratospheric ozone depletionkg CFC-11 eq−0.5−1.5
Human toxicity, cancer effectsCTUh1.6−0.5
Human toxicity, non cancer effectsCTUh113.18.0
Particle matterkg PM2.5 eq−1.4 × 10⁴−2.5 × 10⁴
Ionizing radiationkBq U235 eq−3.7 × 10⁶−6.7 × 10⁶
Ionizing radiation E (interim)CTUe−9.0−18.3
Photochemical ozone formationkg NMVOC eq−2.3 × 10⁴−9.6 × 10⁴
Acidificationmolc H+ eq−1.4 × 10⁵−2.6 × 10⁶
Terrestrial eutrophicationmolc N eq−1.2 × 10⁵−3.1 × 10⁵
Freshwater eutrophicationkg P eq−3821.1−2748.3
Marine eutrophicationkg N eq1.4 × 1054.8 × 105
Freshwater ecotoxicityCTUe9.0 × 1091.4 × 109
Land usekg C deficit−5.0 × 10⁶−3.0 × 10⁷
Water usem3 water eq−3.3 × 10⁷−6.0 × 10⁷
Mineral, fossil, and renewable resource depletionkg Sb eq2.3−329.5

References

  1. ISPRA, Italian Superior Institute for Environmental Research and Protection. Urban Waste Report, 2018 ed.; report 297; ISPRA: Rome, Italy, 2018; ISBN 978-88-448-0928-7. (In Italian)
  2. Legislative Decree n.152 of April 3rd 2006. Norms on Environmental Issues; Gazzetta Ufficiale n. 88 of April 14th 2006. (In Italian)
  3. Ragazzi, M.; Fedrizzi, S.; Ciudin, R.; Rada, E.C.; Cioca, L.I.; Ionescu, G. Experiencing Urban Mining in an Italian Municipality towards a Circular Economy vision. Energy Procedia 2017, 119, 192–200. [Google Scholar]
  4. Rada, E.C.; Zatelli, C.; Cioca, L.I.; Torretta, V. Selective collection quality index for municipal solid waste management. Sustainability 2018, 10, 257. [Google Scholar]
  5. De Feo, G.; Malvano, C. The use of LCA in selecting the best MSW management system. Waste Manag. 2009, 29, 1901–1915. [Google Scholar]
  6. Rigamonti, L.; Grosso, M.; Giugliano, M. Life cycle assessment for optimising the level of separated collection in integrated MSW management systems. Waste Manag. 2009, 29, 934–944. [Google Scholar]
  7. Hoornweg, D.; Bhada-Tata, P. What a Waste—A Global Review of Solid Waste Management; Urban Development Series Knowledge Papers, 15; World Bank: Washington DC, USA, 2012. [Google Scholar]
  8. Van Zomeren, A.; Tosti, L. Is Recycling the Solution for the Reduction of Our Raw Materials Demand? ECN-E--17-060 report; ECN: Petten, The Netherlands, 2018.
  9. Directive 2018/851 of the European Parliament and the Council of 30 May 2018 amending Directive 2008/98/CE on waste. Off. J. Eur. Union 2018, L 150, 109–140.
  10. Directive 2018/852 of the European Parliament and the Council of 30 May 2018 amending Directive 94/62/EC on packaging and packaging waste. Off. J. Eur. Union 2018, L 150, 141–154.
  11. Directive 2018/850 of the European Parliament and the Council of 30 May 2018 amending Directive 1999/31/EC on the landfill of waste. Off. J. Eur. Union 2018, L 150, 100–108.
  12. Ionescu, G.; Rada, E.C.; Ragazzi, M.; Mărculescu, C.; Badea, A.; Apostol, T. Integrated municipal solid waste scenario model using advanced pretreatment and waste to energy processes. Energy Convers. Manag. 2013, 76, 1083–1092. [Google Scholar]
  13. Tascione, V.; Raggi, A. Identification and selection of alternative scenarios in LCA studies of integrated waste management systems: A review of main issues and perspectives. Sustainability 2012, 4, 2430–2442. [Google Scholar]
  14. Blengini, G.A.; Fantoni, M.; Busto, M.; Genon, G.; Zanetti, M.C. Participatory approach, acceptability and transparency of waste management LCAs: Case studies of Torino and Cuneo. Waste Manag. 2012, 32, 1712–1721. [Google Scholar]
  15. Rigamonti, L.; Falbo, A.; Grosso, M. Improvement actions in waste management systems at the provincial scale based on a life cycle assessment evaluation. Waste Manag. 2013, 339, 2568–2578. [Google Scholar]
  16. ARPAV, Direzione Tecnica Servizio Osservatorio Rifiuti. Urban Waste in the Sinistra Piave Basin. 2015. (In Italian). Available online: http://www.arpa.veneto.it/temi-ambientali/rifiuti/file-e-allegati/ru2015/SINISTRA%20PIAVE.pdf (accessed on 27 March 2019).
  17. ARPAV, Direzione Tecnica Servizio Osservatorio Rifiuti. Urban Waste in the Sinistra Piave Basin; ARPAV: Venice, Italy, 2004. (In Italian) [Google Scholar]
  18. ARPAV. The Recovery of Recyclable Dry Fractions in Veneto Region (in Italian). 2006. Available online: http://www.arpa.veneto.it/temi-ambientali/rifiuti/file-e-allegati/RECUPERO_FRAZIONI.pdf (accessed on 24 April 2019).
  19. Rigamonti, L.; Grosso, M.; Giugliano, M. Life cycle assessment of sub-units composing a MSW management system. J. Clean. Prod. 2010, 18, 1652–1662. [Google Scholar]
  20. Wernet, G.; Bauer, C.; Steubing, B.; Reinhard, J.; Moreno-Ruiz, E.; Weidema, B. The ecoinvent database version 3 (part I): Overview and methodology. Internat. J. Life Cycle Assess. 2016, 21, 1218–1230. [Google Scholar]
  21. Frischknecht, R.; Jungbluth, N.; Althaus, H.-J.; Doka, G.; Dones, R.; Heck, T.; Hellweg, S.; Hischier, R.; Nemecek, T.; Rebitzer, G.; et al. The ecoinvent database: Overview and methodological framework. Internat. J. Life Cycle Assess. 2005, 10, 3–9. [Google Scholar]
  22. EC-JRC. Characterisation Factors of the ILCD Recommended Life Cycle Impact Assessment Methods, 1st ed. Database and Supporting Information European Union EUR 25167 EN, Luxembourg. 2012. Available online: http://eplca.jrc.ec.europa.eu/uploads/LCIA-characterization-factors-of-the-ILCD.pdf (accessed on 24 April 2019).
  23. EC-JRC. International Reference Life Cycle Data System (ILCD) Handbook—Recommendations Based on Existing Environmental Impact Assessment Models and Factors for Life Cycle Assessment in European Context. European Union EUR 24571 EN Luxembourg. 2011. Available online: http://eplca.jrc.ec.europa.eu/uploads/ILCD-Recommendation-of-methods-for-LCIA-def.pdf (accessed on 24 April 2019).
  24. Hauschild, M.Z.; Goedkoop, M.; Guinée, J.; Heijungs, R.; Huijbregts, M.; Joillet, O.; Margni, M.; De Schryver, A.; Humbert, S.; Laurent, A.; et al. Identifying best existing practice for characterization modeling in life cycle impact assessment. Int. J. Life Cycle Assess. 2013, 18, 683–697. [Google Scholar]
  25. Buttol, P.; Masoni, P.; Bonoli, A.; Goldoni, S.; Belladonna, V.; Cavazzuti, C. LCA of integrated MSW management systems: Case study of the Bologna District. Waste Manag. 2007, 27, 1059–1070. [Google Scholar]
  26. Bovea, M.D.; Ibáñez-Forés, V.; Gallardo, A.; Colomer-Mendoza, F.J. Environmental assessment of alternative municipal solid waste management strategies. A Spanish case study. Waste Manag. 2010, 30, 2383–2395. [Google Scholar]
  27. Ibáñez-Forés, V.; Bovea, M.D.; Coutinho-Nóbrega, C.; de Medeiros-García, H.R.; Barreto-Lins, R. Temporal evolution of the environmental performance of implementing selective collection in municipal waste management systems in developing countries: A Brazilian case study. Waste Manag. 2018, 62, 65–77. [Google Scholar]
  28. Cherubini, F.; Bargigli, S.; Ulgiati, S. Life cycle assessment (LCA) of waste management strategies: Landfilling, sorting plant and incineration. Energy 2009, 34, 2116–2123. [Google Scholar]
Figure 1. Scheme of the main management phases considered for each of the six waste fractions collected in the Sinistra Piave Basin in the two selected years.
Sustainability 11 02810 g001
Figure 2. Amounts of the six selected waste fractions collected in the Sinistra Piave Basin in the two selected years.
Sustainability 11 02810 g002
Figure 3. Examples of correlations employed to derive collection route data for (a) the dry residual fraction, and (b) glass.
Sustainability 11 02810 g003
Figure 4. Percentage contribution to the impacts in terms of ton × km related to the (a) collection and (b) transport of each type of fraction for the two scenarios as a function of the vehicle type; vehicle capacities: large tipper (12 t), three-axis compactor (11.7 t), two-axis compactor (5.65 t), compactor (4.6 t), dumper (1.9 t), midi-compactor (0.7 t), small dumper (0.7 t), small tipper (0.65 t), and porter (0.435 t).
Sustainability 11 02810 g004
Figure 5. Environmental impacts (see Table 4) in terms of characterization for the two scenarios considered: (a) overall comparison; (b) analysis of the contribution to four types of impacts of the three main management phases.
Sustainability 11 02810 g005
Figure 6. Comparison of impacts (see Table 4) in terms of characterization for the collection and transport stages for the two scenarios considered.
Sustainability 11 02810 g006
Figure 7. Contributions to the impacts (see Table 4) of (a) the collection and (b) transport phases in terms of the different fractions for four types of impacts and the two scenarios.
Sustainability 11 02810 g007
Figure 8. (a) Comparison of impacts (see Table 4) in terms of characterization for the treatment stage for the two scenarios considered; (b) analysis of the contribution to four types of impacts of the treatment of the different types of fractions.
Sustainability 11 02810 g008
Figure 9. Analysis of the contribution to four types of impacts (see Table 4) for (a) paper, multi-material, and glass treatment; (b) food and garden waste treatment; and (c) dry residual waste management.
Sustainability 11 02810 g009
Table 1. Key data on municipal solid waste (MSW) production in the Sinistra Piave Basin for the 2004 and 2015 scenarios, reporting the amounts and % contents of the selected fractions examined in this study [16,17].
Key DataScenario 2004 Scenario 2015
Area extension (km2)1107.7 1107.7
Number of inhabitants298,304 308,365
Total amount of MSW collected (t)98,212 104,832
Selected fractions
Amounts (t)(%)Amounts (t)(%)
Paper and cardboard11,72214.216,10918.3
Food waste18,91422.923,34726.5
Garden waste934611.314,03915.9
Multi-material (plastics and metals)905911.0924210.5
Glass59997.311,85213.4
Residual dry waste27,37833.213,57915.4
Total amount of selected fractions82,419100.088,169100.0
Table 2. Amounts of waste treated, sorted, or disposed of, as well as amounts of recycled fractions, for the two analyzed scenarios. PET—polyethylene terephthalate; HDPE—high-density polyethylene; LDPE—low-density polyethylene; PP—polypropylene.
Scenario 2004 (t)Scenario 2015 (t)
Treated waste
Sanitary landfilling24‚798.46648.7
Incineration8735.19737.1
Mechanical sorting66‚597.360‚759.1
Composting25‚434.426‚170.2
Anaerobic digestion2826.011‚215.8
Recovered fractions
Glass for recycling5990.111‚835.1
Paper for recycling8867.714‚024.3
Fe for recycling1075.1885.7
Al for recycling87.492.5
PET for recycling2151.62832.9
HDPE for recycling732.8964.8
LDPE for recycling171.0225.1
PP for recycling73.396.5
Compost for recycling4280.85301.8
Table 3. Recycling yields for the two analyzed scenarios and European Union (EU) targets for 2025 (recycling) or 2035 (landfilling) [9,10,11].
Scenario 2004
(%)
Scenario 2015
(%)
Targets
(%)
MSW for recycling57.577.5≥55
Packaging waste for recycling71.583.2≥65
Paper for recycling75.787.1≥75
Glass for recycling99.999.9≥70
Multi-material (plastics and metals) for recycling47.455.2≥50 plastics and Al, ≥70 Fe
Landfilling30.17.5≤10
Table 4. Overall impacts for selected categories resulting for the two analyzed scenarios, with NMVOC: Non Methane Volatile Organic Compounds; CTUh: Comparative Toxic Unit for humans; CTUe: Comparative Toxic Unit for the ecosystem.
Impact CategoryUnitScenario 2004 Scenario 2015
Climate change (A)kg CO2 eq14.3 × 106−34.6 × 10⁶
Acidification (B)molc H+ eq−1.4 × 10⁵−2.6 × 10⁶
Photochemical ozone formation (C)kg NMVOC eq−2.3 × 10⁴−9.6 × 10⁴
Freshwater eutrophication (D)kg P eq−3821.1−2748.3
Human toxicity, cancer effects (E)CTUh1.56−0.47
Freshwater ecotoxicity (F)CTUe8.99 × 1091.37 × 109
Mineral, fossil, and renewable resource depletion (G)kg Sb eq2.3−329.5

