Landscape-Based Assessment of Urban Resilience and Its Evolution: A Case Study of the Central City of Shenyang

1
School of Geographical Sciences, Northeast Normal University, Changchun 130024, China
2
Jangho Architecture College, Northeastern University, Shenyang 110169, China
3
Department of Geography and Geosciences, University of Louisville, Louisville, KY 40292, USA
*
Author to whom correspondence should be addressed.
Sustainability 2019, 11(10), 2964; https://0-doi-org.brum.beds.ac.uk/10.3390/su11102964
Submission received: 24 April 2019
/
Revised: 17 May 2019
/
Accepted: 22 May 2019
/
Published: 24 May 2019
(This article belongs to the Collection Indicators, Assessment Tools, and Rating Systems for Mainstreaming Sustainability in Urban Planning and Development)
Abstract
:Urban resilience is increasingly considered a useful approach to accommodate uncertainties while achieving sustainability in urban systems, especially in the context of rapid urbanization and global environmental change. However, current research on the quantitative assessment of urban resilience is limited. This study introduces four proxies of urban resilience, i.e., diversity, connectivity, decentralization, and self-sufficiency, and the perspective of the urban landscape for the measurement of urban resilience and further guidance on planning practices by establishing connections between resilience potential and landscape characteristics. Using multi-source data and employing landscape-based analysis methods, urban resilience is investigated from 1995 to 2015 in the central city of Shenyang. The results indicate that the composition and configuration of the urban landscape changed significantly during this period, which had a great influence on urban resilience. The temporal and spatial evolution of urban resilience showed obviously directional preferences and an evident distance effect. Overall, the resilience level increased slightly, while the internal differences experienced a declining trend. The four characteristics can be deployed as practical principles to shape urban resilience. The adjustment and trade-offs of these aspects to enhance responsive structures and simultaneously maintain sustainable ecosystem services can be effective ways to realize long-term resilience.
1. Introduction
Rapid urbanization plays a vital role in concentrating quality human capital and increasing social prosperity. However, it also acts as a major force of deterioration in the living environment from the local to the global scale in complex and irreversible ways [1]. Along with the accelerated process of the densification and expansion of impermeable surfaces in modern cities, significant negative consequences have emerged that are becoming increasingly prominent. These consequences are particularly exacerbated in the context of global climate change [2] (pp. 35–42) [3]. Currently, urban areas are being exposed, to varying degrees, to challenges ranging from daily disorders to permanent damage, including urban diseases such as traffic jams and air pollution, extreme weather events, and a variety of natural and man-made disasters. Given that the majority of the world’s population now lives in cities and this situation will follow a growing trend in the foreseeable future, focusing on the resilience and sustainability of cities is imperative and should be given precedence [4,5,6].
Resilience is a historical concept with distinct definitions. It mainly refers to the ability of systems to persist, absorb, and recover from the effects of threats and adversities in a timely and resourceful manner [7] (pp. 31–32) [8]. Resilience-related research stems from engineering and has continued to develop in the field of ecology. In recent decades, the study of resilience has arisen in multiple disciplines, with a special focus on urban resilience [9,10]. When this concept is introduced to the urban system, which is considered a complex adaptive system, more comprehensive connotations of resilience have been developed [8]. Urban resilience has thus become a buzzword, frequently emerging in a variety of documents and discourses, but it is conceptualized differently, depending on different knowledge backgrounds and research purposes. Collectively, three paradigms are common, i.e., engineering resilience, ecological resilience, and social-ecological resilience. The engineering perspective that is characterized by efficiency and constancy is widely gaining recognition in infrastructure reinforcement projects. The ecological perspective that emphasizes persistence and change to maintain basically the same structure, function, and identity is used in hazard management and ecosystem conservation. The social-ecological perspective that focuses on dynamic interactions between social and ecological systems across multiple temporal and spatial scales is widely considered key to building adaptive capacity and transformability in the broad context of social-ecological systems [11,12,13]. The integrative and vague essence of urban resilience makes it a malleable concept, which is beneficial from multiple perspectives for the evolution to a desirable development trajectory by embracing the ability to change as flexibly as possible over time [14,15].
Generally, the term urban resilience is used to express the abilities of urban systems to absorb, adapt to, and transform when dealing with uncertain challenges [13,16,17]. Compared with the conventional paradigm of risk management (e.g., disaster reduction and relief strategies), which passively relies on rigid engineering measures and works for a relatively short time, urban resilience advocates the use of active solutions to co-exist with uncertainties through the inherent adaptive capabilities of urban systems based on coordination and cooperation between their internal components [18,19]. Furthermore, the resilience of an urban system involves reactions during and after both acute shocks and chronic stresses. This allows for the cultivation of a wider adaptive capacity that is conducive to improved resilience during development through the ongoing process of experiential learning, especially from failures that were previously ignored [20]. In addition, the insights of urban resilience provide a new approach for urban systems to achieve sustainable development, which are mainly drawn from social-ecological resilience. Within the framework of social-ecological systems, urban systems are recognized as intertwined social and ecological systems in which long-term development and evolution require a harmonious and mutually promoted relationship between the social and ecological components. This further informs that it is the integration of social and ecological considerations that contributes to the sustainability of urban systems, instead of overemphasizing one while overlooking the other. Moreover, the social-ecological systems pay more attention to the capacity to adapt and transform, which is significantly affected by ecosystem services. Given that cities currently pose the challenges of double exposure to rapid urbanization and global climate change, inspirations arising from the holistic and systematic thinking of social-ecological systems are of great significance for urban systems to transition toward livability and sustainability. Enhancing the resilience of urban systems is recognized to be the long-acting mechanism for improving human well-being and achieving sustainability [14,21].
Although it remains a relatively novel concept, urban resilience has become an increasingly favored topic [6,22]. Nevertheless, despite the wide consensus regarding the importance and urgency of urban resilience for coping with uncertainties, underdeveloped gray areas remain in this concept [23]. Most existing studies on this topic elaborate on its theoretical connotations and implications [9,13,24], while a smaller number of empirical studies consider the vulnerability and resilience of cities to specific disasters (e.g., flooding and earthquakes) and thus make efforts to propose targeted mitigation strategies [25,26,27,28]. These studies have reference significance, but also have limitations. One of the most common issues is the inadequate conceptualization of urban resilience. In fact, resilience is an intrinsic property of urban systems with a more inclusive meaning beyond mitigating vulnerability. It is also related to human well-being and sustainability, while vulnerability correlates with the possibility of exposure to disasters. In terms of the paths to disaster resilience, engineering approaches that demonstrate enhanced persistence are often encouraged. However, it should be noted that, despite the importance, an excessive concentration on engineering measures will risk destroying the long-term flexibility and adaptability of urban systems. In summary, although urban resilience has attracted growing attention and its theoretical discussion and interpretation are common, there is a clear deficiency in relation to its measurement and operationalized application, particularly in fields serving urban planning and design practices. Further study to remedy this gap is obviously needed.
The main objective of this research is to propose an operational framework with the aim of contributing to progress on the quantitative assessment of urban resilience and further informing planning practice with respect to the urban social-ecological system. Based on urban landscapes, this study explores the spatial characteristics of urban resilience and its evolution by establishing the connections between landscape-based indicators and resilience potential. A close relationship is confirmed between the composition, configuration, and dynamics of the urban landscape and urban resilience [6]. As a complex system shaped by human-nature interactions, the urban landscape may serve as a lens through which the evolution of the urban system is reflected. Additionally, it is apparent that reasonable landscape allocation plays an important role in buffering risks and helps the urban system recover quickly from disturbances. Furthermore, from the perspective of the social-ecological system, the optimized distribution of the social landscape (which is represented by built-up land and can reflect the potential of social factors such as social institutions and social capital to deal with uncertain changes to some extent) and the ecological landscape (which is represented by natural or semi-artificial land and enables the provision of ecosystem services) is beneficial for the collaborative influence of social adaptability and ecological benefits, thus leading the urban system to a livable and sustainable state [29]. More importantly, because landscape characteristics can be expressed intuitively by using the tools and methodologies of landscape ecology (e.g., landscape metrics), the introduction of urban landscapes will facilitate the measurement, interpretation, and visualization of urban resilience. In addition, urban landscapes are useful as carriers for human interventions to shape resilience potential. In short, urban landscapes that can reflect and in turn be shaped by social-ecological interactions enable an available and effective medium for the quantification and operationalization of urban resilience.
This is the context in which the current investigation is conducted. The remainder of the paper is structured as follows. Section 2 introduces the study area, data sources, and research methods. The results of the characteristics and the spatial and temporal evolution of urban resilience, as well as the related analysis, are presented in Section 3. Section 4 further discusses the findings, suggestions, and limitations of this research. The concluding remarks are summarized in Section 5.
2. Materials and Methods
2.1. Study Area
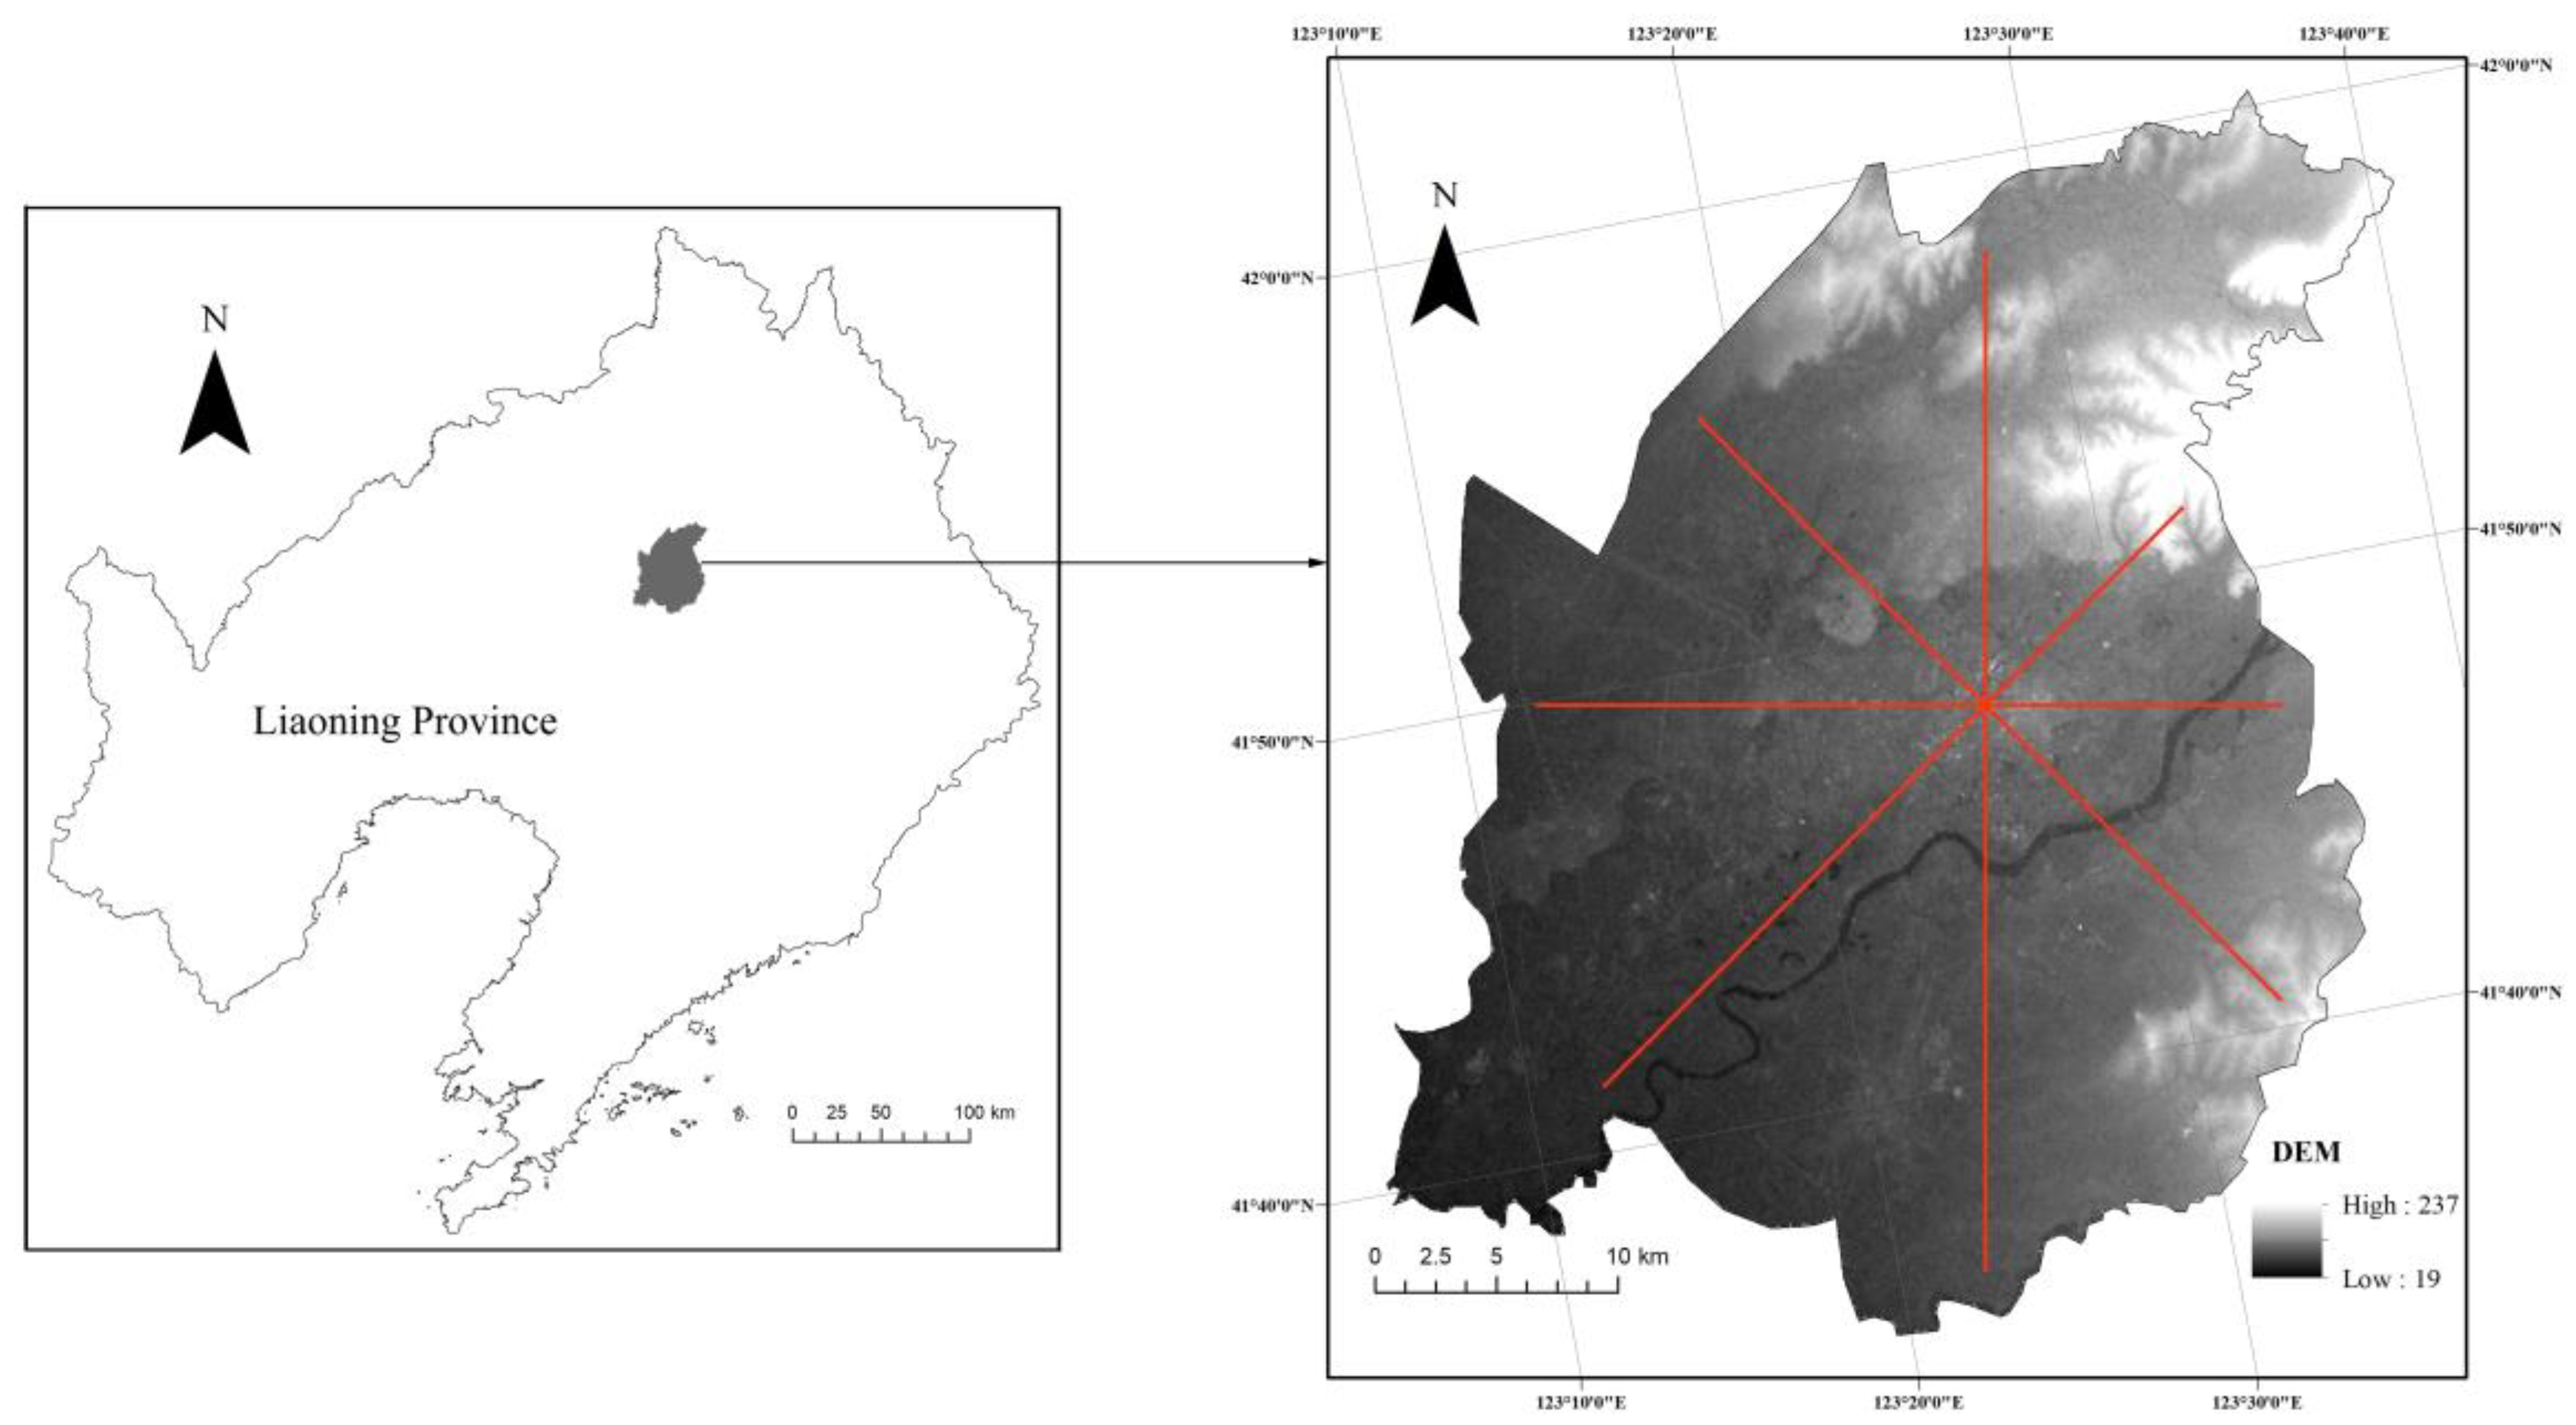
Shenyang is the capital city of Liaoning Province, with a latitude of 41°48′11.75″ N and a longitude of 123°25′31.18″ E. It is located in the middle of the Liaoning Plain and at the geographical center of Northeast Asia in China (Figure 1). The elevation in Shenyang decreases gradually from northeast to southwest; accordingly, the terrain varies successively from hilly mountains to alluvial plains, and the average elevation of the city is approximately 41.45 m. This city has a temperate continental climate with an average annual temperature of 6.2–9.7 °C. Nearly 27 rivers, including the Liaohe, Hunhe, and Puhe rivers, run through the city. Known as the hub city of Northeast China, it has the most advanced equipment manufacturing and science and technology innovation center. Shenyang had 8.29 million permanent residents in 2015 and covered a total area of 12,860 km2. Among the residents, nearly 5.15 million resided in the central city, which has an area of 1353 km2. Since the end of the last century, the city’s urbanization rate has grown so rapidly that the proportion of the urbanized population reached approximately 80.55% by 2015. Correspondingly, the urban landscape has been modified dramatically, as evidenced by the increasing impervious surface coverage, increasing density of artificial construction, and reduction and fragmentation of cultivated land and ecological land. These changes intensify the conflicts between humans and nature, leading to progressively negative effects on the living environment. Moreover, under the influence of global environmental change, risks such as urban heat islands, flooding, and snowstorms have become increasingly frequent in recent years. This situation is especially apparent in the central city, which is the case study area of the paper.
2.2. Data Source and Processing
The datasets collected and used in this study include Landsat remote sensing images at a resolution of 30 m in 1995 and 2015, Google Earth images at a resolution of 14 m in 1995 and 3 m in 2015, 1:1000 land use maps from the urban master plan (1996–2010), and the revised version of the urban master plan (2016). For data processing, first, two stages of Landsat images were pre-processed by conducting correction, fusion, mosaic, and clipping on the ENVI 5.1 platform. Second, the processed images were interpreted through a human-computer interactive solution. Then, the images were classified according to the code of Current Land Use Classification (GB/T 21010-2017). The total landscape in the study area was divided into five categories (agricultural landscape, forest landscape, meadow landscape, built-up landscape, and water area and wetland landscape). The accuracy validation test suggested that the classification results were reliable, with a precision as high as 90%. Third, the Google Earth images and the land use maps were processed for registration and vectorization. Then, the built-up landscape was classified into much finer landscape categories by referring to the code for the classification of urban land use and the planning standards of development land (GB50137-2011). Finally, nine categories were obtained (residential landscape, administration and public service landscape, commercial and business landscape, industrial landscape, logistics and warehouse landscape, road and transportation landscape, public utility landscape, green space and square landscape, and other urban construction landscape). Ultimately, the sub-divided built-up landscape categories were added to the initial classification result. The total classification of landscape categories in the study area is presented in Figure 2.
2.3. Methods
2.3.1. Construction of the Urban Resilience Index
Given that resilience is an emergent property shaped by interactions within complex systems and is generally considered comprehensive, nonlinear, and difficult to directly quantify, it is suggested that urban resilience can be broken down into proxies that can represent key features of resilient systems and that are well-perceived and ascertainable for assessment [30,31,32,33]. Through a review and analysis of relevant literature, four of the most frequent proxies, i.e., diversity, decentralization, connectivity, and self-sufficiency, were selected as key proxies to be examined in this study based on the following considerations. First, the proxies must be consistent with the theoretical basis of social–ecological resilience to which this research refers from a systems perspective, with a primary concern for the spatial dimension of urban systems. Second, they should be complementary and reflect multiple aspects of general resilience as much as possible, although necessary simplification has been made. What is more, they are expected to be quotable across cases and enable comparison [33]. Finally, the proxies should be feasible for measurement and directly relevant to the interventions of landscape/spatial planning and design [34].
Diversity is a highly valued resilience feature that serves as the foundation of resilience because it indicates the adaptive potential in a complex adaptative system [24,35,36]. Specifically, diversity contributes to not only responding to and handling disturbances in productive ways, but also to promoting multi-functionality that supports the performance of a system [37]. From the perspective of the landscape, the diversity that characterizes the sophistication and heterogeneity of landscape types allows an urban system to meet multiple needs. The diversity of the social landscape carries the potential of capital, learning, and innovation in the social domain, while the diversity of the ecological landscape can ensure the health and sustainability of the urban ecosystem. Moreover, the diversity of landscape patterns, which is sometimes more important for sustaining resilience than specific functions, may promote the process of recovery and regeneration because it relates to the system memory and may help to create redundancy to counter local losses or damage.
Decentralization is also posited as a key proxy of resilience and can promote security, flexibility, and efficiency to a certain extent. A resilient urban system is generally considered decentralized because the dispersed layout tends to form an autonomous or modularized pattern, which is useful to accommodate the effects of disturbances in relatively independent spaces from expansion and to enable interactions and innovation among various components. The decentralization of the urban landscape is embodied by the configuration of different types of landscapes that are locally scattered and spread across the entire system. In addition to buffering risk and improving collaboration and efficiency, an evenly mixed distribution of the social landscape and the ecological landscape can facilitate complex interactions between humans and nature, thus aiding in increasing the adaptive capacity of the entire urban system and the quality of life in cities [5,38,39].
Connectivity is the guarantee of the functioning, survival, and reorganization of dynamic urban systems, representing the accessibility of services and the possibility and convenience of the flow and exchange of energy, matter, and knowledge [40]. Although the role of connectivity in resilience potential is considered complex and controversial [41,42], maintaining appropriate connectivity is obviously significant in urban areas where serious fragmentation and heterogeneity are basic characteristics. The connectivity of the urban landscape improves resilience by promoting the capacity of self-organization, which is especially imperative for a perturbed system, and by increasing the integrity of urban fabric to generate an organic and interdependent system [43]. Additionally, the well-connected natural landscape helps to support ecological functions and protect biodiversity in cities, which plays a vital role in alleviating and addressing social-ecological challenges.
Self-sufficiency is the capacity of an urban system to exercise control locally over essential products and services. The contribution of self-sufficiency to resilience is believed to provide insurance and compensation that are closely associated with urban human well-being and the ability to transition to sustainable development [44]. In the framework of a social-ecological system where the interplay of humans and nature arises in a co-evolutionary manner, the self-sufficiency of ecosystem services is of essential importance. Ecosystem services can provide many critical benefits that both satisfy urban society’s needs and respond to climate-related hazards (such as urban heat islands and flooding). A resilient city can adequately deliver ecosystem services over time, regardless of dynamics and disturbances [6]. Therefore, the self-sufficiency of ecosystem services enables the urban system to maintain long-term sustainability and resilience [45].
For measurement, the landscape metrics and the budget of ecosystem services were employed to quantify the proxies. Diversity, connectivity, and decentralization correspond to the landscape metrics of the Shannon’s diversity index (SHDI), the connectance index (CONNECT), and the interspersion and juxtaposition index (IJI), respectively. Because there is no readily available landscape metric for the measurement of self-sufficiency (SSes), it was estimated according to the differences between the supply and demand of the ecosystem services generated by different landscape categories.
In terms of the aggregation of these landscape-based indicators, this study referred to the opinion of Ebert and Welsch and chose the arithmetic logic of multiplication instead of addition, with full consideration of the inherent correlation among these indicators in the landscape and their cascading and synergistic impacts on resilience [46]. Consequently, the urban resilience index (URI) based on the urban landscape can be expressed as follows:
URI = SHDI × IJI × CONNECT × SSes
2.3.2. Calculation of the Landscape-Based Indicators
The calculation of the landscape-based indicators (Table 1) was implemented in two parts. The landscape metrics, i.e., SHDI, IJI, and CONNECT, were calculated by applying Fragstats 4.2 software. Because there is an obvious scale-dependent characteristic of the landscape metrics, the priority for employing the landscape metrics is to explore the characteristic scale to reflect the most intrinsic and effective information of the landscape pattern. The specific calculative process, together with the principles, is as follows. First, we imported the raster format data (30 m × 30 m) of the landscape categories of the study area into the Fragstats 4.2 platform. Then, we ran the moving window module to capture the spatial characteristics of each landscape metric under window lengths of 500 m, 750 m, 1000 m, 1250 m, 1500 m, 1750 m, and 2000 m. The basic principle of the moving window method is to take a window with a known length as the moving unit and move it from the upper left of the research area to the bottom right in a grid-by-grid way. Then, the returned value is assigned to the central grid of each moving window until all the grids have unique values. Finally, the spatial pattern of the corresponding landscape metric is attained at each specific window length. The merit of the moving window method is that it can express the continuous surfaces of landscape metrics, through which the differences in different regions of the study area can be explicitly reflected.
A multi-scale analysis was conducted to identify the characteristic scale [47]. Based on the results of the moving window method, we employed the semi-variogram model to simulate the spatial variations of landscape metrics under different window lengths. The semi-variogram is widely used to analyze the spatial structure of variables in landscape ecology by depicting the spatial autocorrelation of the measured sample points/locations. Generally, spatial dependence among sample points follows an asymptotic curve that gradually increases with lag distance. The semi-variance is small at sample points with close distances. When sample point distances are greater, it becomes large, but up to a certain distance, the variance levels off, which means that the points are no longer spatially correlated [48]. The formula of the semi-variogram is as follows [49]:
where is the semi-variance; and are the sample point values of variable at locations and , respectively; and is the sample interval or lag and is known as the maximum distance at which sample points are spatially correlated. There are three standard parameters regarding the semi-variogram model that are important, i.e., nugget , sill , and range . In general, the semi-variance value increases as the sample interval increases and it will rise to a stable constant (the sill) at a certain distance (the range). When equals zero, the semi-variance value is the nugget . Theoretically, should be zero. However, due to the unknown or random variation, such as measurement errors or spatial sources of variation at distances smaller than the sampling interval or both, is usually greater than zero. The parameter is the difference between the sill and the nugget , and it generally decreases as increases. Therefore, in the semi-variogram model, the nugget is an estimate value that represents the unknown or random variance, and the sill is an estimate value of the total variance which can be explained by the model. The ratio of nugget to sill , which is represented by the parameter , is used to show the proportion of the variance caused by the randomness in the total variance, revealing the degree of spatial correlation of a variable. A smaller value of indicates greater spatial autocorrelation. The characteristic scale in this study is determined according to the trend of under given lengths. A more stable and lower value that designates better autocorrelation and stability of the landscape metric with window length changes may be considered the characteristic scale [50]. The simulation of the semi-variance was completed using GS+ software(Gamma Design Software, Plainwell, MI, USA).
SSes was determined by the budget of the ecosystem services derived from the different categories of the landscape. This study drew on the research results from Burkhard et al., linking each of the 13 categories of landscapes to the 17 types of ecosystem services, which included nine types of regulating services, six types of provisioning services, and two types of cultural services [51]. The budget of each type of ecosystem service was based on the difference between its supply and demand. The results of the budget level were denoted by a scale of 11 values ranging from −5 to +5, where −5 indicates that the demand significantly surpasses the supply, leading to the worst self-sufficiency value. In contrast, +5 indicates that the supply significantly exceeds the demand and represents the greatest self-sufficiency value, while a value near 0 suggests that the supply fits the demand approximately, i.e., reaching an ideal self-sufficiency value (Table 2). It should be noted that the budget of the ecosystem services is only presented by categories in a spatially explicit way rather than by actual values. Furthermore, the fuzzy sum tool in the spatial analysis tools of the ArcGIS 10.5 platform was applied to overlay the different types of ecosystem services. Finally, the overall pattern of self-sufficiency of the ecosystem services was obtained.
2.3.3. Normalization of the Landscape-Based Indicators
Because these four selected indicators have different properties (e.g., different dimensions or value ranges), they cannot be directly involved in the calculation of URI and must be normalized first. The raster reclassification tool in ArcGIS 10.5 software (ESRI, RedLands, USA) was used for normalization in this study. Raster reclassification is an important process when a common value scale is needed to combine dissimilar data, which allows the cell values of an input raster to be changed to alternative cell values that represent classes [52]. Based on the method of Nature Breaks (Jenks), the raster maps of the four landscape-based indicators that originally held values belonging to different measurement scales were input to be reclassified on a new scale of 1 to 9, depending on the significance of each indictor to urban resilience. Based on the captured results of normalization, the synthesis of the four indicators was accomplished according to formula (1) defined above by using the raster calculation tool. The final raster maps of the spatial pattern of urban resilience are the basis for the subsequent analysis.
2.3.4. Line Transect Analysis
To provide more detailed information on the temporal and spatial characteristics and the evolution of urban resilience in the study area, especially the differences in distance in different directions, four sample transect lines representing eight directions from the center of Shifu Square were extracted. The four lines are shown in red in Figure 1. Regarding the features of the transect lines, the length of the north-south line is 42.03 km, the length of the east-west line is 30.75 km, the length of the southwest-northeast line is 33.87 km, and the length of the northwest-southeast line is 33.96 km. The extraction of the sample transect lines was completed by the 3D Analysis module in ArcGIS10.5 software.
3. Results
3.1. Characteristic Scale of Landscape Metrics
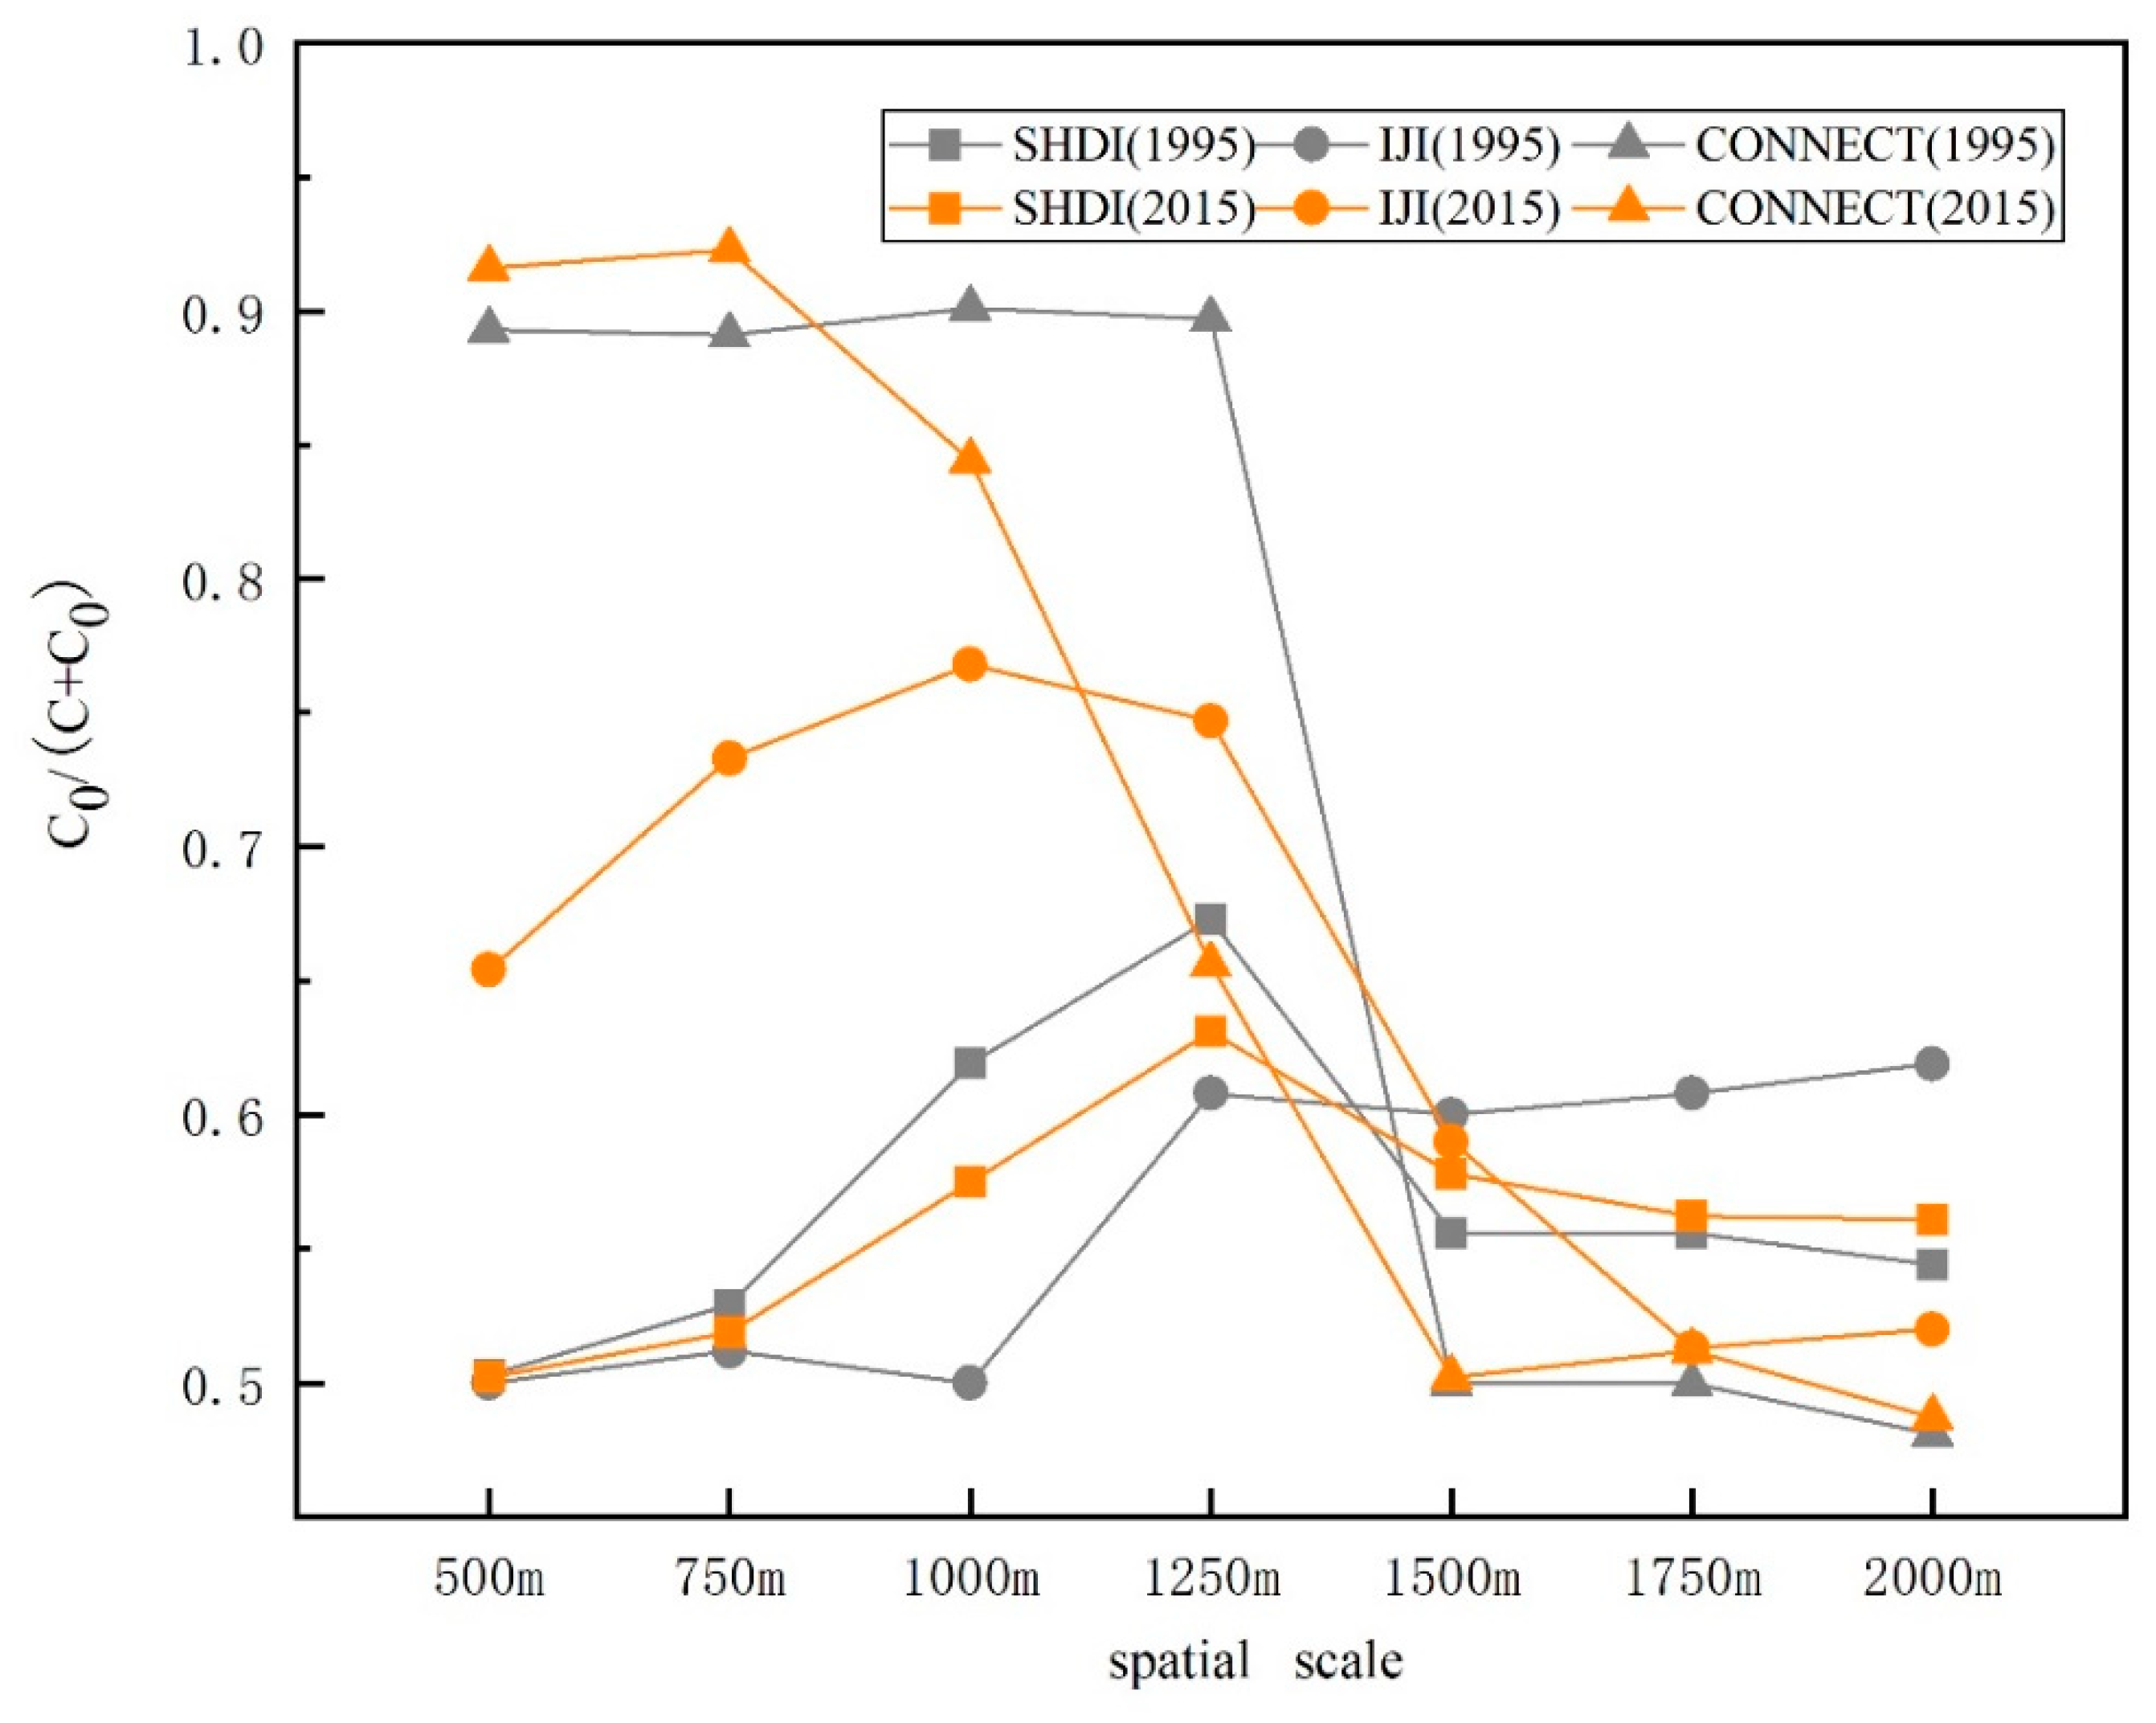
The spatial variations of the landscape metrics of the study area were investigated on multiple continuous scales. According to the changes of the values of of the landscape metrics in 1995 and 2015 at different window lengths (Figure 3), i.e., 500 m, 750 m, 1000 m, 1250 m, 1500 m, 1750 m, and 2000 m, an obvious feature is found in which the spatial variances of each metric (represented by the values of ) decreased with the increase of spatial scales, indicating that the spatial autocorrelation follows an increasing trend. Although the changes of the metrics were not entirely the same, they shared certain common characteristics. Specifically, from the changing trends of the curves, the values of of SHDI first increased and then decreased, with a gentle range, and the values of of IJI also increased gradually in the early stage but later declined sharply, while the values of of CONNECT dropped dramatically after maintaining a smooth pattern in the beginning and returned to a steady pattern at the end. Basically, the stability of all the metrics was reached at a window length of 1500 m because their values around this length demonstrated a comparatively small value after obvious fluctuations. Considering that larger scales would lead to the loss of key relationships and spatial characteristics of the landscape pattern, to reflect more robust spatial information of the object landscape, it was determined that the spatial scale of 1500 m is appropriate for use as the characteristic scale for analyzing the landscape characteristics of the central city of Shenyang.
3.2. Variation Characteristics of the Landscape-Based Indicators
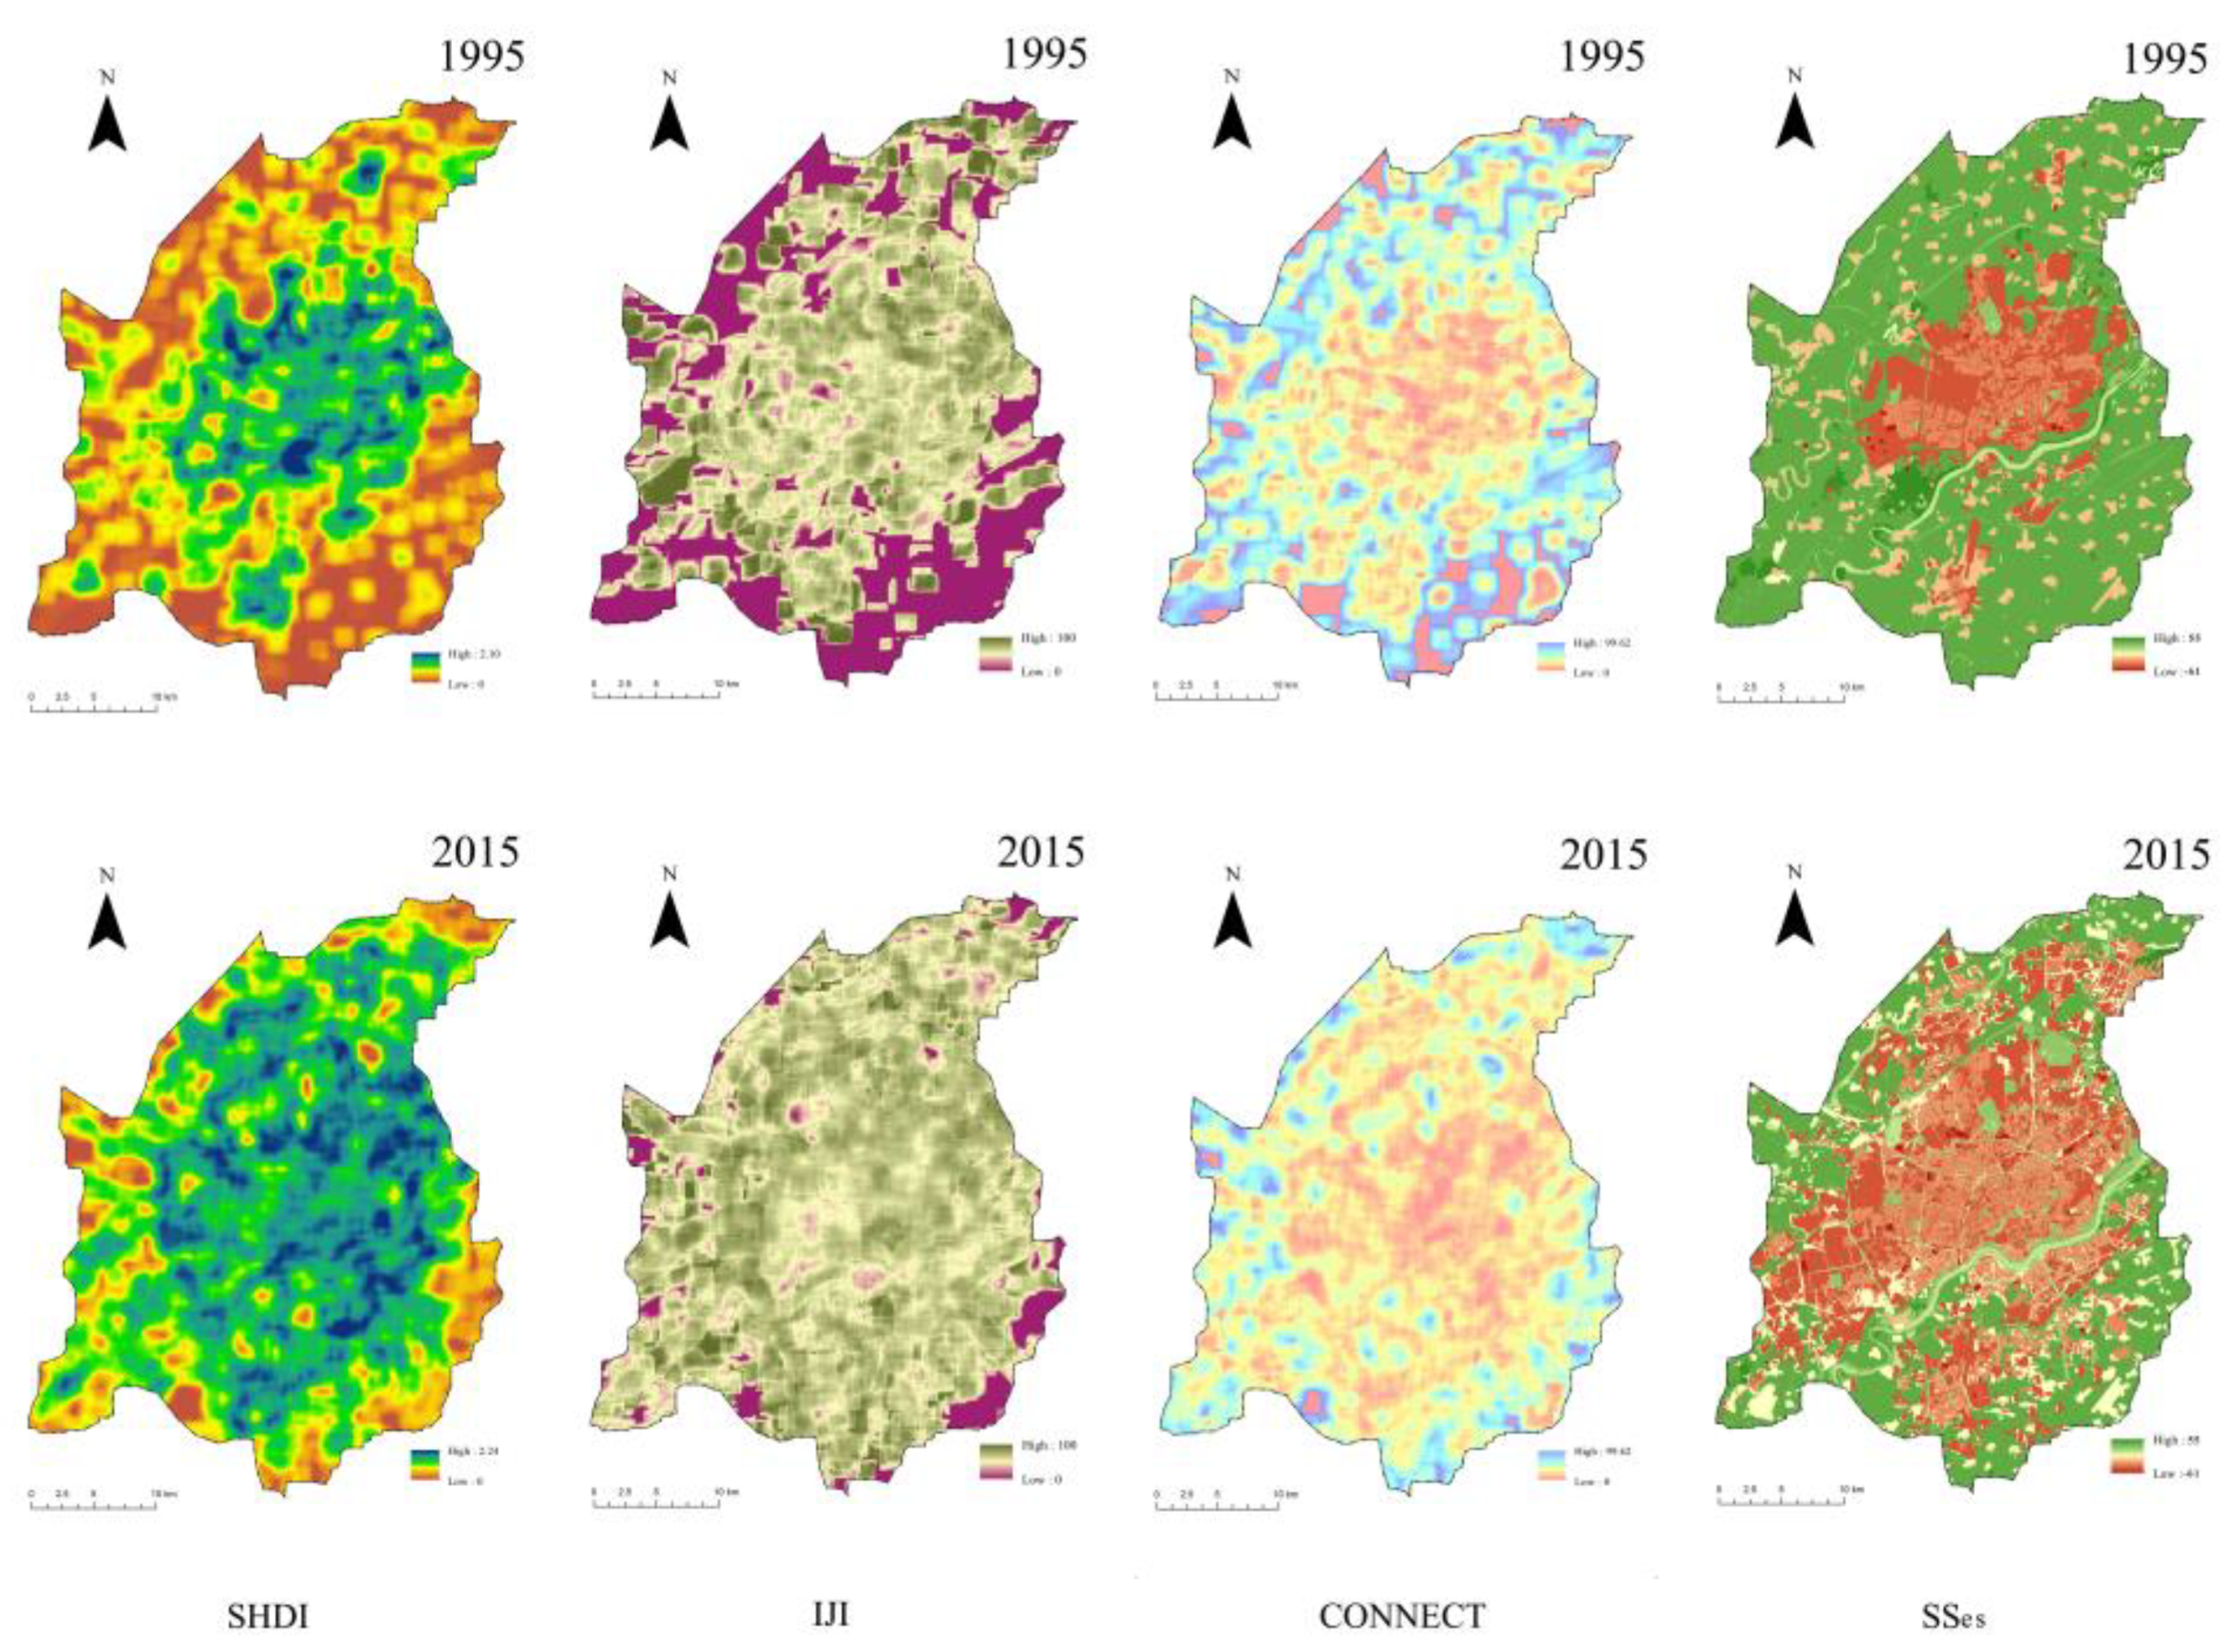
Table 3 presents the variations in the statistical values of the landscape metrics during the past 20 years in the study area. The table shows that SHDI and IJI increased, with mean values from 0.71 and 60.26 in 1995 to 1.23 and 66.34 in 2015, respectively. This result implies a growing trend in the level of diversity and decentralization of the total landscape. In contrast, CONNECT decreased from 62.59 to 54.17 on average, demonstrating that the connectivity of the urban landscape had declined. Regarding the spatial pattern of the four indicators (Figure 4), they were all characterized by an evident core-periphery distribution. The differences between the core areas and the peripheral areas were prominent in 1995, but were somewhat weakened in 2015. By comparing the variations of the indicators in the two years, it can be observed that the areas with significant changes were in the peri-urban areas of the study area. Obviously, the spatial units with high values of SHDI and IJI expanded noticeably outwards; this trend was the same for those with low CONNECT and SSes values.
The changes in the indicators revealed that with the deepening of urbanization, the high-density and high-intensity mixed development activities spread from the city center to the hinterland and encroached on a large number of arable land and ecological land, causing significant fragmentation of the total urban landscape. Therefore, the landscape diversity increased, the layout and configuration of the different landscape types presented a tendency toward more equilibrium, and the connectivity of the landscape and the potential for the self-sufficiency of the ecosystem services decreased.
3.3. Overall Pattern of Urban Resilience
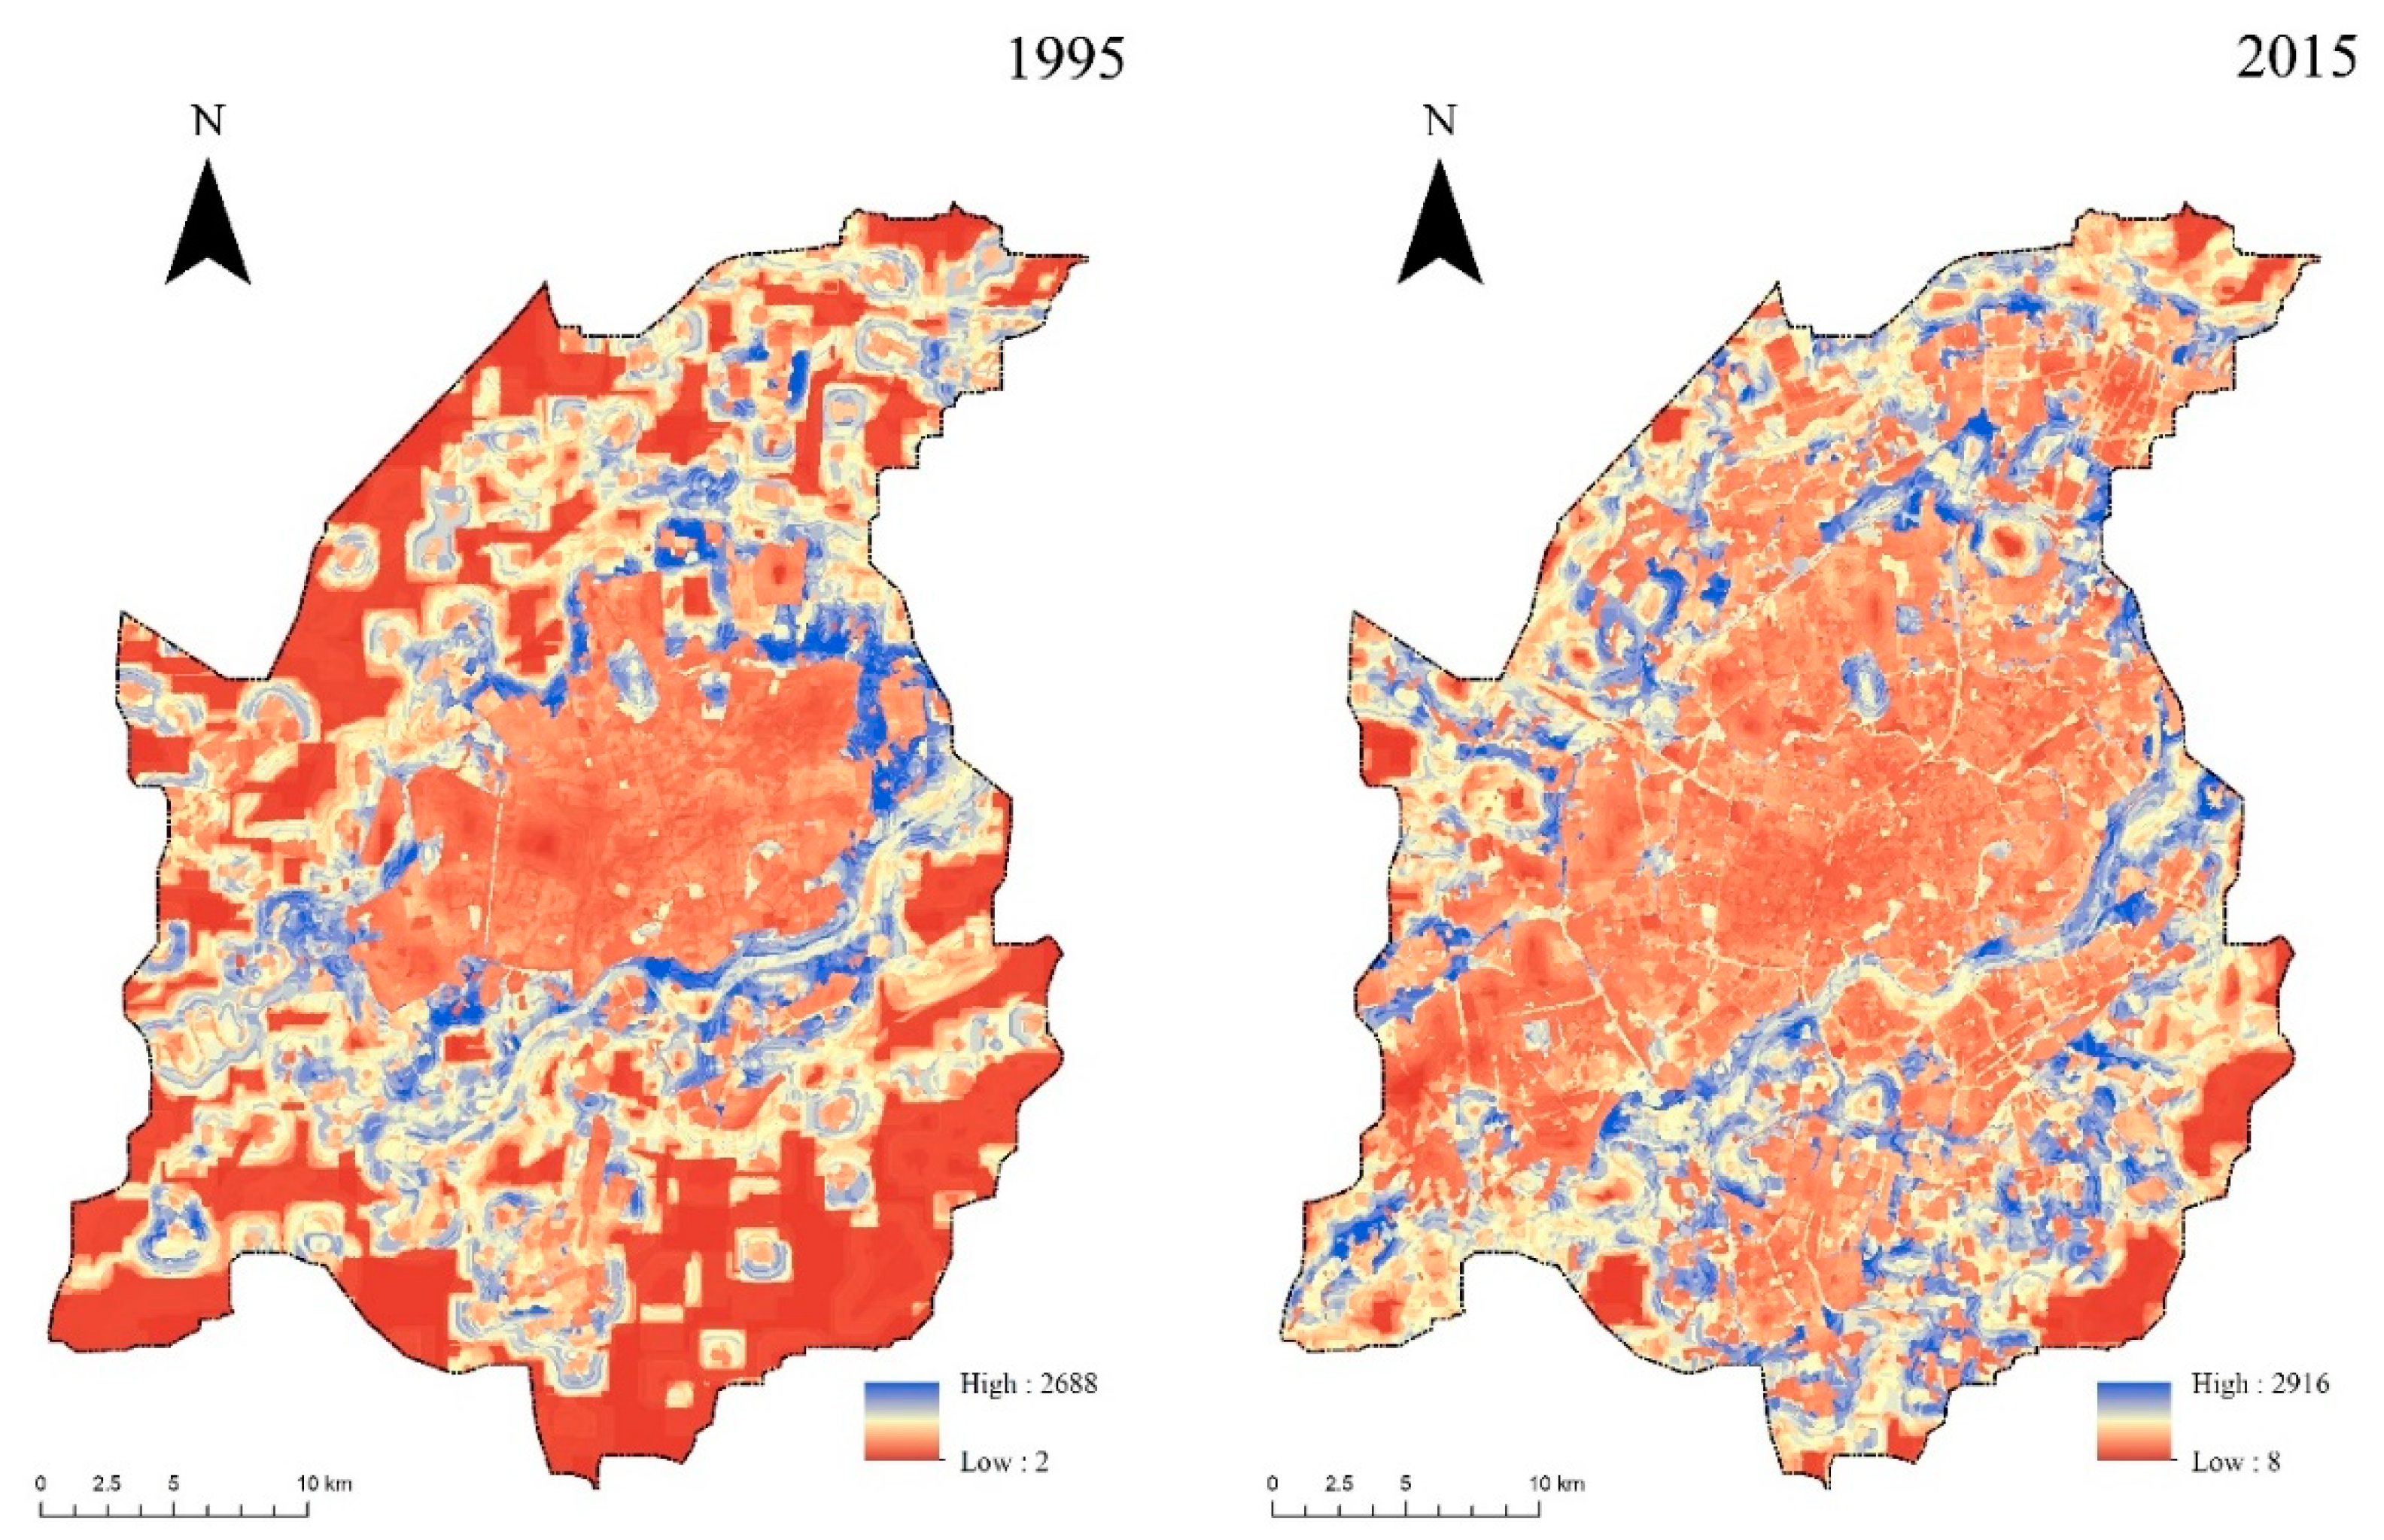
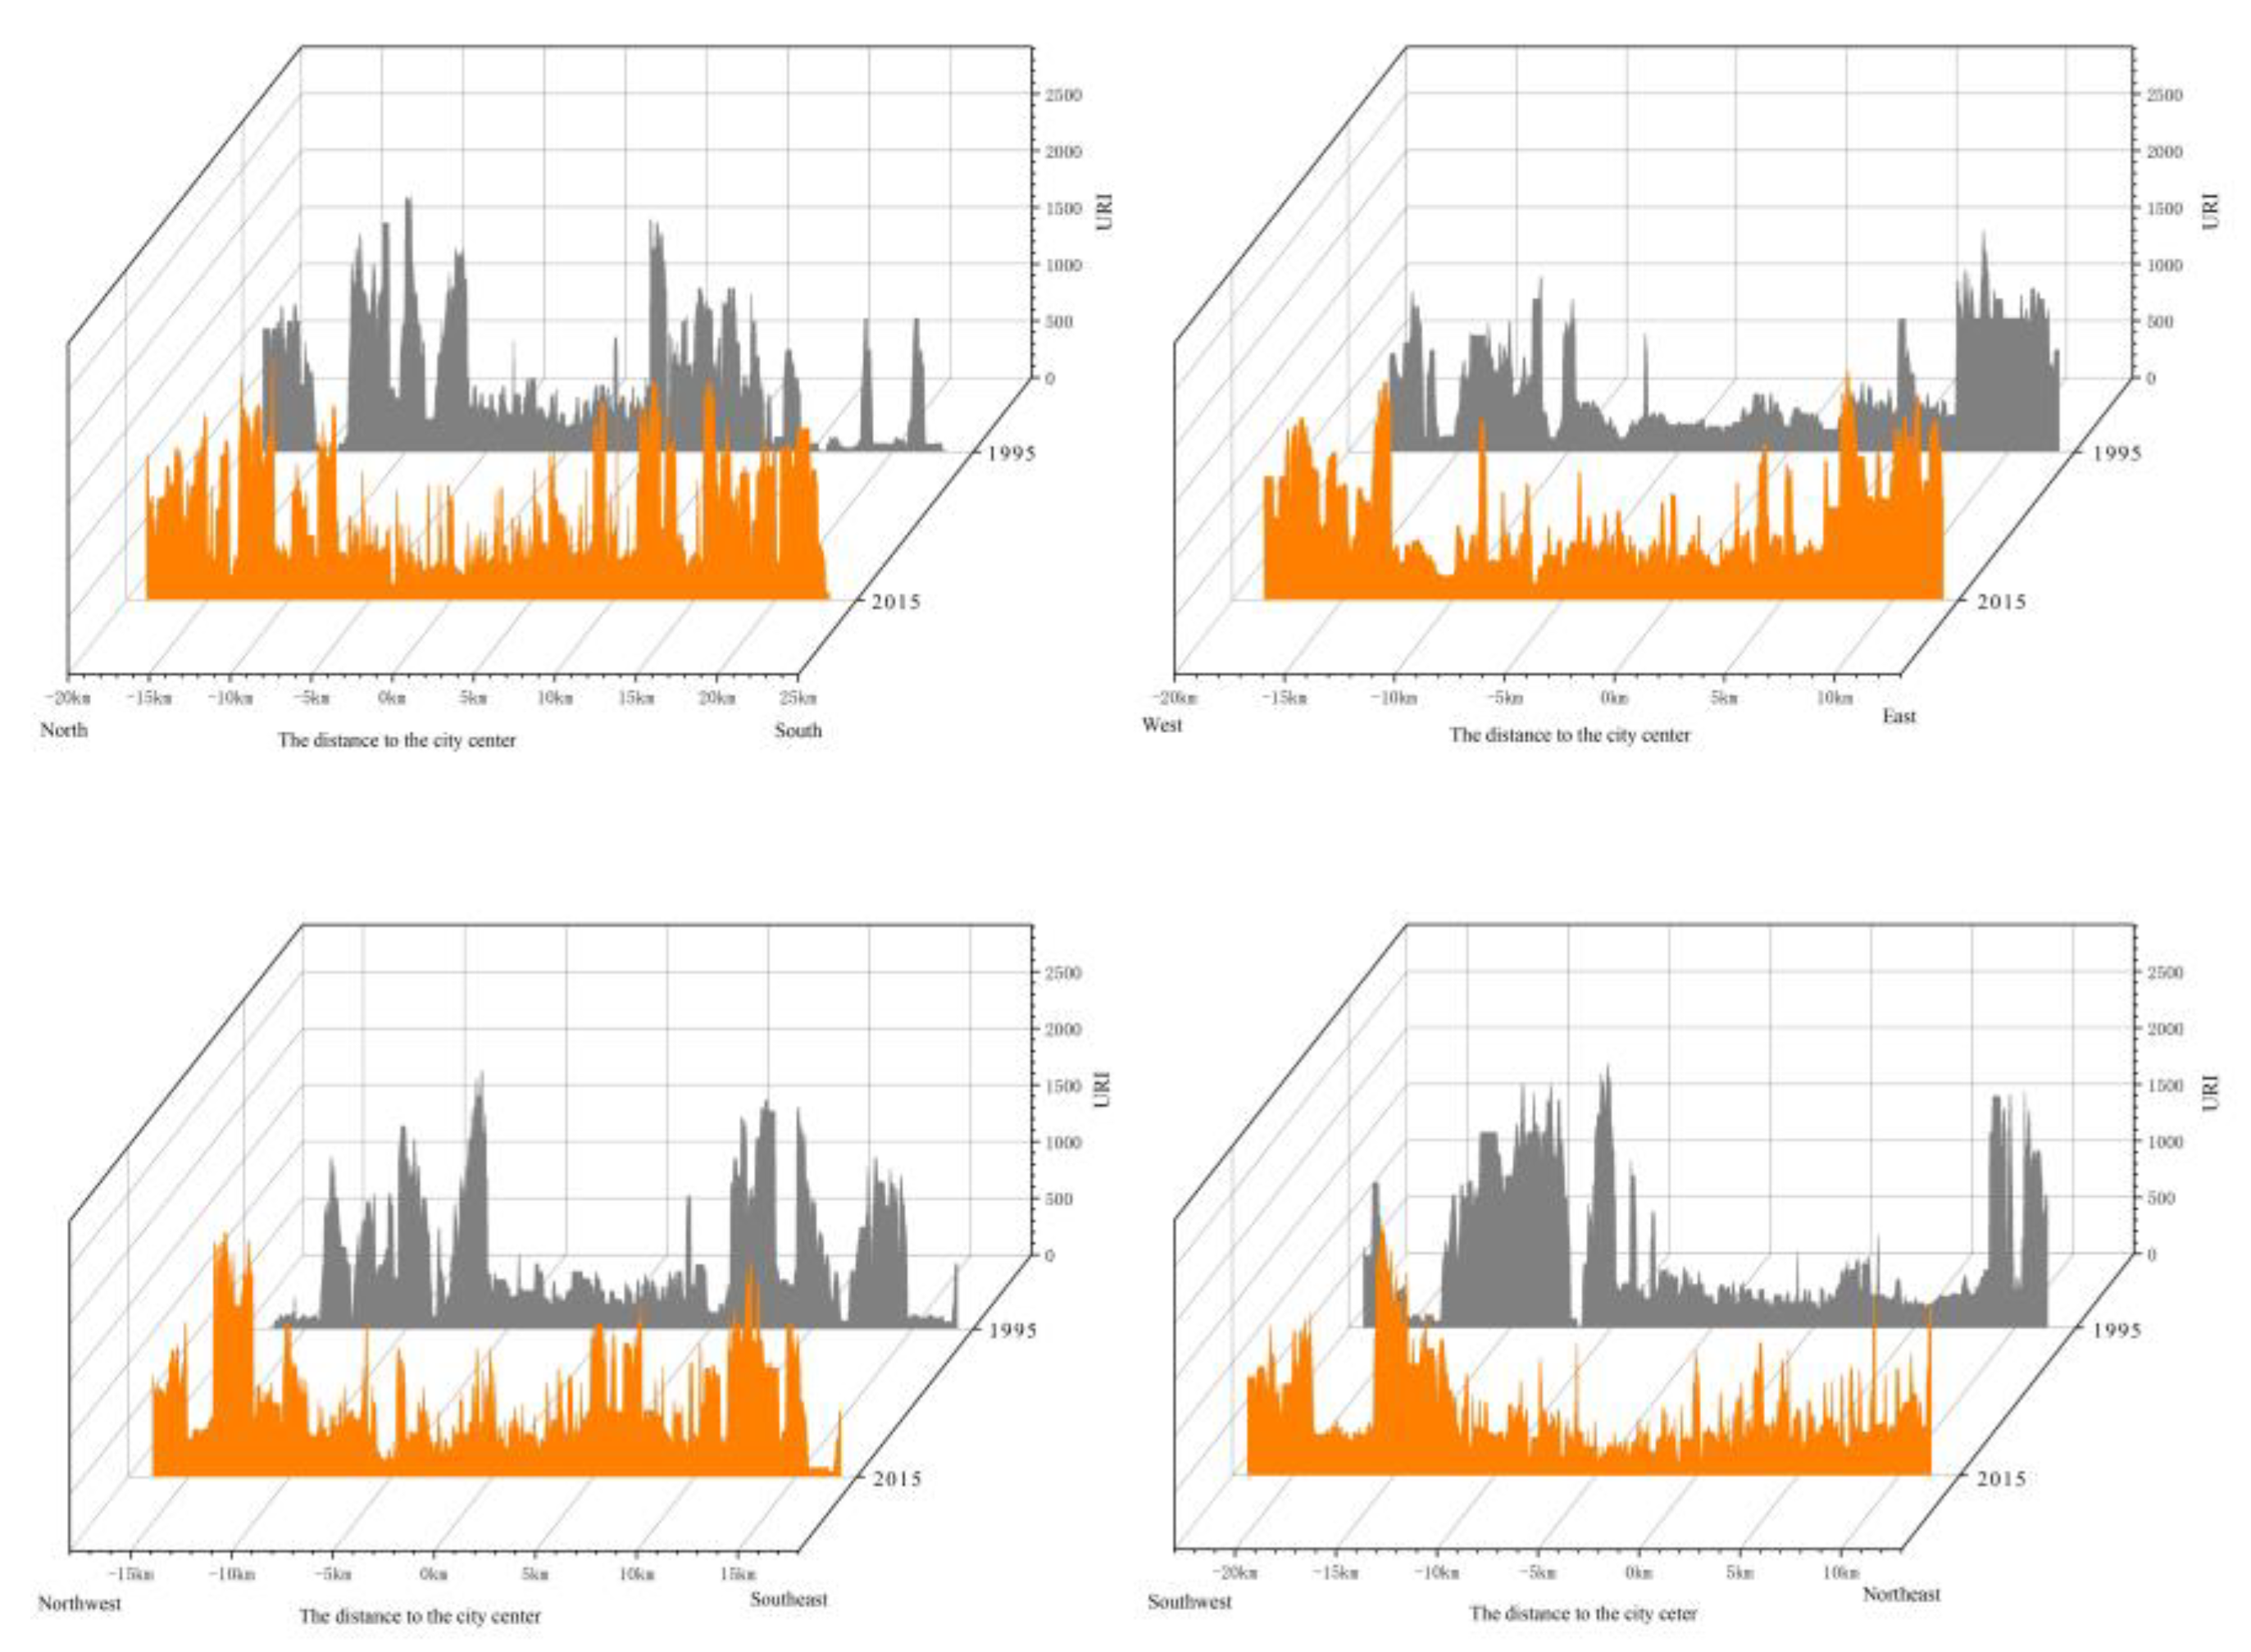
The spatial pattern of urban resilience (Figure 5) was acquired by synthesizing the normalized landscape-based indicators using the raster calculation tool in ArcGIS 10.5 software based on formula (1). The detailed information in the four transect lines was extracted to further shed light on the spatial characteristics of urban resilience (Figure 6). The two figures generally demonstrate that the spatial pattern of the level of resilience in the study area exhibited a ring-layer difference. Specifically, in 1995, the resilience in the central ring was at a homogeneously low level, and the resilience in the middle ring was the highest. In the outer ring, it became an interphase pattern of a contiguous lower level speckled with a higher level. In 2015, this ring-layer distribution was less prominent, and the entire pattern of urban resilience became much more complex and heterogeneous. An apparent feature is that the range of the central ring with low resilience (except for the areas near the city parks and rivers) became larger and encompassed the adjacent spatial units that were previously determined to be highly resilient. Simultaneously, the resilience in the outer ring was significantly complicated, and the former continuous low-level resilience areas almost disappeared. The relatively high-level resilience areas were scattered across the entire study area away from the main urban area.
3.4. Temporal and Spatial Evolution of Urban Resilience
When comparing the spatial variations in the urban resilience of the two years shown in Figure 5; Figure 6, there are obvious directional preferences. In the south and northwest directions, the resilience clearly increased, while in the other directions, the urban resilience decreased. Areas with a significant increase in resilience were near the suburbs of Hunnan New Town in the south and Puhe New Town in the northwest, while the areas with reduced resilience mainly occurred in the Shenxi Industrial Corridor (partly) in the southwest and in the Huishan Economic and Technological Development Zone near the northeastern edge. The reason for the differences in the increase and decrease of resilience in different directions could be largely due to different treatments of the social and ecological considerations during the process of urban development. In the directions with increased resilience, the main development activities were the construction of the new town, which strictly followed the requirement of appropriately modifying the urban landscape to improve the living environment by safeguarding good interactions between the social and ecological elements. In contrast, in the directions with reduced resilience, which were concentrated in the high-intensity artificial utilization areas such as the industrial zone, the economic and social benefits were given more attention, and the ecological benefits were neglected.
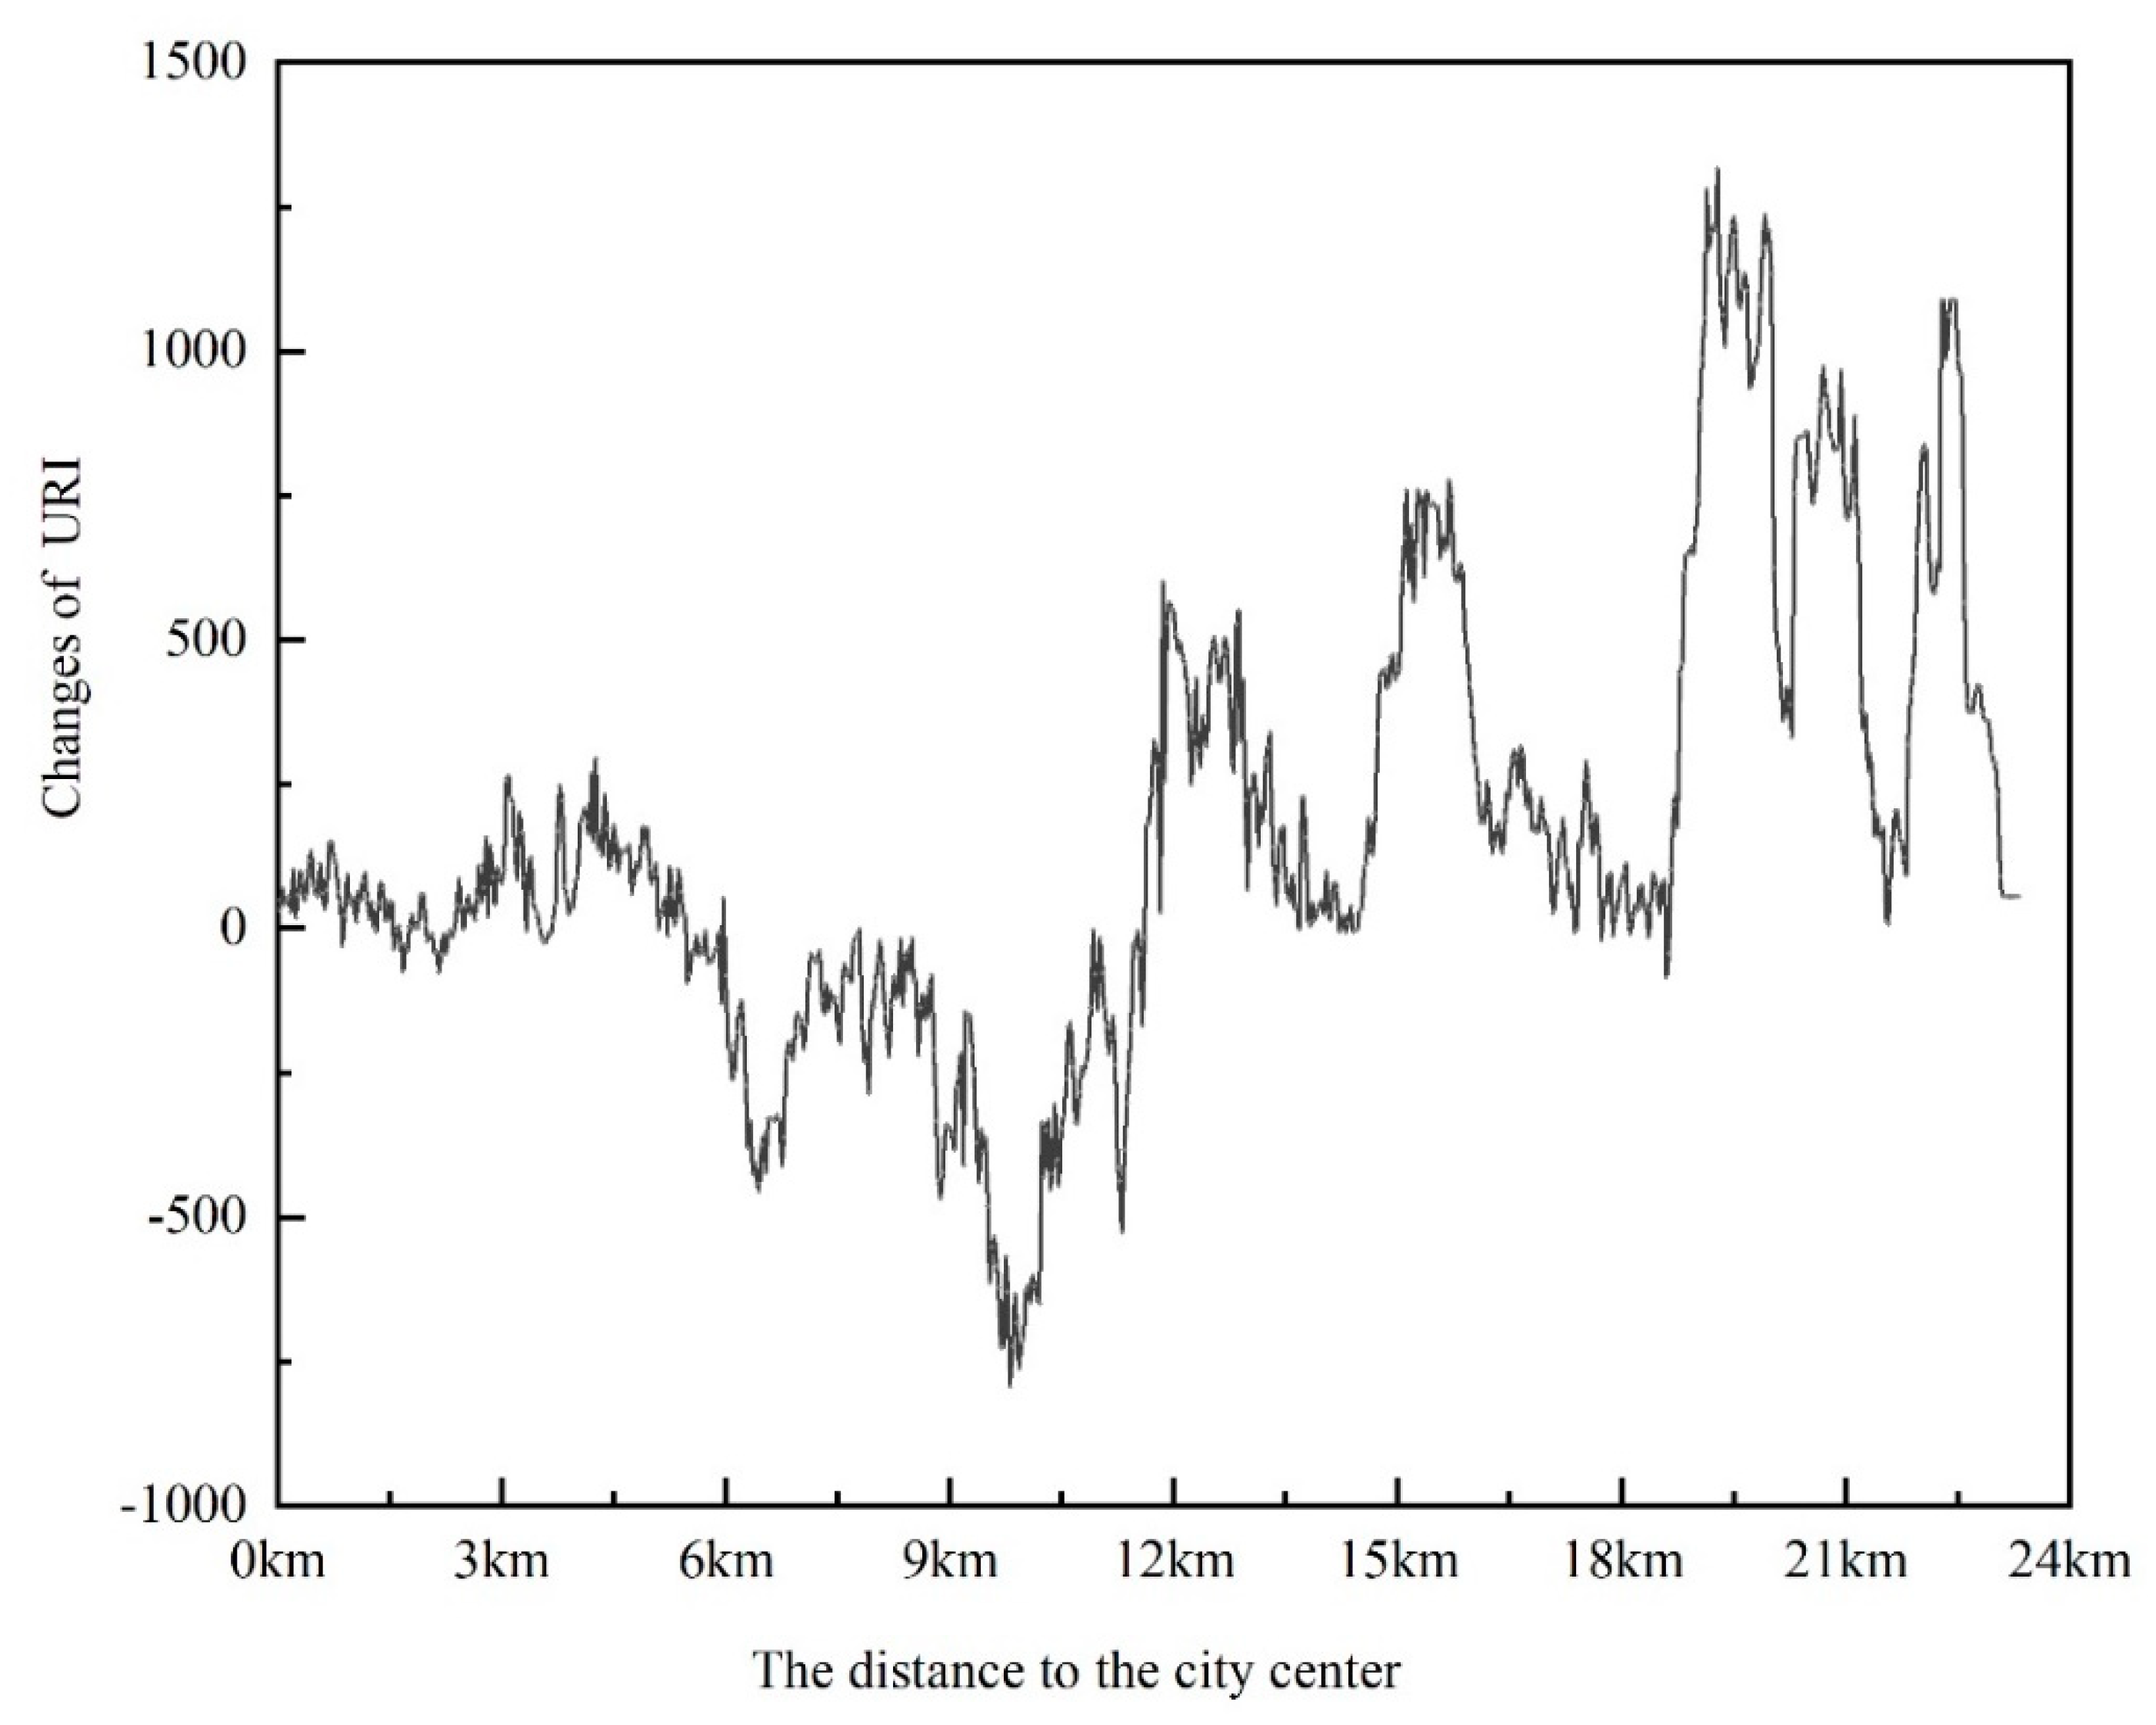
When summarizing the average distance of the variations in urban resilience in all directions (Figure 7), we found that within the range of 0–6 km from the city center, the level of resilience barely changed; however, in the range of 6–12 km, the level of resilience decreased. Conversely, from 12 km to 18 km, the level of urban resilience increased, while from 18 km to 24 km, it increased noticeably. This pattern supports the fact that evident distance effects for changes in resilience emerged from the city center to the edge, which first maintained basic stability and then decreased, before finally increasing. The areas where urban resilience was most affected by rapid urbanization were approximately 6 km from the city center of Shenyang during the study period. Moreover, it can be inferred that the development and construction of urban space has a two-sided impact on urban resilience. Large-scale artificial construction reduces urban resilience, while appropriate construction that maintains good social and ecological interaction is the key to enhancing urban resilience. The consideration of the integration of artificial construction with natural or semi-natural environments through the proper preservation of buffer zones can markedly promote their benign interactions, promoting the urban development trajectory to sustainable transition.
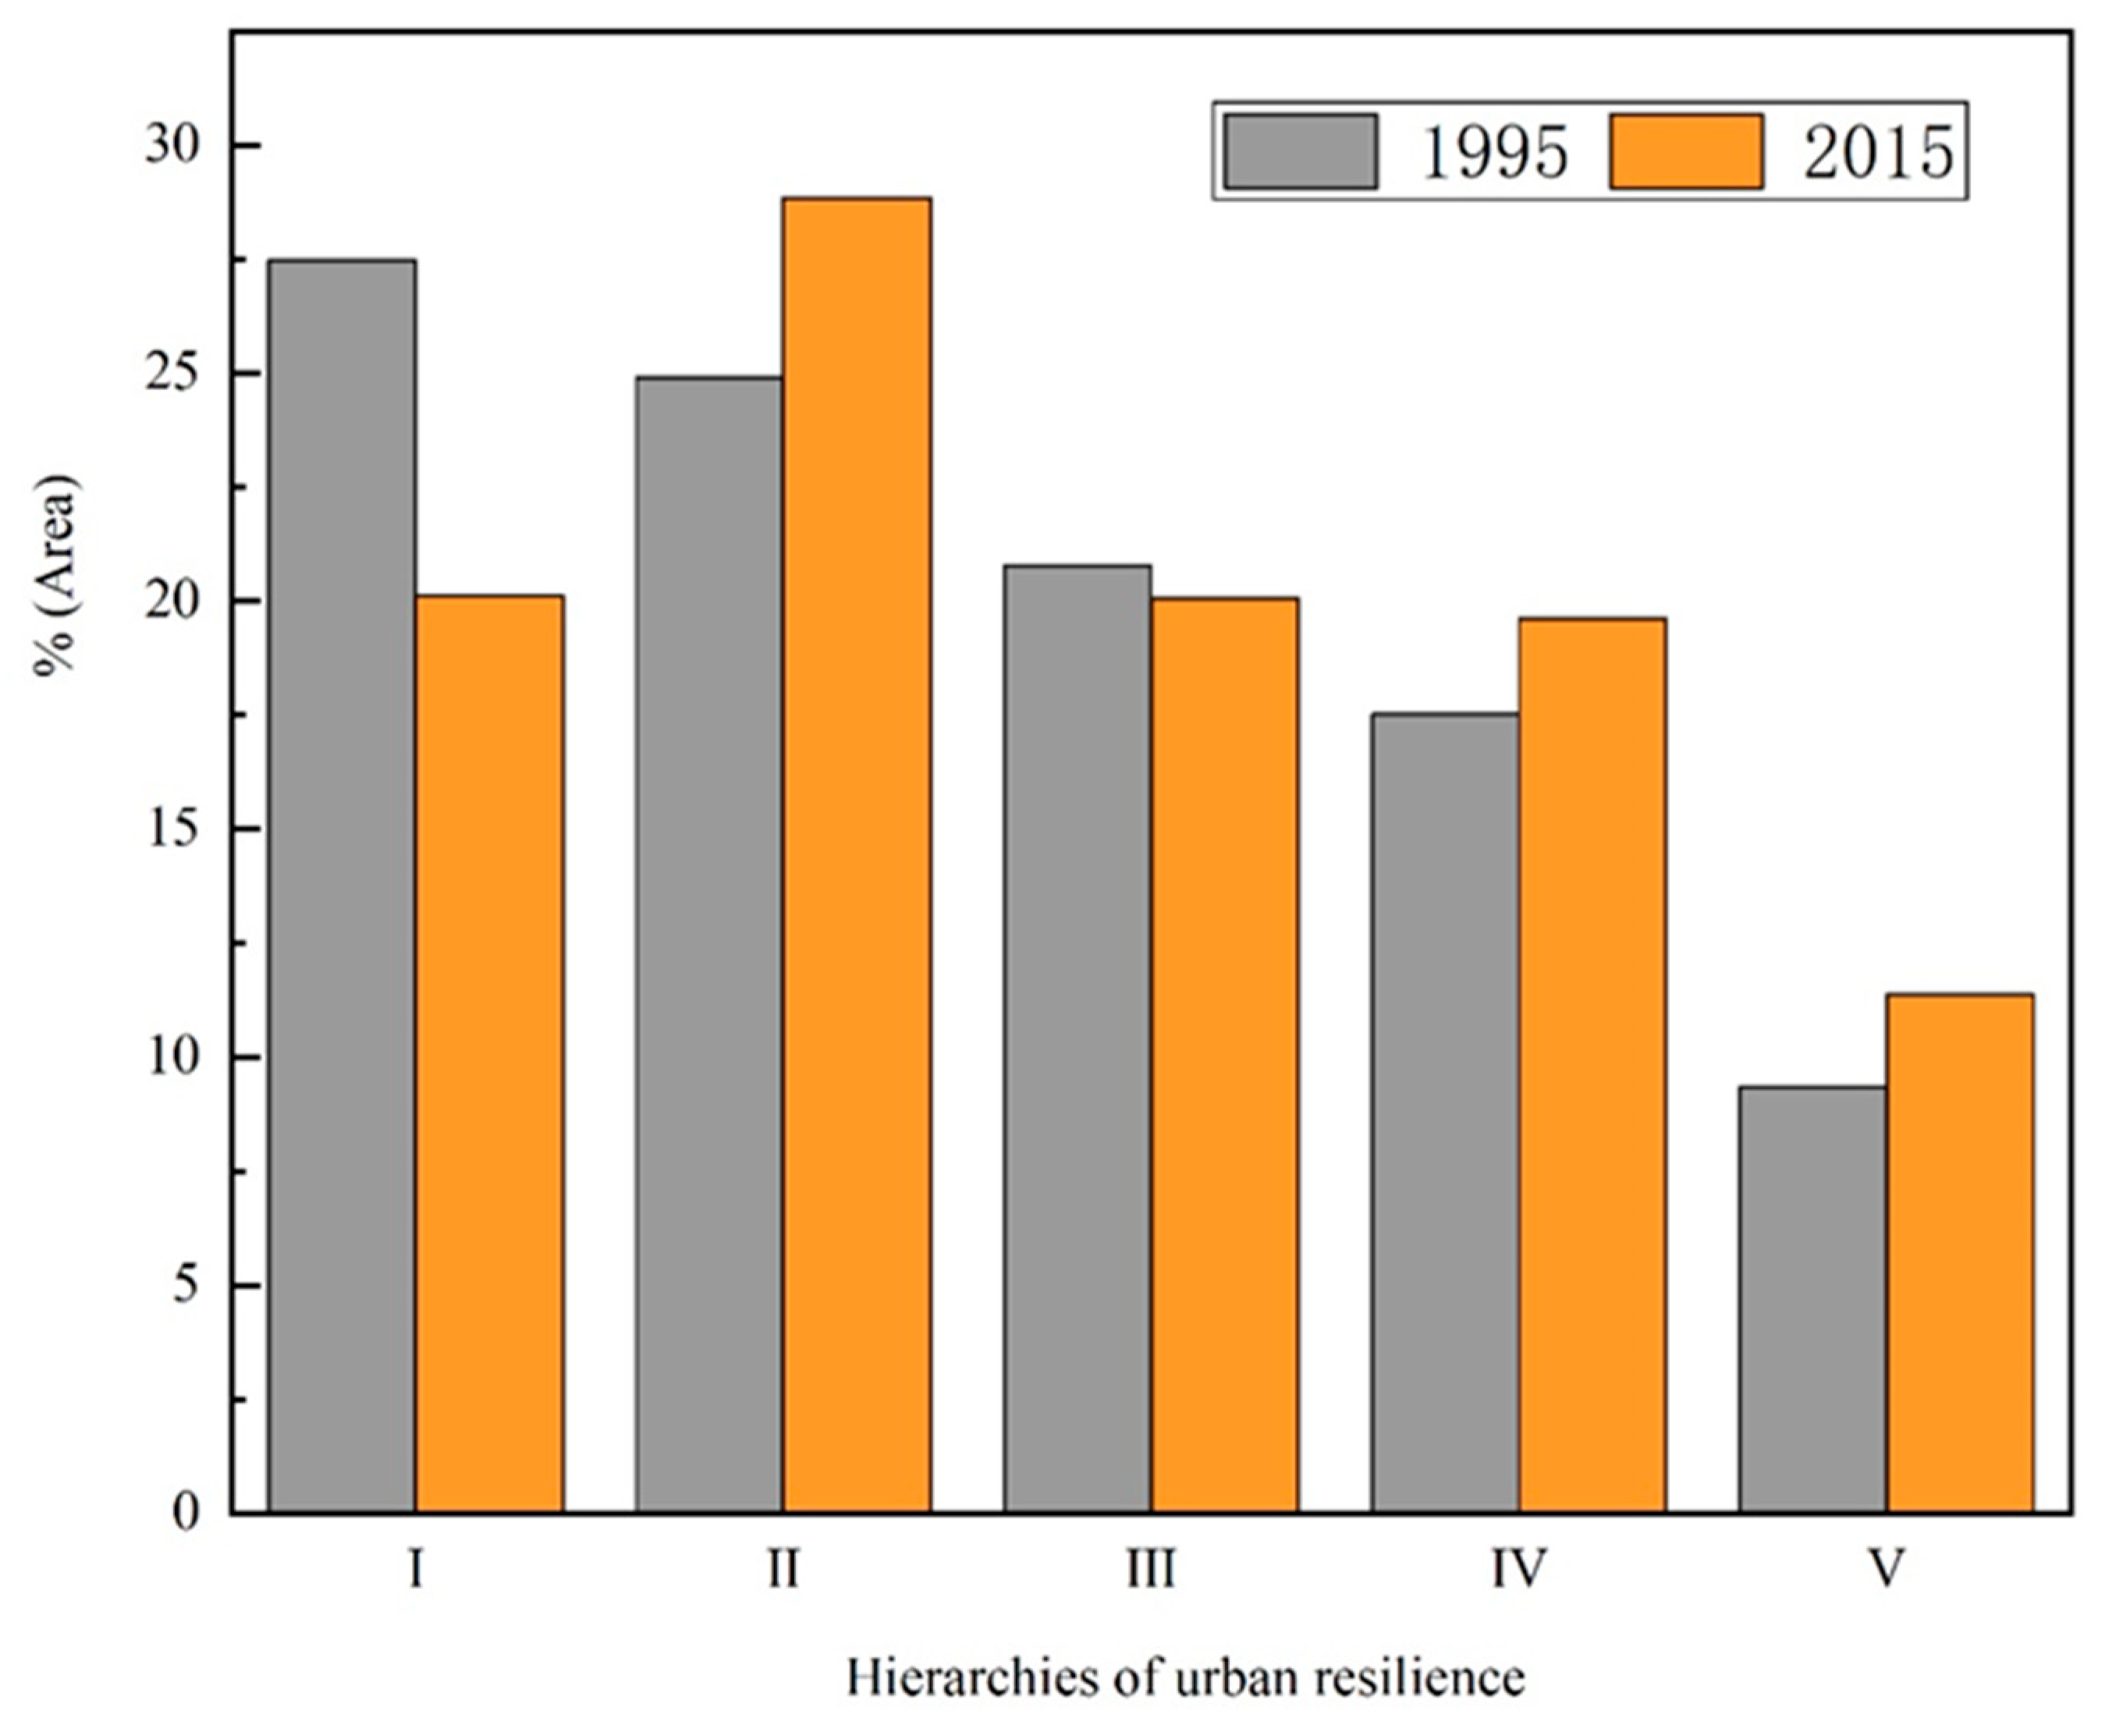
To investigate the evolution of the urban resilience of the total study area for the past two decades, the level of urban resilience was divided into five hierarchies, i.e., I, II, III, IV, and V, where I was the lowest level of resilience, and the hierarchy increased with the resilience level. Therefore, V represented the highest level of resilience. The statistical results of the area ratio of each hierarchy showed that areas with a comparatively low resilience decreased, while areas with a medium and a high hierarchy of resilience showed a slight increase (Figure 8). In addition to the increasing trend of the resilience level, Figure 8 indicates that the internal differences narrowed because the gaps in the area ratios between the two ends of the spectrum decreased. This can be attributed to the fact that the process of urban development has optimized the total landscape configuration in the study area, making the combination of landscape features reasonable.
4. Discussion and Suggestions
4.1. The Rationality of the Urban Resilience Proxies and Urban Resilience Index Method
Due to the comprehensiveness and complexity of urban resilience, no agreement has been reached by scholars regarding the list of proxies of resilience that can cover all of its characteristics [53]. To address mass social-ecological threats arising from and intensified by rapid urbanization, this paper conceptualized urban resilience in the framework of social-ecological systems, which focuses on the ability to absorb, adapt to, and transform when coping with uncertain challenges to ultimately achieve sustainable development. In this context, we selected the most frequent and useful proxies, i.e., diversity, decentralization, connectivity, and self-sufficiency, to represent urban resilience from a variety of resilience properties after reviewing the relevant literature (Table 4). In addition, the operability of measurement and the interventions of the proxies are very important considerations. These four aspects are highly related to the urban landscape, although self-sufficiency indicates a behavior rather than a structural characteristic that only displays the relative level instead of an absolute amount. They can be measured by landscape-based indicators and are major issues that can be applied to shape resilience in planning practice.
Although each indicator (i.e., diversity, decentralization, connectivity, and self-sufficiency) investigated in this paper has a positive effect on urban resilience, it is not (always) true that the system will become more resilient as a single indicator increases infinitely due to cascading effects and the intrinsic relationships between indicators. For example, diversity resulting from artificial development increases the fragmentation and heterogeneity of the system, which in turn leads to decentralization and reduces the connectivity and self-sufficiency of the ecosystem services. Additionally, some indicators can only give full play to their normal functions within a certain scope or in conjunction with other indicators [41,42]. Therefore, the enhancement of urban resilience depends on the collaboration and coordination of all the influencing indicators, which inevitably involves a consideration of trade-offs and synergies. Although effective decisions regarding trade-offs and synergies are context-based, maximization of the composite effect of the indicators controls the overall resilience of urban systems.
With respect to developing the URI, once we obtained the individual indicators, we normalized their actual values to the standardized values that had the same range before further calculation. Moreover, they were all assumed to be equally important and were given the same weight. The reason for using the same weight rather than weighing by more sophisticated methods (e.g., principal component analysis or multi-criteria decision analysis) was mainly to avoid the introduction of extra subjectivity [59]. Additionally, to the best of our knowledge, there is no evidence regarding the relative importance of the proxies in urban resilience. Regarding the aggregation of the four indicators, this study adopted multiplication because of the consideration of the nonlinear interactions between indicators and their coupling effects, which have already been explained.
4.2. The Influence of Variations in the Urban Landscape on Urban Resilience and its Implications for Planning Practice
As the important physical foundation of urban systems, urban landscapes are one of the most meaningful and promising intermediaries to supervise and intervene in urban resilience [6]. Variations in the urban landscape are simultaneously the epitome of the dynamics of urban systems and signs of resilience potential. Urban resilience is thus influenced by modifying the diversity, decentralization, connectivity, and self-sufficiency of the landscape. From the above analysis, it is not difficult to determine that both the composition and the spatial configuration of urban landscapes influence resilience. Specifically, an oversimplified landscape would erode resilience, and an exorbitantly complex landscape would do the same. Furthermore, the adjacent relationships of different landscape types affect the level of resilience. Hence, it might be effective to manipulate the coordinated organization of urban landscapes by planning interventions to help enhance urban resilience.
The four proxies of urban resilience can be deployed as general guiding principles to shape resilience through planning practice. Because the resilience of urban systems not only reflects the capacity of immediate responses to and accommodation of uncertainties, but also refers to the transition to sustainability in relation to the social and ecological relationship, it is necessary to build secure structures and maintain sustainable functions to achieve long-term resilience [60]. Therefore, making efforts to harmonize the four aspects of the urban landscape to ensure that responsive patterns and adaptive processes coexist with uncertainties is essential to enhance urban resilience.
With regard to specific strategies, using the current status of this study area as an example, in the main urban area where dense development has been strengthened and has even spread outward, high-intensity construction should be strictly regulated in the future. It would be beneficial to increase the number of ecological patches wherever possible and to organize them appropriately to buffer adverse events and to improve opportunities for interactions between humans and nature. However, in the outskirts, moderate artificial development should be guided to disperse the pressure of over-development in the main urban area, based on the premise of promoting the organic integration of urban functions and ecological environment. It is also necessary to ensure that the patches that can provide core ecological functions will no longer be invaded. As a whole, a balanced, connected, and modular landscape pattern that simultaneously satisfies basic human needs and maintains sustainable human-nature relationships is encouraged.
More broadly, due to the openness and dynamics of urban systems, the urban landscape demonstrates a dynamic nature, indicating that the urban resilience it reflects also changes over time. It is thus suggested that an adaptive planning approach is needed for urban systems to safeguard resilience through a learning-by-doing process that allows for the continuous adjustment of the composition and configuration of the urban landscape toward a more sustainable state.
4.3. The Limitations of the Research
There is currently limited research on the quantitative assessment of urban resilience, and this study provides one attempt based on previous work. This paper built an operational framework to measure and assess urban resilience with regard to four aspects of diversity, connectivity, decentralization, and self-sufficiency, which mainly focus on the spatial dimension for a consideration of planning and design decision-making. We acknowledge that despite their significance, these four proxies may be partial and incomplete and cannot fully represent the whole story of urban resilience. Given that broader resilience properties are proposed, as mentioned in Table 4, more integrated and systematic frameworks that include various socio-economic-cultural-institutional and physical environmental dimensions are worthy of exploration. Therefore, to obtain a better understanding of resilience in complex social-ecological systems and the practice of urban resilience assessment and application, integrated perspectives that involve multidimensional proxies beyond a spatial consideration, such as social participation and institutional innovation, are necessary for further research.
5. Conclusions
The growing challenges of uncertainty in urban systems, especially in the context of global environmental change, indicate that it is necessary and urgent to nurture resilience potential to achieve long-term sustainable development. Investigations of urban resilience have aroused wide interest among multidisciplinary scholars, practitioners, and policy-makers. However, there is little quantitative research related to this relatively new issue. This study constructed an operational framework that combines the measurement and assessment of urban resilience with the broader purpose of advancing the practice of quantitative assessment and decision-making, as well as better understanding the integrated social-ecological system. Within this framework, urban resilience is seen not only as the capacity to provide effective responses to and timely recovery from disturbances, but also as the ability to transition to a sustainable trajectory in relation to maintaining a harmonious relationship between humans and nature. Through introducing the perspective of the urban landscapes, not only can the intuitively simplified features of resilience be captured, but the dynamic evolution of the urban system is reflected. More importantly, connections between landscape characteristics and resilience potential make the measurement of and human interventions to foster urban resilience more approachable. Four proxies, i.e., diversity, connectivity, decentralization, and self-sufficiency, were employed to represent urban resilience, and landscape-based tools, i.e., landscape metrics and the budget of ecosystem services, were used for their measurement. Landscape-based and spatial analysis methods were then applied to analyze the characteristics and temporal-spatial evolution of urban resilience in the central city of Shenyang from 1995 to 2015. The main findings and conclusions are summarized as follows.
The multi-scale analysis of landscape metrics (SHDI, IJI, and CONNECT) indicated that 1500 m is suitable for use as the characteristic scale for landscape pattern analysis in the study area.
The changes in landscape metrics revealed that there was an increasing tendency for the diversity and decentralization of the landscape, while the connectivity decreased.
A core-periphery pattern of the four landscape-based indicators was displayed, although it weakened in 2015.
During the study period, apparent changes in the landscape characteristics mainly occurred in the peri-urban areas, where increased diversity, a more balanced configuration, and reduced connectivity and self-sufficiency (of ecosystem services) of the landscape were clearly presented.
The spatial pattern of the urban resilience level exhibited a ring-layer difference over the study area. In the central ring, it was almost at a homogeneously low level, while in the outer ring, it became much more complex and heterogeneous, presenting a low and high mixed interphase.
Within the past two decades, the spatial variations of urban resilience have demonstrated directional preferences. Urban resilience decreased in most directions, with the exception of the south and the northwest. It indicated that appropriate modifications to safeguard good interactions between the social and ecological landscape help increase urban resilience. In contrast, high-intensity artificial construction that pays more attention to economic and social benefits while neglecting ecological benefits plays a larger role in destroying resilience.
An evident distance effect with regards to the spatial variations of urban resilience emerged. From the city center to the edge, resilience remained almost the same before decreasing, and then showed a tendency to increase. This result implied that the development and growth of urban space has a two-sided impact on urban resilience.
The evolution of urban resilience suggested that the resilience level of the entire area was slightly improved, and the internal differences were reduced.
It is essential for urban systems to build responsive structures and maintain sustainable ecosystem services to achieve resilience and sustainability. Efforts to shape urban resilience based on urban landscapes are of great significance and deserve prominent attention. The coordination and trade-offs of landscape characteristics which are referred to in this paper, i.e., diversity, connectivity, decentralization, and self-sufficiency, to maintain and move to the trajectory of benign interactions between social and ecological components, can be effective to enhance resilience. Specifically, using the central city of Shenyang as an example, high-intensity construction should be regulated in the main urban area, and more emphasis should instead be placed on increasing the number of ecological patches wherever possible and organizing them appropriately. In the outskirts, moderate artificial development should be guided to disperse the development pressure. At the same time, the integrity of the core patches that provide important ecological functions must be guaranteed. Overall, a balanced, connected, and modular landscape pattern that can simultaneously satisfy basic human needs and maintain sustainable human-nature relationships is encouraged for the improvement of urban resilience.
Author Contributions
Z.L. made the original draft preparation of this paper; Z.L. designed the research framework and conducted the analyses with infographics. C.X. and W.S. supervised conceptualization, methodology, and interpretation of the results, as well as the revision of the manuscript. Z.L., C.X., and W.S. read and approved the final manuscript.
Funding
This study was funded by the National Natural Science Foundation of China (Grant No. 41871162 and No. 41471141).
Acknowledgments
The authors would like to thank the anonymous reviewers for their constructive comments on an earlier version of this paper.
Conflicts of Interest
The authors declare no conflict of interest.
References
- Schewenius, M.; Mcphearson, T.; Elmqvist, T. Opportunities for increasing resilience and sustainability of urban social–ecological systems: Insights from the urbes and the cities and biodiversity outlook projects. AMBIO 2014, 43, 434–444. [Google Scholar] [CrossRef] [PubMed]
- Walker, B.; Salt, D. Resilience Thinking: Sustaining Ecosystems and People in A Changing World; Island Press: Washington, WA, USA, 2006; pp. 35–42. [Google Scholar]
- Wu, J. Urban ecology and sustainability: The state-of-the-science and future directions. Landsc. Urban Plan. 2014, 125, 209–221. [Google Scholar] [CrossRef]
- Sharifi, A.; Chelleri, L.; Fox-Lent, C.; Grafakos, S.; Pathak, M.; Olazabal, M.; Moloney, S.; Yumagulova, L.; Yamagata, Y. Conceptualizing Dimensions and Characteristics of Urban Resilience: Insights from a Co-Design Process. Sustainability 2017, 9, 1032. [Google Scholar] [CrossRef]
- Ahern, J. From fail-safe to safe-to-fail: Sustainability and resilience in the new urban world. Landsc. Urban Plan. 2011, 100, 341–343. [Google Scholar] [CrossRef] [Green Version]
- Ahern, J. Urban landscape sustainability and resilience: the promise and challenges of integrating ecology with urban planning and design. Landsc. Ecol. 2013, 28, 1203–1212. [Google Scholar] [CrossRef]
- Holling, C.S. Engineering resilience versus ecological resilience. In Engineering within Ecological Constraints; Schulze, P.C., Ed.; National Academic Press: Washington, WA, USA, 1996; pp. 31–32. [Google Scholar]
- Davoudi, S.; Shaw, K.; Haider, L.J.; Quinlan, A.E.; Peterson, G.D.; Wilkinson, C.; Fünfgeld, H.; McEvoy, D.; Porter, L.; Davoudi, S. Resilience: A bridging concept or a dead end? “Reframing” resilience: challenges for planning theory and practice interacting traps: resilience assessment of a pasture management system in Northern Afghanistan Urban resilience: what does it mean in planning practice? Resilience as a useful concept for climate change adaptation? The politics of resilience for planning: a cautionary note. Plan. Theory Pract. 2012, 13, 299–333. [Google Scholar] [CrossRef]
- Nunes, D.M.; Tomé, A.; Pinheiro, M.D. Urban-centric resilience in search of theoretical stabilisation? A phased thematic and conceptual review. J. Environ. Manag. 2019, 230, 282–292. [Google Scholar] [CrossRef] [PubMed]
- Collier, M.J.; Nedović-Budić, Z.; Aerts, J.; Connop, S.; Foley, D.; Foley, K.; Newport, D.; McQuaid, S.; Slaev, A.; Verburg, P. Transitioning to resilience and sustainability in urban communities. Cities 2013, 32, S21–S28. [Google Scholar] [CrossRef] [Green Version]
- Quigley, M.; Blair, N.; Davison, K. Articulating a social-ecological resilience agenda for urban design. J. Urban Des. 2018, 23, 581–602. [Google Scholar] [CrossRef]
- Colucci, A. Towards resilient cities. Comparing approaches/strategies. J. Land Use Mobil. Environ. 2012, 5, 101–116. [Google Scholar] [CrossRef]
- Meerow, S.; Newell, J.P.; Stults, M. Defining urban resilience: A review. Landsc. Urban Plan. 2016, 147, 38–49. [Google Scholar] [CrossRef]
- Grafakos, S.; Gianoli, A.; Tsatsou, A. Towards the development of an integrated sustainability and resilience benefits assessment framework of urban green growth interventions. Sustainability 2016, 8, 461. [Google Scholar] [CrossRef]
- Spaans, M.; Waterhout, B. Building up resilience in cities worldwide—Rotterdam as participant in the 100 Resilient Cities Programme. Cities 2017, 61, 109–116. [Google Scholar] [CrossRef]
- Davoudi, S.; Brooks, E.; Mehmood, A. Evolutionary Resilience and Strategies for Climate Adaptation. Plan. Pract. Res. 2013, 28, 307–322. [Google Scholar] [CrossRef] [Green Version]
- Folke, C.; Carpenter, S.R.; Walker, B.; Scheffer, M.; Chapin, T.; Rockström, J. Resilience thinking: integrating resilience, adaptability and transformability. Ecol. Soc. 2010, 15, 299–305. [Google Scholar] [CrossRef]
- Romero-Lankao, P.; Gnatz, D.M.; Wilhelmi, O.; Hayden, M. Urban Sustainability and Resilience: From Theory to Practice. Sustainability 2016, 8, 1224. [Google Scholar] [CrossRef]
- Mehmood, A. Of resilient places: Planning for urban resilience. Eur. Plan. Stud. 2016, 24, 407–419. [Google Scholar] [CrossRef]
- Ernstson, H.; Leeuw, S.E.; Redman, C.L.; Meffert, D.J.; Davis, G.; Alfsen, C.; Elmqvist, T. Urban Transitions: On Urban Resilience and Human-Dominated Ecosystems. Ambio 2010, 39, 531–545. [Google Scholar] [CrossRef] [Green Version]
- Mcphearson, T.; Andersson, E.; Elmqvist, T.; Frantzeskaki, N. Resilience of and through urban ecosystem services. Ecosyst. Serv. 2015, 12, 152–156. [Google Scholar] [CrossRef]
- Zaidi, R.Z.; Pelling, M. Institutionally configured risk: Assessing urban resilience and disaster risk reduction to heat wave risk in London. Urban Stud. 2015, 52, 1218–1233. [Google Scholar] [CrossRef]
- Angeler, D.G.; Allen, C.R. Quantifying resilience. J. Appl. Ecol. 2016, 53, 617–624. [Google Scholar] [CrossRef]
- Folke, C. Resilience: The emergence of a perspective for social–ecological systems analyses. Glob. Environ. Chang. 2006, 16, 253–267. [Google Scholar] [CrossRef]
- Lu, P.; Stead, D. Understanding the notion of resilience in spatial planning: A case study of Rotterdam, The Netherlands. Cities 2013, 35, 200–212. [Google Scholar] [CrossRef]
- Zhai, G.; Li, S.; Chen, J. Reducing Urban Disaster Risk by Improving Resilience in China from a Planning Perspective. Hum. Ecol. Risk Assess. Int. J. 2015, 21, 1206–1217. [Google Scholar] [CrossRef]
- Su, Y.S. Rebuild, retreat, or resilience: Urban flood vulnerability analysis and simulation in Taipei. Int. J. Disaster Resil. Built Environ. 2017, 8, 110–123. [Google Scholar] [CrossRef]
- González, D.P.; Monsalve, M.; Moris, R.; Herrera, C. Risk and Resilience Monitor: Development of multiscale and multilevel indicators for disaster risk management for the communes and urban areas of Chile. Appl. Geogr. 2018, 94, 262–271. [Google Scholar] [CrossRef]
- Cote, M.; Nightingale, A.J. Resilience thinking meets social theory: Situating social change in socio-ecological systems (SES) research. Prog. Hum. Geogr. 2012, 36, 475–489. [Google Scholar] [CrossRef]
- Tyler, S.; Nugraha, E.; Nguyen, H.K.; Nguyen, N.V.; Sari, A.D.; Thinpanga, P.; Tran, T.T.; Verma, S.S. Indicators of urban climate resilience: A contextual approach. Environ. Sci. Policy 2016, 66, 420–426. [Google Scholar] [CrossRef]
- Masnavi, M.R.; Gharai, F.; Hajibandeh, M. Exploring urban resilience thinking for its application in urban planning: A review of literature. Int. J. Environ. Sci. Technol. 2018, 16, 567–582. [Google Scholar] [CrossRef]
- Marcus, L.; Colding, J. Toward an integrated theory of spatial morphology and resilient urban systems. Ecol. Soc. 2014, 19, 55–67. [Google Scholar] [CrossRef]
- Carpenter, S.R.; Westley, F.; Turner, M.G. Surrogates for resilience of social–ecological systems. Ecosystems 2005, 8, 941–944. [Google Scholar] [CrossRef]
- Quinlan, A.E.; Berbés-Blázquez, M.; Haider, L.J.; Peterson, G.D. Measuring and assessing resilience: Broadening understanding through multiple disciplinary perspectives. J. Appl. Ecol. 2016, 53, 677–687. [Google Scholar] [CrossRef]
- Salat, S. A systemic approach of urban resilience: Power laws and urban growth patterns. Int. J. Urban Sustain. Dev. 2017, 9, 1–29. [Google Scholar] [CrossRef]
- Salingaros, N.A. Complexity and urban coherence. J. Urban Des. 2000, 5, 291–316. [Google Scholar] [CrossRef]
- Wood, S.; Dovey, K. Creative Multiplicities: Urban morphologies of creative clustering. J. Urban Des. 2014, 20, 52–74. [Google Scholar] [CrossRef]
- Chelleri, L. From the <Resilient City> to Urban Resilience. A review essay on understanding and integrating the resilience perspective for urban systems. Documents d’Anàlisi Geogràfica 2012, 58. [Google Scholar] [CrossRef]
- Moench, M. Experiences applying the climate resilience framework: Linking theory with practice. Dev. Pract. 2014, 24, 447–464. [Google Scholar] [CrossRef]
- De Montis, A.; Caschili, S.; Mulas, M.; Modica, G.; Ganciu, A.; Bardi, A.; Leddaa, A.; Dessenac, L.; Laudarid, L.; Fichera, C.R. Urban–rural ecological networks for landscape planning. Land Use Policy 2016, 50, 312–327. [Google Scholar] [CrossRef]
- Olazabal, M.; Chelleri, L.; Sharifi, A. Is Connectivity a Desirable Property in Urban Resilience Assessments? In Resilience-Oriented Urban Planning; Yamagata, Y., Sharifi, A., Eds.; Springer: Cham, Switzerland, 2018; Volume 65, pp. 197–211. [Google Scholar] [CrossRef]
- Sharifi, A. Resilient urban forms: A macro-scale analysis. Cities 2019, 85, 1–14. [Google Scholar] [CrossRef]
- Carpenter, A.M. Resilience in the social and physical realms: lessons from the Gulf Coast. Int. J. Disaster Risk Reduct. 2015, 14, 290–301. [Google Scholar] [CrossRef]
- Feliciotti, A.; Romice, O.; Porta, S. Masterplanning for change: lessons and directions. In Proceedings of the 29th Annual AESOP Prague 2015 Congress, Prague, Czech Republic, 13–16 July 2015; Available online: http://aesop2015.guarant.eu/aesop-2015-proceedings-2015-07-09.pdf (accessed on 24 April 2019).
- McPhearson, T.; Hamstead, Z.A.; Kremer, P. Urban Ecosystem Services for Resilience Planning and Management in New York City. AMBIO 2014, 43, 502–515. [Google Scholar] [CrossRef] [PubMed] [Green Version]
- Ebert, U.; Welsch, H. Meaningful environmental indices: A social choice approach. J. Environ. Econ. Manag. 2004, 47, 270–283. [Google Scholar] [CrossRef]
- Wu, J.; Jelinski, D.E.; Luck, M.; Tueller, P.T. Multiscale Analysis of Landscape Heterogeneity: Scale Variance and Pattern Metrics. Geogr. Inf. Sci. 2000, 6, 6–19. [Google Scholar] [CrossRef] [PubMed] [Green Version]
- Nansen, C. Use of variogram parameters in analysis of hyperspectral imaging data acquired from dual-stressed crop leaves. Remote Sens. 2012, 4, 180–193. [Google Scholar] [CrossRef]
- Wang, C.; Yang, Q.; Jupp, D.L.B.; Pang, G. Modeling change of topographic spatial structures with DEM resolution using semi-variogram analysis and filter bank. Int. J. Geo-Inf. 2016, 5, 107. [Google Scholar] [CrossRef]
- Liu, X.M.; Xu, J.M.; Zhang, M.K.; Huang, J.H.; Shi, J.C.; Yu, X.F. Application of geostatistics and GIS technique to characterize spatial variabilities of bioavailable micronutrients in paddy soils. Environ. Geol. 2004, 46, 189–194. [Google Scholar] [CrossRef]
- Burkhard, B.; Kroll, F.; Nedkov, S.; Müller, F. Mapping ecosystem service supply, demand and budgets. Ecol. Indic. 2012, 21, 17–29. [Google Scholar] [CrossRef]
- Understanding Reclassification. Available online: https://pro.arcgis.com/en/pro-app/tool-reference/spatial-analyst/understanding-reclassification.htm (accessed on 24 April 2019).
- Pizzo, B. Problematizing resilience: implications for planning theory and practice. Cities 2015, 43, 133–140. [Google Scholar] [CrossRef]
- 100 Resilient Cities. Available online: http://www.100resilientcities.org/ (accessed on 24 April 2019).
- Sharifi, A.; Yamagata, Y. Major principles and criteria for development of an urban resilience assessment index. In Proceedings of the International Conference and Utility Exhibition on Green Energy for Sustainable Development, Pattaya, Thailand, 19–21 March 2014. [Google Scholar] [CrossRef]
- Meerow, S.; Stults, M. Comparing Conceptualizations of Urban Climate Resilience in Theory and Practice. Sustainability 2016, 8, 701. [Google Scholar] [CrossRef]
- Feliciotti, A.; Romice, O.; Porta, S. Design for change: Five proxies for resilience in the urban form. Open House Int. 2016, 41, 23–30. [Google Scholar]
- Allen, C.R.; Birge, H.E.; Angeler, D.G.; Arnold, C.A.; Chaffin, B.C.; de Caro, D.A.; Garmestani, A.S.; Gunderson, L. Quantifying uncertainty and trade-offs in resilience assessments. Ecol. Soc. 2018, 23, 3–25. [Google Scholar] [CrossRef]
- Aubrecht, C.; Özceylan, D. Identification of heat risk patterns in the U.S. National Capital Region by integrating heat stress and related vulnerability. Environ. Int. 2013, 56, 65–77. [Google Scholar] [CrossRef] [PubMed]
- Wilkinson, C. Social-ecological resilience: Insights and issues for planning theory. Plan. Theory 2012, 11, 148–169. [Google Scholar] [CrossRef]
Figure 1.
The study area.

Figure 2.
The results of landscape classification.

Figure 3.
Spatial variations of landscape metrics on multiple continuous scales.

Figure 4.
Spatial patterns of four landscape-based indicators.

Figure 5.
Spatial patterns of urban resilience.

Figure 6.
Characteristics of urban resilience in the transect lines.

Figure 7.
The distance gradient of changes in urban resilience.

Figure 8.
Statistics of the area ratios of different hierarchies of urban resilience.


Table 1.
Description of the landscape-based indicators and the corresponding calculations.
| Proxy | Landscape-Based Indicator | Description | Calculation Formula | Unit/Range |
|---|---|---|---|---|
| Diversity | Shannon’s diversity index (SHDI) | The complexity and richness of landscape composition. | , where pi is the proportion of patch class i in the total landscape; m is the number of patch classes. | --/(0, +∞) |
| Decentralization | Interspersion and juxtaposition index (IJI) | The dispersed or concentrated distributions of different landscape types. | , where is the adjacent edge length of patch class i and patch class k; m ditto. | %/(0, 100) |
| Connectivity | Connectance index (CONNECT) | The spatial continuity of the landscape, which is closely related to its functions. | , where is the connection value of patch j and patch k in patch class i; if connected, the value is 1; otherwise, the value is 0; is the number of patches in patch class i. | %/(0, 100) |
| Self-sufficiency | Self-sufficiency of ecosystem services (SSes) | The difference between the supply and demand of the ecosystem services generated by different landscape categories. | (see Table 2) | --/(-61, 55) |
Table 2.
Evaluation of the self-sufficiency of ecosystem services of different landscape categories (empty fields, i.e., “−”, indicate that the landscape categories are not relevant to the supply of or the demand for the corresponding ecosystem services).
Table 2.
Evaluation of the self-sufficiency of ecosystem services of different landscape categories (empty fields, i.e., “−”, indicate that the landscape categories are not relevant to the supply of or the demand for the corresponding ecosystem services).
| Regulating Services | Provisioning Service | Cultural Services | |||||||||||||||
|---|---|---|---|---|---|---|---|---|---|---|---|---|---|---|---|---|---|
| Local climate regulation | Global climate regulation | Flooding protection | Groundwater recharge | Air quality regulation | Erosion regulation | Nutrient regulation | Water Purification | Pollination | Crops | Livestock | Fodder | Wild foods | Energy | Freshwater | Recreation aesthetic values | Intrinsic value of biodiversity | |
| Residential landscape | −5 | −3 | −4 | −5 | −5 | −1 | −1 | −1 | −3 | −5 | −5 | −1 | −1 | −4 | −5 | −4 | −2 |
| Administration and public service landscape | −1 | −5 | −4 | −5 | −5 | −1 | −3 | −3 | −4 | −5 | −5 | −5 | −4 | −4 | −5 | −1 | −1 |
| Commercial and business landscape | −1 | −5 | −4 | −5 | −5 | −1 | −3 | −3 | −4 | −5 | −5 | −5 | −4 | −4 | −5 | −1 | −1 |
| Industrial landscape | −1 | −5 | −4 | −5 | −5 | −1 | −3 | −3 | −4 | −5 | −5 | −5 | −4 | −4 | −5 | −1 | −1 |
| Logistics and warehouse landscape | −2 | −4 | −4 | −1 | −4 | −3 | - | - | −1 | - | - | - | - | −4 | −1 | −2 | - |
| Road and transportation landscape | −2 | −4 | −4 | −1 | −4 | −3 | - | - | −1 | - | - | - | - | −4 | −1 | −2 | - |
| Public utilities landscape | −2 | −2 | - | −2 | −3 | - | - | −2 | - | - | - | - | - | 0 | −2 | - | - |
| Green space and square landscape | 0 | 1 | 0 | 1 | 0 | 2 | 1 | 1 | −1 | −1 | −1 | − | 1 | −1 | −2 | −1 | −1 |
| Other urban construction landscape | −2 | 0 | −2 | 0 | −1 | −2 | −2 | −2 | 0 | 0 | 0 | 0 | 0 | −4 | −2 | 0 | 0 |
| Agricultural landscape | 2 | 0 | 1 | 1 | 0 | 2 | −3 | −1 | −2 | 2 | 3 | 2 | 3 | 0 | −2 | 2 | 3 |
| Forest landscape | 5 | 4 | 3 | 2 | 5 | 5 | 5 | 5 | 5 | - | - | 1 | 4 | 1 | - | 5 | 5 |
| Meadow landscape | 0 | −2 | 0 | 1 | - | 4 | −1 | −2 | - | - | 4 | 2 | - | 0 | −2 | 3 | - |
| Water area and wetland landscape | 2 | 1 | 1 | 2 | - | - | 1 | - | - | - | - | - | 4 | - | 5 | 5 | 4 |
Table 3.
Statistics of landscape metrics.
| 1995 | 2015 | |||||
|---|---|---|---|---|---|---|
| SHDI | IJI | CONNECT | SHDI | IJI | CONNECT | |
| Minimum | 0.00 | 0.00 | 0.00 | 0.00 | 0.00 | 0.00 |
| Maximum | 2.10 | 100.00 | 99.62 | 2.24 | 100.00 | 99.62 |
| Mean | 0.71 | 60.26 | 62.59 | 1.23 | 66.34 | 54.17 |
| Std Dev | 0.48 | 16.7 | 20.46 | 0.43 | 11.44 | 11.98 |
Table 4.
Summary of resilience properties from the social–ecological perspective.
| Source | Resilience Properties |
|---|---|
| Resilience alliance [54] | Reflectiveness, resourcefulness, robustness, redundancy, flexibility, inclusiveness, integration |
| Sharifi et al. [55] | Redundancy, diversity, independence, interdependence, robustness, resourcefulness, adaptability, collaboration, creativity, self-organization, efficiency |
| Feliciotti et al. [44] | Self-organization, autonomy, coherence, interdependency, flexibility, responsiveness/resourcefulness, feedback, creativity/innovation, diversity, redundancy, modularity, scale-free connectivity/scale hierarchy, balance/efficiency |
| Meerow et al. [56] | Robustness, redundancy, diversity, integration, inclusivity, equity, iterative process, decentralization, feedback, environmental, transparency, flexibility, forward-thinking, adaptive capacity, predictable, efficiency |
| Feliciotti et al. [57] | Diversity, redundancy, modularity, connectivity, efficiency |
| Quinlan et al. [34] | Diversity and redundancy, connectivity, feedback, learning and experimentation, participation, polycentric governance |
| Quigley et al. [11] | Diversity, social capital, innovation, learning |
| Allen et al. [58] | Biological diversity, ecological variability, modularity, acknowledging slow variables, tight feedbacks, social capital, innovation, overlap in governance, ecosystem services |
© 2019 by the authors. Licensee MDPI, Basel, Switzerland. This article is an open access article distributed under the terms and conditions of the Creative Commons Attribution (CC BY) license (http://creativecommons.org/licenses/by/4.0/).
Share and Cite
MDPI and ACS Style
Liu, Z.; Xiu, C.; Song, W. Landscape-Based Assessment of Urban Resilience and Its Evolution: A Case Study of the Central City of Shenyang. Sustainability 2019, 11, 2964. https://0-doi-org.brum.beds.ac.uk/10.3390/su11102964
AMA Style
Liu Z, Xiu C, Song W. Landscape-Based Assessment of Urban Resilience and Its Evolution: A Case Study of the Central City of Shenyang. Sustainability. 2019; 11(10):2964. https://0-doi-org.brum.beds.ac.uk/10.3390/su11102964
Chicago/Turabian StyleLiu, Zhimin, Chunliang Xiu, and Wei Song. 2019. "Landscape-Based Assessment of Urban Resilience and Its Evolution: A Case Study of the Central City of Shenyang" Sustainability 11, no. 10: 2964. https://0-doi-org.brum.beds.ac.uk/10.3390/su11102964
Note that from the first issue of 2016, this journal uses article numbers instead of page numbers. See further details here.