Article

Urban Expansion in Ethiopia from 1987 to 2017: Characteristics, Spatial Patterns, and Driving Forces

1
State Key Laboratory of Information Engineering in Surveying, Mapping, and Remote Sensing, Wuhan University, Wuhan 430079, China
2
Collaborative Innovation Center of Geospatial Technology, Wuhan 430079, China
3
Department of Agronomy-Crops, Soils, Environmental Sciences, Purdue University, West Lafayette, IN 47907, USA
4
Department of Agronomy of Earth, Atmospheric, and Planetary Sciences, Purdue University, West Lafayette, IN 47907, USA
*
Author to whom correspondence should be addressed.
Sustainability 2019, 11(10), 2973; https://0-doi-org.brum.beds.ac.uk/10.3390/su11102973
Submission received: 25 April 2019 / Revised: 13 May 2019 / Accepted: 21 May 2019 / Published: 24 May 2019

Abstract

:
Rapid urban growth in major cities of a country poses challenges for sustainable development. Particularly in Africa, the process of rapid urbanization is little understood and research is mostly limited to single cities. Thus, this study provides a comprehensive comparative analysis of the growth and spatial patterns of urban development in the three major cities of Ethiopia (Addis Ababa, Adama, and Hawassa) from 1987 to 2017. Also, the applicability of diffusion and coalescence theory on the evolution of these cities has been tested. Remote sensing and GIS technologies were combined with spatial metrics and morphological analysis was employed to undertake this study. The result revealed that all the studied cities experienced accelerated growth in the urbanized areas, but the cities with a larger initial urbanized size were associated with lower expansion rates. Differences in extent and direction of expansion in each city were mostly related to physical features, urban master plans, and policies, with an increase in the irregularity and dispersion of urban growth, representing strong evidence of urban sprawl. The spatiotemporal analysis confirmed that the urbanization processes of Addis Ababa and Adama were consistent and Hawassa city diverged from expectations based on diffusion and coalescence theory. In general, large cities with strong economic growth in a country fail to effectively control the scattered nature of urban growth, thus requiring aggressive policy intervention. The approach used in this study permits a deeper exploration of urban development patterns and the identification of priority areas for effective urban planning and management.

Graphical Abstract

1. Introduction

The rapid urban growth in major cities poses enormous opportunities and challenges for the future sustainable development of a country. For instance, large cities are expected to be centers of innovation and wealth creation and need more resilient infrastructures and services resources as compared to smaller cities [1]. This development, however, also draws energy and materials from distant and nearby ecosystems. Currently, more than 54 percent of the world’s inhabitants are living in urban regions. This implies that, by 2050, 68 percent of the world’s inhabitants are expected to be urban, with nearly 90 percent of this growth will occur in Asia and Africa [2]. This fast population growth coupled with economic development resulted in rapid urban physical growth [3,4]. Consequently, unless managed well it can often lead to a serious negative environmental and socioeconomic issues such as urban heat islands, air pollution, traffic congestion, decreases of green spaces, habitat losses, inadequate infrastructure and services, and inefficient resource utilization [5,6,7,8,9,10,11,12,13,14], especially in the countries where most urban dwellers growth is expected [2].
There are numerous studies on the expansion of urban land in single metropolitan regions [3,4,6,15]. Changes and differences in the patterns of urban growth have been observed over time among some megacities [1,16,17,18,19] and scattered pattern of urban growth has been confirmed in small and mid-sized cities [20,21,22]. However, particularly in Africa, urban growth patterns and population dynamics of cities, varying in size are not well-documented. Africa is the least urbanized continent with 43 percent of its inhabitants living in the urban regions [2]. Nevertheless, most African cities are challenged by problems related to unplanned and uncontrolled rapid urban growth as informal settlements [4,21,23,24,25], become a part of the urban ecosystems. Therefore, understanding and comparing the evolution of urbanization, in large and mid-sized cities could provide a reference for urban and ecological planning, and for sustainable development.
The primary step to understand the influence of urbanization on ecological conditions is to measure the spatial and time-based patterns of urbanization [26]. Urban development can be computed on the stage of urban sprawl and the growth of suburban expansion [27]. It can also be quantified as compact or sprawl based on the spatial structure of built-up areas, the extent of the urbanized region in the landscape and land uptake per person [21,28].
A number of quantitative approaches have been applied to compute measures of the dynamics and spatial patterns of urban landscapes, accelerated by the surge of developments of landscape ecology, remote sensing technology, Geographic Information Systems (GIS), and associated fields [6,11,18,29,30,31,32]. In particular, landscape ecology methods such as landscape metrics and buffer gradient analysis have been increasingly used to characterize and compare the dynamic process of urban land use configurations [18,19,21,30,33,34]. Additionally, in a dynamic system, urban growth typologies (leapfrog, extension, and infill) are widely used to categorize urban growth forms by measuring how new development happened about the existing urban patches [29,35,36]. Furthermore, both landscape metrics and urban growth forms combined with population distribution could provide an understanding of the human use of the landscape and its trendy to sprawl [4,29].
Landscape metrics and urban growth typologies can also be used to validate the diffusion and coalescence theory suggested by Dietzel et al. [37,38]. According to Dietzel et al. [33,34], urban development process can be defined as the process of cyclic and oscillates between states of diffusion and coalescences. Diffusion refers to a dispersed development of new urban centers and patches. Coalescence, on the other hand, consists of infilling existing built-up areas to form larger patches or outward expansion. This theory has been tested and results supporting both and against the hypothesis were generated [1,19,39,40]. Nevertheless, the extrapolation of the theory is still debatable. The theory has not been tested using annual landscape metrics rate integrated with urban typologies. Thereby, testing the theory of diffusion and coalescence using annual landscape metrics rate and urban typologies across different cities at various developmental levels, histories, and locations, institutional and demographic perspectives are needed.
As the second-most populous country in Africa—Ethiopia—has been experiencing a rapid urbanization process since the implementation of economic development and privatization policy [41,42,43,44,45] to stimulate national economic growth. However, as it is observed in numerous developing countries, the intensified constraints, following the fast urbanization processes in the country, are unplanned and uncontrolled that resulting in scattered urban growth, loss of farmland, and environmental degradation. In addition, the urban physical growth rate has been faster than the rise in infrastructures and service delivery in Ethiopian cities [43]. In Ethiopia, the cities of Addis Ababa, Adama, and Hawassa have become the main hot spots to face the problems of urban dynamics. These cities have been facing urbanization challenges due to their uncontrolled fast-growing nature. Urban development has exposed these cities to serious environmental deterioration [44]. Green areas are being shifted to other land uses such as residential, industrial, and commercial developments [5,46,47].
Some studies have been attempted to analyze urban expansion and its response to the landscape in the study area. For instance, Woldegerima et al. [48] characterized the urban structure of Addis Ababa through urban morphology types and reported that the rapid urban expansion had occurred in the green space. Nigatu et al. [46] analyzed urban growth and sprawl in Hawassa during the period of 1987 to 2012 and observed the tendency of urban sprawl in the city. Sinha et al. [49] quantified the urban growth of Adama using Landsat images from 1984 to 2015 and reported that the built-up area of the city increased by 293%. While some other previous studies have concentrated on the land use pattern change in response to urban expansion [15,47,50], most of the conducted researches focused on urban expansion and its impacts on a single city. In particular, a comprehensive comparative analysis of the differences in urban area change characteristics, impacts of policies, and demographic drivers across Ethiopia’s major cities have not been investigated.
This study, therefore, was devoted to a quantitative evaluation and comparison urban land characteristics by examining urban change patterns and amounts in three major cities of Ethiopia, over the past three epochs (i.e., 1987–1995, 1995–2005, and 2005–2017), based on time-series built-up area data developed from Landsat satellite images. An integrated framework was used to undertake this study. Specifically, this investigation attempted to characterize the magnitude, rate, forms, and dynamics of urban expansion; compare the dynamics and patterns of urban development among the major cities and determine probabilities drivers; and test the pertinence of diffusion and coalescence theory on the progress of urban growth for three major Ethiopian cities. This comparative research provides insights on the interrelation between urban expansion and population, as well as the growth periods and driving forces supporting the extent and spatial pattern of urbanization in Ethiopian cities for urban planning, management, and sustainable urban development. Additionally, the study provides an integrated approach incorporating remote sensing, GIS, and spatial and demographic metrics to analyze and compare the urban growth process among different cities and explain its association with urban policies for sustainability.
The rest of the article is arranged as follows. Section 2 presents the materials and methods employed in this study. Section 3 summarizes results. Section 4 discusses the spatial and temporal urban growth patterns and possible drivers. This section also provides the applicability of diffusion and coalescence theory on the evolution of these cities tests. Lastly, conclusions are drawn in Section 5.

2. Materials and Methods
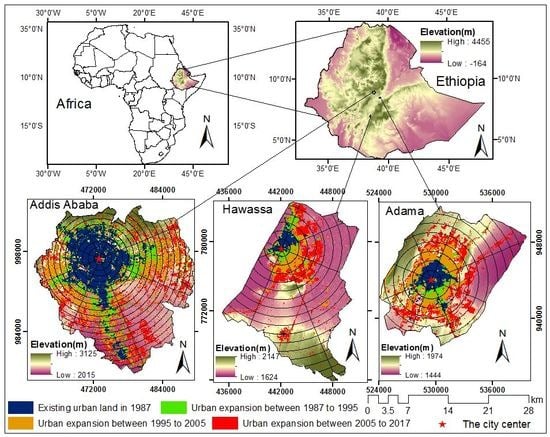
2.1. Study Area

The present study focused on the fast-growing major cities in Ethiopia (Addis Ababa, Adama, and Hawassa) as depicted in Figure 1. Addis Ababa is the capital, political, commercial, and industrial city of Ethiopia. It is also the seat of the Oromia National, Regional State, the biggest regional state in Ethiopia. It is found with a rough center located at 8°46′0″ N–9°11′30″ N latitude and 38°35′30″ E–38°57′30″ E longitude, covering an area of 527 km2. The city is situated at the height ranging from 2015 to 3125 m above sea level (m.a.s.l) (Figure 1a) with an average mean yearly temperature of 17 °C. The total population of the city was projected for 2017 to be 3.4 million [51], which accounts for 16.9 percent of the country’s urban population and 3 percent of the country’s total population, and the population is estimated to grow to 5.9 million in 2030 at an average yearly growth rate of 4.1 percent [52].
Hawassa is the capital city of the Southern Nation, Nationalities, and Peoples Region of Ethiopia. The city is located at ~275 km south of Addis Ababa along the main highway leading to Nairobi, Kenya. It is located between 6°54′ and 7°60′ N longitude and 38°24′ and 38°34′ E latitude at an elevation ranging from 1624 to 2147 m.a.s.l (Figure 1b) with an average annual mean yearly temperature of 21.1 °C. Hawassa city administration covers an area of 160.6 km2. The population of the city projected for 2017 based on the 2007 census of Ethiopia has grown to 335,840 [52].
Adama is one of the fastest growing cities of the Oromia National Regional State, Ethiopia. The city is located about 100 km southeast of Addis Ababa along the main highway leading to Djibouti (Figure 1c). It is situated at 8°25′–8° 37′ N longitude and 39°12′–39°22′ E latitude at an altitude range of 1444 to 1974 m.a.s.l covering 134.1 km2. The total population of the Adama city was projected for 2017 to be 369,947 [52].
The physical growth of all the three cities has mostly been horizontally into the outlying areas, where both formal and informal settlements were observed. Addis Ababa is the largest city, followed by Adama, while Hawassa is the most rapidly growing city among the regional cities in Ethiopia. Furthermore, all cities are now housing several industries and institutions, which attract people not only within the region, but also from all over the country. Consequently, hot spot areas for rapid urban expansion are expected in the next decades. Thus, the cities considered for this study can represent the fast urbanization processes and a demographic shift that characterizes the existing development of cities in Ethiopia.

2.2. Remote Sensing Data and Data Processing

As shown Table 1, cloud-free 30 m resolution Landsat Thematic Mapper (TM) images for 1987 and 1995, Enhanced Thematic Mapper (ETM+) images for 2005, and Operational Land Imager (OLI) images for 2017 were used to monitor urban land changes for the three cities over the past 30 years. The path/row numbers and acquisition dates of images used in this investigation are displayed in Table 1. All Landsat images were collected from the United States Geological Survey and Global Land Cover Facility websites (available at the institute’s websites). The images have the same stage of spatial resolution (30 m), making a comparison of alterations and patterns occurring within cities possible. Administrative boundaries shape files and population data were found from CSA. Historical Google Earth images data were also used for verifications.
Data processing (radiometric correction, geometric precision correction, and gap-filling of the 2005 ETM+ image) was created using ERDAS IMAGIN 2014. Depending on the spectral responses of features on the Landsat images, knowledge of the areas, visual analysis of the various remote sensing products, and use of higher spatial resolution imagery, five broad land cover types (built-up area, agricultural land, vegetation cover, barren, and water body) were identified. The built-up areas consisted of all nonvegetative covers (buildings and roads), including industrial, commercial, transportation, and residential areas within the administrative boundaries. Supervised image classification was carried out using the maximum likelihood (ML) classifier algorithm, which is one of the most popular and widely used type of image classification techniques in remote sensing, which calculates the possibility of each pixel value to belong to each land cover class and assigns it to the class with the high probability value [53]. Furthermore, after the classification, nonurban areas were fused because urban land was the focus of the study.
The classification accuracy assessment was implemented for each class of the land cover using more than 500 stratified random sampling points integrated with Google Earth’s satellite imagery [54,55] for 2005 and 2017 to calculate the overall accuracy. The classification accuracy results of 1987 and 1995 were validated by generating more than 500 random points from the areas where the land cover has remained unchanged. The results displayed that the overall accuracy of all cities was greater than 85 percent (Table 2), which can achieve the accuracy requirements for the land cover change valuation [56,57]. Detailed techniques of data processing can be observed from the earlier work [54].

2.3. Spatiotemporal Urban Expansion Analyses

The study used the following indicators to calculate and compare morphology of urban growth for all cities using Equations (1)–(5).

2.3.1. Annual Expansion (AE) and Expansion Rate (AER) of Urban Land

Exploration of urban growth for each city between four neighboring periods from 1987 to 2017 was analyzed by applying AE and AER indexes to measure the extent of urban expansion. AE is used to absolutely quantify the yearly changes of urban regions and compare the urban growth of the same study area over different times. While AER applied to avoid the extent effect of cities and make it more suitable for inter-comparison of urban growth among different cities at the same time. The two indexes were defined using Equations (1) and (2).
AE = B e B i T
AER = 100 % × [ ( B e B i ) 1 T 1 ]
where Bi and Be represent the same type of built-up area at the initial and end of the monitoring period, respectively, and T is the period from the time i to e. When T is 1 year, and AER is the annual built-up expansion rate.

2.3.2. Population and Urban Growth Rate Trend

The imbalance between inhabitants and built-up area relative growths were measured at four different dates using Equations (3) and (4), proposed by Sapena et al. [29] with some modification.
PR = 100 % × ( ( P e P i ) P i ) 1 T
PUGI = AER PR
where, Pi and Pe represent the population at the initial and end of the study period, respectively, and T is the period from the time i to e. When T is 1 year, and PR is every year population growth pace while PGUI is population and urban imbalance growth index. The sign of the index represents whether the city is located above or below the line. Thus, a negative value means that the point is below and the urban expansion is lower than the population increase. A positive value displays built-up area grows faster than the population. While 0 (or near to 0) indicates average circumstances. Higher negative values indicate population crowding, which may cause serious environmental issues, traffic congestion, and a minimum of social (and other) facilities. Higher positive values indicate higher per capita consumption of built-up areas.

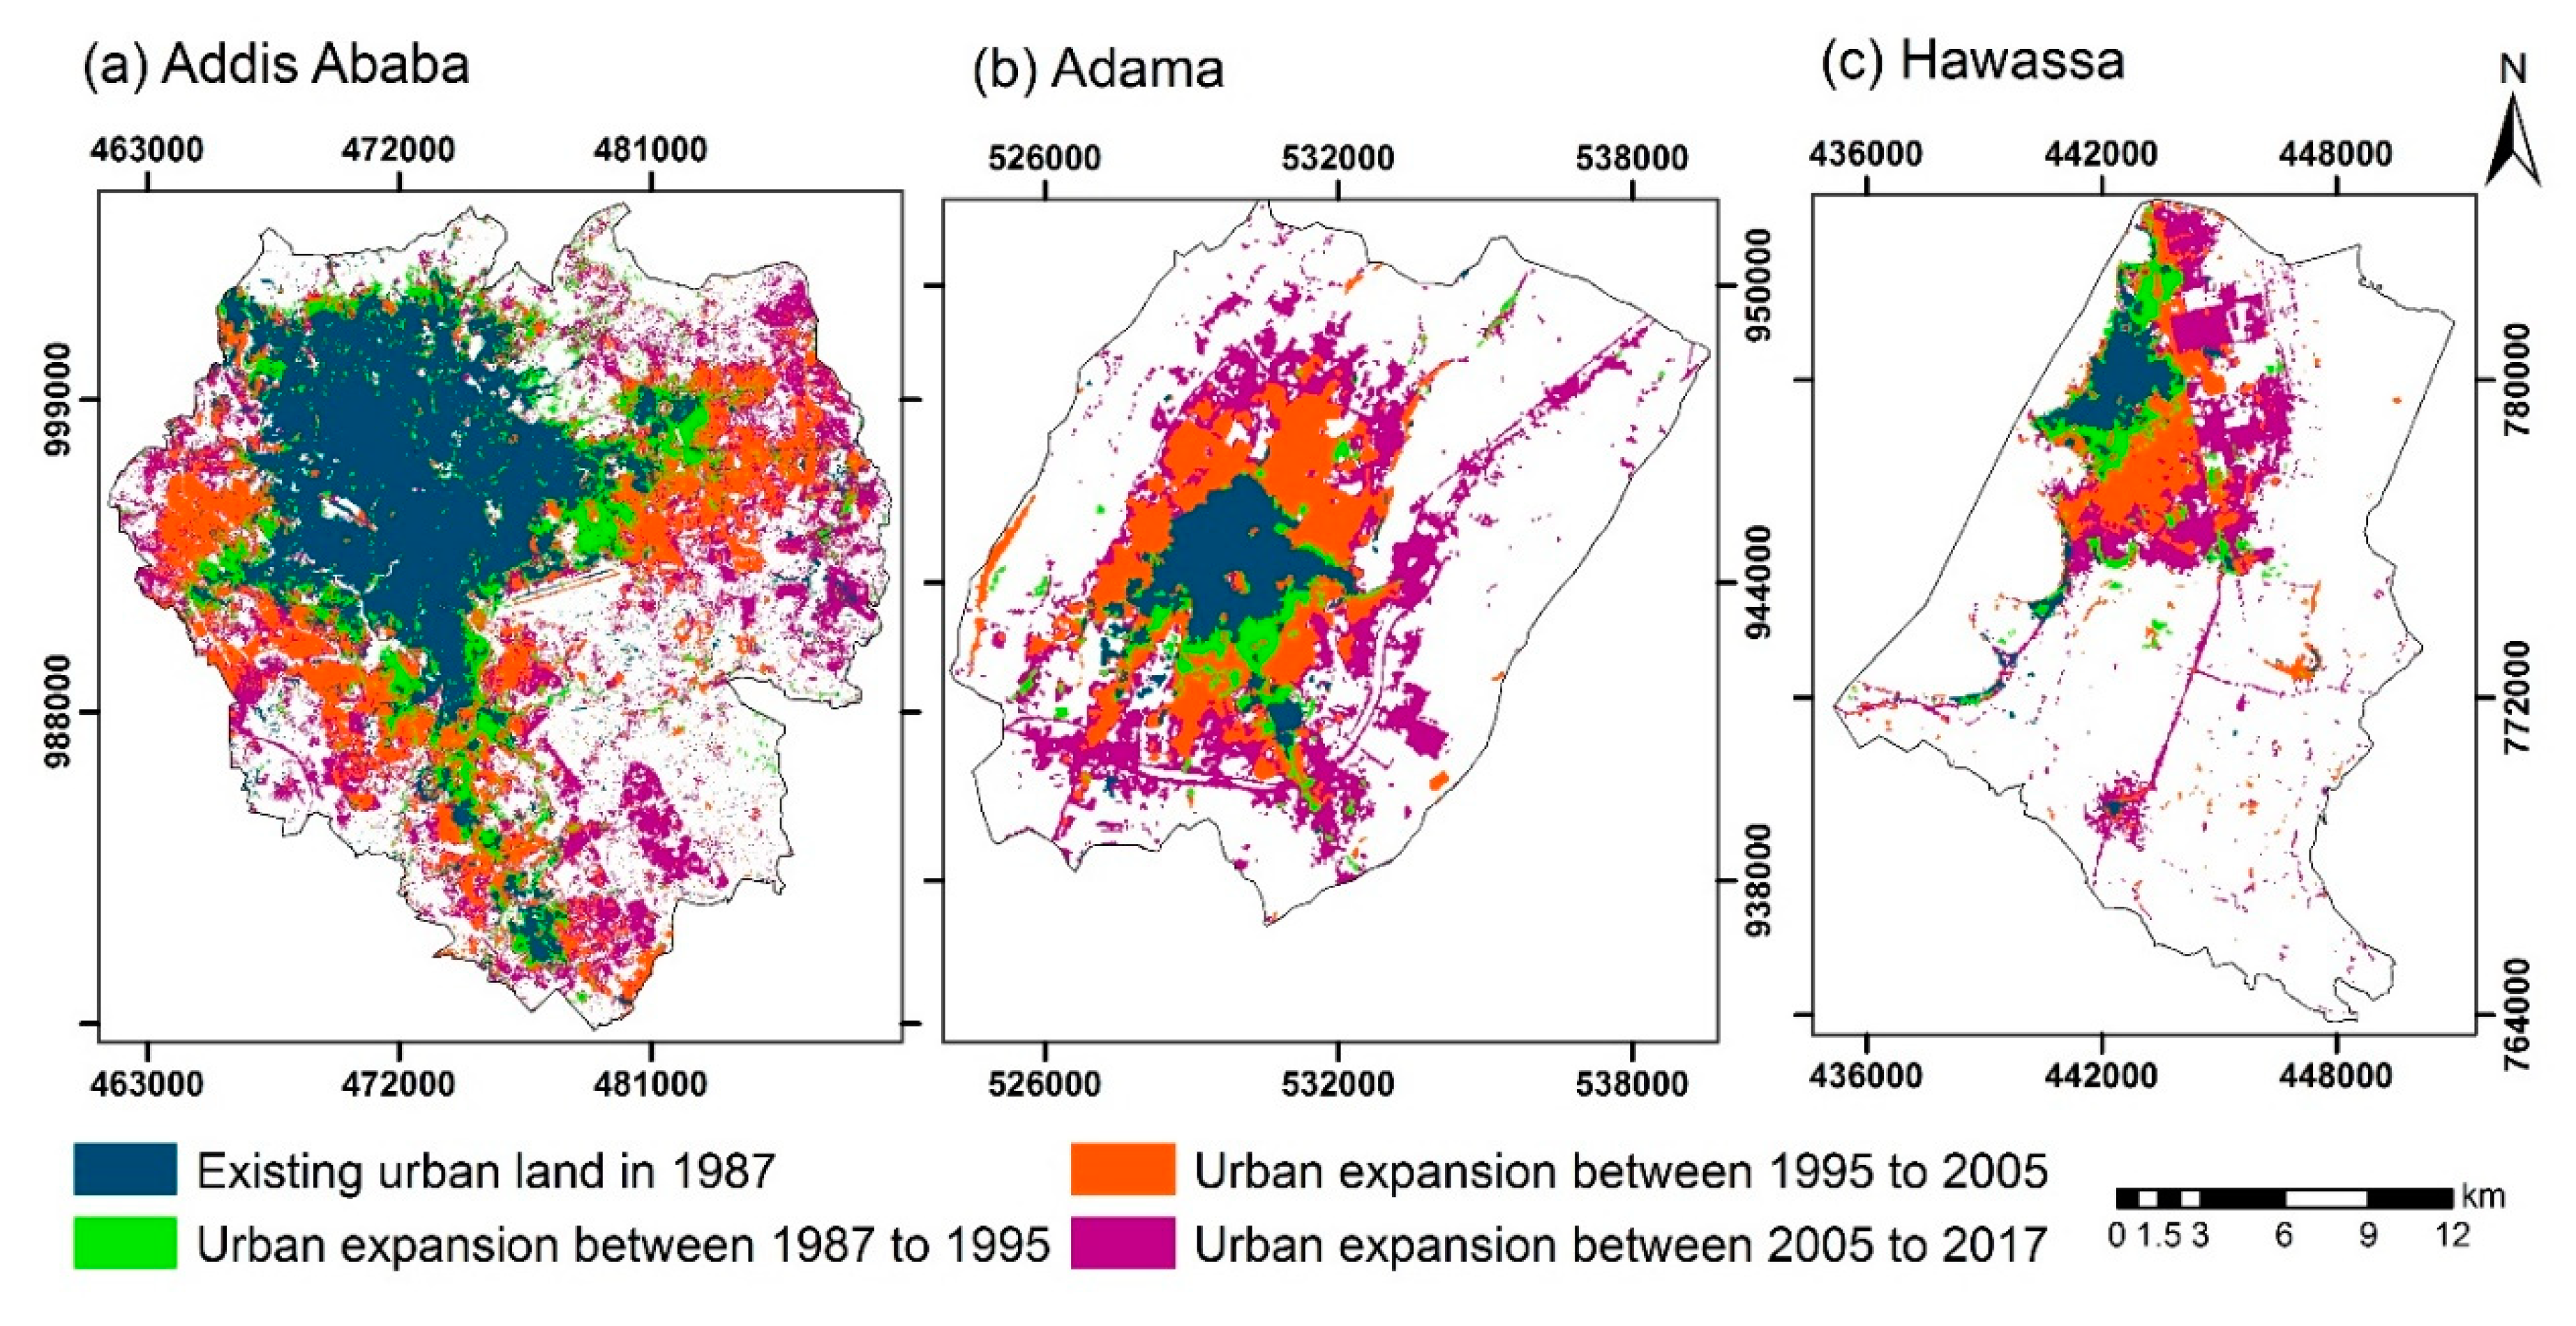
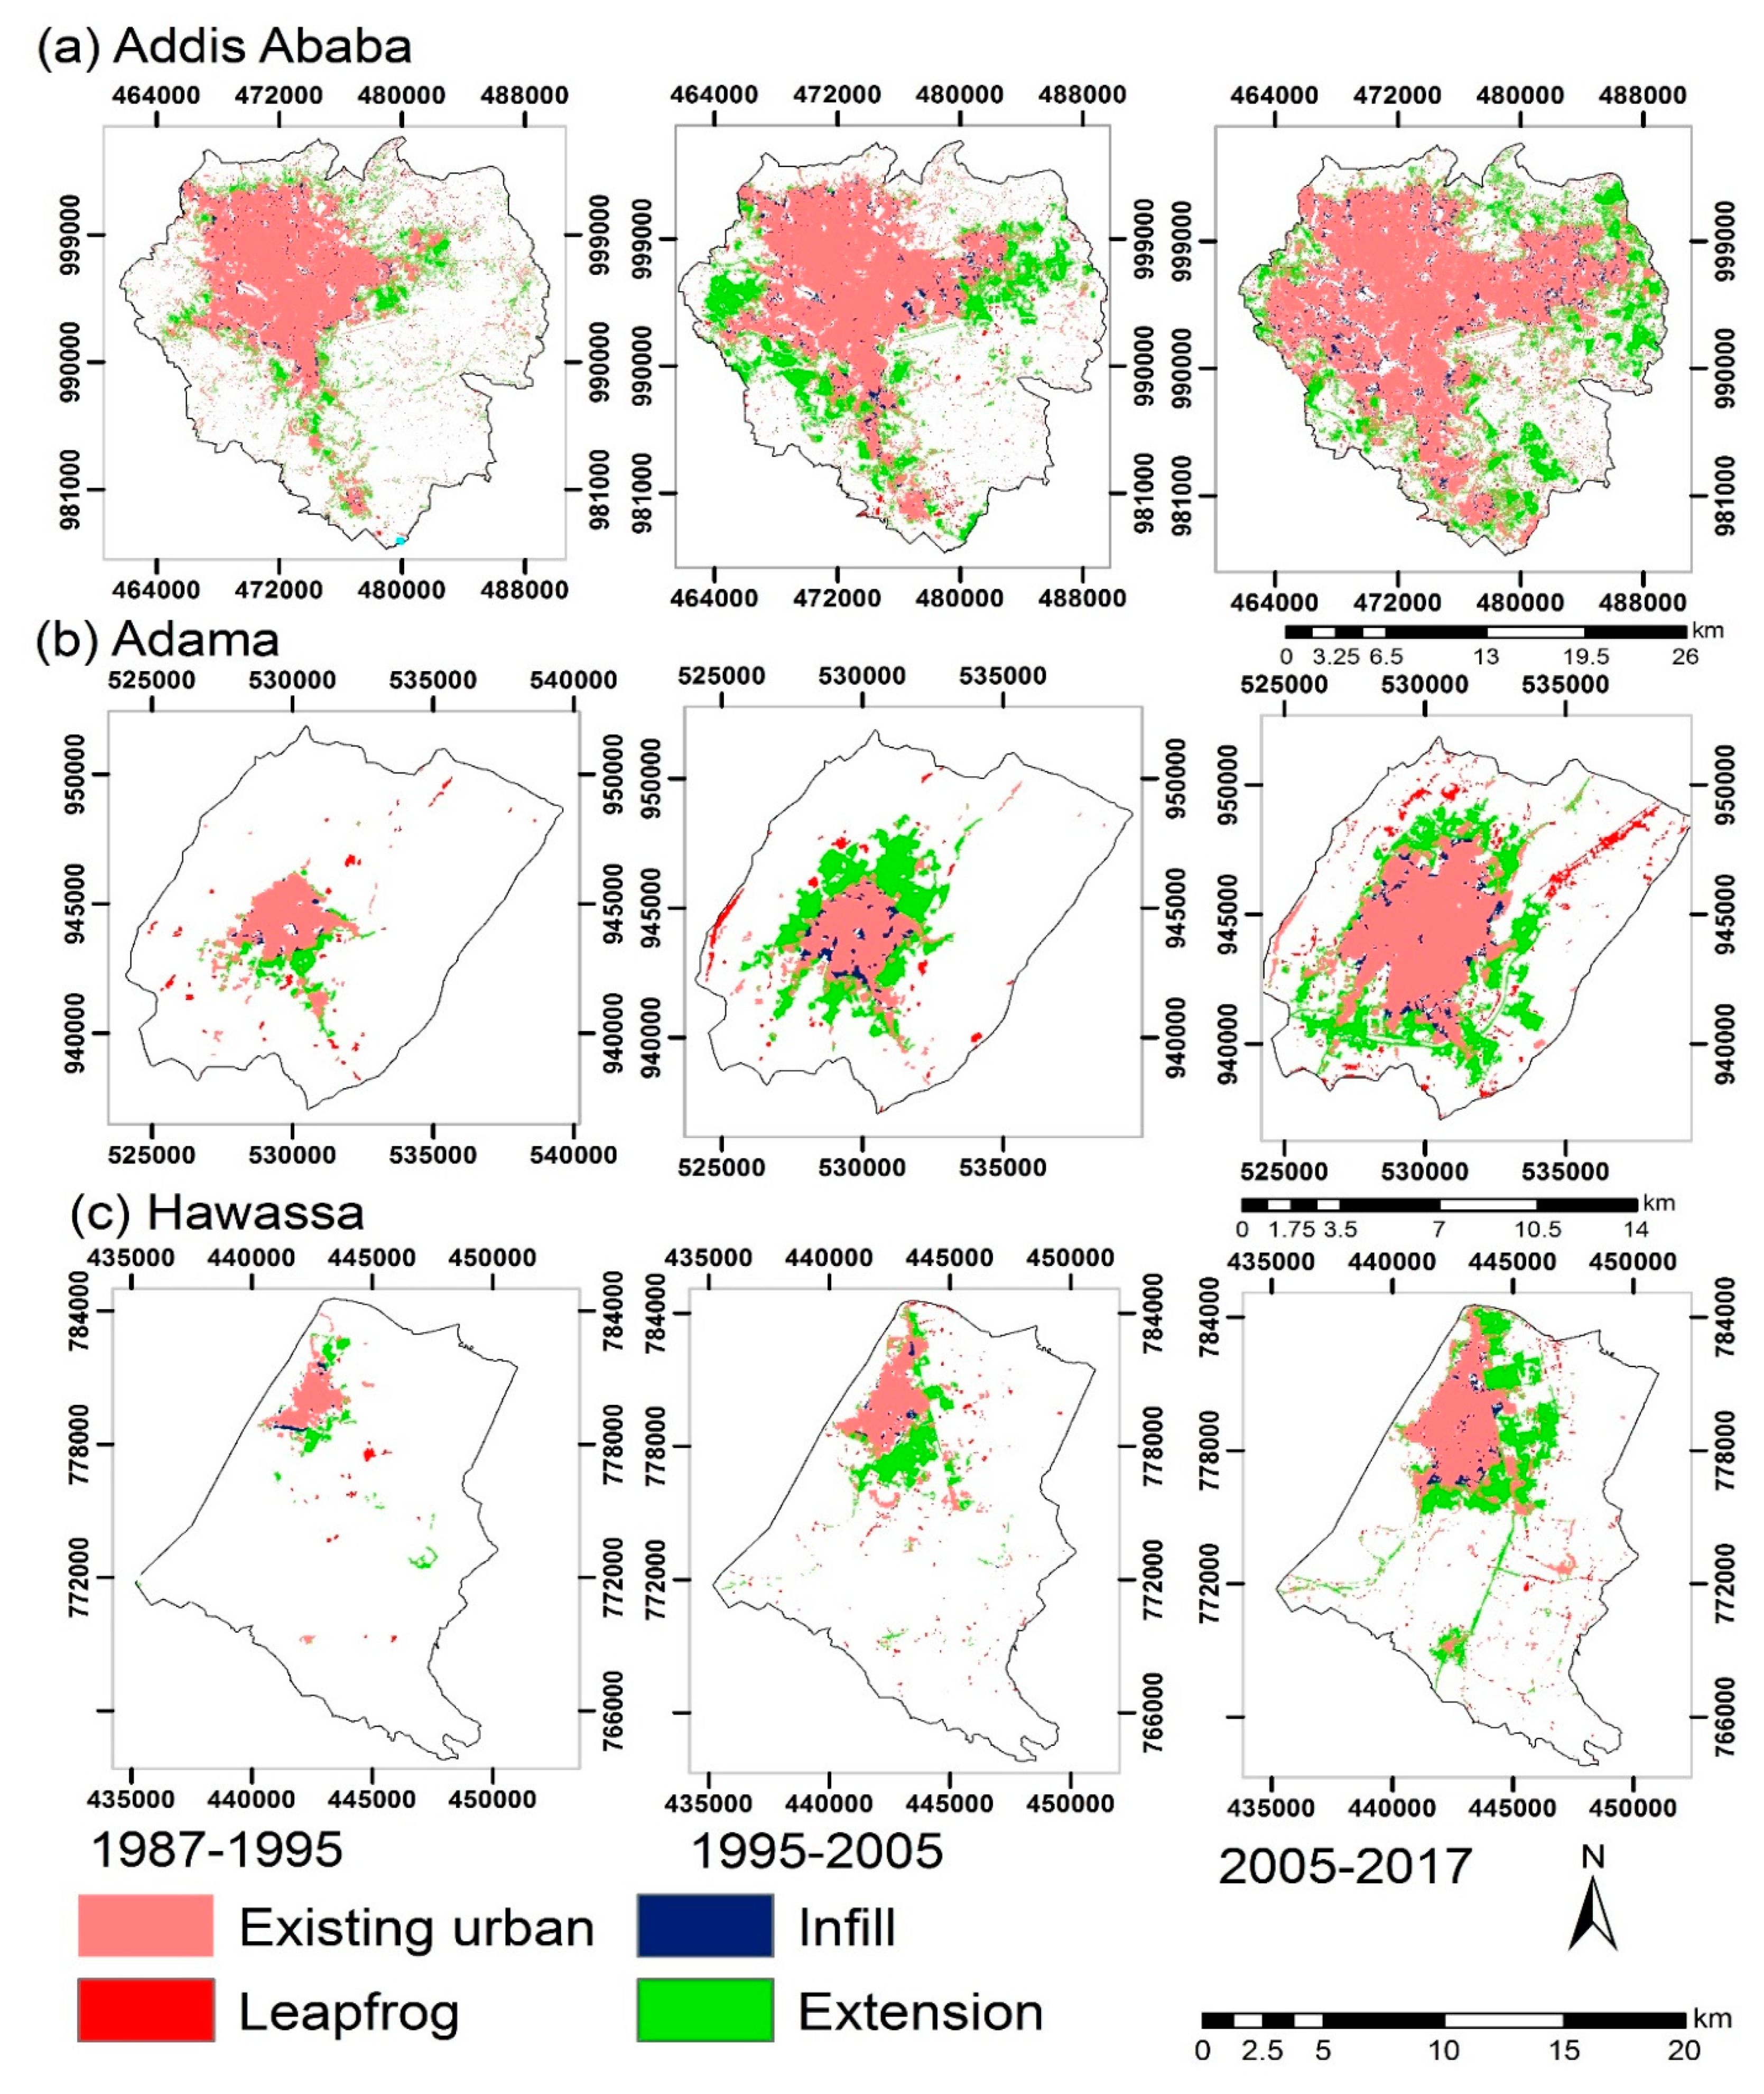
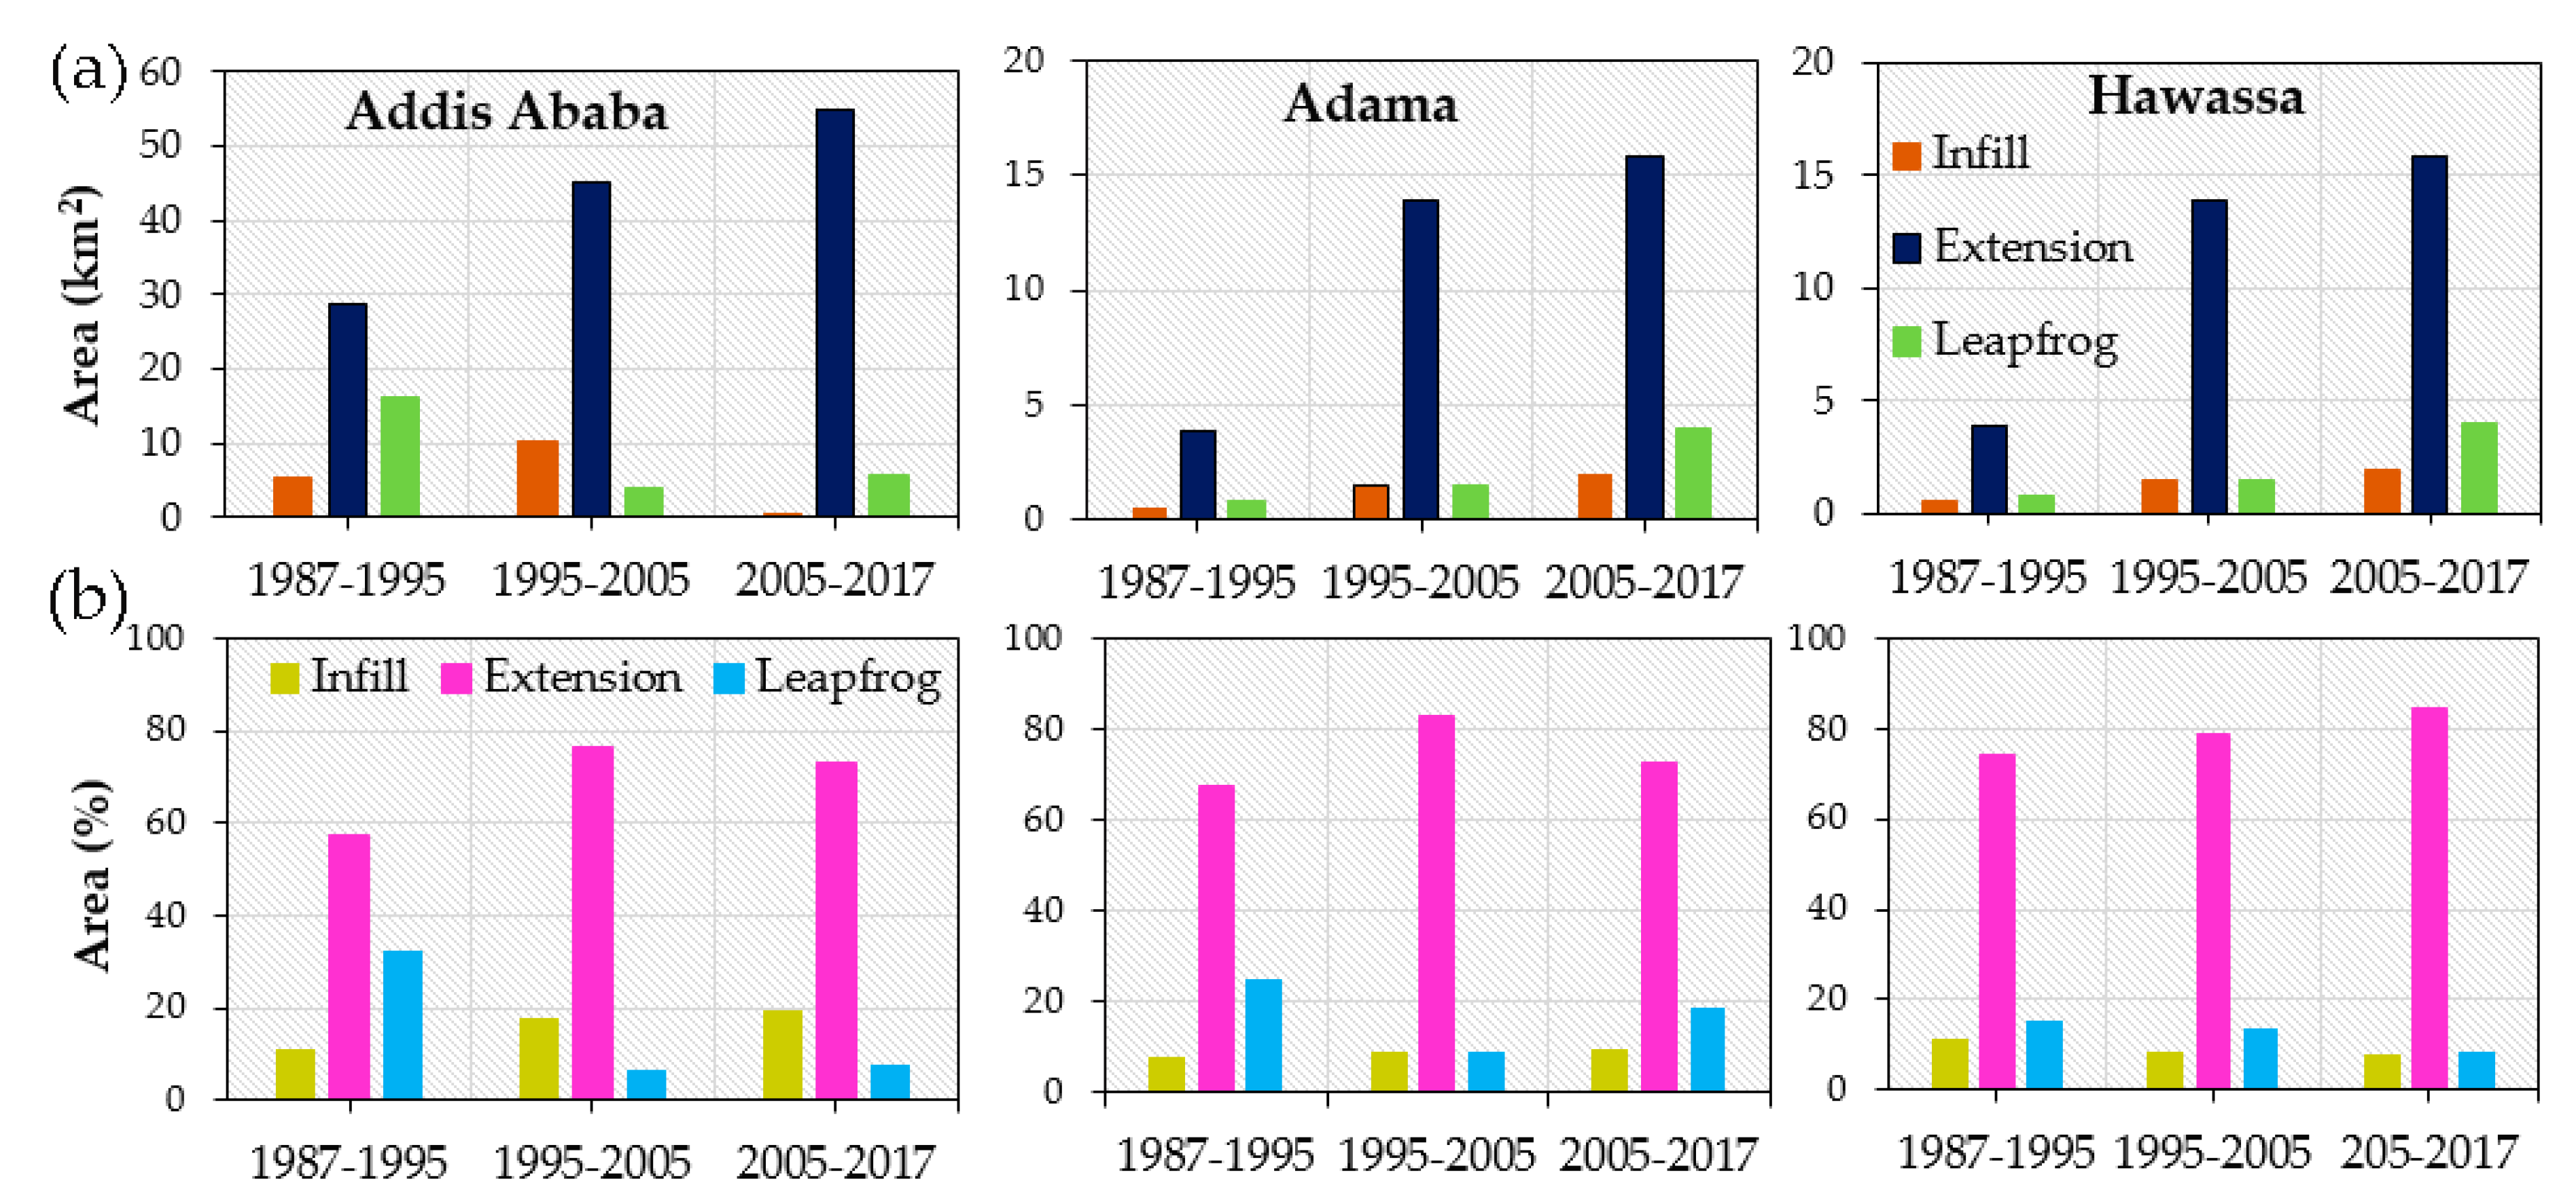
2.3.3. Identification of Newly Developed Urban Forms

Urban growth can be categorized into infilling, extension, and leapfrogging [29,35,36]. These classifications depend on the location association between the existing urban regions and the newly developed parts. If newly developed regions occur within the earlier developed areas, this development is categorized as infilling. If newly developed regions occur adjacent to the edge of the existing built-up area, it is referred to as the extension. Lastly, if newly urbanized areas are situated away from the existing urban area [35], this kind of development is known as leapfrogging expansion. Extension and leapfrogging lead to a more distributed urban form, while infilling associated with a more compacted urban form [1,35,40]. To identify the new urban growth forms in the cities over multiple periods, Urban Landscape Analysis Tool (ULAT) was applied, which reveals the structure and the types of the city [35].

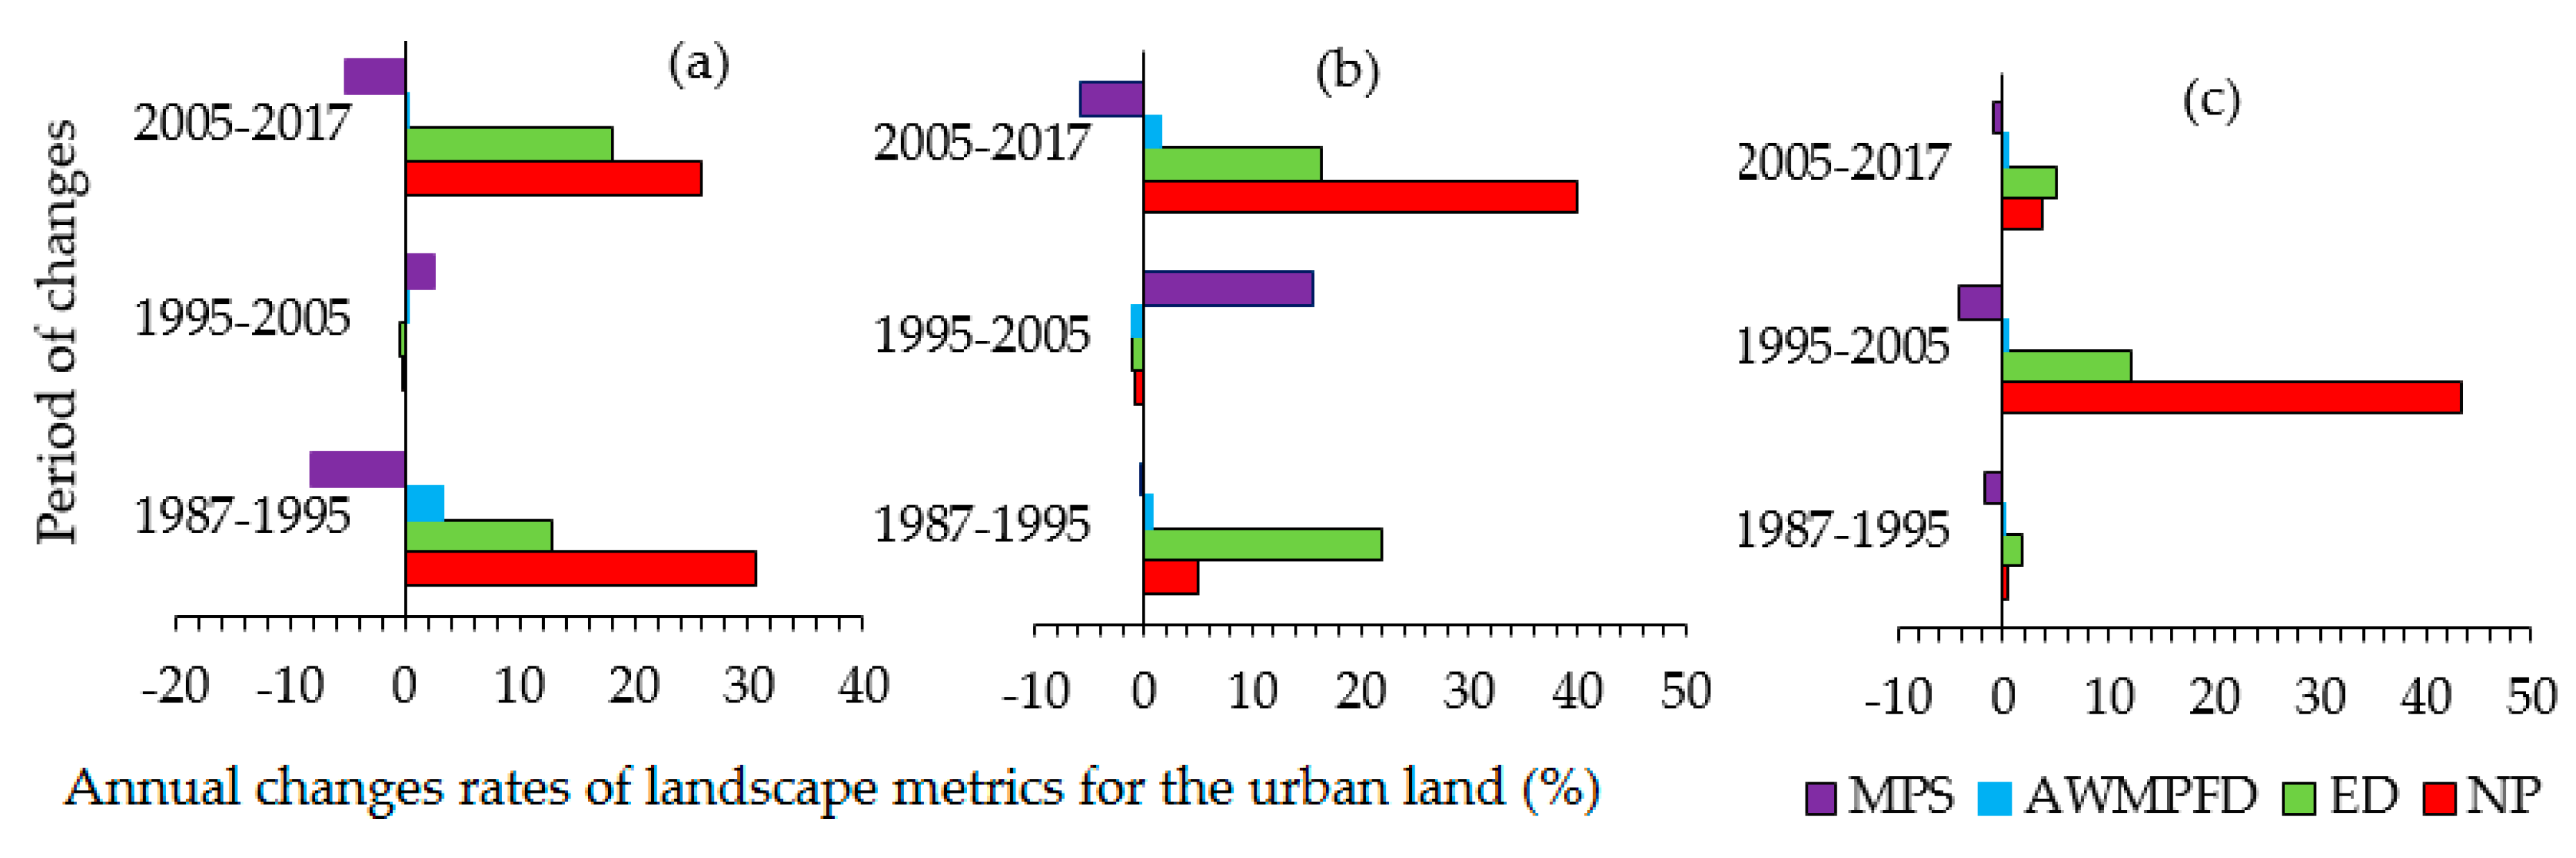
2.3.4. Multitemporal Landscape Metrics Calculation

Six class-level spatial metrics were employed to characterize landscape modifications under the influence of urbanization: class area (CA), percentage of the landscape (PLAND), number of patches (NP), area-weighted mean patch fractal dimension (AWMPFD), average patch size (MPS), and edge density (ED) (Table 3). CA and PLAND were used to measure the absolute urban area and the relative abundance of each urbanized part of the landscape, respectively. NP was used to calculate the degree of disintegration of the urbanized area, as a measure of disconnected urban areas in the landscape. ED was also used to measure the urban areas edge relative to the entire landscape area. MPS was used as determinants of the size of urban patches changed. Furthermore, AWMPFD applied to measure built-up shape complexity. The values of the metrics were computed using Patch Analyst version 5.2 (Fragstats Interface) extension in ArcGIS with the eight-neighbor rule which was developed under the Spatial Ecology Program, with programming support from the Thunder Bay Geomatics Service Centre, Ministry of Natural Resources, Ontario, Canada [58]. To define these indices as an increase/decrease of the landscape patterns, the computed landscape metrics values were converted into annual change rates for each city at city scale using Equation (5).
LMR = 100 % × ( ( L m e L m i ) L m i ) 1 T
where Lmi and Lme represent the same type of landscape metric computed values at the initial and end of the monitoring period, respectively, and T is the period from time t1 to t2. When T is 1 year, and LMR is the annual landscape metrics values rates (e.g., NP, MPS, ED, and AWMPFD).
The researchers further examined landscape metrics in eight directions and along the urban–rural gradient of an individual city. The researchers first assumed that the downtown of the city as the city center. A total of eight pie slices areas demarcated by angles of 22.5° were created, and landscape metrics in each subdivision were then created to reveal landscape characteristics in different directions. Finally, a series of the buffer regions with distances of 1 km was demarcated from the city center, for the urban expansion hotspot analysis. To prevent redundancy, only NP, PLAND, and CA were selected to describe detailed landscape characteristics at different distances and in different directions within each city.

3. Results

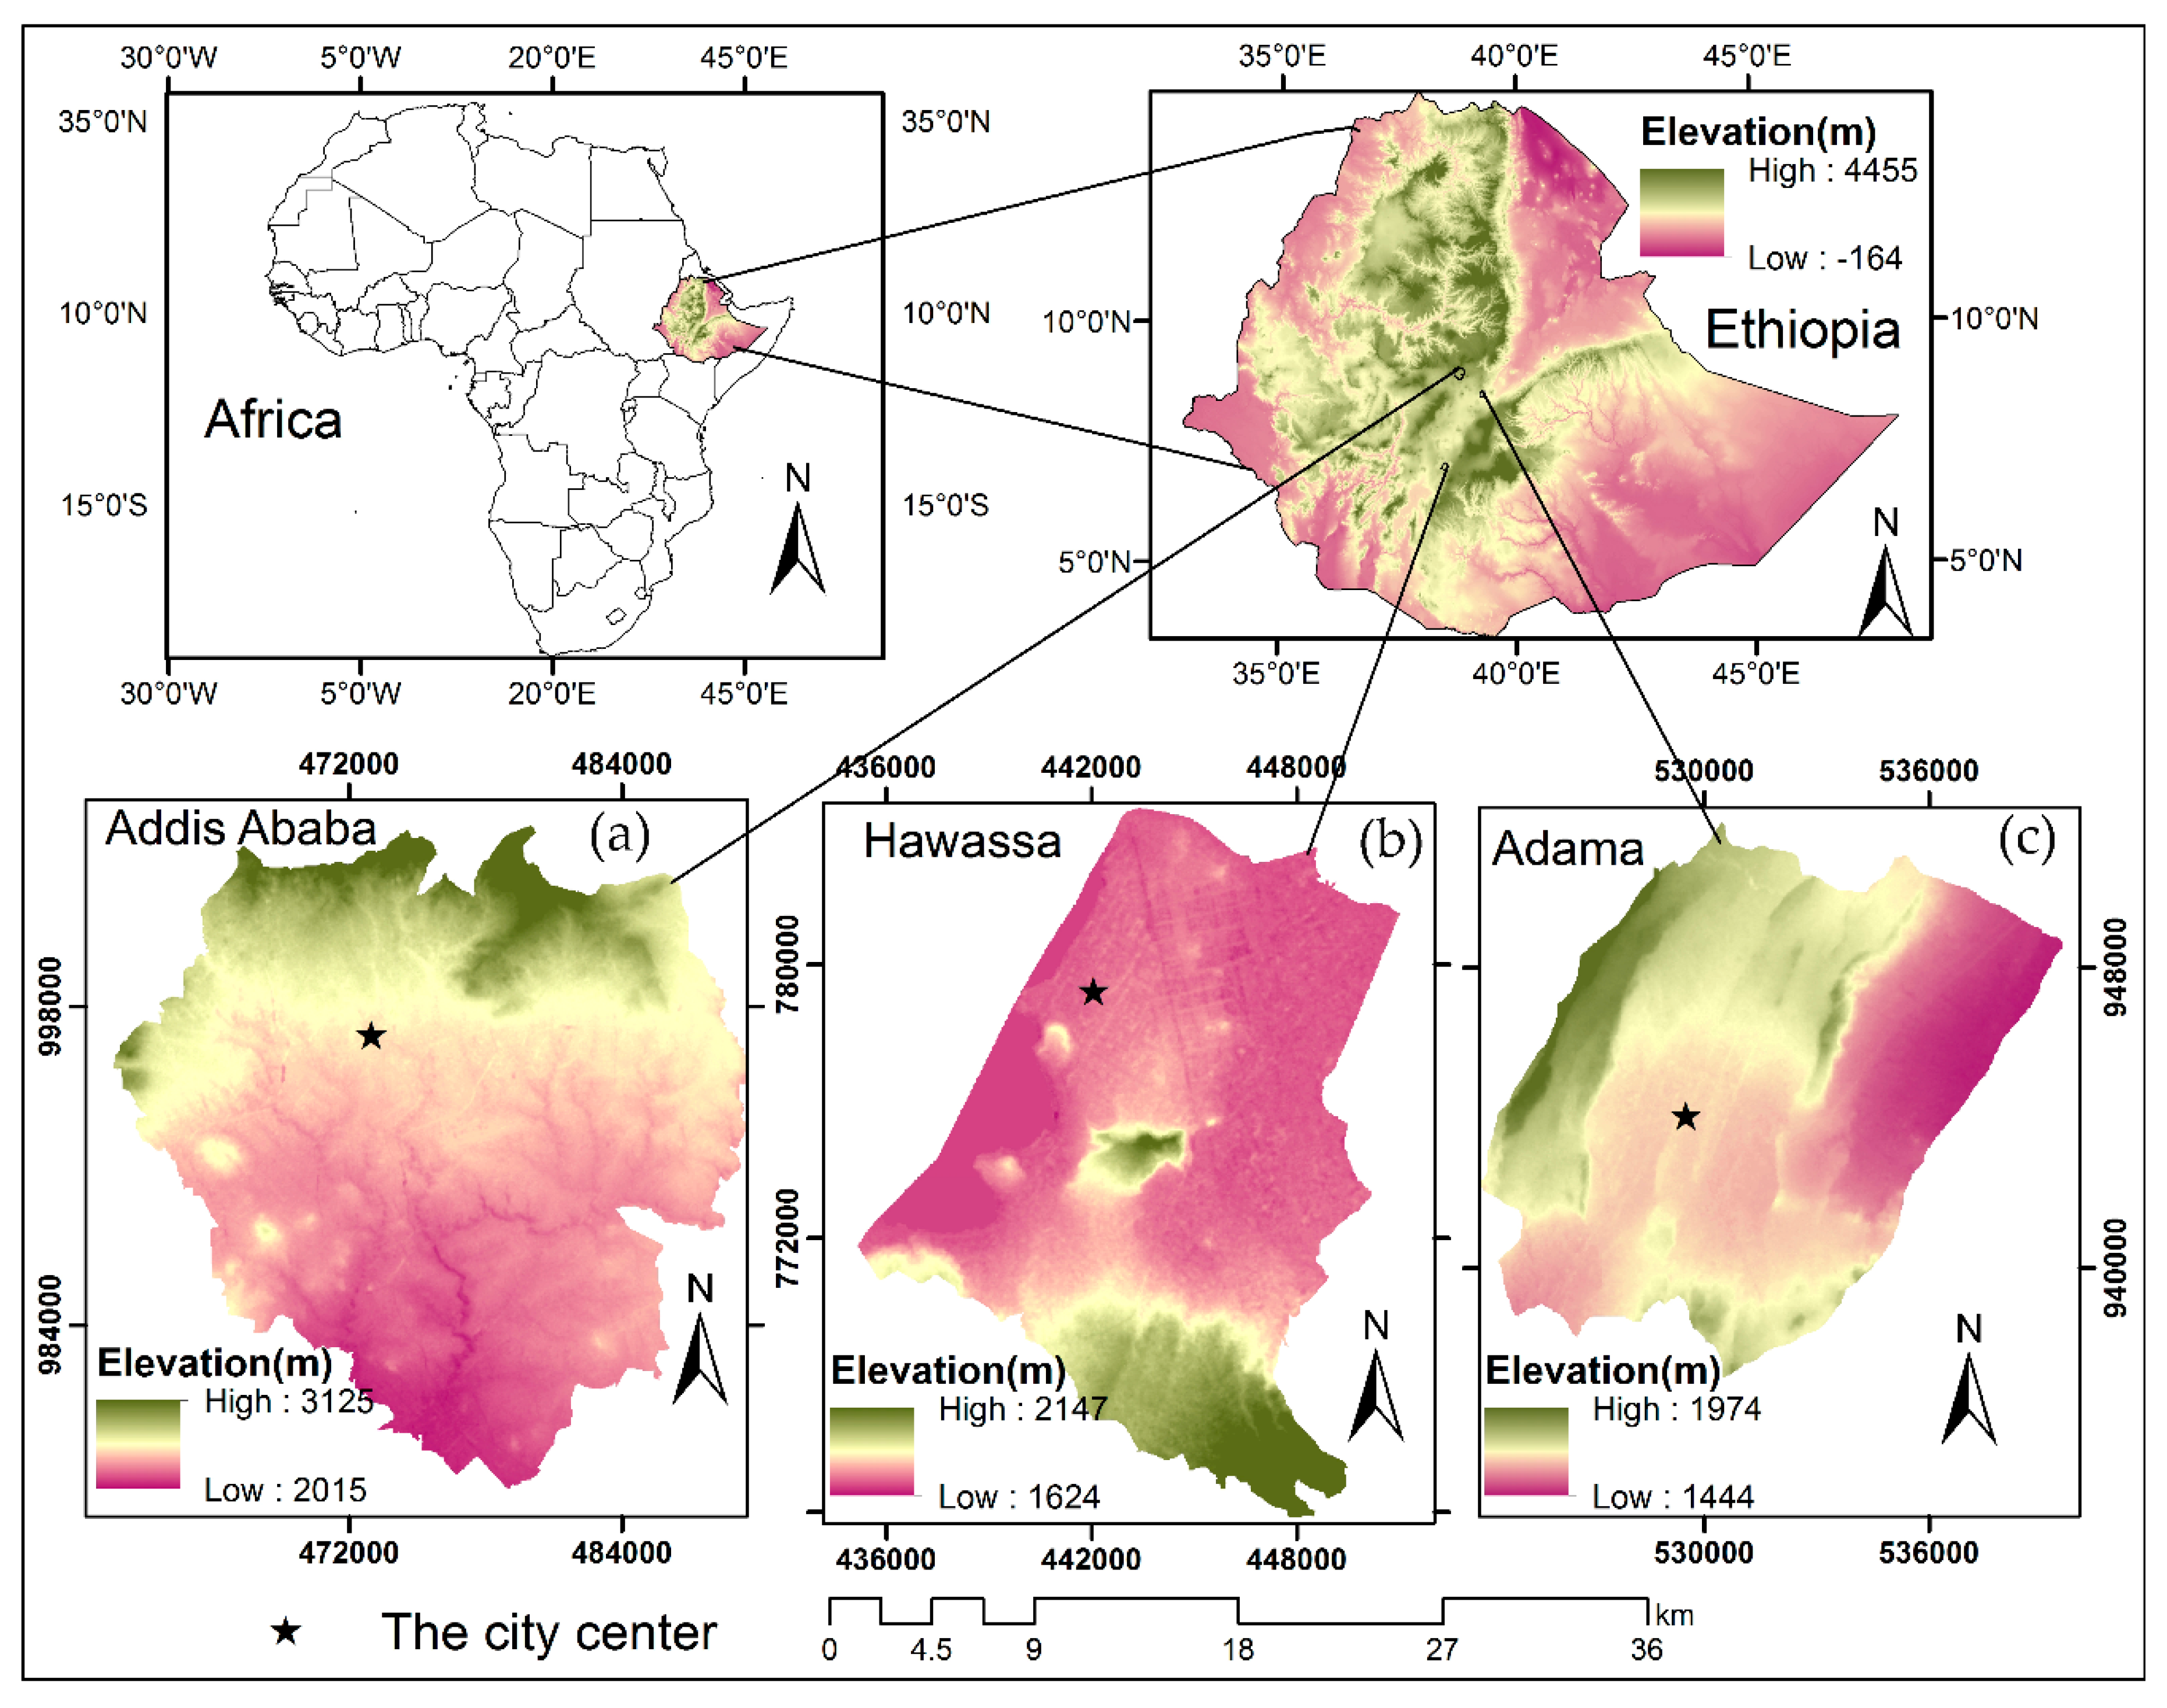
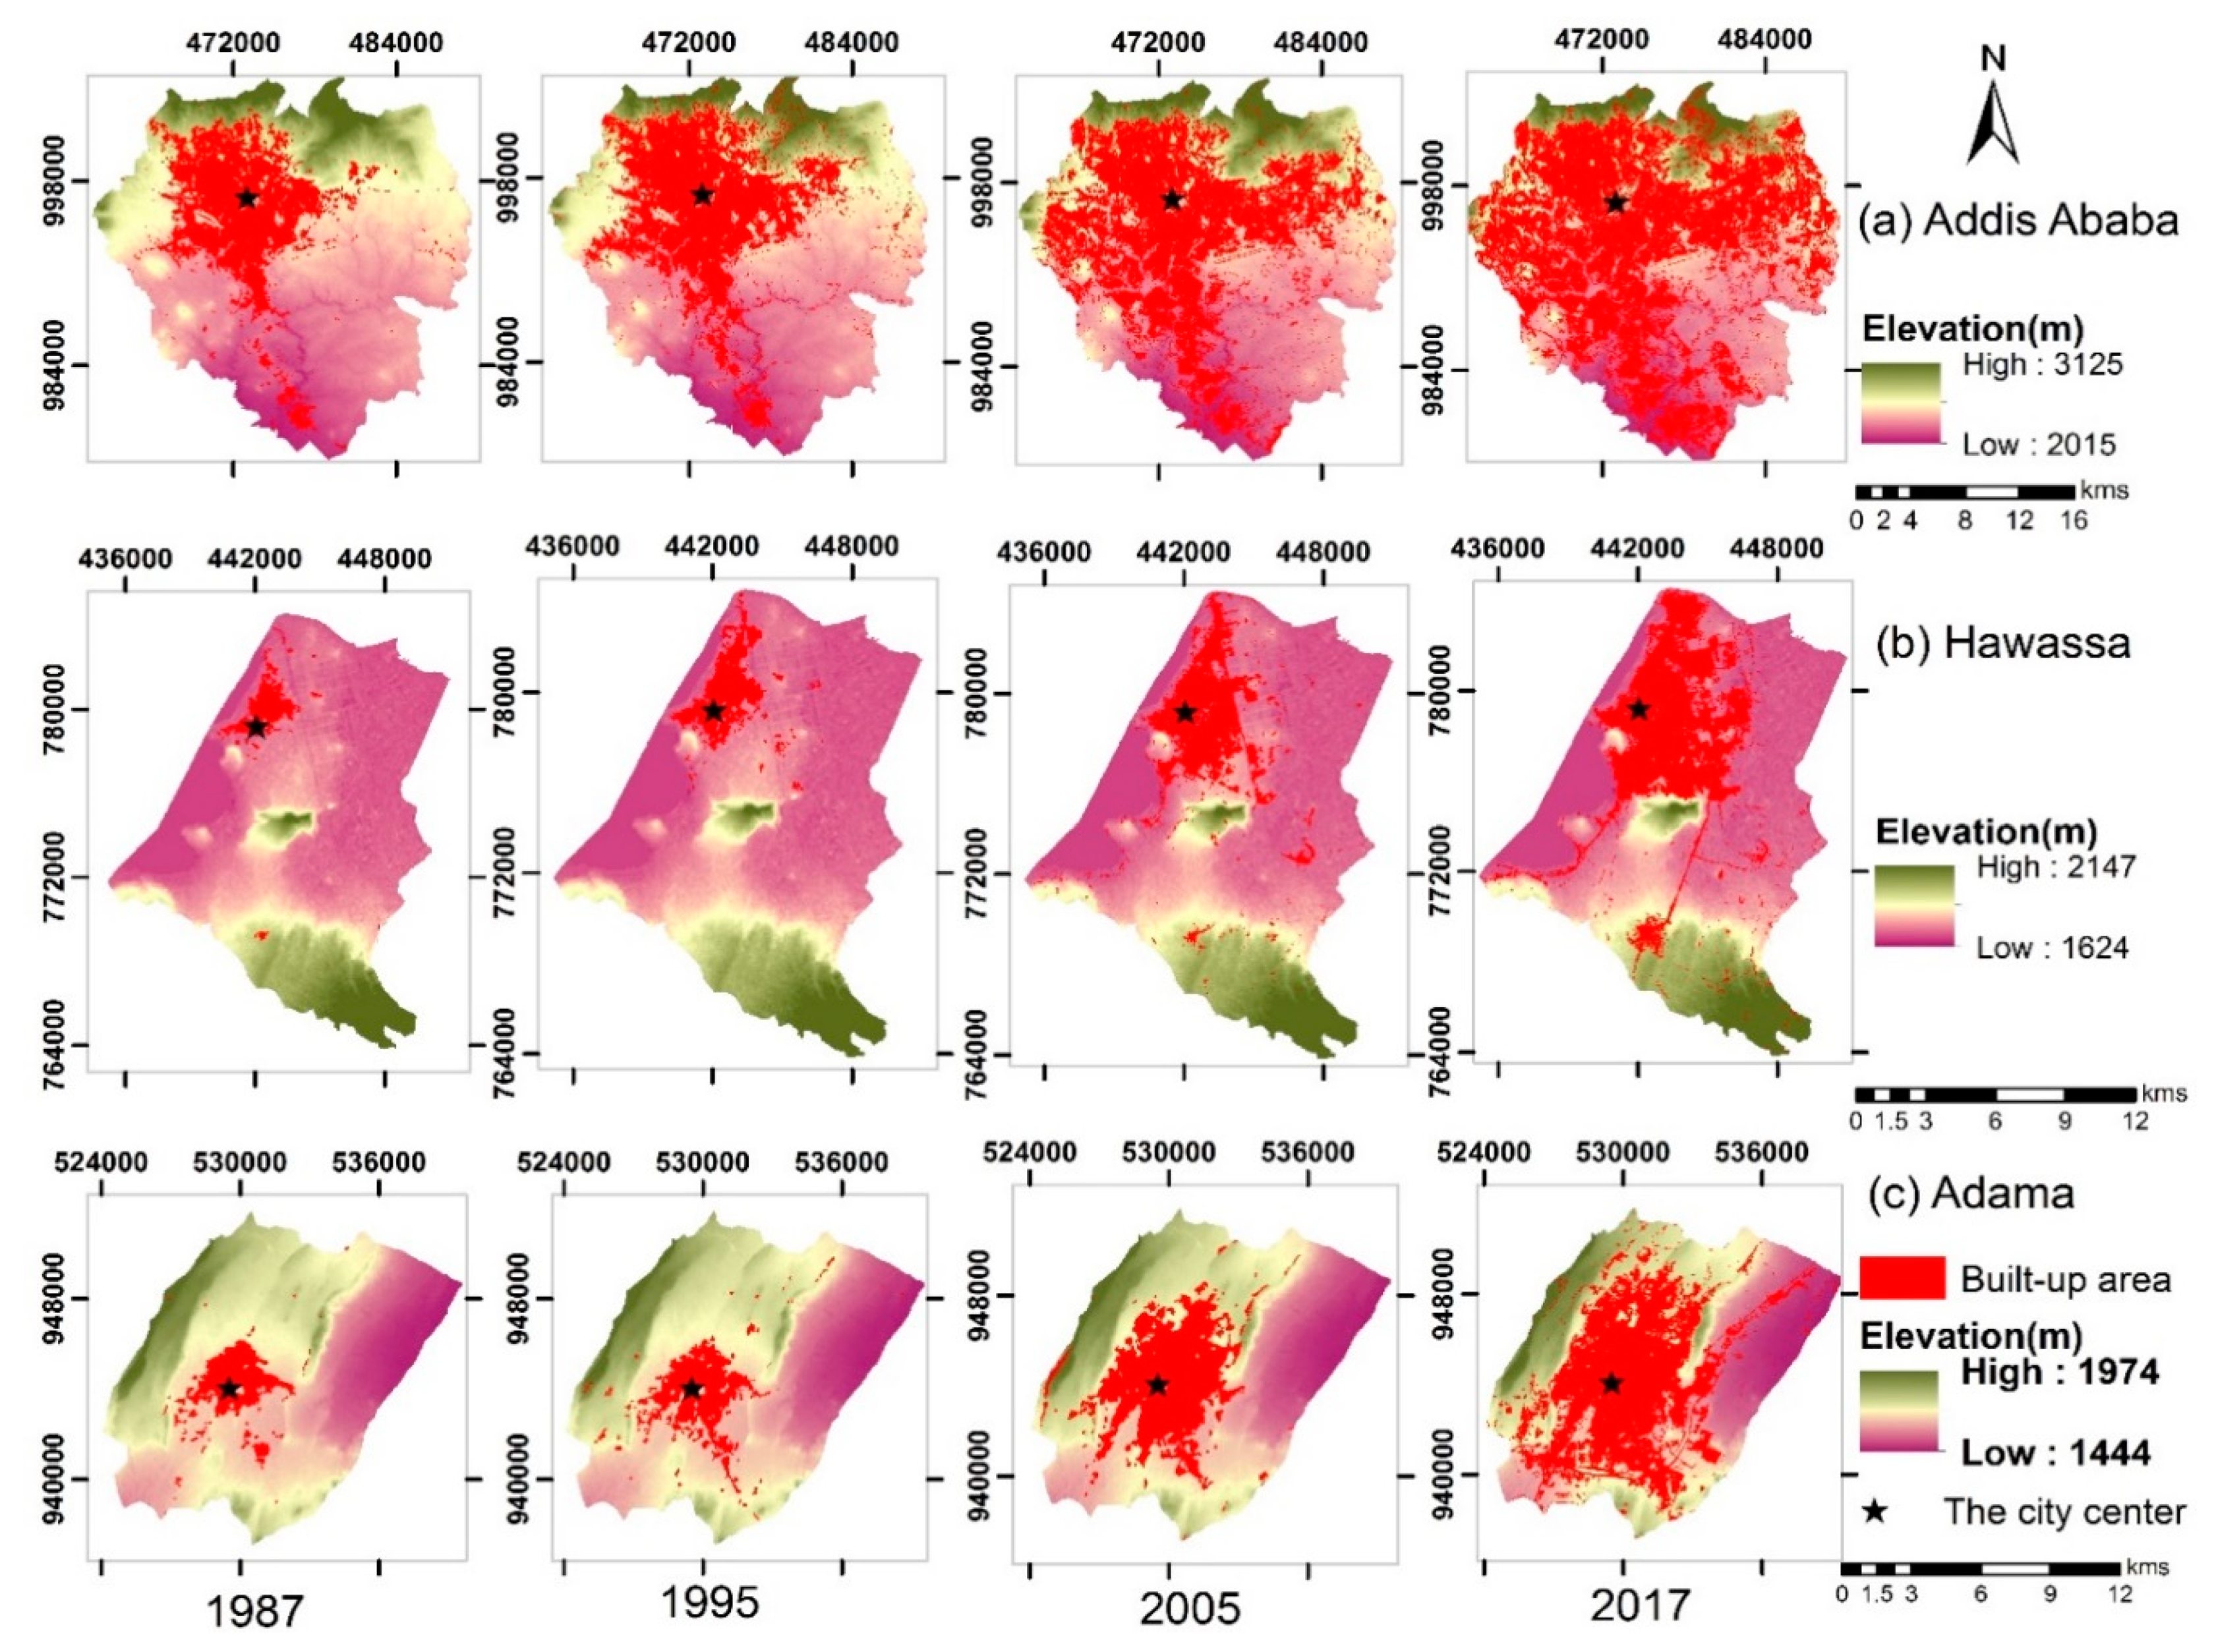
3.1. Urban Expansion for Four Consecutive Periods

The study identified that Addis Ababa, Adama, and Hawassa have been experiencing rapid urbanization over the past three decades (Figure 2). During 1987 to 1995 and 1995 to 2005, urban development in Addis Ababa was largely towards the western, eastern, and southern directions following road networks (Figure 2a,b). This has further prompted fast and sporadic patches of urban land expansion in all directions, but more intensified in eastern and southern directions between 2005 and 2017. Conversely, urban expansion in Adama has seen almost in every direction from the initial urban center (Figure 2b). Between 2005 and 2017, rapid and scattered patches of urban land expansion were observed towards the east, northeast, and southeast of the city. However, the urban land of Hawassa intensified in the south and northeast of the city from the initial urban core (Figure 2c).
Table 4 shows the proportion of urban land area expressed by km2 and percentage in the three selected cities over the past three decades. Accordingly, the urban lands of the target cities have been experiencing significant urban changes during the last 30 years. Addis Ababa experienced a 3-fold increment in urban land in the periods under the study, which covered an area of 208.5 km2 which is about 53.9% of the total area. The increment was 6-fold (from 8.8 to 50.6 km2) and 6-fold (6.1 to 39.1 km2) for Adama and Hawassa, respectively.
Table 5 displayed the extent of urban annual average expansion (AE) and average annual urban expansion rate (AER) in the three cities over the past three decades. The highest AE occurred from the year 2005 to 2017, and the lowest AE occurred between 1987 and 1995 for all cities. Addis Ababa, Adama, and Hawassa had an average AER of 4.5%, 8.3%, and 8.9%, respectively, ranging from 3.1% to 6.4%, 4.7% to 13.9%, and 7.7% to 10.8%, respectively, between 1987 and 2017. The Addis Ababa urban area had the most rapid urban expansion in terms of size, while Adama with the least initial urbanized land, had the highest records in terms of the expansion rate. This suggested that the cities with the larger initial urbanized size were associated with the smaller expansion rates.

3.2. Change of Urban Landscape Patterns

Table 6 shows the trends in the annual change of landscape metrics calculated for cities under the study over the past three decades. The fragmentation and complexity of the urban land patches indicated by the NP, MPS, ED, and AWMPFD varied among the cities. The NP metrics results of Addis Ababa and Adama revealed a positive value during the periods of 1987 to 1995 and 2005 to 2017. On the other hand, both cities had a more physically scattered expansion of urban land during the same study periods. In contrast, the aggregated urban growth was observed in the year between 1995 and 2005, evidenced by a negative value in both cities (Table 6). Even though the NP results of Hawassa revealed positive values across the entire study period, but the most scattered urban growth (NP = 43.3%) was observed during the second study period (Table 5). The MPS values decreased during the entire study periods for all cities, except in the second study period for Addis Ababa and Adama. This value was inversely related to the NP results (Table 5). Ed and AWMPFD were used in this investigation to characterize the irregularity and shape complexity of the urban patches. Based on these metrics, urban patches in Addis Ababa and Adama had more complex shapes and irregular patterns during the initial and third study periods (Table 6). In the case of Hawassa, the highest value was observed during the years of 1995 to 2005. In general, Addis Ababa had the most shape complex and irregularity while Hawassa had relatively regular patterns over the past 30 years.
Figure 3 and Figure 4 demonstrated the comprehensive spatial patterns of the landscape within-city. The landscape metrics were plotted in many directions (Figure 3) and at different distances from the city centers of each city (Figure 3). According to the metrics results, between 1987 and 1995, the highest proportion and fragmentation of the urban landscape was recorded in the E sector within 6–10 km for Addis Ababa, the SE sector within 1–2 km for Adama, and the E and SE sectors within 1–4 km for Hawassa (Figure 3 and Figure 4a,b). However, between 1995 and 2005 the dynamism was shifted to S direction within 10 to 21 km buffer distance for Addis Ababa and in the S direction within 2–4 km buffer distance for Adama. Between 2005 and 2017, the urban dynamics became massive in all directions for Adama, but it spread out more towards to the S and SW direction. Dynamism was shifted from S to E direction for Addis Ababa during this period. Furthermore, the constant increase with the highest proportion of the urban landscape from the city center to the S direction was observed for Hawassa during the study phases.
Moreover, the NP steadily declined within a 1 to 9 km distance for Addis Ababa, 1–2 km for Adama, and 1–4 km for Hawassa (Figure 4a,b). On the other hand, the outwards movement of the highest NP from 9 km to 21 km for Addis Ababa, 2 km to 11 km for Adama, and 4 km to 17 km for Hawassa indicated that the land is fragmented and under the influence of sprawl at the fringes, which can be primarily attributed to leapfrog development, while the core regions are experiencing concentrated urban growth, partially attributed to infill and extension urban growth over the past 30 years.

3.3. Identification and Comparison of Urban Growth Type

Figure 5 presents the spatial distribution and percentages of the three types of urban growth for the three periods. The fast urbanization of the three major cities in Ethiopia resulted from the integration of three urban development types (infilling, extension, and leapfrogging) (Figure 5).
Figure 6 demonstrated the spatial distribution in the area and percentages of the three types of urban growth for the past 30 years. For all cities, the overall results revealed that extension was the predominant type of urban growth, which accounted for more than half of the newly developed area, whereas the contribution of infilling was the least (Figure 6). In Addis Ababa, of the total newly developed urban land that occurred between 1987 and 1995, 32.2% constituted leapfrogging (16.3 km2). It was dispersedly distributed away from the center (Figure 6a), especially on the east and south of the city. Extension growth was primarily following the existing urban land during this period, mainly in the east and south directions along with the road networks. The extension and infilling growth in Addis Ababa played a significant role in connecting the initial urban core and Akaki outskirt area, which is found along the southern direction of the city, particularly between 1995 and 2005. Between 2005 and 2017, 73% of the newly developed urban area (29 km2) was an extension form; while the leapfrog and infill developments contributed less than 20%. However, the leapfrogging type contribution increased between 2005 and 2017 (Figure 6a,b).
With regard Adama, during 1987 and 1995, 0.8 km2 of the nonurban areas were changed into urban lands by leapfrogging mainly at the fringes of the south and southeast of the city, which accounted for ~25% (Figure 6a). While the extension type contributed to the highest proportion of the total extent of the newly developed area of urban lands, accounting for 67.5%. However, the proportion of leapfrogging increased more than 2-fold in the periods of 1995 to 2005 to 2005 to 2017. With respect to Hawassa, new urban growth of 5.2 km2 was observed during 1987 to 1995. From the total newly developed area, 74% was in extension, 15% in leapfrog and the remaining was in filling type. The leapfrog was mostly developed in the south and southwestern part of the city (Figure 5a,b). However, from 1995 afterward, extension growth was mainly spread around the urban core with a trend moving southward. This extension type of urban growth further increased to 84% of the total new development during the 2005–2017 periods. However, the leapfrog and infill developments accounted only for 8% and 7.8%, respectively.
Thus, it is observed that after 2005, the spatial expansion patterns of Addis Ababa and Adama were significantly different from Hawassa city, both of which were composed of a relatively higher proportion of leapfrogging (Figure 5 and Figure 6a,b). In general, the findings showed that expansion in all three cities mainly occurred through extension and leapfrogging forms; these types of development are related to urban sprawl while infilling is mostly regarded as compact growth.

3.4. Trends of Urban Land Expansion Versus Urban Population Growth

According to the evolution of the population and urban growth imbalance index (PUGI), the result indicated positive values for entire study period for Addis Ababa, as well as the second and third periods for Adama (Figure 7). This shows the rapid increase of built-up areas concerning to the inhabitants’ growth, which is associated with the dispersion growth. The highest positive value (PUGI = 8.6) was recorded in Adama during 1995 to 2005. On the contrary, from 1995 afterward, Hawassa displayed a more balanced expansion with negative PUGI values, which indicates compacted growth.

4. Discussion

4.1. Spatial Comparisons for Urban Expansion among Three Cities and Possible Drivers

Despite the rapid urban expansion over the past three decades, the spatiotemporal patterns of urban expansion varied among the cities of Addis Ababa, Adama, and Hawassa. From 1987 to 2017, the urban land of Addis Ababa increased 2.9 times, while that of Adama and Hawassa increased by 5.8 and 6.4 times, respectively. The extent, direction, and location of urban expansion in each city have mainly been associated with variances in their physical setting, administrative conditions, demography, policies, and urban master plans.
The physical growth of all the three cities showed clear footprints of topographic and physical limitations in the directions and shaping the growth of the cities (Figure 8). For instance, the physical condition of the area, the Entoto Mountain, the mountain that is located on the northern outskirt of Addis Ababa, significantly restricted the city’s urban expansion on the northern sides. The city expanded mostly to the eastern, southern, and southwest directions (Figure 8a). On the other hand, because of the existence of Lake Hawassa on the western, and hill on the south direction, the expansion of Hawassa city concentrated on the other sides of the northeast, east, and southeast parts (Figure 8b). In the case of Adama, due to the presence of the mountain along the east direction, the city expands towards north, northeast, and southwest directions (Figure 8c).
Furthermore, of the three target cities of this study, Addis Ababa experienced the largest expansion in terms of urban land extents. The result is in harmony with the recent study in Chinese cities by Zhao, et al. [18], who reported that a city with higher administrative status is more likely to obtain a large area of land for development and subsequently acquire the high potential for urban expansion as well as economic growth. Nevertheless, such intensive urban expansion to suburban areas poses serious threats to the regular environment and nearby rural communities because of its strong connection with the loss of agricultural lands and vegetation [15,21]. In fact, the relative expansion rate of Addis Ababa was lower than in the other two cities. For example, the urban area of Addis Ababa was 16.2 times larger than that of Hawassa and 11.3 times larger than Adama in the year 1987. However, in 2017, the proportion decreased to 7.5 and 5.6 times, respectively. On the other hand, Hawassa had small size during the initial study period (1987–1995) but experienced more rapid urbanization than Addis Ababa.
The result shows an inverse relationship between urban growth pace and city size, and it is in agreement with a comparative study of 32 major cities in China [18]. The same trend also witnessed in the three USA megacities [16]. The decentralization policy in Ethiopia was adopted in 1991, which increased the administrative role of the regional states significantly and improved the economy of the cities as economic activity was previously concentrated in the capital city, Addis Ababa. This move paves the way for the economic growth of regional cities such as Adama and Hawassa which might be attributed to rapid expansion. The growth of regional cities might restrict the rapid expansion of Addis Ababa, the capital city [44].
Moreover, this trajectory of constant urban growth was a result of demographic pressure. However, the urban expansion rates of Addis Ababa and Adama were greater than population growth rates, which suggested sprawl or low land use efficiency. The built-up area of Hawassa city increased at a lower rate than the growth in population. This implies an increase in population density or compact growth during city expansion. Some earlier researchers reported on this decreasing trend of population density in Ethiopia cities. For example, Fenta et al. [21] reported that the urbanized area of the Mekelle city (Ethiopia) is rising at a higher rate, 6.3% year−1 than the inhabitants with an average growth rate of 4.6% year−1, resulting low-density growth. Haregwein, et al. [21] witnessed that the growth pace of urban area remains higher than the growth pace of population in Bahir Dar city of Ethiopia, signifying a decline in population density. The tendency of decreasing population densities crosswise several cities is not limited to Ethiopian cities alone; however, it has also been witnessed in other parts of the world. For instance, Arua, Uganda [25] and Fez, Morocco [24] from other African cities, reported low-land use efficiency. Jain and Sharma [59] described, Indian cities have low-density urban development trends. Oueslati et al. [31] observed an increased urban growth of 18.4%, whereas a decline of 9.43% in population density in a study of 282 European cities. The trend is also similar to the USA and Chinese cities [14]. However, the rate of decline in urban population density of the USA (0.84%) was lower than Chines cities (2.73%), during the same study period of 2000 to 2014 [14]. Therefore, as the world population continues to grow, reducing the rate of physical urban expansion is essential for the protection of ecosystem services that are critical for sustaining human life [9].

4.2. Urban Landscape Change Patterns and Associated Drivers

The urban landscape patterns measured by the annual landscape metrics rate showed that all cities under the study were in a fragmented and complex shape of landscape patterns, but the values were lower in Hawassa than the other two cities. The result also exhibited a relative reduction in the year between 1995 and 2005 in Addis Ababa and Adama; nevertheless, it increased again in the year 2005 to 2017. The decreasing trend of landscape fragmentation and shape complexity was observed during the second study period indicated that the urban development mostly took place in the vacant spaces of the city center or next to existing urban land rather than as disconnected and unstructured growth in both cities.
In the case of Addis Ababa, it might be attributed to the adopted master plan of 1994. This master plan was prepared in 1986, and approved late in 1994 [15], which led to informal settlements in Addis Ababa, as evidenced by the drastic increase in urban land fragmentation, irregularity pattern, and leapfrogging growth type during the initial study period (1987–1995) (Figure 6). However, after the approval of this master plan, the infilling growth fused the existing urban patches and slowed down fragmentation of the urban landscape and shape complexity. This suggested that relatively aggregated and regular growth patterns were observed in the year 1995 to 2005. Also, during the same period, a decreasing trend of the annual expansion rate was observed in Addis Ababa, while the peak expansion rate was recorded in Adama and Hawassa. This is mainly associated with the rural development policy (Land Reform Programme), which was announced in 1994. The policy decentralizes the responsibility of urban planning and motivates secondary cities such as Adama and Hawassa to attract rural migrants [44]. This might have contributed to the reduction trends of landscape fragmentation and irregularity observed in Adama in the year between 1995 and 2005. At the same time, extension growth of all the three cities increased further prominently while the leapfrogging portion has significantly declined especially in Addis Ababa and Adama.
Additionally, a significant increase in urban land, drastic fragmentation, and the highest irregularity patterns were recorded from 2005 to 2017 in all the cities under study. This is attributed to the adoption of the Integrated Housing Development Programme (IHDP) through national urban development policy of 2005 which encourages the development of condominium housing projects in Addis Ababa and regional cities [43,45]. This resulted in a highly fragmented landscape and complex shape patterns as well as stimulating urban growth characterized by a high rate of leapfrogging, which suggests a strong linkage between human intervention and the natural landscape fragmentation. The extension growth in the third stage is declining in Addis Ababa and Adama, but still dominant growth type. Moreover, the proportion of infilling and leapfrogging development in Hawassa city was small over space and times. This might be due to the reason that Hawassa was established as a planned city in the early 1950s [50].
Generally, the patterns identified in this study indicated that the intensity of human activity to be predominantly responsible for landscape changes. In the context of this study, the general magnitude and direction of urban expansion were limited by the topography situation while the local patterns and dynamics of urban expansion were driven by urban planning, population, and policy. Infilling urban development type is commonly associated with a compact urban form while leapfrogging connected with the isolated one. The results of this study, however, revealed that all three cities under the study were mostly dominated by the growth of extension and leapfrogging form, which may be associated with urban sprawl or low land efficiency [21,29,60]. The leapfrogging growth type inclined since 2005 in Adama and Addis Ababa. This suggested that the implemented IDHI in 2005 by the Ministry of Urban Development, Housing, and Construction has not brought compacted urban growth in the large cities of a country, which caused the scattered urban growth at the expense of Agricultural land and green areas [5,21].

4.3. Testing the Phases of Diffusion and Coalescence in Urban Expansion

The research results can also be used to validate the diffusion–coalescence theory suggested by Dietzal et al. [37,38]. According to Dietzel et al. [37,38], the urban development process could be defined as the process of cyclic and oscillates between states of diffusion and coalescences. The rise of NP, ED, and AWMPFD and the reduction of MPS mostly indicate the diffusion phase, while the reverse trends of the metrics suggest the coalescence phase. Correspondingly, leapfrogging growth generally characterizes the diffusion stage, while infilling and extension are documented more in the coalescence stage [39]. This theory has been preliminarily tested by different scholars. For example, Tian et al. [40] investigated urbanization in five Chinese cities using landscape metrics and found that urbanization in the area confirms the existence of the diffusion and coalescence sequence. The hypothesis was also tested by Liu et al. [60] by comparing 16 global cities using both landscape metrics and urban growth forms, of which four are supported; while the rest did not adequately support the theory. However, using the annual landscape metrics rate integrated with urban typologies had not been tested. Therefore, this study attempted to test the diffusion and coalescence theory using annual landscape metrics rate and urban typologies. The sign of the landscape metrics represents whether the city is located above or below the line. Thus, for NP, ED, and AWMPFD landscape metrics positive values show that the built-up area grows in the diffusion process and a negative value indicates coalescence while the reverse is true for MPS (Figure 1).
Accordingly, the urban expansion processes in investigated cities of Ethiopia generally supported the historical oscillation between the stages of diffusion and coalescence in the urbanization process. In the first study period (1987–1995), the hot zone of urban development, mostly in the form of leapfrogging and extension, was largely found around the city cores. During this period, many new patches, fashioned by leapfrogging urban expansion, were distributed all through the three cities. Moreover, the landscape metrics rate displays positive values for NP, ED, and AWMPFD and negative values for MPS (Figure 9a–c) in all cities, evidencing the fragmented and complex shape pattern of urban growth, which can be identified as the diffusion stage.
The year 1995 could be observed as the converting point from diffusion to the coalescence stage for Addis Ababa and Adama. In the coalescence phase, linking between the neighborhood of urban patches was boosted [39], which is verified by the drastic slowdown of leapfrogging and increase of infilling and extension in 1995 to 2005. The evidence also indicated the reduction of fragmentation and irregularity of shape patterns. Even though the value of AWMPFD was slowly increasing which indicates the trends of shape complexity in Addis Ababa, the other values revealed the reduction of fragmentation, which indicates the coalescence process (Figure 9a,b). In fact, during this period the proportion of infilling and extension growth type was the peak, which suggested the coalescence urbanization process. Therefore, integrating landscape metrics with urban growth types is essential to clearly define the urbanization process as a diffuse-coalescence phase. From 2005 to 2017, the urban growth of all three cities was rapid. Several urban patches invaded on the other land at the fringe of the urban cores, and extension and leapfrogging were the primary growth, which indicated the diffusion process (Figure 9a,b). However, the expansion of Hawassa city indicated the diffusion process in all the study periods (Figure 9c).
Based on this evidence, throughout the 30 years, the pattern of urban growth in Addis Ababa and Adama can be described as a “diffusion–coalescence–diffusion” process, whereas Hawassa is characterized as ‘’ diffusion’’ phase. The high degree of similarity between Addis Ababa and Adama may be attributed to the form of population growth and the phases of urban growth. However, both cities have different city size, but they have relatively similar expansion patterns. Conversely, the city size at Adama and Hawassa are comparable, but the level and period of the urban landscape fragmentation and shape patterns are different. This incidence might suggest that cities with the same size might have different points in the diffusion and coalescence phases. The following reasons can describe these exceptions. First, Adama and Addis Ababa cities had varied topography which could constrain extension urban development, the typical expansion type in the plain region. Hawassa is located relatively in a flat area, which creates favorable condition for the extension of urban development where the city grew in a compacted way. Secondly, the population density was continuously decreased in Adama and Addis Ababa while increased in Hawassa during the second and third study periods (Figure 7), which suggested that fragmentation levels are higher at cities with smaller population density.
Thirdly, the findings from the different studies [10,15,47,50] suggested that rapid urban expansion and weaknesses in planning, monitoring, and managing urban growth are significant causes for loss of natural resources [7], and promote the dispersed urban growth types. In this study lacks proper implementation of the land use plan and monitoring in Addis Ababa and Adama cities, especially during the first and the third study periods. This was indicated by the spatially dispersed urban growth. The recent studies also confirmed improper utilization of master plan in both cities. For example, the late approval of the master plan in 1994 led to the informal settlements in Addis Ababa [15]. Due to the lack of implementation and monitoring, the prepared land use plan in 2004 did not play its role in guiding and monitoring the spatial growth of the Adama city [47]. In contrast, Hawassa underwent extensive city planning in the 1950s, which played a role in guiding and controlling the spatial expansion of the city [50], mostly by extension growth types. Therefore, the city with a comparatively the same size, but different in the stage of diffusion–coalescence urbanization process can be affected by the physical features, demography, and planning.

5. Conclusions

In many African countries, there is a lack of detailed comparative exploration of urban development among different cities over a relatively long period, which is a big stumbling block for sustainable urban development. As a result, this study provides a much-needed first comparative analysis of the trends of urban expansion and urban spatial patterns in three major cities of Ethiopia for three consecutive study epochs (1987–1995, 1995–2005, and 2005–2017).
Accordingly, the result showed that all cities under the study experienced extensive physical expansion over the past 30 years. The magnitude of urban expansion is ranked in the order of Addis Ababa, Adama, and Hawassa with annual growth rates of 4.5%, 8.3%, and 8.9%, respectively. Cities with larger initial urbanized size were associated with smaller expansion rates. The integrated landscape metrics and urban typologies showed an increase in the irregularity and ongoing dispersion of urban growth mostly by extension and leapfrogging growth indicating the prevalence of urban sprawl. The inclination of the leapfrogging growth type since 2005 in Adama and Addis Ababa suggests that the implemented IHDP since 2005 has not brought compact urban growth, but rather has resulted in scattered growth in the natural landscape on the urban fringe.
Addis Ababa is the largest city in Ethiopia followed by Adama. However, urban land expansion in both cities was greater than the urban population growth rate, signifying decreasing density which resulted in land use inefficiency. Conversely, Hawassa had a compact growth form. These indicated that cities with a large in physical and population size in Ethiopia are tending towards more dispersed urban growth rather than compact development. On the other hand, large cities with strong economic growth in Ethiopia had less success controlling scattered urban growth. In this context, it can be concluded that cities with a large in physical and population size and high economic development in developing countries may not always have a compact urban growth type. With the existing spatial and temporal patterns, it is expected that dispersed urban development will further strain Ethiopia’s natural resources. The study suggests policy interventions that control dispersed urban growth could reverse the trend of inefficient land use are needed.
The urbanization processes of Addis Ababa and Adama, characterized by two possible phases (diffusion and coalescence), mostly matched expectations derived from urban growth theory. However, the urbanization processes of Hawassa did not satisfactorily support the theory. This suggests that the “diffusion and coalescence” theory might be influenced by physical features, population dynamics, and urban planning.
The comparative investigation of rates, patterns, forms, and driving forces of urban development of Ethiopia’s major cities under the study contribute valuable experiences and evidence for urban planning and management at different growth periods. The evidence might help in guiding hereafter planning and policy development for urban conditions. Furthermore, the proposed methods in this research assist deeper exploration of urban development patterns to identify and prioritize areas for effective urban planning and management.

Author Contributions

B.K.T. and N.C.; Methodology, B.K.T.; Software, B.K.T.; Validation, B.K.T., and N.C.; Formal Analysis, B.K.T.; Investigation, B.K.T.; Resources, N.C.; Data Curation, B.K.T.; Writing—Original Draft Preparation, B.K.T.; Writing—Review and Editing, B.K.T., N.C., X.Z., D.L., and D.N.; Visualization, B.K.T., N.C., and X.Z.; Supervision, N.C.; Project Administration, N.C.; Funding Acquisition, N.C. and X.Z.

Funding

This study was funded by the National Natural Science Foundation of China program (41801339), the Union Foundation of Ministry of Education of the People’s Republic of China (6141A02022318), Creative Research Groups of Natural Science Foundation of Hubei Province of China (2016CFA003), and the China Postdoctoral Science Foundation (No. 2017M620338, 2018T110804).

Acknowledgments

We would like to express our respects and appreciation to the reviewers and editors for their professional comments and suggestions.

Conflicts of Interest

The authors declare no conflicts of interest.

References

  1. Zhang, Z.; Li, N.; Wang, X.; Liu, F.; Yang, L. A comparative study of urban expansion in Beijing, Tianjin and Tangshan from the 1970s to 2013. Remote Sens. 2016, 8, 496. [Google Scholar] [CrossRef]
  2. United Nations Department of Economic and Social Affairs Population Division. The World’s Cities in 2018—Data Booklet (ST/ESA/ SER.A/417). 2018. Available online: https://www.un.org/en/development/desa/population/publications/pdf/urbanization/the_worlds_cities_in_2018_data_booklet.pdf (accessed on 13 January 2019).
  3. Artmann, M.; Kohler, M.; Meinel, G.; Gan, J.; Ioja, I. How smart growth and green infrastructure can mutually support each other—A conceptual framework for compact and green cities. Ecol. Indic. 2019, 96, 10–22. [Google Scholar] [CrossRef]
  4. Magidi, J.; Ahmed, F. The egyptian journal of remote sensing and space sciences assessing urban sprawl using remote sensing and landscape metrics: A case study of city of Tshwane, South Africa (1984–2015). Egypt. J. Remote Sens. Space Sci. 2018. [Google Scholar] [CrossRef]
  5. Arsiso, B.K.; Tsiduc, G.M.; Stoffber, G.H.; Tadesse, T. Influence of urbanization-driven land use/cover change on climate: The case of addis ababa, ethiopia. Phys. Chem. Earth 2018, 105, 212–223. [Google Scholar] [CrossRef]
  6. Sahana, M.; Hong, H.; Sajjad, H. Science of the total environment analyzing urban spatial patterns and trend of urban growth using urban sprawl matrix: A study on Kolkata Urban Agglomeration, India. Sci. Total Environ. 2018, 628–629, 1557–1566. [Google Scholar] [CrossRef]
  7. Shen, X.; Wang, X.; Zhang, Z.; Lu, Z.; Lv, T. Land use policy evaluating the effectiveness of land use plans in containing urban expansion: An integrated view. Land Use Policy 2019, 80, 205–213. [Google Scholar] [CrossRef]
  8. Nor, A.N.M.; Corstanje, R.; Harris, J.A.; Brewer, T. Impact of rapid urban expansion on green space structure. Ecol. Indic. 2017, 81, 274–284. [Google Scholar] [CrossRef]
  9. Mörtberg, U.; Goldenberg, R.; Kalantari, Z.; Kordas, O.; Deal, B.; Balfors, B.; Cvetkovic, V. Integrating ecosystem services in the assessment of urban energy trajectories—A study of the stockholm region. Energy Policy 2017, 100, 338–349. [Google Scholar] [CrossRef]
  10. Henríquez-dole, L.; Usón, T.J.; Vicuña, S.; Henríquez, C.; Gironása, J.; Meza, F. Integrating strategic land use planning in the construction of future land use scenarios and its performance: The maipo river basin, chile. Land Use Policy 2018, 78, 353–366. [Google Scholar] [CrossRef]
  11. Kantakumar, L.N.; Kumar, S.; Schneider, K. Spatiotemporal urban expansion in Pune Metropolis, India using remote sensing. Habitat Int. 2016, 51, 11–22. [Google Scholar] [CrossRef]
  12. Viana, C.M.; Oliveira, S.; Oliveira, S.C.; Rocha, J. Land use/land cover change detection and urban sprawl analysis. Spat. Model. GIS R Earth Environ. Sci. 2019, 621–651. [Google Scholar] [CrossRef]
  13. Bhatta, B.; Saraswati, S.; Bandyopadhyay, D. Urban sprawl measurement from remote sensing data. Appl. Geogr. 2010, 30, 731–740. [Google Scholar] [CrossRef]
  14. Dong, T.; Jiao, L.; Xu, G.; Yang, L.; Liu, J. Science of the total environment towards sustainability? Analyzing changing urban form patterns in the United States, Europe, and China. Sci. Total Environ. 2019, 671, 632–643. [Google Scholar] [CrossRef] [PubMed]
  15. Zewdie, M.; Worku, H.; Bantider, A. Temporal dynamics of the driving factors of urban landscape change of addis ababa during the past three decades. Environ. Manag. 2018, 61, 132–146. [Google Scholar] [CrossRef]
  16. Kuang, W.; Chi, W.; Lu, D.; Dou, Y. A comparative analysis of megacity expansions in China and the U.S.: Patterns rates and driving forces. Landsc. Urban Plan. 2014, 132, 121–135. [Google Scholar] [CrossRef]
  17. Yu, W.; Zhou, W. The spatiotemporal pattern of urban expansion in China: A comparison study of three urban megaregions. Remote Sens. 2017, 9, 45. [Google Scholar] [CrossRef]
  18. Zhao, S.; Zhou, D.; Zhu, C.; Sun, Y.; Wu, W.; Liu, S. Spatial and temporal dimensions of urban expansion in China. Environ. Sci. Technol. 2015, 49, 9600–9609. [Google Scholar] [CrossRef]
  19. Fang, C.; Zhao, S. A comparative study of spatiotemporal patterns of urban expansion in six major cities of the Yangtze River Delta from 1980 to 2015. Ecosyst. Health Sustain. 2018, 4, 95–114. [Google Scholar] [CrossRef] [Green Version]
  20. Anees, M.M.; Shafa, S.; Joshi, P.K. Characterizing urban area dynamics in historic city of Kurukshetra, India, using remote sensing and spatial metric tools. Geocarto Int. 2018, 1–34. [Google Scholar] [CrossRef]
  21. Fenta, A.A.; Yasuda, H.; Haregeweyn, N.; Belay, A.S.; Hadush, Z.; Gebremedhin, M.A.; Mekonnen, G. The dynamics of urban expansion and land use/land cover changes using remote sensing and spatial metrics: The case of Mekelle City of Northern Ethiopia. Int. J. Remote Sens. 2017, 38, 4107–4129. [Google Scholar] [CrossRef]
  22. Felt, C.; Fragkias, M.; Larson, D.; Liao, H.; Lohse, K.A.; Lybecker, D. A comparative study of urban fragmentation patterns in small and mid-sized cities of Idaho. Urban Ecosyst. 2018, 21, 805–816. [Google Scholar] [CrossRef]
  23. Kukkonen, M.O.; Muhammad, M.J.; Käyhkö, N.; Luoto, M.; Town, S. Land use policy urban expansion in Zanzibar City, Tanzania: Analyzing quantity, spatial patterns and e ff ects of alternative planning approaches. Land Use Policy 2018, 71, 554–565. [Google Scholar] [CrossRef]
  24. El Garouani, A.; Mulla, D.J.; El, S.; Knight, J. Analysis of urban growth and sprawl from remote sensing data: Case of Fez, Morocco. Int. J. Sustain. Built Environ. 2017, 6, 160–169. [Google Scholar] [CrossRef]
  25. Abudu, D.; Azo, R.; Andogah, G. The egyptian journal of remote sensing and space sciences spatial assessment of urban sprawl in Arua Municipality, Uganda. Egypt. J. Remote Sens. Space Sci. 2018, 1–8. [Google Scholar] [CrossRef]
  26. Wu, J.; Jenerette, G.D.; Buyantuyev, A.; Redman, C.L. Quantifying spatiotemporal patterns of urbanization: The case of the two fastest growing metropolitan regions in the United States. Ecol. Complex. 2011, 8, 1–8. [Google Scholar] [CrossRef]
  27. Sajjad, H. Living standards and health problems of lesser fortunate slum dwellers: Evidence from an Indian City. Int. J. Environ. Prot. Policy 2014, 2, 54–63. [Google Scholar] [CrossRef]
  28. Ewing, R.; Hamidi, S. Compactness versus sprawl: A review of recent evidence from the United States. J. Plan. Lit. 2015, 30, 1–20. [Google Scholar] [CrossRef]
  29. Sapena, M.; Ruiz, L.Á. Analysis of land use/land cover spatio-temporal metrics and population dynamics for urban growth characterization. Comput. Environ. Urban Syst. 2019, 73, 27–39. [Google Scholar] [CrossRef]
  30. Liu, D.; Chen, N. Satellite monitoring of urban land change in the middle Yangtze River Basin urban agglomeration, China between 2000 and 2016. Remote Sens. 2017, 9, 1086. [Google Scholar] [CrossRef]
  31. Oueslati, W.; Garrod, G. Determinants of urban sprawl in European cities. Urban Stud. 2015, 52, 1594–1614. [Google Scholar] [CrossRef] [Green Version]
  32. Sun, Y.; Zhao, S. Spatiotemporal dynamics of urban expansion in 13 cities across the Jing-Jin-Ji urban agglomeration from 1978 to 2015. Ecol. Indic. 2018, 87, 302–313. [Google Scholar] [CrossRef]
  33. Cao, H.; Liu, J.; Fu, C.; Zhang, W.; Wang, G.; Yang, G.; Luo, L. Urban expansion and its impact on the land use pattern in xishuangbanna since the reform and opening up of China. Remote Sens. 2017, 9, 137. [Google Scholar] [CrossRef]
  34. Shukla, A.; Jain, K. Critical analysis of spatial-temporal morphological characteristic of urban landscape. Arab. J. Geosci. 2019, 12, 112. [Google Scholar] [CrossRef]
  35. Angel, S.; Parent, J.; Civco, D.L.; Angel, S.; Parent, J.; Civco, D.L. Environment and urbanization spatial structure of cities, 1990–2000. Environ. Urban. 2012, 24, 249–283. [Google Scholar] [CrossRef]
  36. Sharma, R.; Joshi, P.K. Monitoring urban landscape dynamics over Delhi (India) using remote sensing (1998–2011) inputs. J. Indian Soc. Remote Sens. 2012, 41, 641–650. [Google Scholar] [CrossRef]
  37. Dietzel, C.; Herold, M.; Hemphill, J.; Clarke, K.C. Spatio-temporal dynamics in California’s Central Valley: Empirical links to urban theory. Int. J. Geogr. Inf. Sci. 2005, 19, 175–195. [Google Scholar] [CrossRef]
  38. Dietzel, C.; Hemphill, J.J.; Clarke, K.C.; Gazulis, N. Diffusion and coalescence of the Houston Metropolitan Area: Evidence supporting a new urban theory. Environ. Plan. B Plan. Des. 2005, 32, 231–246. [Google Scholar] [CrossRef]
  39. Xu, C.; Liu, M.; Zhang, C.; An, S.; Yu, W.; Chen, J.M. The spatiotemporal dynamics of rapid urban growth in the Nanjing metropolitan region of China. Landsc. Ecol. 2007, 22, 925–937. [Google Scholar] [CrossRef]
  40. Tian, G.; Jiang, J.; Yang, Z.; Zhang, Y. The urban growth, size distribution and spatio-temporal dynamic pattern of the Yangtze River Delta megalopolitan region, China. Ecol. Model. 2011, 222, 865–878. [Google Scholar] [CrossRef]
  41. Shiferaw, A. Productive Capacity and Economic Growth in Ethiopia. 2017. Available online: https://www.un.org/development/desa/dpad/wpcontent/uploads/sites/45/publication/CDP-bp-2017-34.pdf (accessed on 17 February 2019).
  42. Kassahun, S.; Tiwari, A. Urban development in Ethiopia: Challenges and policy responses urban development in Ethiopia. IUP J. Gov. Public Policy 2014, 7, 59–75. Available online: http://www.academia.edu/22427119/Urban_Development_in_Ethiopia_Challenges_and_Policy_Responses (accessed on 11 March 2018).
  43. Ministry of Urban Development Housing and Construction (MUDHCo). National Report on Housing on Housing and Sustainable Urban Development. 2014. Available online: https://unhabitat.org/wp-content/uploads/2014/07/Ethiopia-National-Report.pdf (accessed on 13 January 2019).
  44. United Nations Human Settlements Programme (UN-Habitat). The State of Addis Ababa 2017: The Addis Ababa We Want; UN-Habitat: Nirobi, Kenya, 2017. Available online: https://unhabitat.org/books/the-state-of-addis-ababa-2017-the-addis-ababa-we-want (accessed on 16 January 2018).
  45. United Nations Human Settlements Programme (UN-Habitat). Condominium Housing in Ethiopia: The Integrated Housing Development Programme; UN-Habitat: Nairobi, Kenya, 2011. Available online: https://www.scribd.com/doc/153873988/Condominium-Housing-in-Ethiopia (accessed on 18 January 2019).
  46. Nigatu, W.; Dick, Ø.B.; Tveite, H. Landscape mapping to quantify degree-of-freedom, degree-of-sprawl, and degree-of-goodness of urban growth in Hawassa, Ethiopia. Environ. Nat. Resour. Res. 2014, 4, 223–237. [Google Scholar] [CrossRef]
  47. Bulti, T.D.; Sori, B.D. Evaluating land-use plan using conformance-based approach in Adama City, Ethiopia. Spat. Inf. Res. 2017, 25, 605–613. [Google Scholar] [CrossRef]
  48. Woldegerima, T.; Yeshitela, K.; Lindley, S. Characterizing the urban environment through Urban Morphology Types (UMTs) mapping and land surface cover analysis: The case of Addis Ababa, Ethiopia. Urban Ecosyst. 2017, 20, 245–263. [Google Scholar] [CrossRef]
  49. Sinha, P.; Verma, N.K.; Ayele, E. Urban built-up area extraction and change detection of Adama Municipal Area using time-series landsat images. Int. J. Adv. Remote Sens. GIS 2016, 5, 1886–1895. [Google Scholar] [CrossRef]
  50. Admasu, T.G. Land use policy urban land use dynamics, the nexus between land use pattern and its challenges: The case of Hawassa City, Southern Ethiopia. Land Use Policy 2015, 45, 159–175. [Google Scholar] [CrossRef]
  51. United Nations Department of Economic and Social Affairs Population Di-Vision. The World’s Cities in 2016—Data Booklet (ST/ESA/ SER.A/392). 2016. Available online: http://www.un.org/en/development/desa/population/publications/pdf/urbanization/the_worlds_cities_in_2016_data_booklet.pdf (accessed on 21 October 2018).
  52. Central Statistical Authority (CSA). Census-2007 Report. Available online: http://www.csa.gov.et/census-report/complete-report/census-2007# (accessed on 22 January 2018).
  53. Lillesand, T.M.A.; Kiefer, R.W.A.; Chipman, J.W.A. Remote Sensing and Image Interpretation, 7th ed.; John Wiley & Sons: New York, NY, USA, 2015. [Google Scholar]
  54. Tilahun, A.; Teferie, B. Accuracy assessment of land use land cover classification using Google Earth. Am. J. Environ. Prot. 2015, 4, 193–198. [Google Scholar] [CrossRef]
  55. Zhou, D.; Zhao, S.; Zhu, C. The grain for green project induced land cover change in the loess plateau: A case study with Ansai County, Shanxi Province, China. Ecol. Indic. 2012, 23, 88–94. [Google Scholar] [CrossRef]
  56. Foody, G.M. Status of land cover classification accuracy assessment. Remote Sens. Environ. 2002, 80, 185–201. [Google Scholar] [CrossRef]
  57. Rwanga, S.S.; Ndambuki, J.M. Accuracy assessment of land use/land cover classification using remote sensing and GIS. Int. J. Geosci. 2017, 8, 611–622. [Google Scholar] [CrossRef]
  58. Rempel, R.S.; Kaukinen, D.; Carr, A.P. Patch Analyst and Patch Grid. Ontario Ministry of Natural Resources, Centre for Northern Forest Ecosystem Research, Thunder Bay. 2012. Available online: http://www.cnfer.on.ca/SEP/patchanalyst/ (accessed on 24 October 2018).
  59. Jain, G.V.; Sharma, S.A. Spatio-temporal analysis of urban growth in selected small, medium and large Indian Cities. Geocarto Int. 2018, 1–22. [Google Scholar] [CrossRef]
  60. Liu, Z.; He, C.; Wu, J. General spatiotemporal patterns of urbanization: An examination of 16 world cities. Sustainability 2016, 8, 41. [Google Scholar] [CrossRef]
Figure 1. The study area of (a) Addis Ababa, (b) Hawassa, and (c) Adama.
Sustainability 11 02973 g001
Figure 2. Urban expansion map of (a) Addis Ababa, (b) Adama, and (c) Hawassa from 1987 to 2017.
Sustainability 11 02973 g002
Figure 3. Dynamics of: (a) Area (ha) and (b) the number of patches for the urban land of Addis Ababa, Adama, and Hawassa in different directions between 1987 and 2017.
Sustainability 11 02973 g003
Figure 4. Landscape metrics for the urban land of Addis Ababa, Adama, and Hawassa at different distances from 1987 to 2017: (a) PLAND (percent) and (b) number of patches.
Sustainability 11 02973 g004
Figure 5. Map of new urban growth types of (a) Addis Ababa, (b) Adama, and (c) Hawassa.
Sustainability 11 02973 g005
Figure 6. The types of new urban growth of the three cities and area coverage in km2 (a) and percentage (b).
Sustainability 11 02973 g006
Figure 7. Population and urban growth imbalance index (PUGI).
Sustainability 11 02973 g007
Figure 8. Spatial amount of built-up land and elevation for Addis Ababa (a), Adama (b), and Hawassa (c) from 1985 to 2017.
Sustainability 11 02973 g008
Figure 9. The annual change rates of landscape metrics for the urban land in three major cities from 1987 to 2017: (a) Addis Ababa, (b) Adama, and (c) Hawassa.
Sustainability 11 02973 g009
Table 1. Information on remotely sensed data for the study areas.
PeriodsAddis AbabaAdamaHawassa
Path/RowDatePath/RowDatePath/RowDate
1987168/541987/02/09168/0541987/02/09168/551987/02/09
1995168/541995/03/19168/0541995/03/19168/551995/01/30
2005168/542005/03/18168/0542005/03/18168/552005/01/05
2017168/542017/03/15168/0542017/03/15168/552017/03/17
DEM data ASTER GDEM with 30-m spatial resolution.
Table 2. Summary of accuracy assessment for the classified products using over all accuracy (in percentage).
Cities1987199520052017
Addis Ababa88.1388.1191.8789.92
Adama86.4287.2685.6888.72
Hawassa86.8387.1486.9388.42
Table 3. Selected landscape metrics adopted from McGarigal [55].
MetricFormulaUnitsDescription
Class Area (CA)CA = j = 0 n a j i   ( 1 10,000 ) .Hectareaij = area (m2) of patch ij.
Percentage of Landscape (PLAND) (%)PLAND = Pi = j = 1 m a j i A ( 100 ) PercentPi = proportion of the landscape occupied by patch type (class) i.
A = total landscape area (m2).
Number of Patches (NP)NP = niNoneni = total number of patches in the landscape of patch type (class) i.
Edge Density (ED) ED = k = 1 m e ik A ( 10,000 ) Meter/Hectare eik = total length (m) of edge in landscape involving patch type (class) i.
Area weighted mean patch fractal dimension (AWMPFD)AWMPFD = i = 1 m j = 1 n 2 ln ( 0.25 P i j ) lna j i ( a j i A ) Noneaij = area (m2) of patch ij.
pij = perimeter (m) of patch ij.
Mean Patch Size (MPS)NP/100 haHectareThe number of patches of per 100 ha Average patch size.
Table 4. Total urban area (km2) and proportion (%) of the urban land increase from 1987 to 2017.
CityUrban Land Area (Km2)Percentage of Urban Area Increased (%)
19871995200520171987–19951995–20052005–20171987–2017
Addis Ababa99149.5208.6283.951.039.536.1186.7
Adama8.812.128.850.637.6138.775.6476.9
Hawassa6.111.320.339.184.680.392.6540.8
Table 5. Average annual expansion (AE) in urban area (km2) and annual urban expansion rate (AER) (%) for three cities among four neighboring periods from 1987 to 2017.
City1987–19951995–20052005–20171987–2017Average
AEAddis Ababa6.315.916.286.166.17
Adama0.411.671.821.391.30
Hawassa0.650.901.571.101.04
AERAddis Ababa6.373.953.016.224.44
Adama4.7113.876.3015.98.29
Hawassa10.88.127.7118.038.88
Table 6. Annual change rate (%) of landscape metrics calculated for three cities using Equation (5).
Landscape MetricsAddis AbabaAdamaHawassa
1987–19951995–20052005–20171987–19951995–20052005–20171987–19951995–20052005–2017
NP30.69−0.1425.975.00−0.7139.900.5443.333.65
MPS−8.092.49−5.21−0.2115.71−5.81−1.77−4.13−0.92
ED12.81−0.4318.0121.84−1.2016.521.7112.015.06
AWMPFD3.430.150.440.66−1.001.540.220.340.34

