Deciphering the Spatial Structures of City Networks in the Economic Zone of the West Side of the Taiwan Strait through the Lens of Functional and Innovation Networks

Abstract
:1. Introduction
2. Methodology
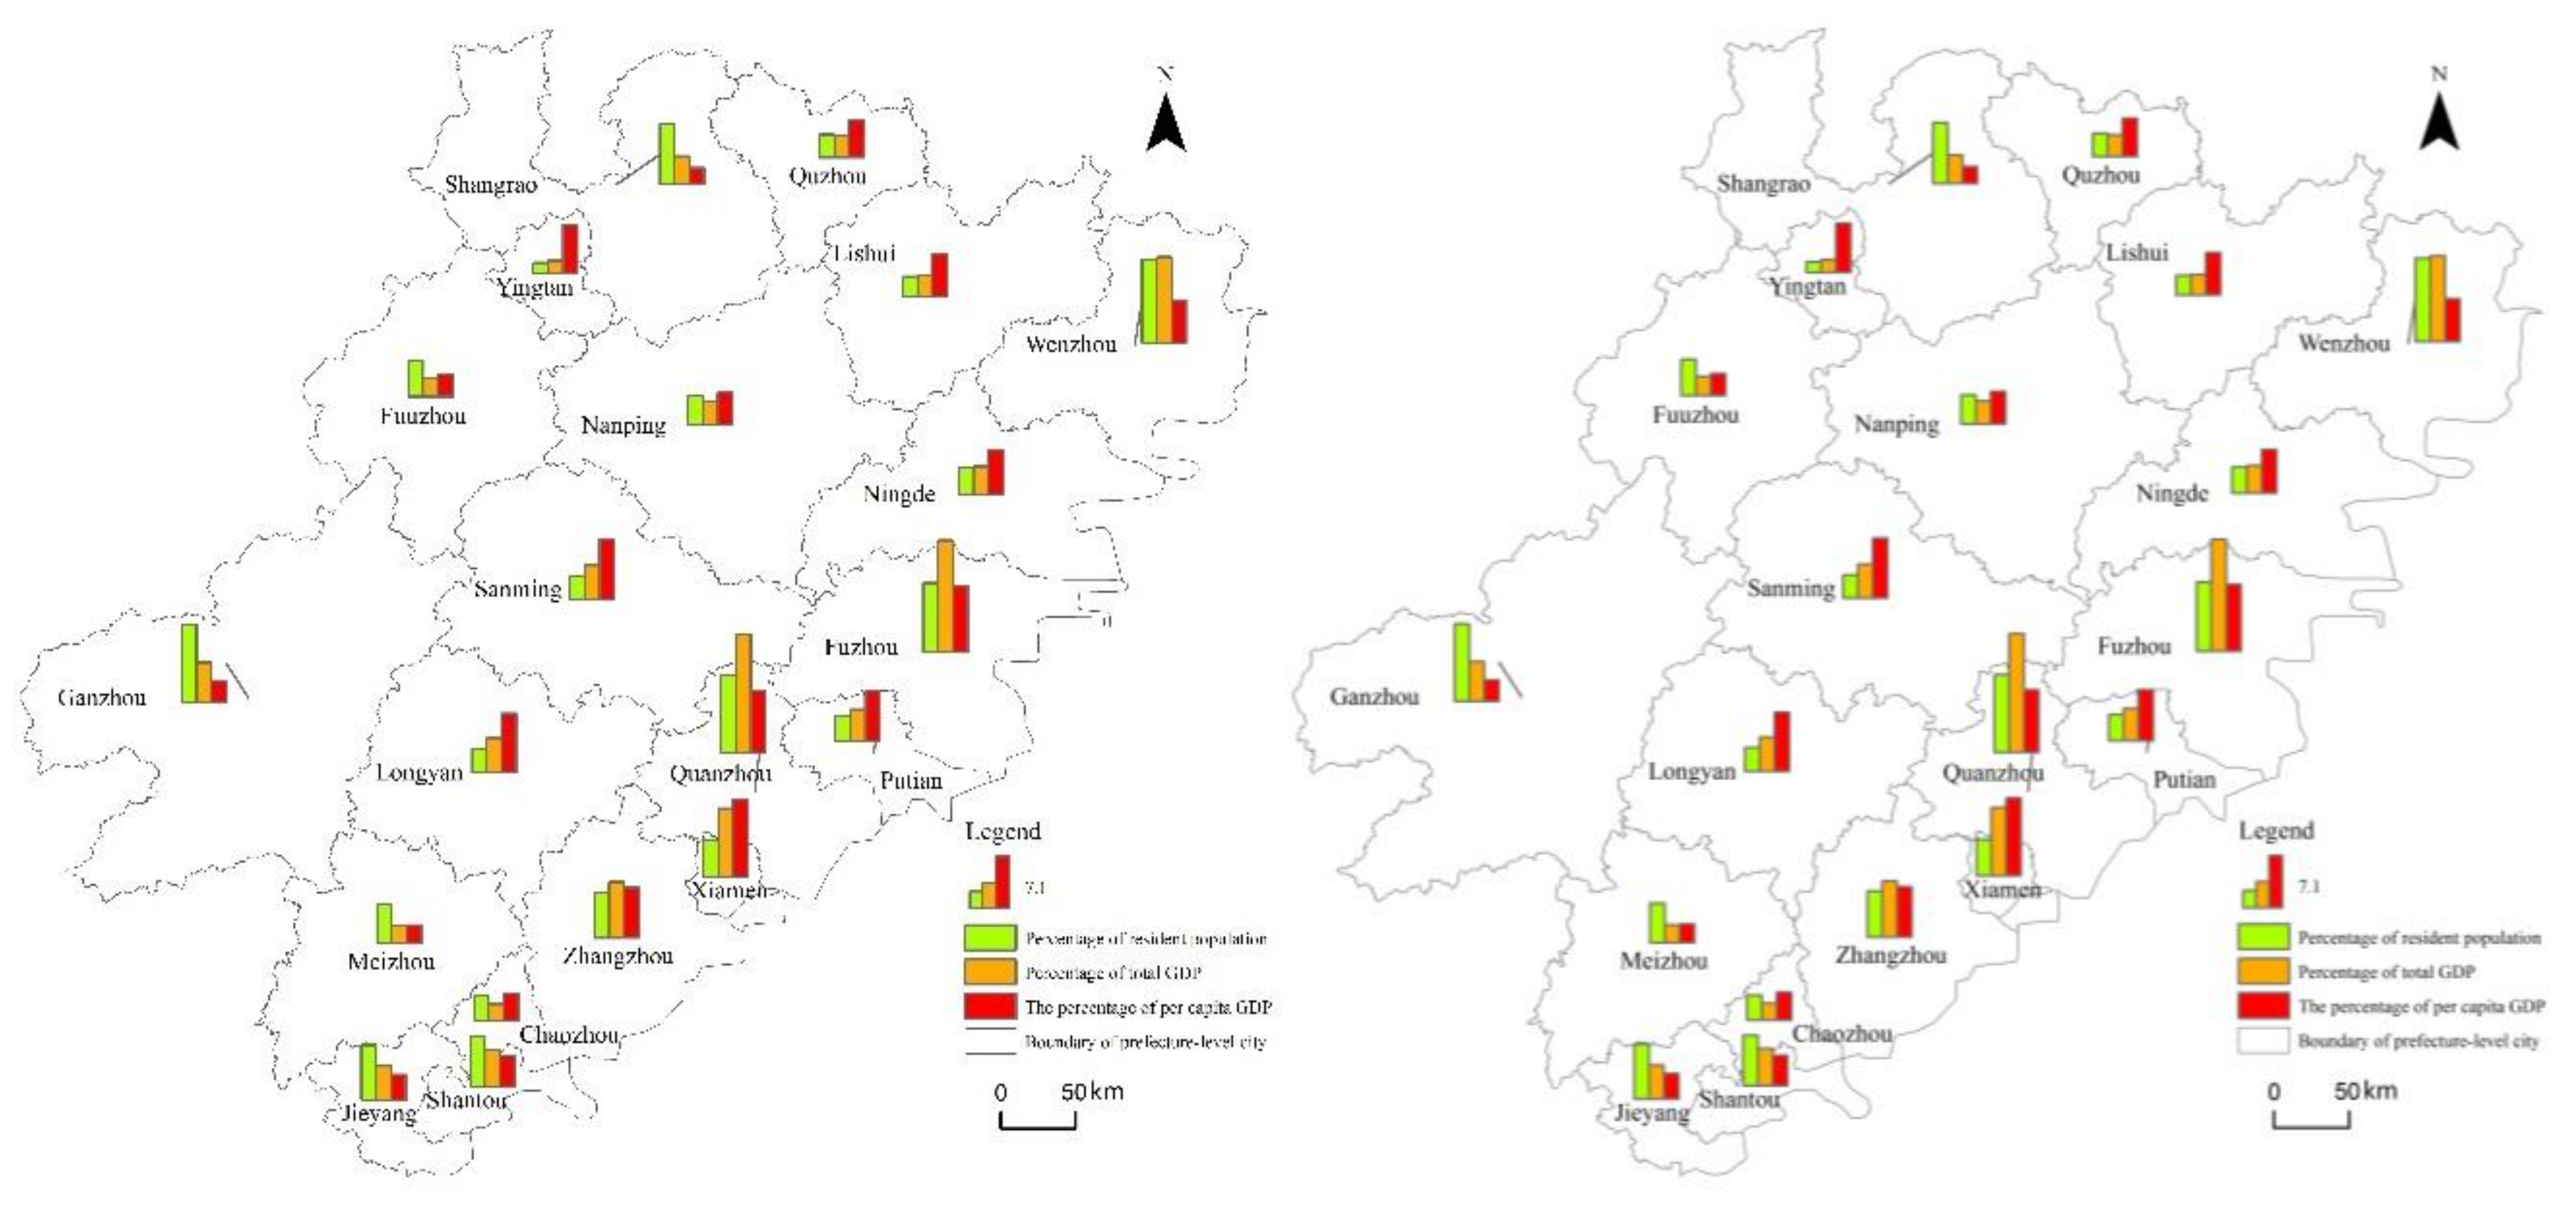
2.1. Research Area
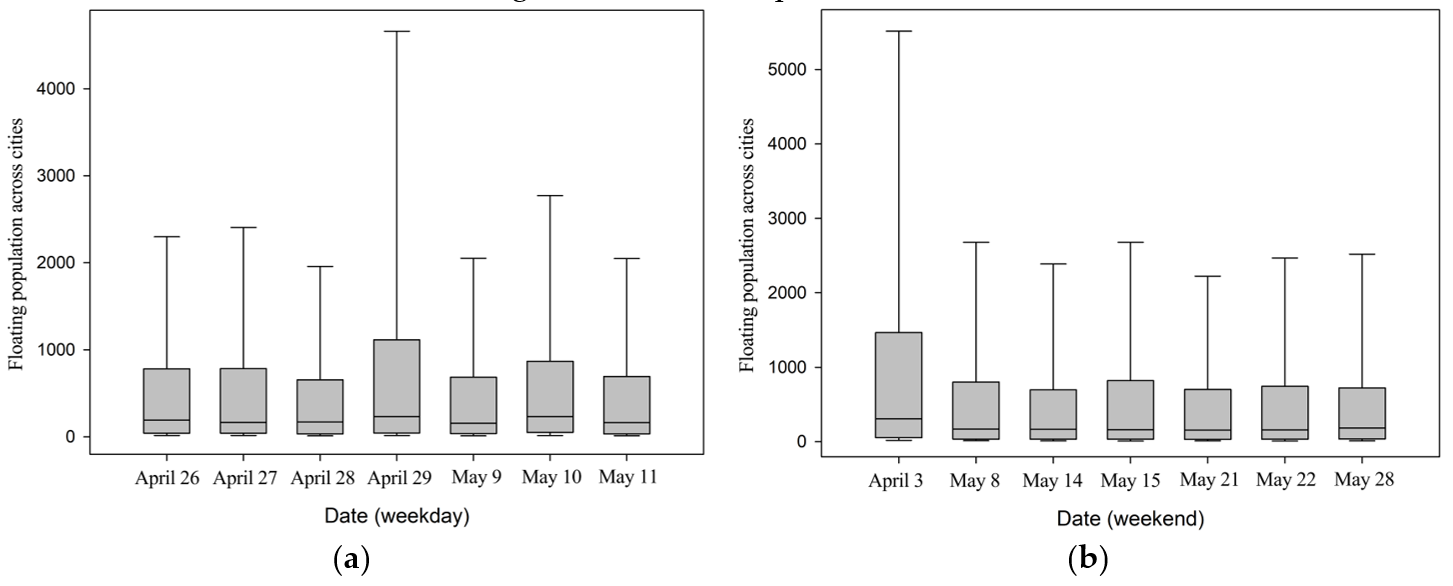
2.2. Data Sources
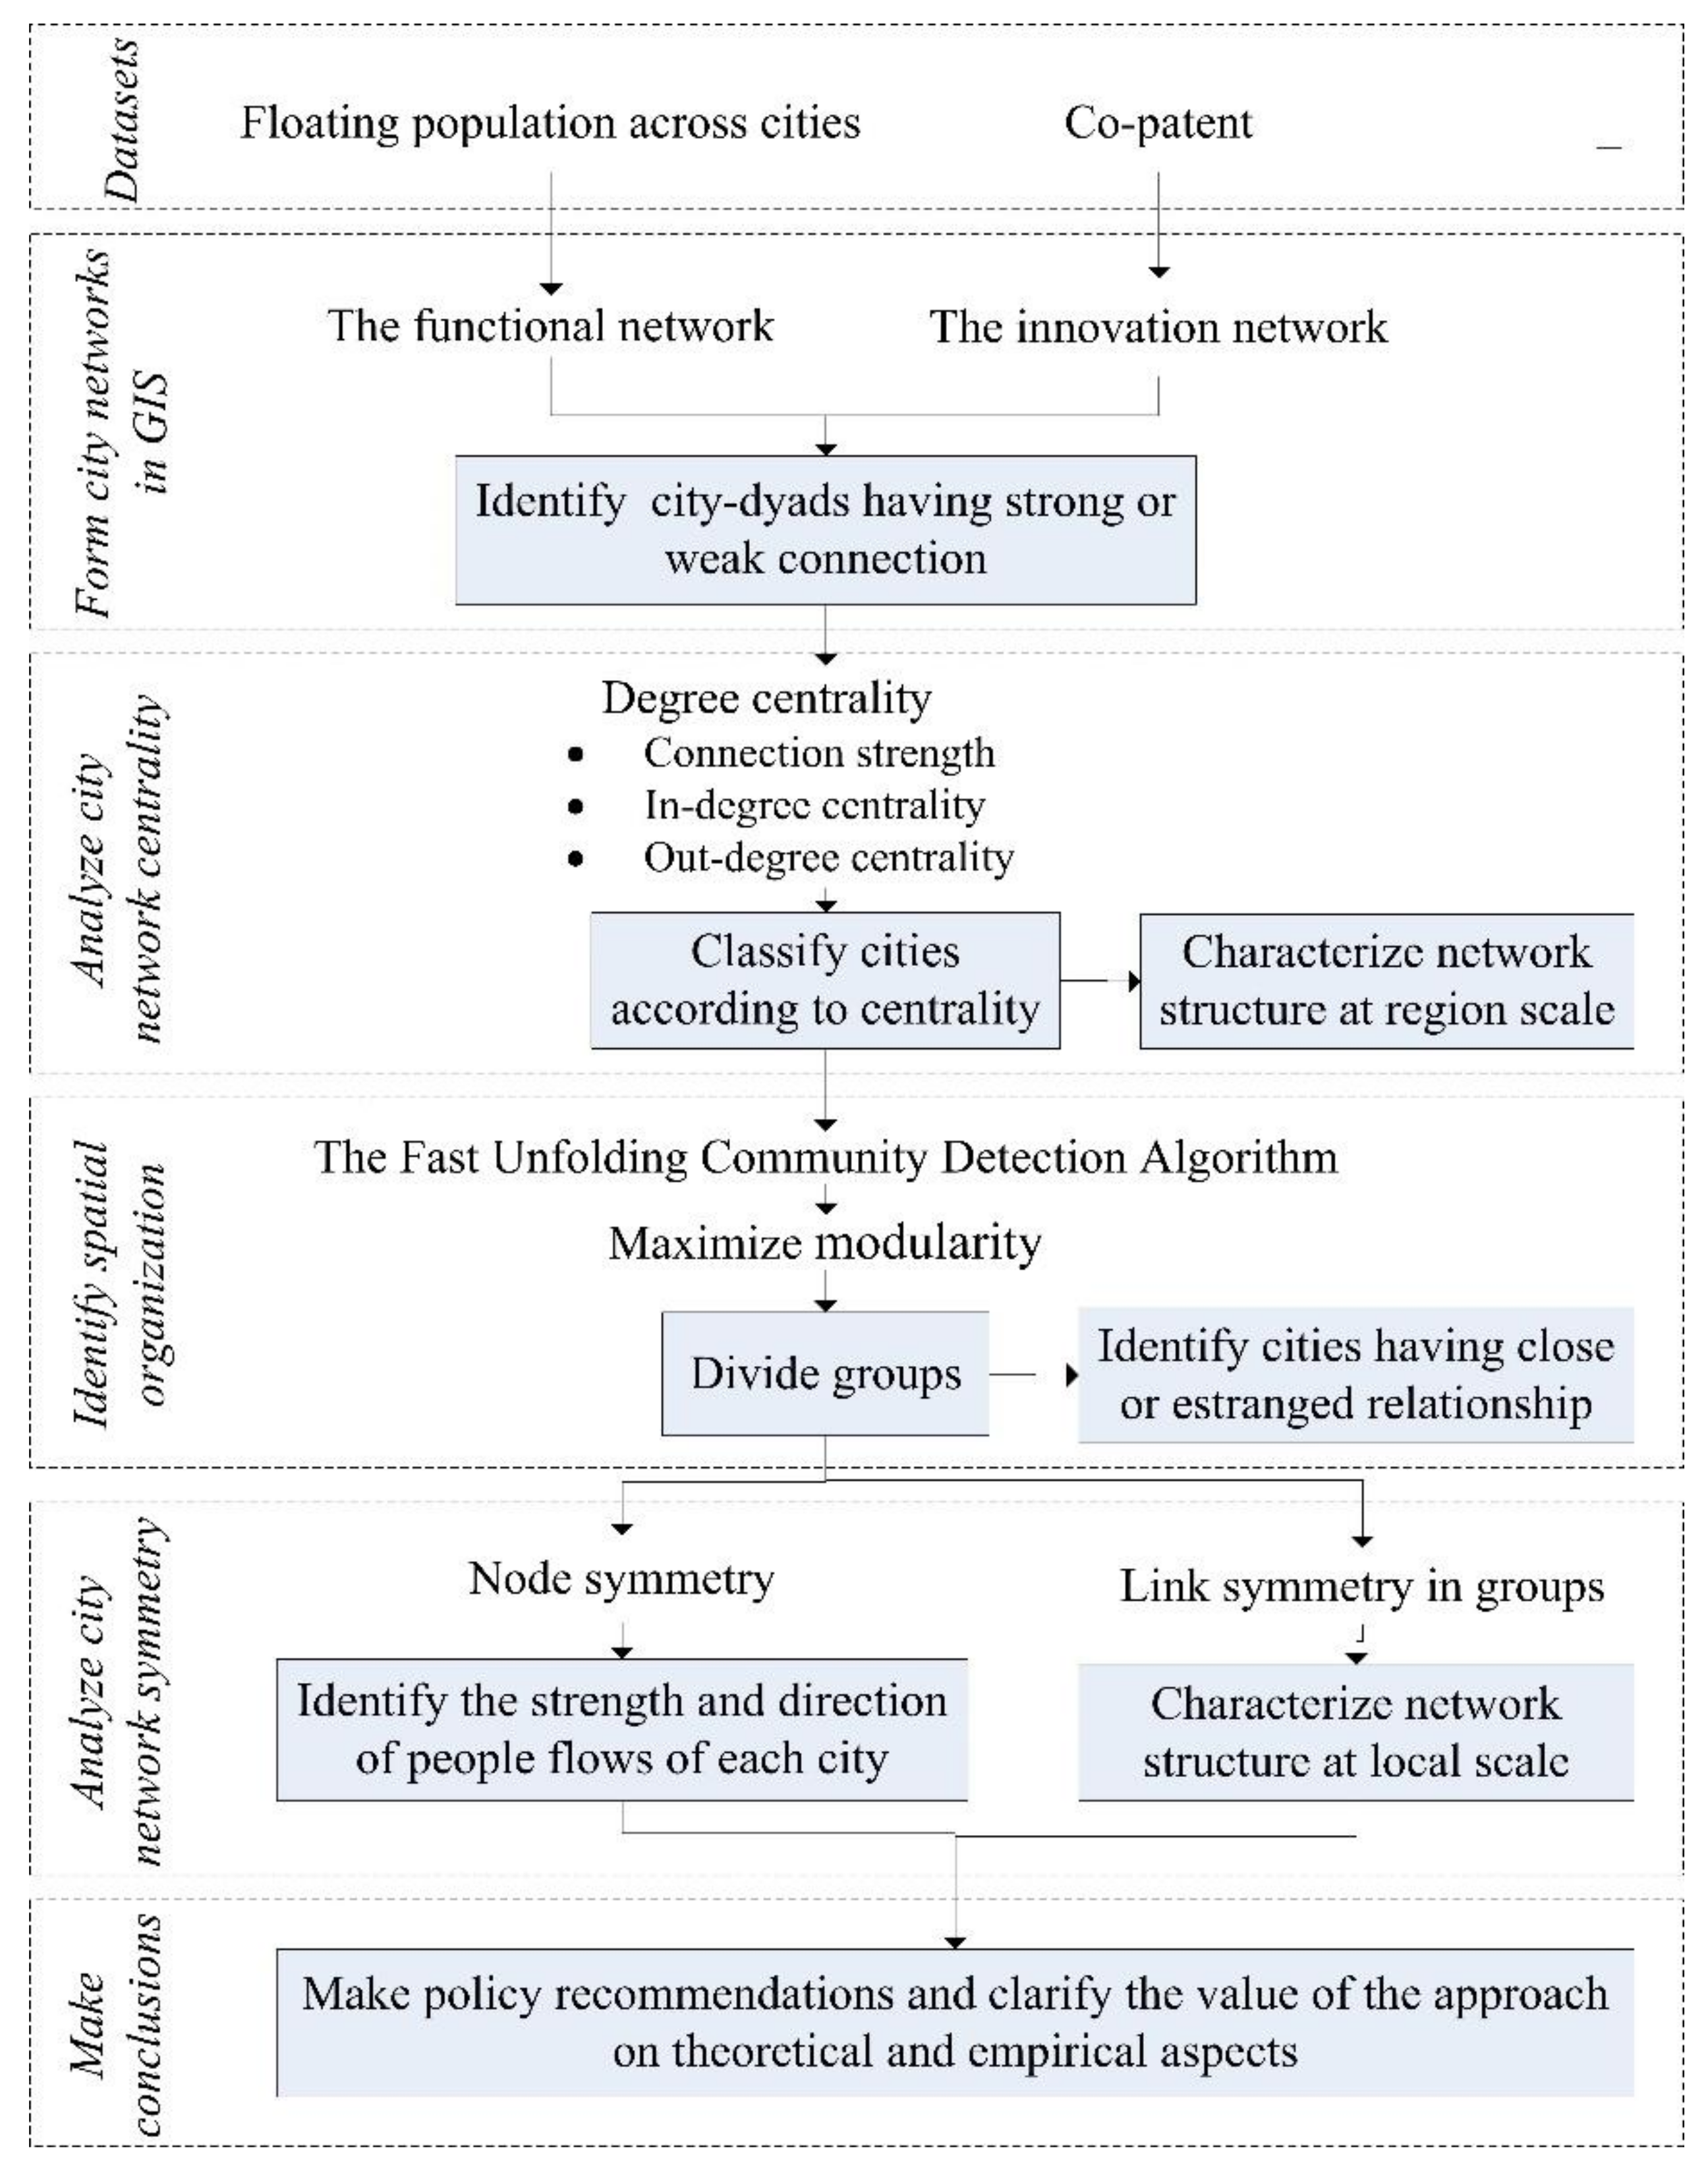
2.3. Research Framework
2.4. Approaches to Characterize Network Centrality, Spatial or Ganization, and Network Symmetry
2.4.1. Network Centrality
2.4.2. Network Symmetry
2.4.3. Spatial Organization
3. Results
3.1. Network Construction and Analysis
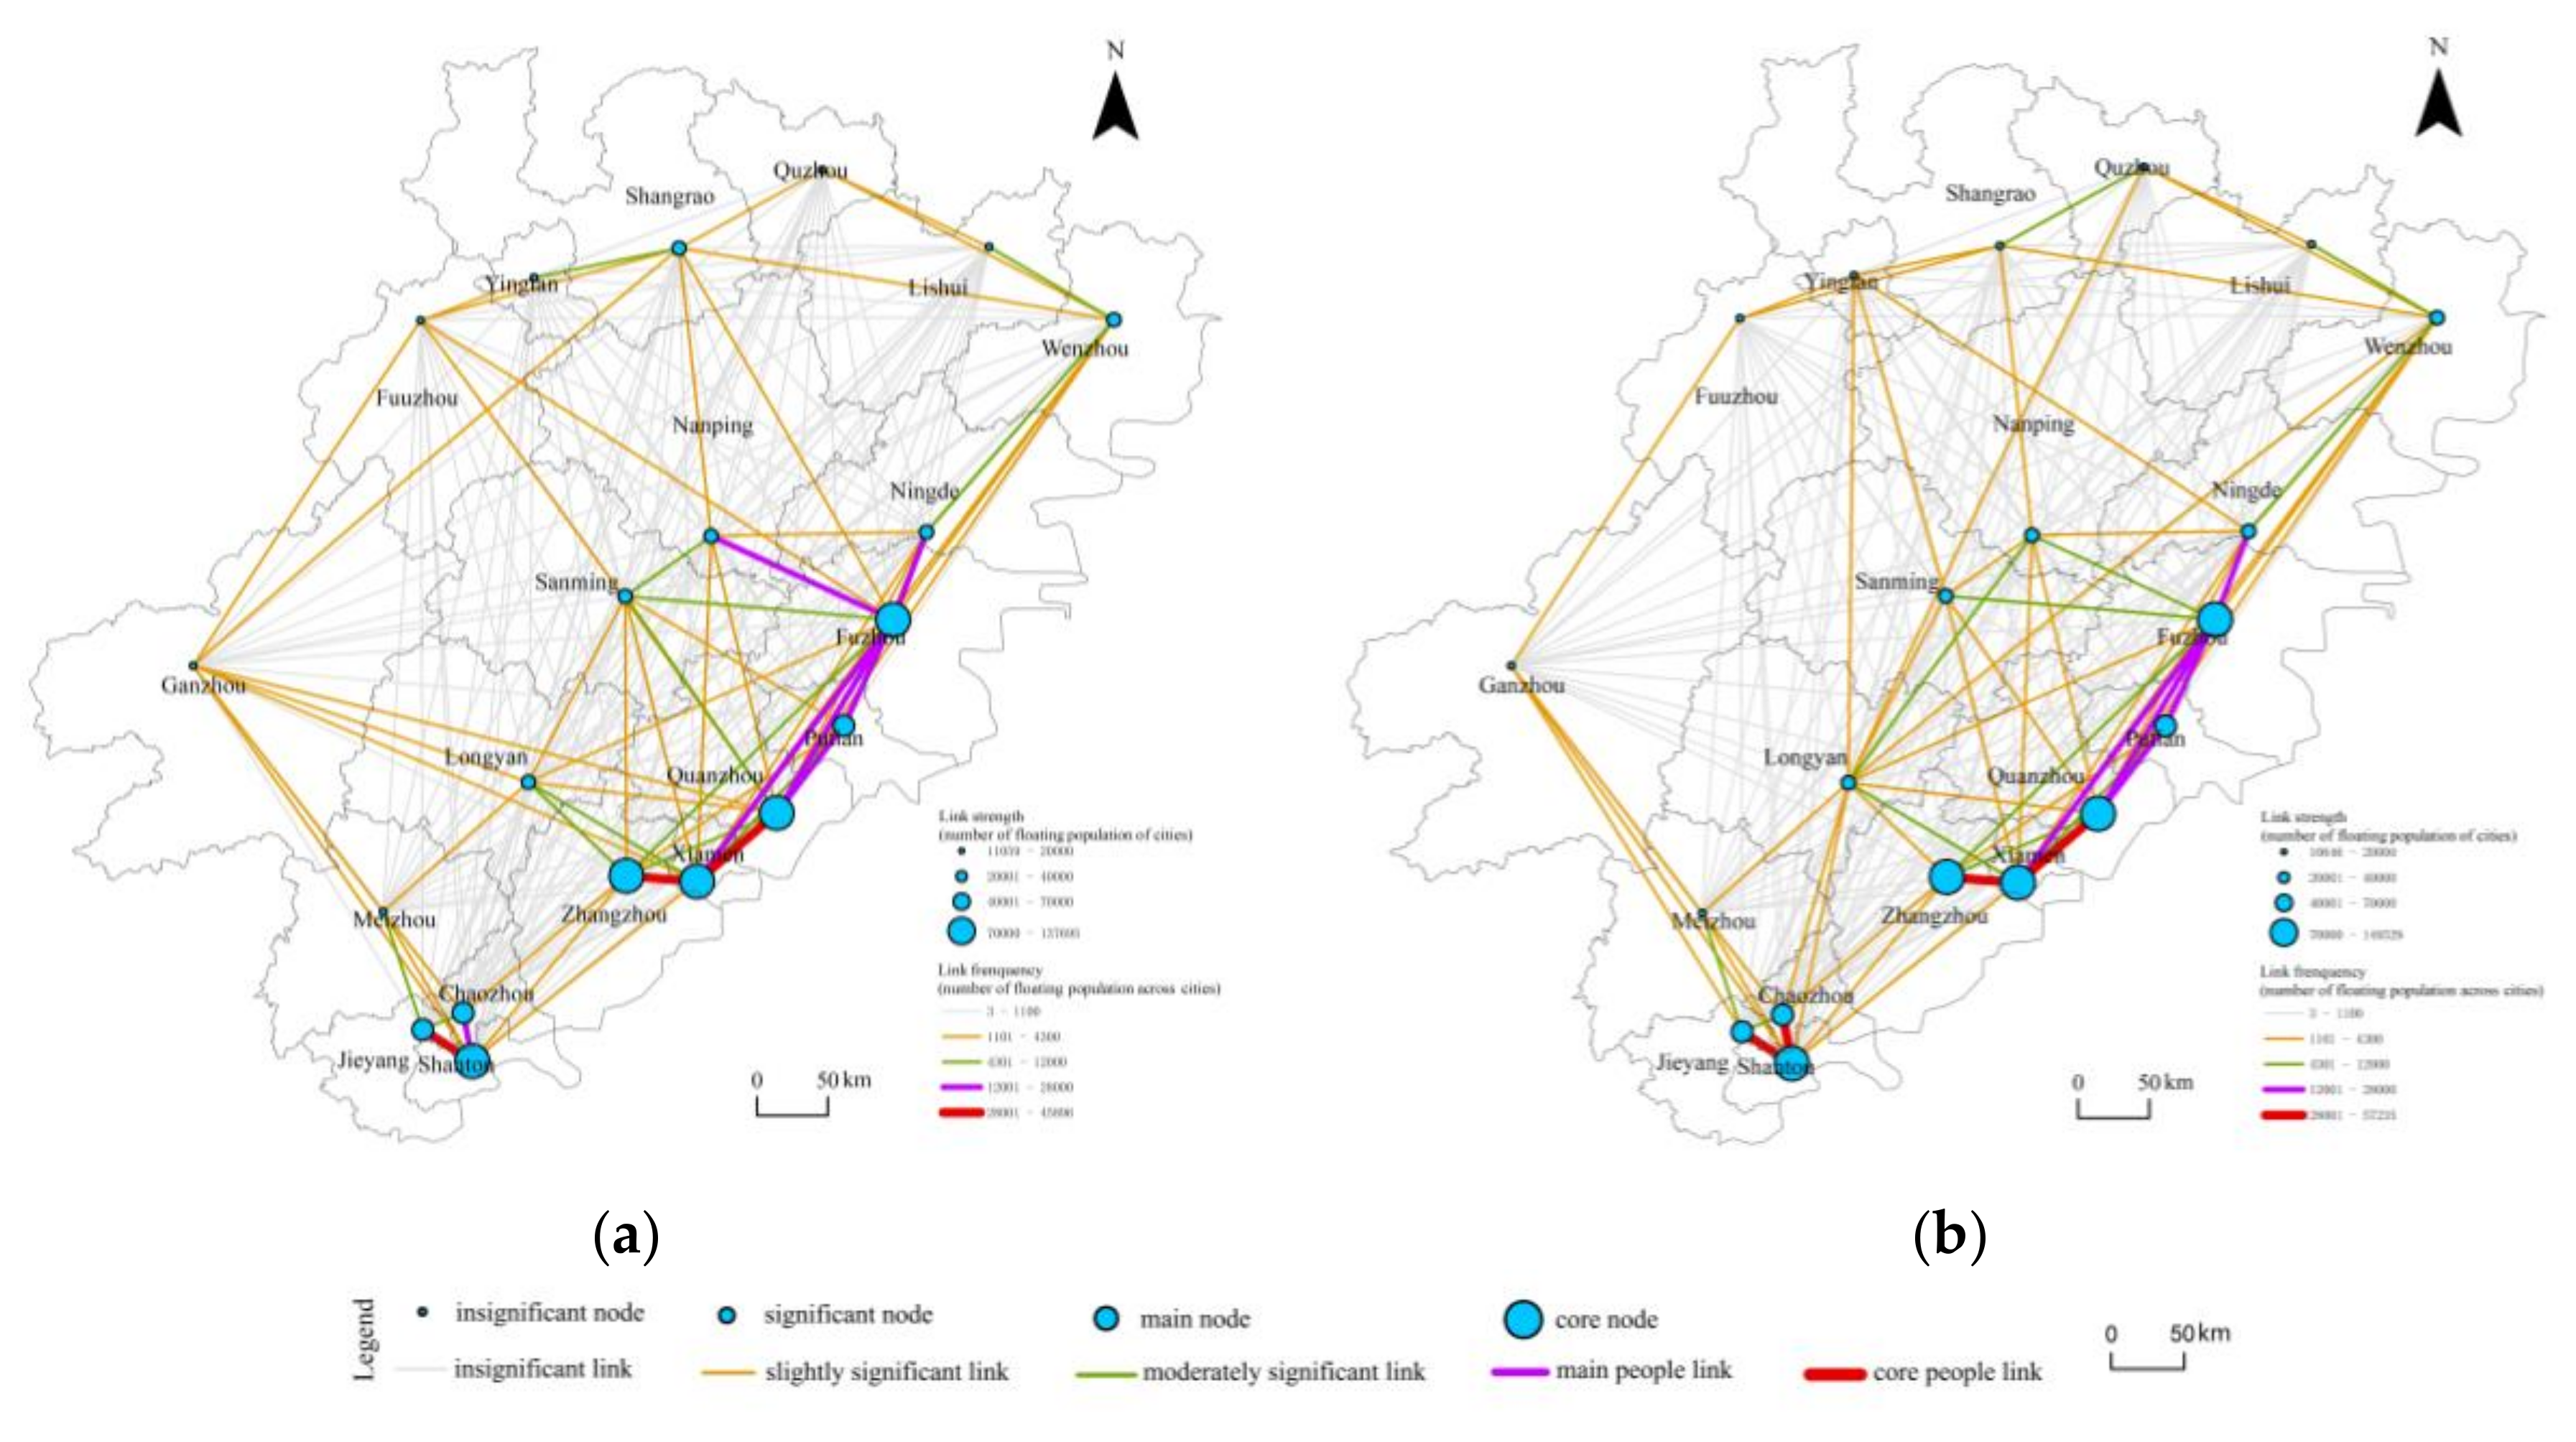
3.1.1. Functional Network
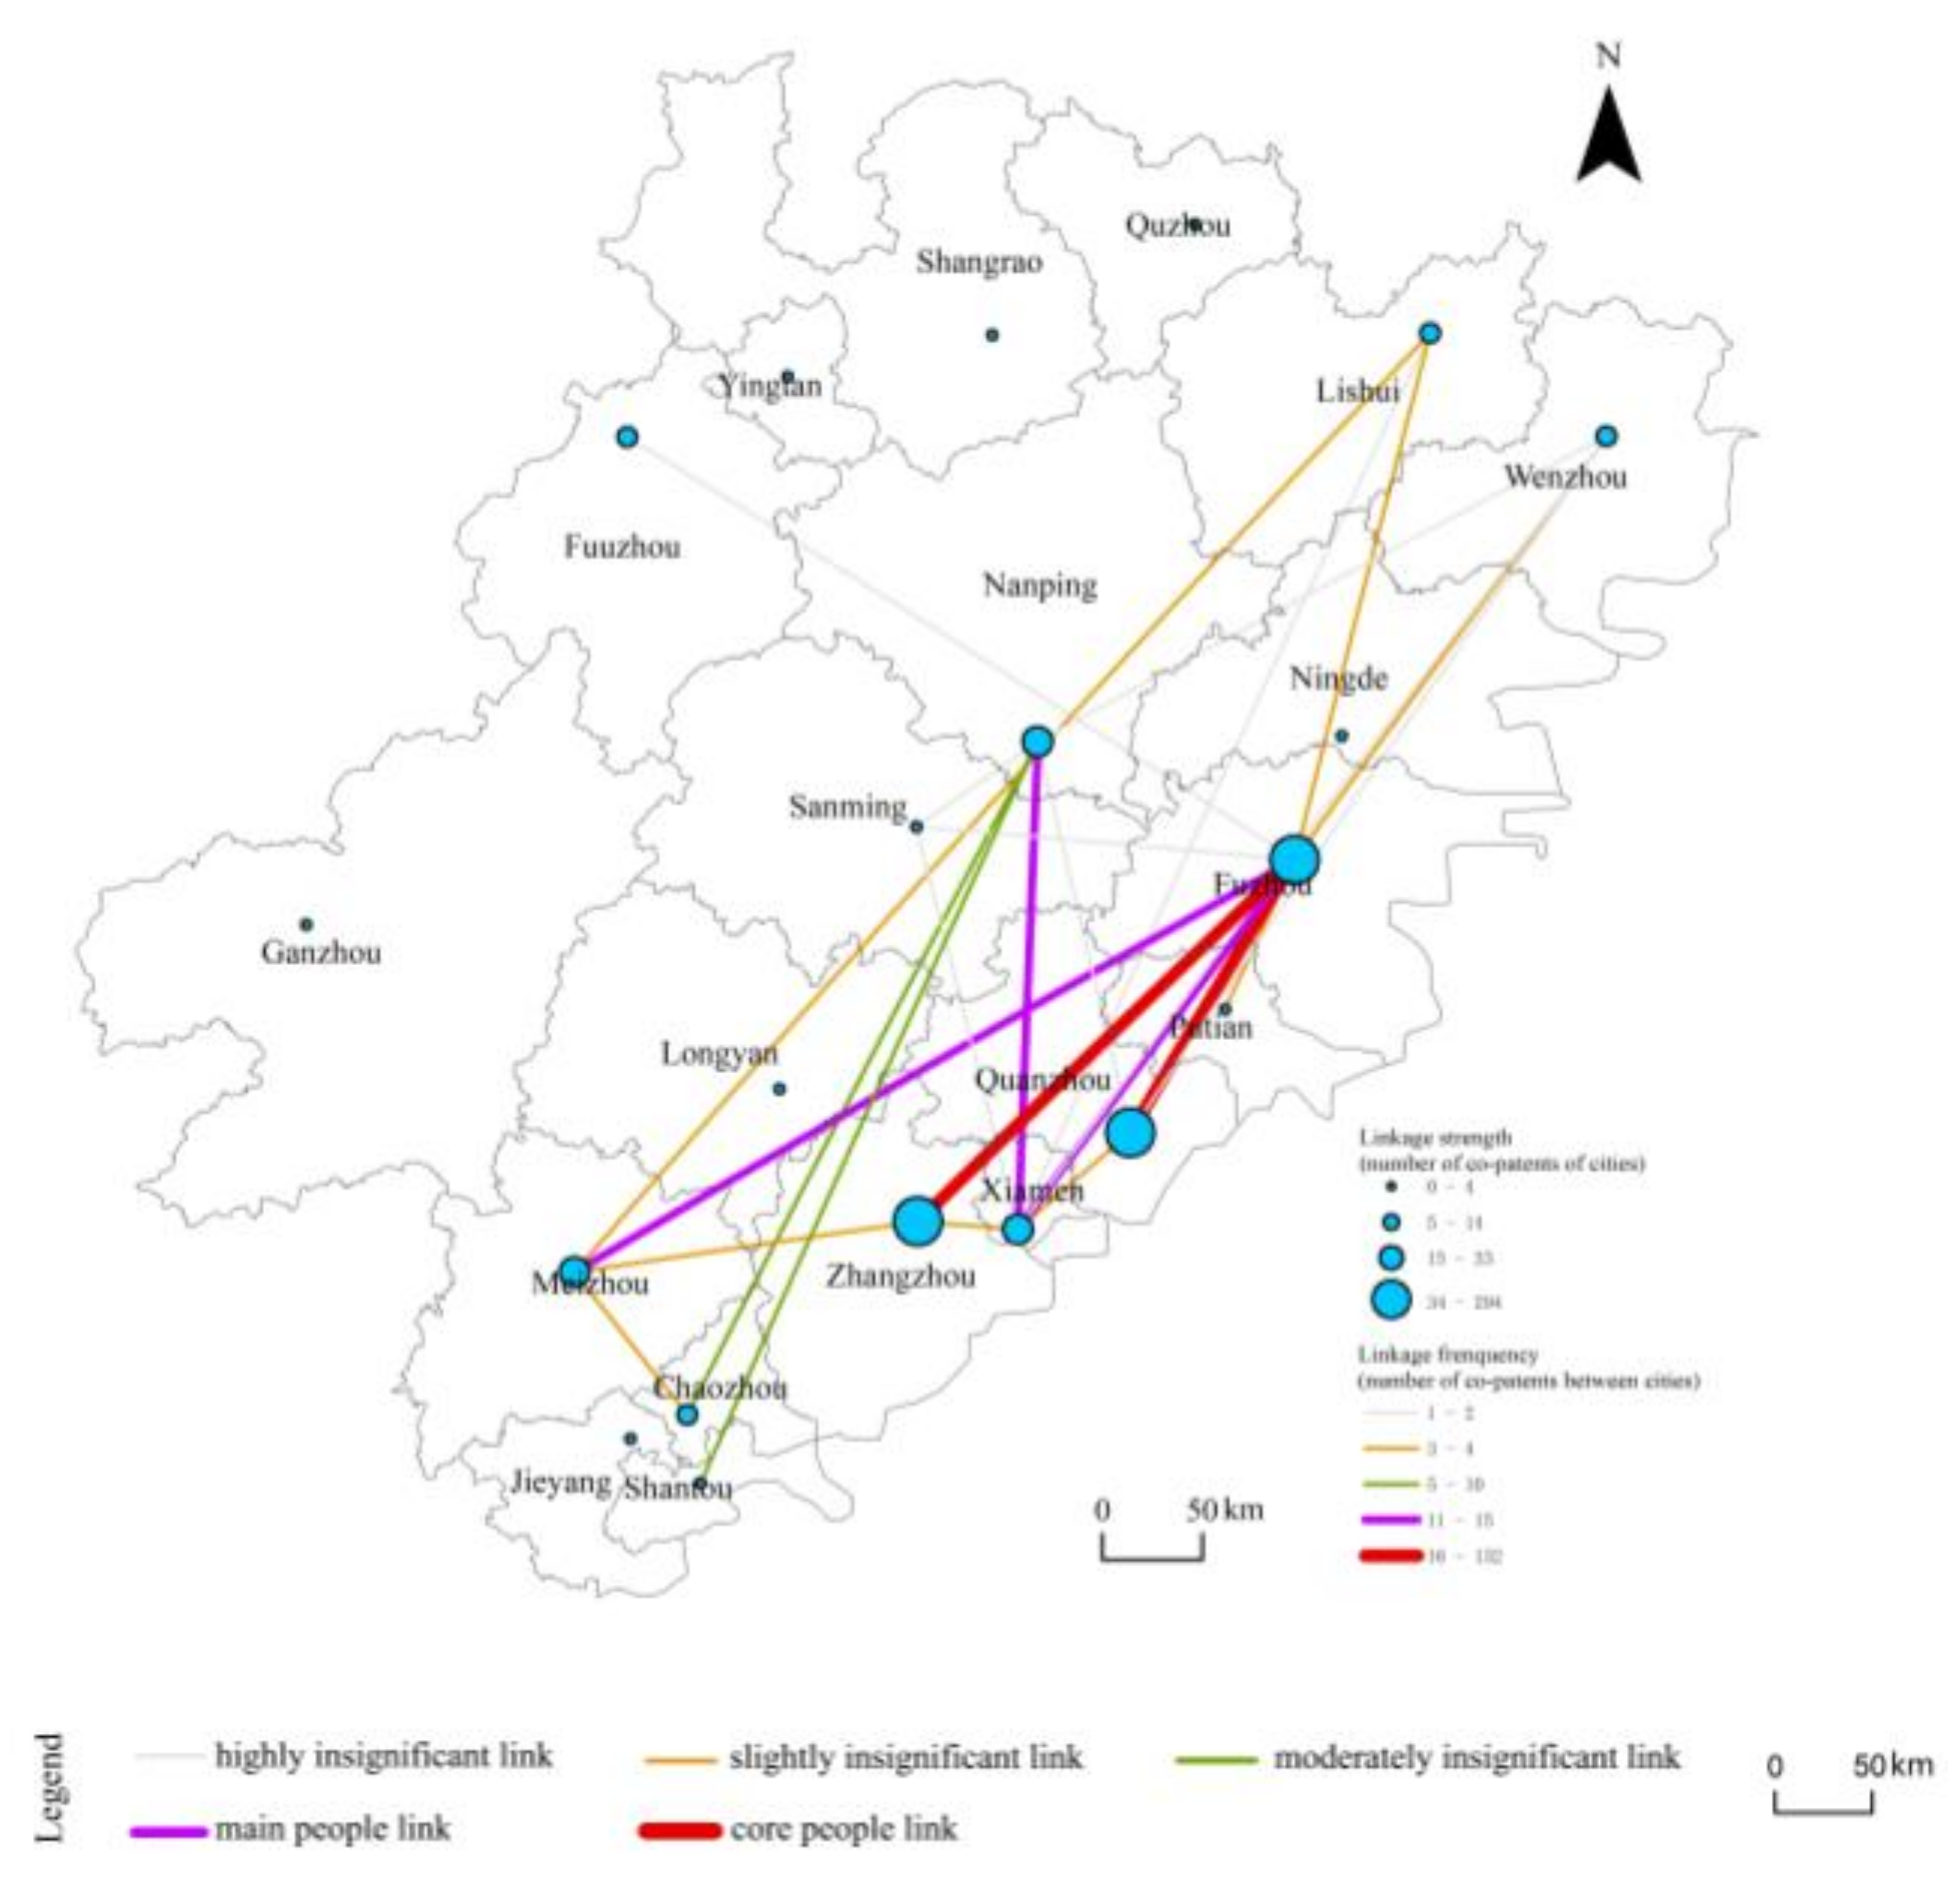
3.1.2. Innovation Network
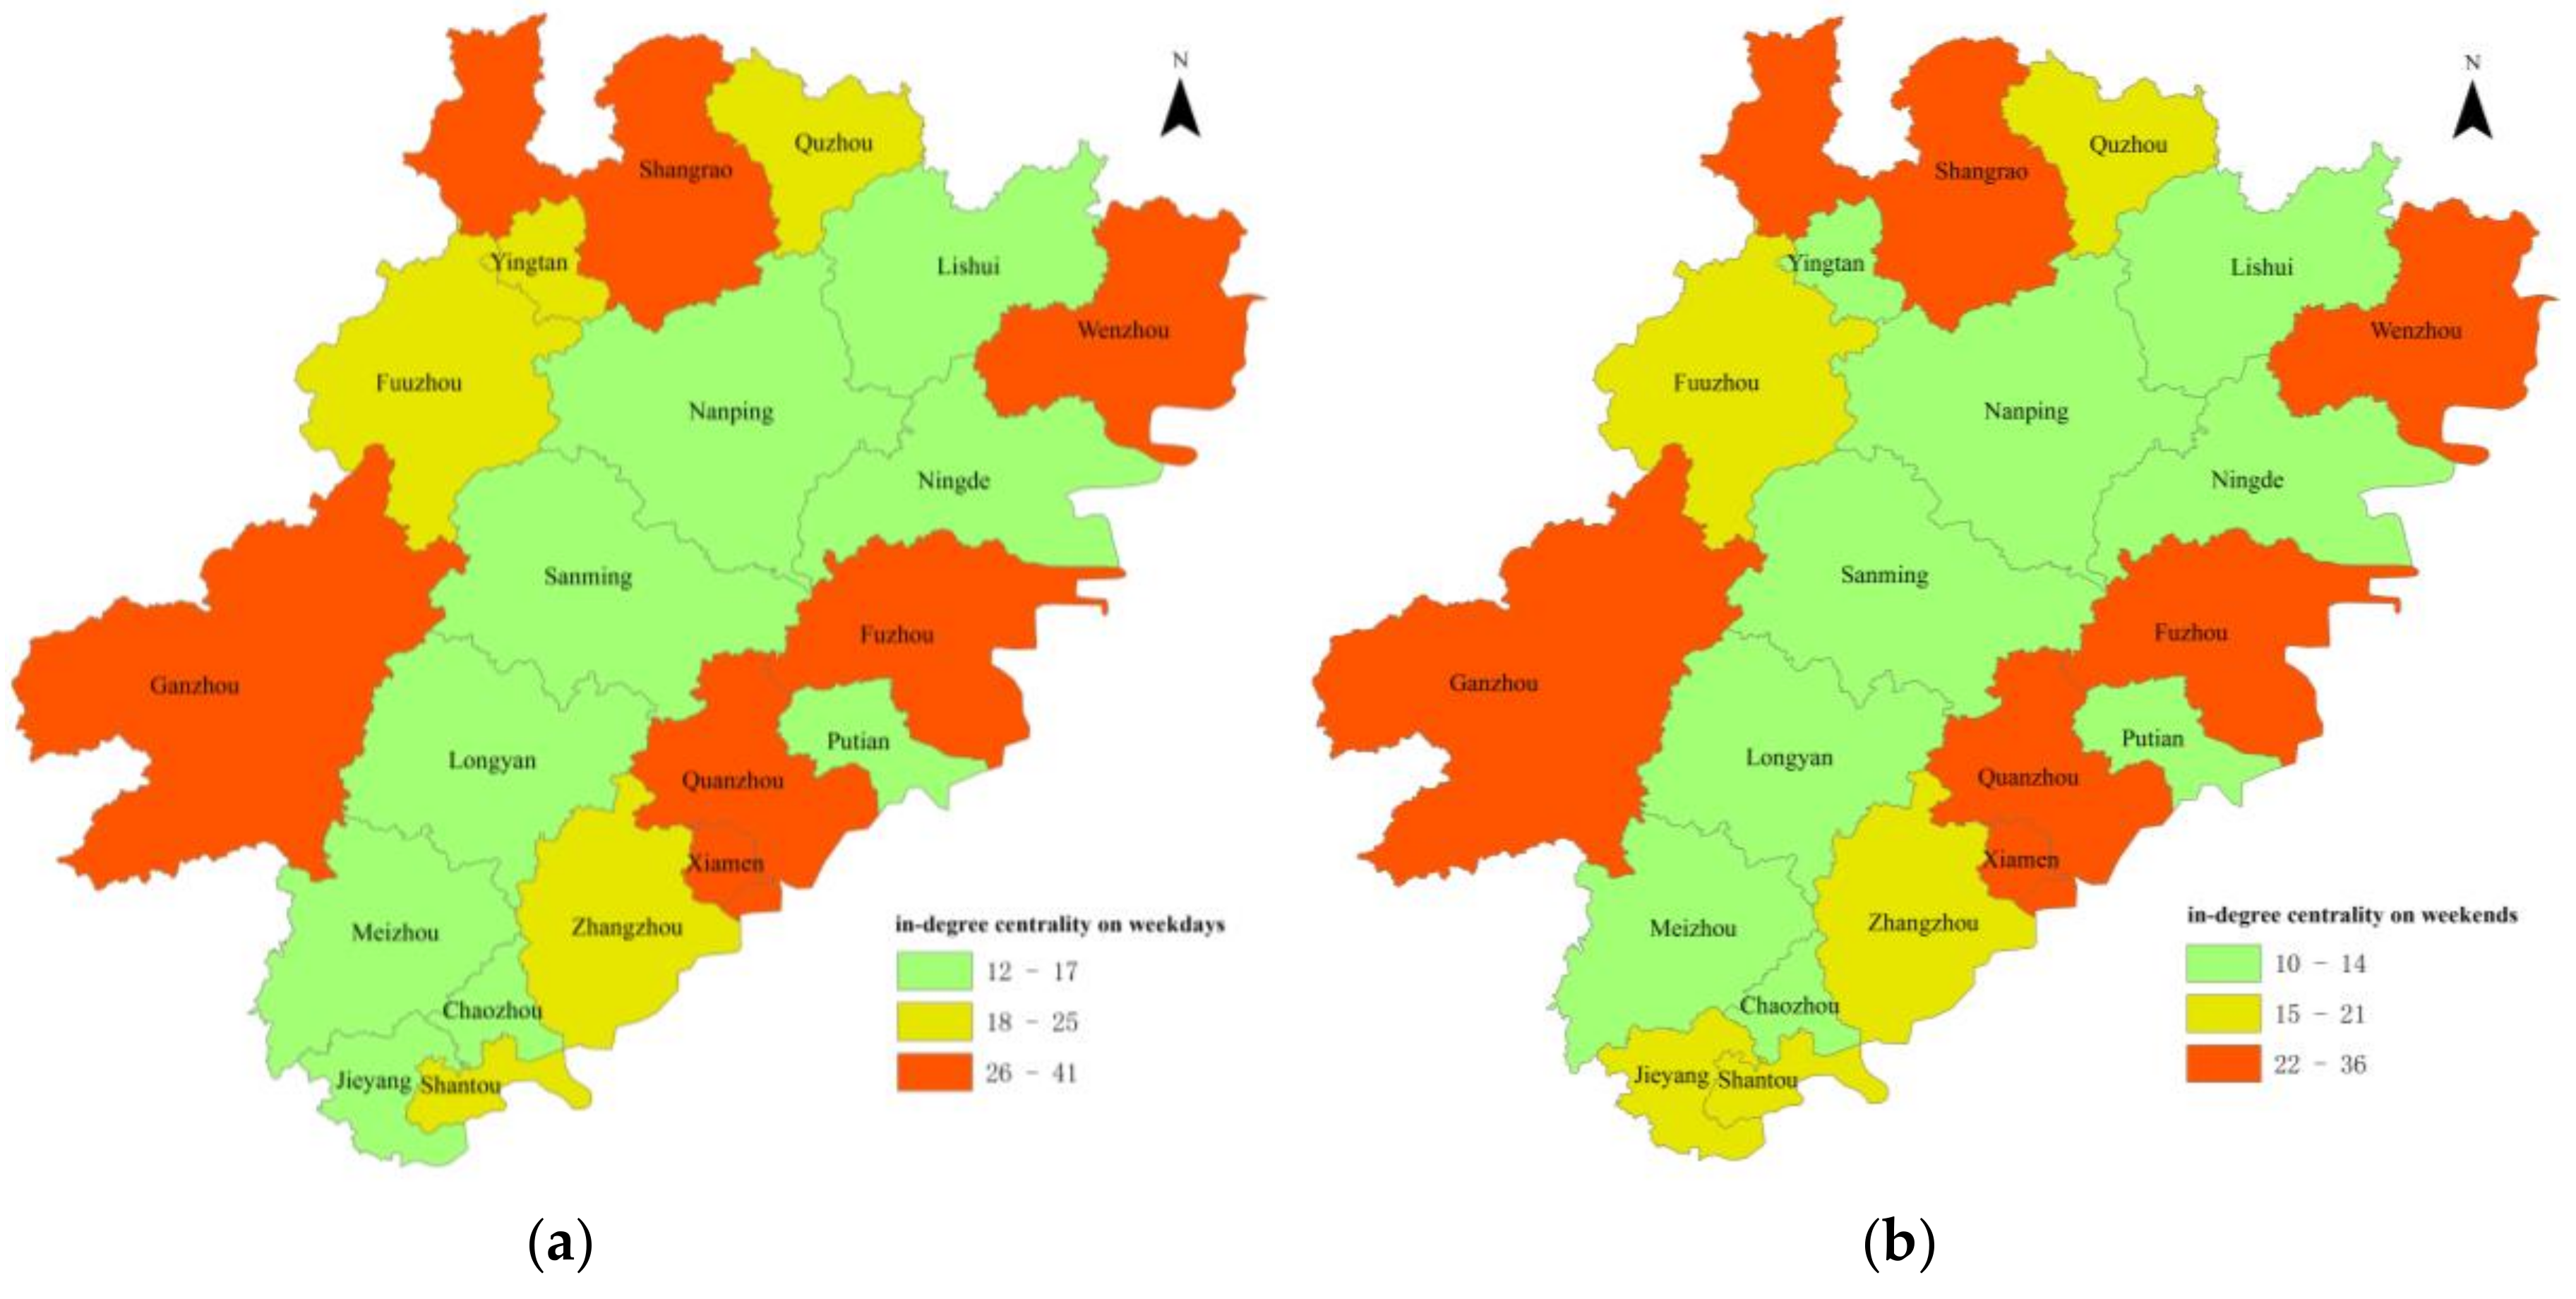
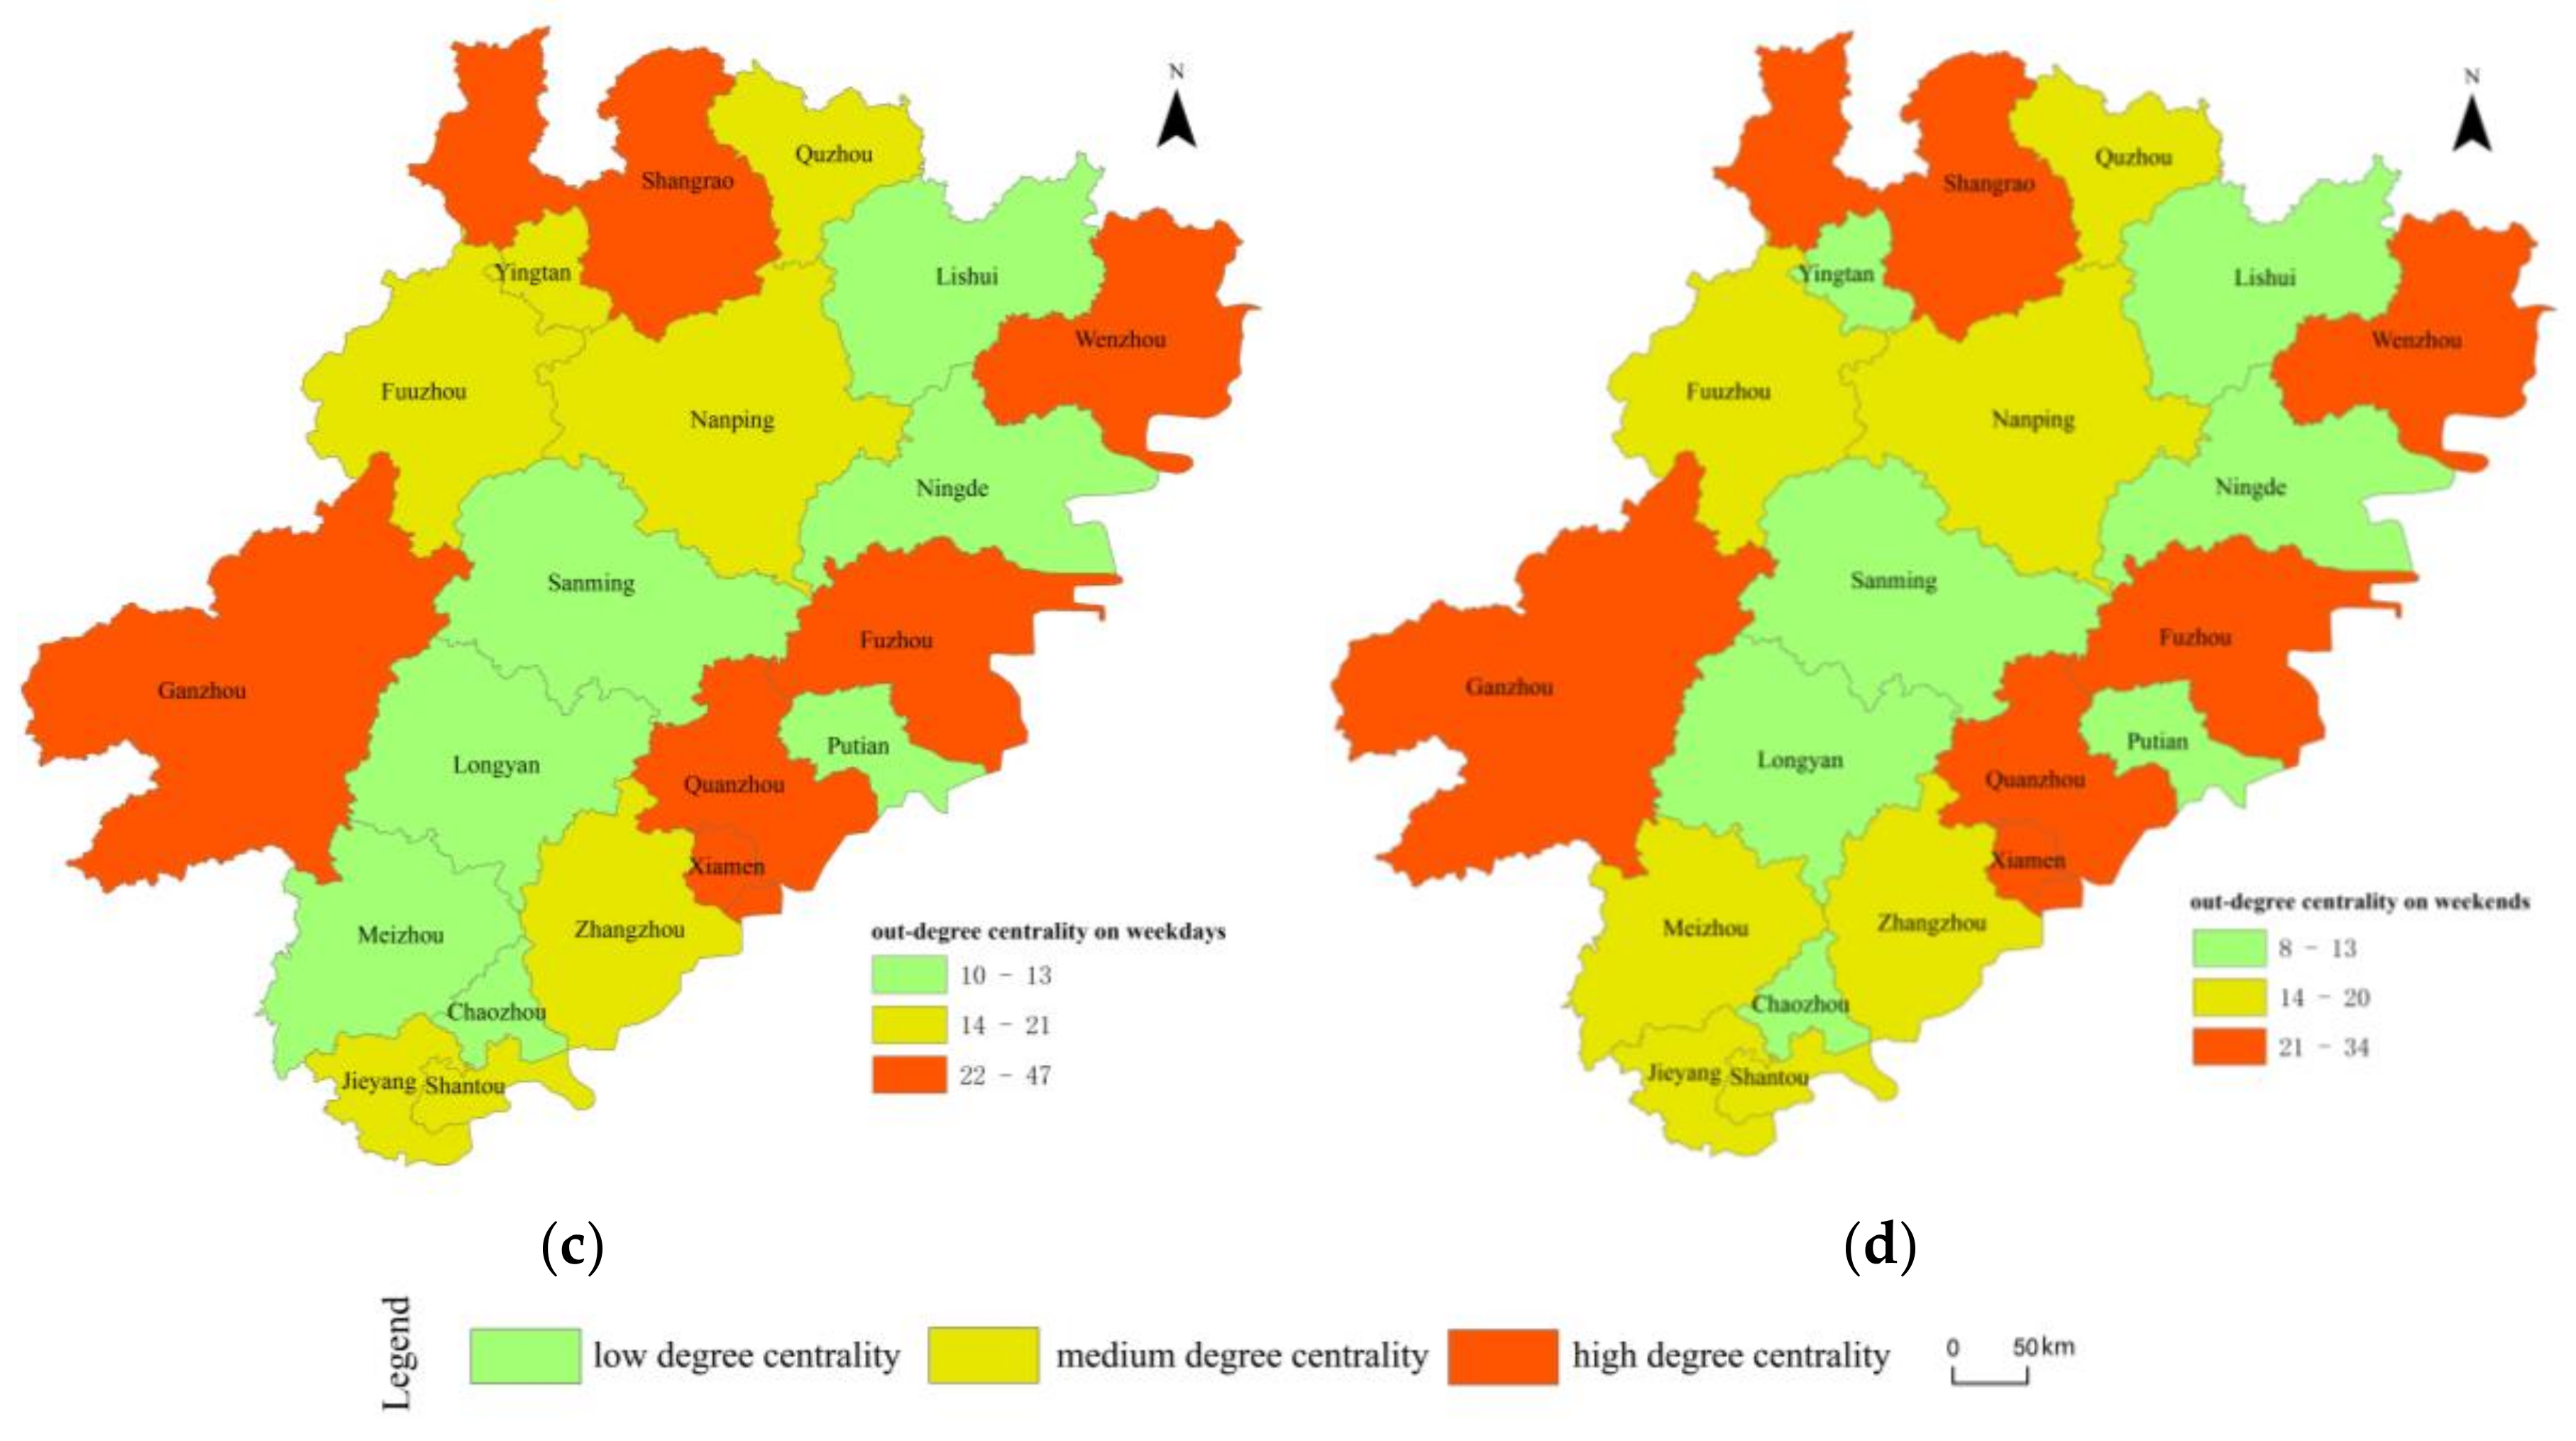
3.2. Analysis of Network Centrality
3.3. Identification of Spatial Organization
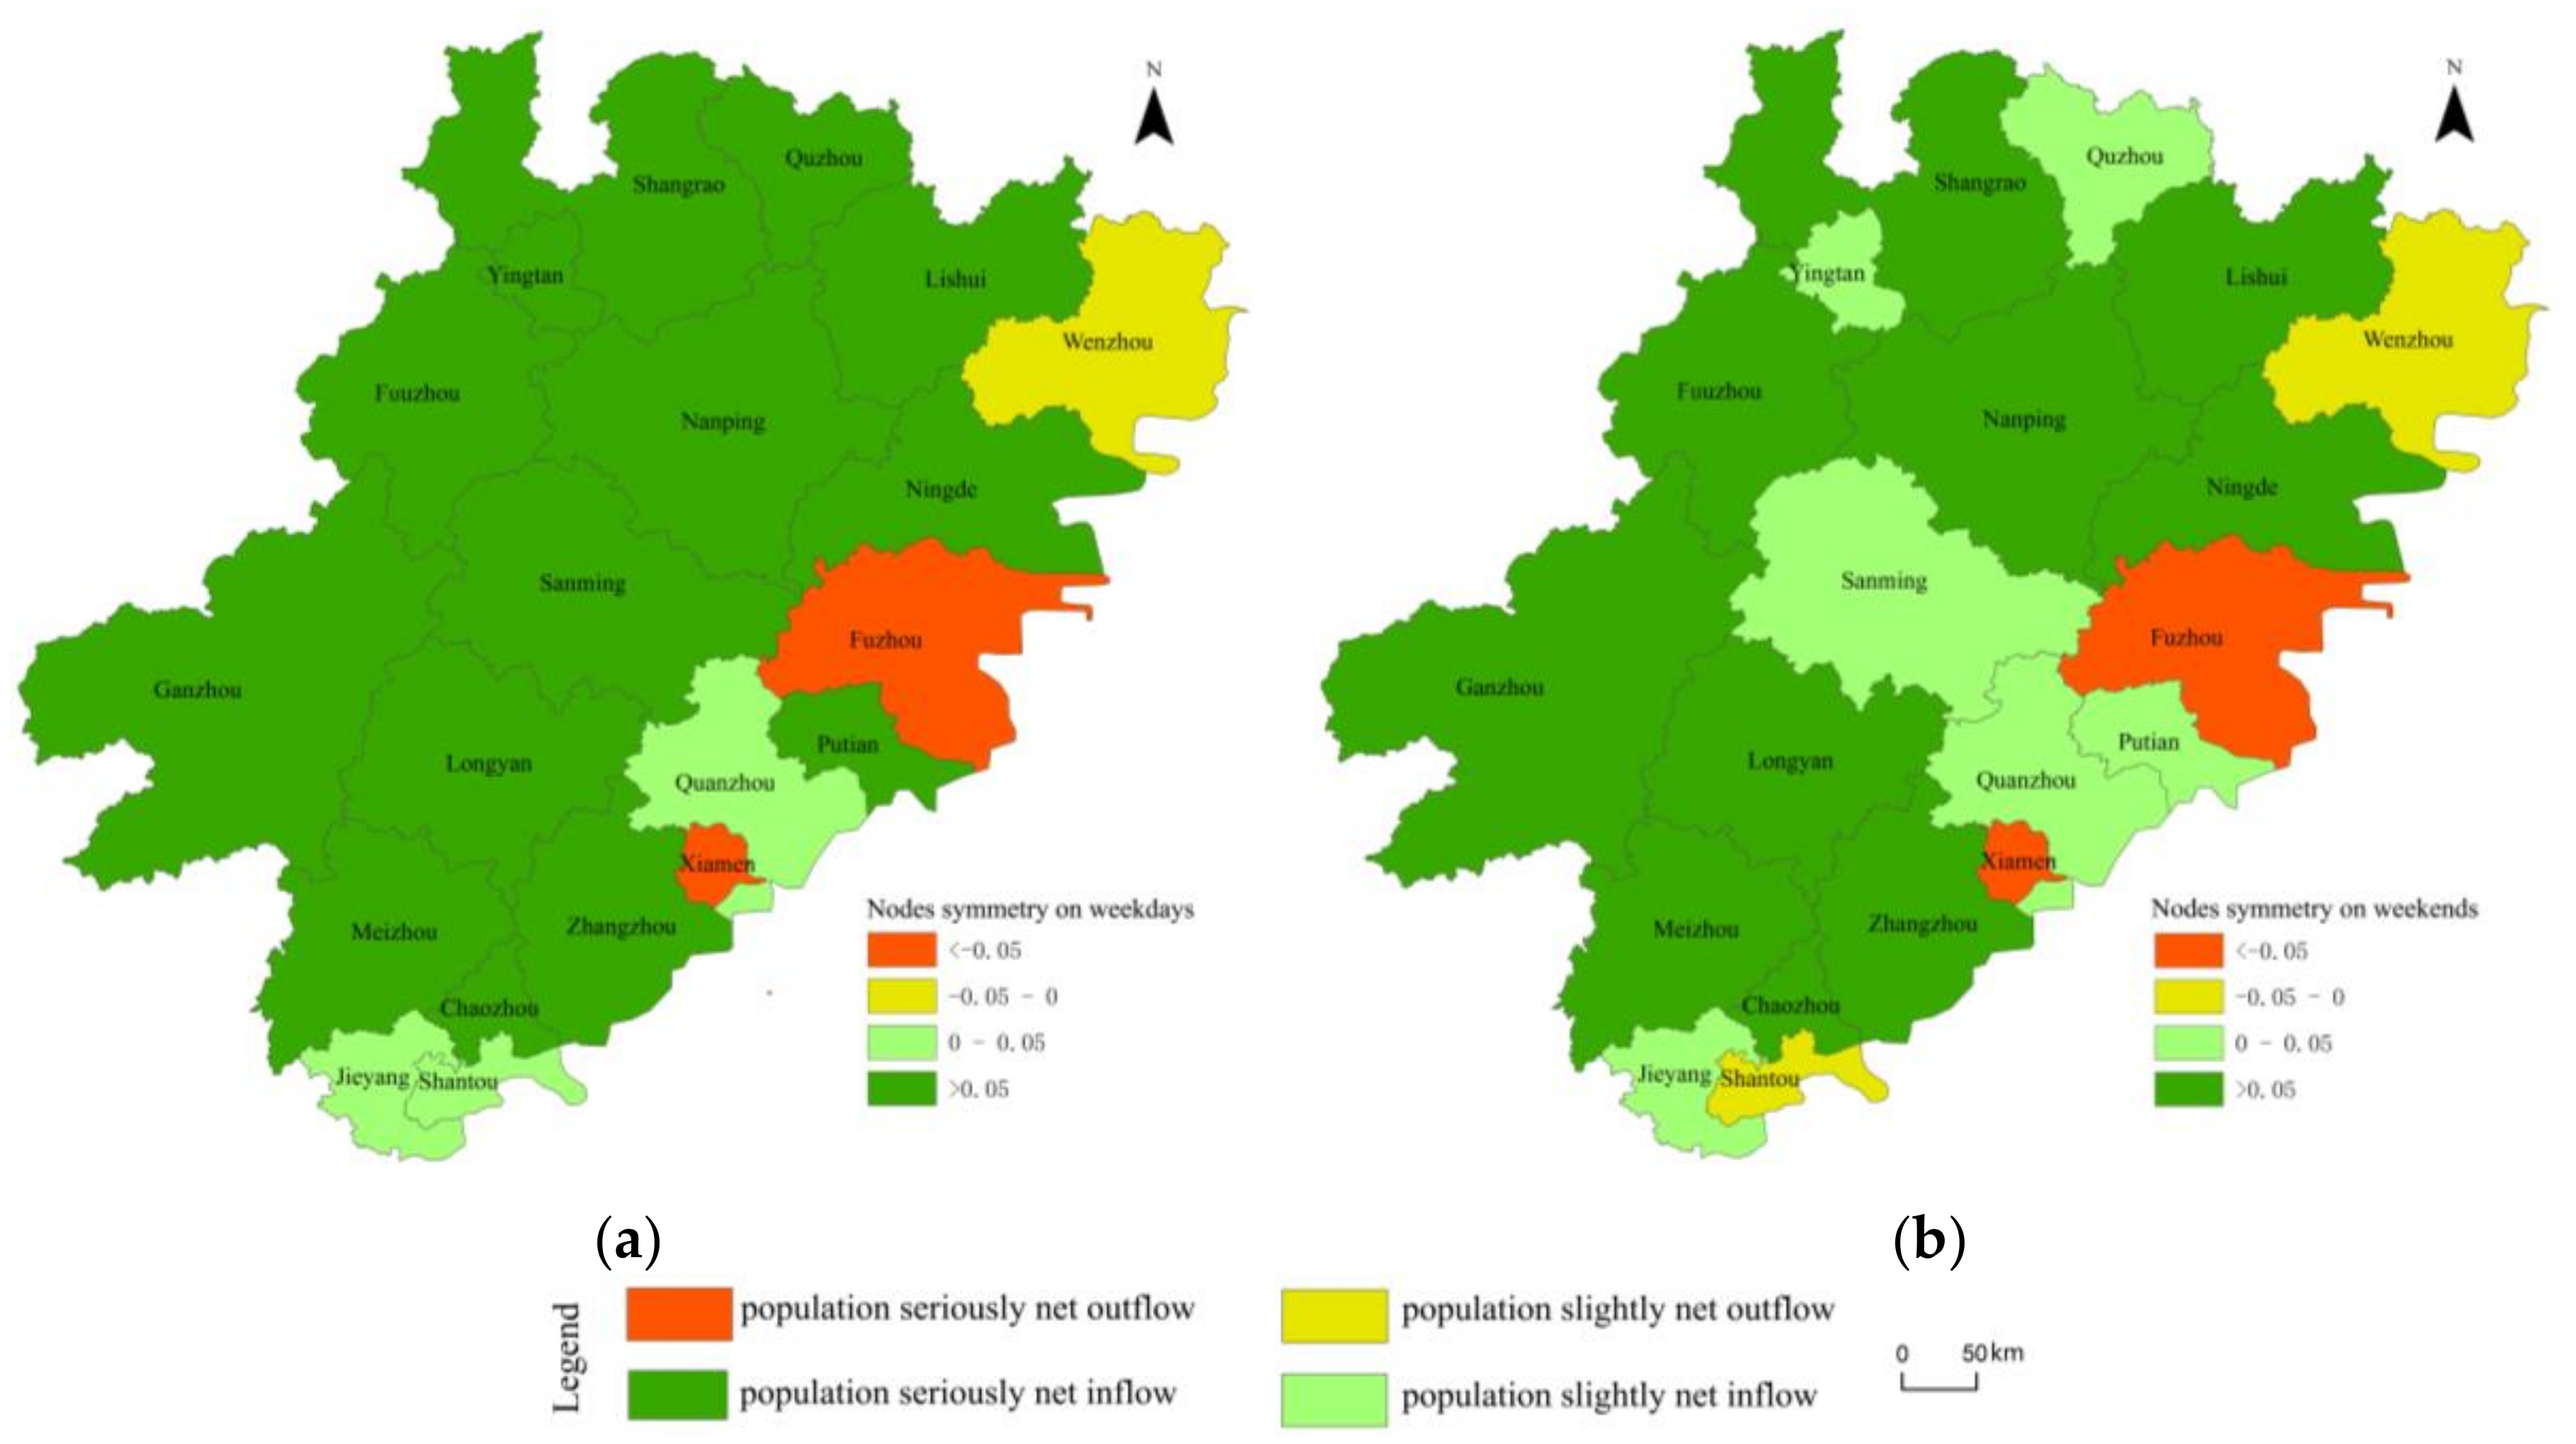
3.4. Analysis of Symmetry
3.4.1. Analysis of Node Symmetry
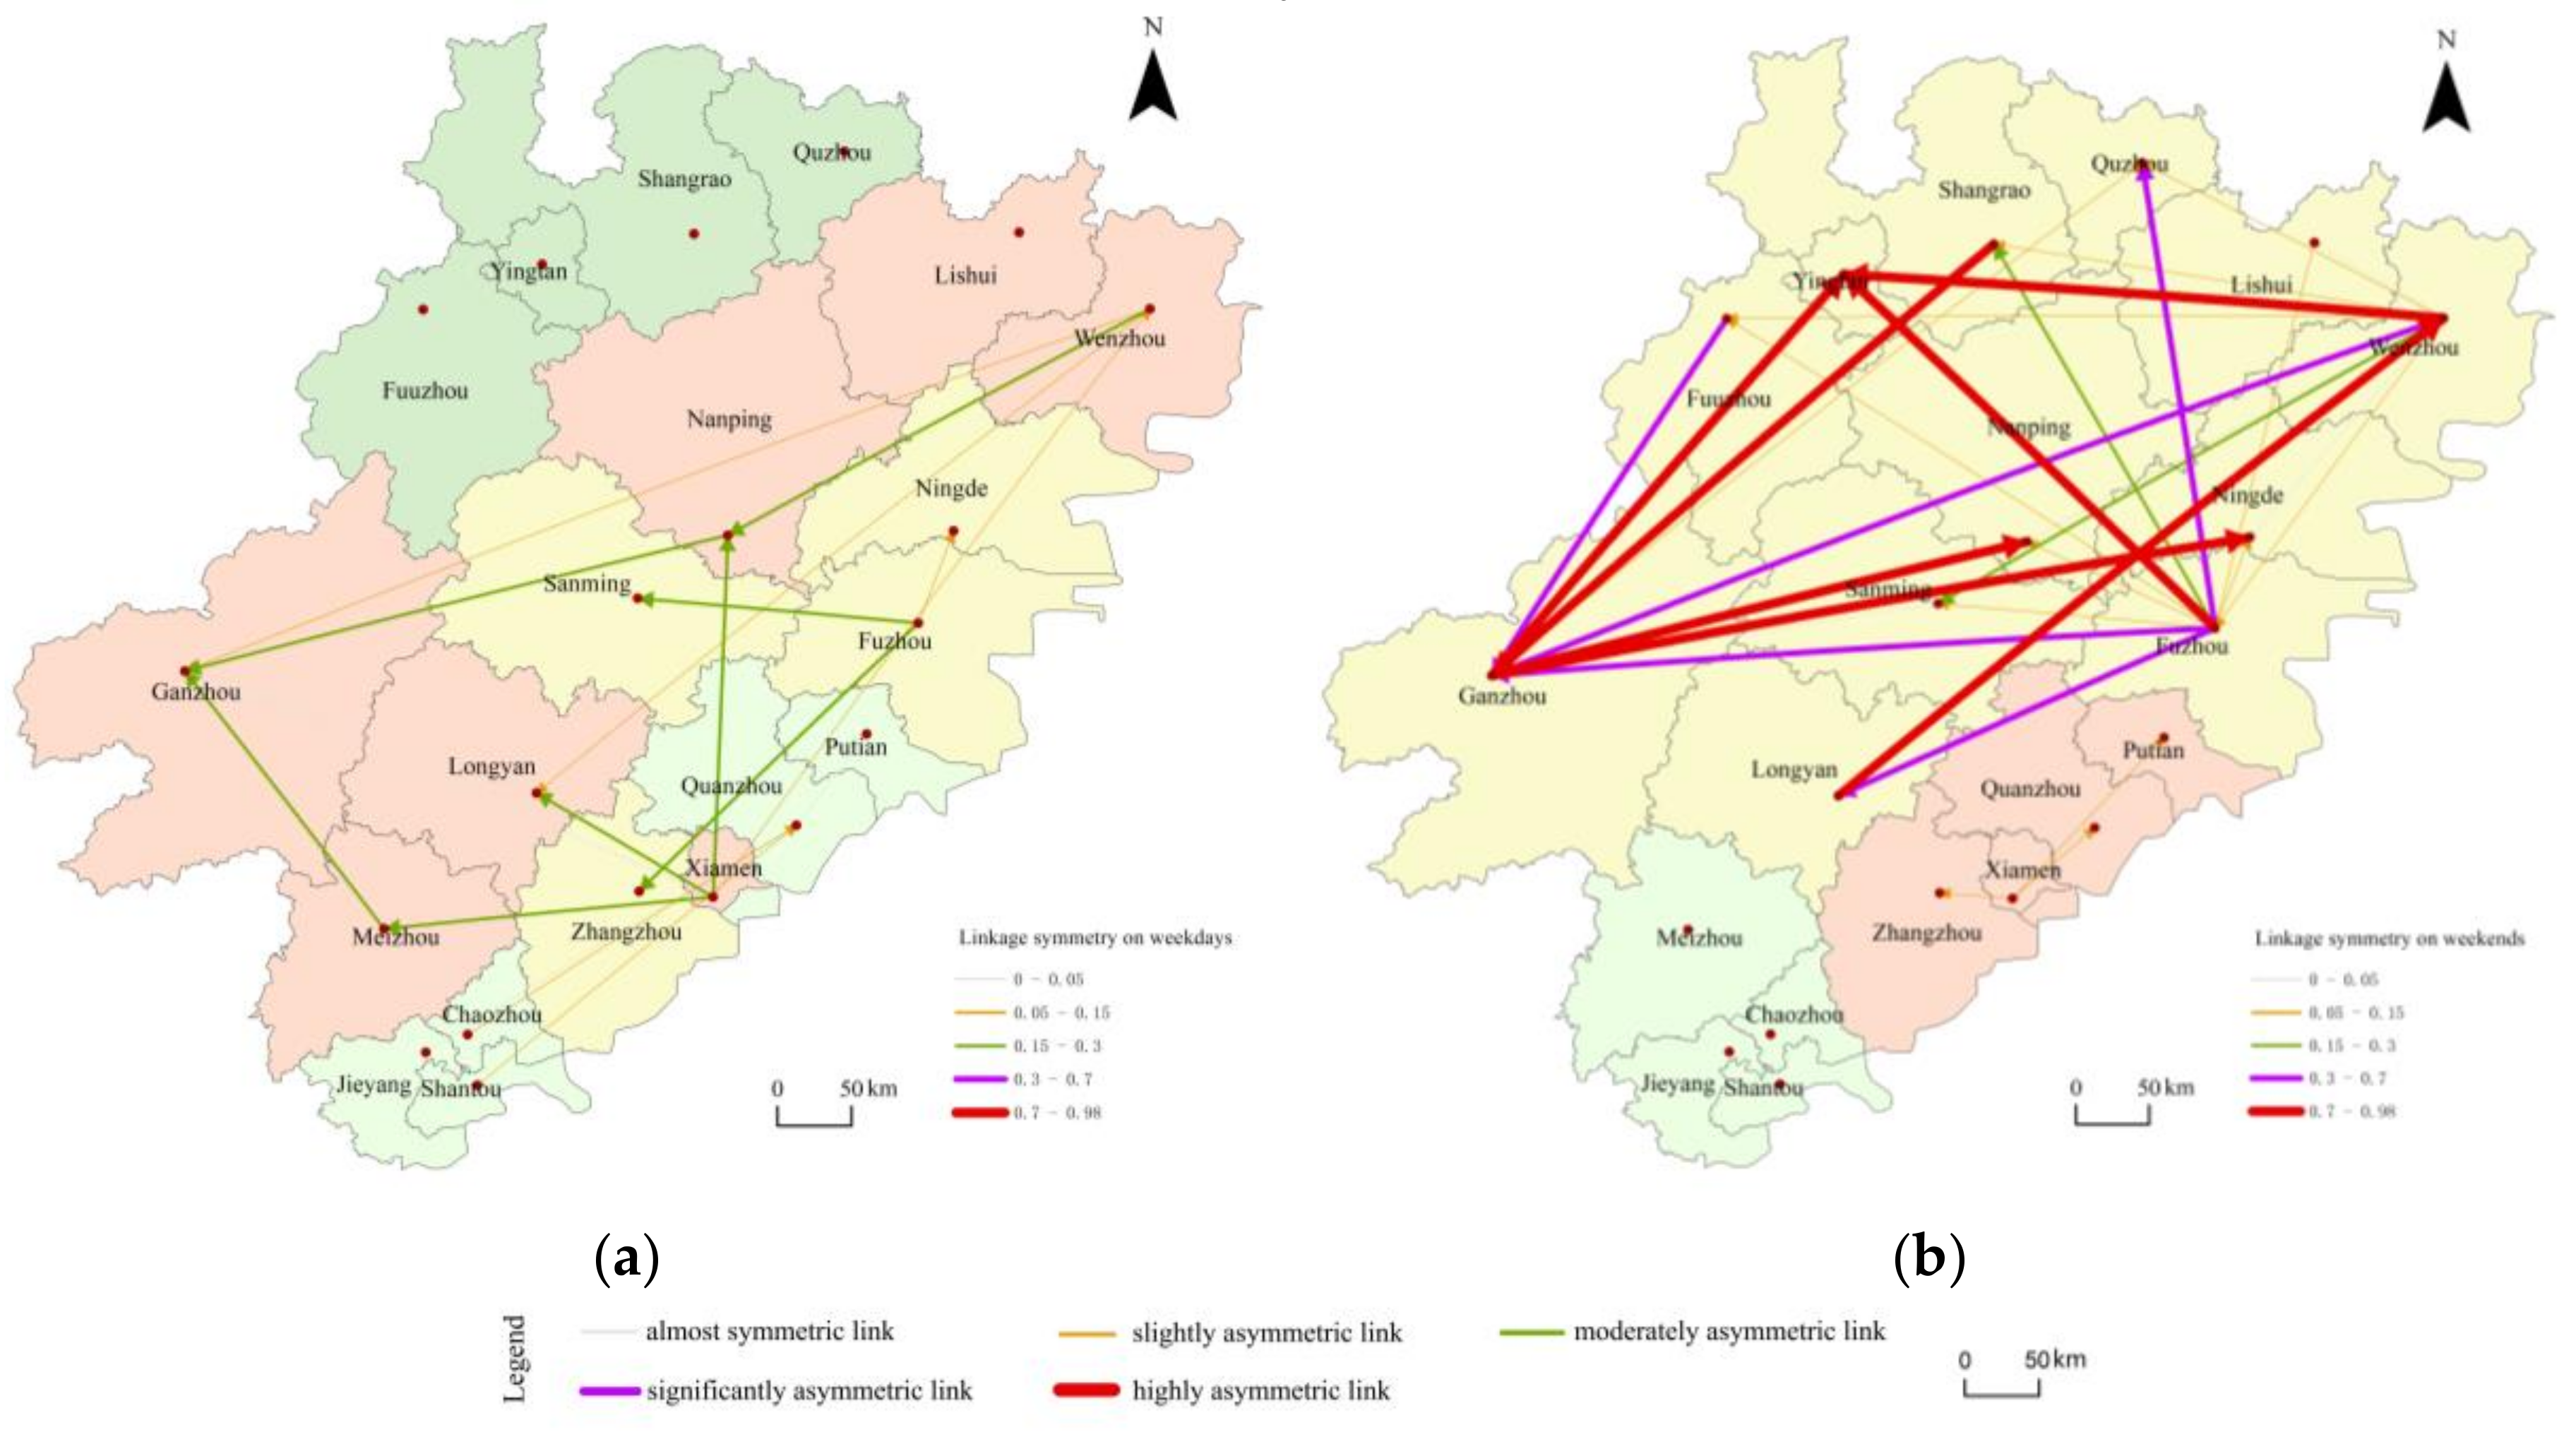
3.4.2. Analysis of Link Symmetry
4. Discussion and Conclusions
4.1. Discussion
4.2. Conclusions
Author Contributions
Acknowledgments
Conflicts of Interest
References
- Hall, P.; Pain, K. The Polycentric Metropolis; Routledge: London, UK, 2006. [Google Scholar]
- Manuel, C. Globalisation, networking, urbanisation: Reflections on the spatial dynamics of the information age. Urban Stud. 2010, 47, 2737–2745. [Google Scholar]
- Hui, E.C.M.; Li, X.; Chen, T.; Lang, W. Deciphering the spatial structure of China’s megacity region: A new bay area—The Guangdong-Hong Kong-Macao greater bay area in the making. Cities 2018. [Google Scholar] [CrossRef]
- Ye, K.; Liu, G.; Shan, Y. Networked or un-networked? A preliminary study on KIBS-based sustainable urban development: The case of China. Sustainability 2016, 8, 509. [Google Scholar] [CrossRef]
- Ye, X.; He, C. The new data landscape for regional and urban analysis. GeoJournal 2016, 81, 811–815. [Google Scholar] [CrossRef]
- Ye, X.; She, B.; Wu, L.; Zhu, X.; Cheng, Y. An open source toolkit for identifying comparative space-time research questions. Chin. Geogr. Sci. 2014, 24, 348–361. [Google Scholar] [CrossRef] [Green Version]
- Liu, X.; Long, Y. Automated identification and characterization of parcels with OpenStreetMap and points of interest. Environ. Plan. B Plan. Des. 2016, 43, 341–360. [Google Scholar] [CrossRef]
- Hansen, W.G. How accessibility shapes land use. J. Am. Plan. Assoc. 1959, 25, 73–76. [Google Scholar] [CrossRef]
- Zhang, F.; Zhu, X.; Guo, W.; Ye, X.; Hu, T.; Huang, L. Analyzing urban human mobility patterns through a thematic model at a finer scale. ISPRS Int. J. Geo-Inf. 2016, 5, 78. [Google Scholar] [CrossRef]
- Harwit, E. Telecommunications and the internet in Shanghai: Political and economic factors shaping the network in a Chinese city. Urban Stud. 2005, 42, 1837–1858. [Google Scholar] [CrossRef]
- Gebauer, A.; Nam, C.W.; Parsche, R. Regional technology policy and factors shaping local innovation networks in small German cities. Eur. Plan. Stud. 2005, 13, 661–683. [Google Scholar] [CrossRef]
- Camagni, R.; Capello, R. The City Network Paradigm: Theory and Empirical Evidence; Emerald Group Publishing Limited: Bingley, UK, 2004; pp. 495–529. [Google Scholar]
- Zhan, C.; Derudder, B.; Peng, Z. Comparing the physical, functional and knowledge integration of the Yangtze River Delta city-region through the lens of inter-city networks. Cities 2018, 82, 119–126. [Google Scholar]
- Van Oort, F.; Burger, M.; Raspe, O. On the economic foundation of the urban network paradigm: Spatial integration, functional integration and economic complementarities within the Dutch Randstad. Urban Stud. 2010, 47, 725–748. [Google Scholar] [CrossRef]
- Jiao, J.; Wang, J.; Jin, F.; Wang, H. Impact of high-speed rail on inter-city network based on the passenger train network in China, 2003–2013. Acta Geogr. Sin. 2016, 71, 265–280. (In Chinese) [Google Scholar]
- Liu, Z.; Ding, Z.; Bu, S.; Wang, F. The network structure analysis of zhongyuan urban agglomeration based on interactive and traffic flow relationship. Hum. Geogr. 2015, 30, 79–86. (In Chinese) [Google Scholar]
- Meng, D.; Feng, X.; Wen, Y. Urban network structure evolution and organizational pattern in Northeast China from the perspective of railway passenger transport. Geogr. Res. 2017, 36, 1339–1352. (In Chinese) [Google Scholar]
- Zhuang, D.; Yang, Y.; Jin, S.; Han, R. Evolution of the Yangtze River Delta’s city network based on the strategic emerging industries. Sci. Geogr. Sin. 2017, 37, 546–553. (In Chinese) [Google Scholar]
- Ye, Q.; Zhang, L.X.; Peng, P.; Huang, J.L. The network characteristics of urban agglomerations in the middle reaches of the yangtze river based on baidu migration data. Econ. Geogr. 2017, 37, 53–59. (In Chinese) [Google Scholar]
- Chen, L.; Wang, S.; Yang, R. The urban network structure of Ha-Chang urban agglomerations based on the traffic and information flow. Econ. Geogr. 2017, 37, 74–80. (In Chinese) [Google Scholar]
- Lu, S.; Huang, Y.; Zhao, Z.; Yang, X. Exploring the hierarchical structure of china’s railway network from 2008 to 2017. Sustainability 2018, 10, 3173. [Google Scholar] [CrossRef]
- Wang, J.; Jing, Y. Comparison of spatial structure and organization mode of inter-city networks from the perspective of railway and air passenger flow. Acta Geogr. Sin. 2017, 72, 1508–1519. (In Chinese) [Google Scholar]
- Blondel, V.D.; Guillaume, J.L.; Lambiotte, R.; Lefebvre, E. Fast unfolding of communities in large networks. J. Stat. Mech. Theory Exp. 2008, 2008, P10008. [Google Scholar] [CrossRef] [Green Version]
- Newman, M.E.J. Fast algorithm for detecting community structure in networks. Phys. Rev. E 2004, 69, 066133. [Google Scholar] [CrossRef] [Green Version]
- Narisra, L.; Martin, D.; Tim, S. A theoretical framework and methodology for characterizing national urban systems on the basis of flows of people: Empirical evidence for France and Germany. Urban Stud. 2007, 44, 2123–2145. [Google Scholar]
- Wang, J.C. Innovation Spaces: Enterprise Clusters and Regional Development, 1st ed.; Peking University Press: Beijing, China, 2001; pp. 327–330. (In Chinese) [Google Scholar]
- Lee, D.S. Towards urban resilience through inter-city networks of co-invention: A case study of US cities. Sustainability 2018, 10, 289. [Google Scholar] [CrossRef]
- Chen, W. Research on the Allocation of Innovation Elements in Metropolitan Regional Innovation System. Ph.D. Thesis, Shanghai Jiaotong University, Shanghai, China, 2009. (In Chinese). [Google Scholar]
- Lü, L.; Xie, Y.; Huang, R. The comparison of innovation ability hierarchy of three megalopolises in China. Hum. Geogr. 2013, 28, 91–95. (In Chinese) [Google Scholar]
- Lü, L.; Li, Y. A Research on Chinese renovation urban system based on urban renovation function. Acta Geogr. Sin. 2010, 65, 177–190. (In Chinese) [Google Scholar]
- Li, W.; Jiang, Y. Research of regional city internal and external function relations based on urban flows elements—A case study of taizhou. Econ. Geogr. 2012, 32, 59–65. (In Chinese) [Google Scholar]
- De, H.H. Migration and development: A theoretical perspective 1. Int. Migr. Rev. 2010, 44, 227–264. (In Chinese) [Google Scholar]
- Sun, Y.; Yao, S.; Zhang, L. Spatial expansion of urban network for the three coastal agglomerations of china: A study based on integrated traffic information network. Sci. Geogr. Sin. 2018, 38, 827–837. (In Chinese) [Google Scholar]
- Li, W.; Jiang, J.; Lou, Y. Research on the structural characteristics in Mid-Zhejiang urban agglomeration based on the relationship analysis. Econ. Geogr. 2009, 29, 1644–1649. (In Chinese) [Google Scholar]
- Lu, Z.; Zhang, Q.; Xing, C.; Fan, H.; Deng, L. A centricity study of the interpersonal node space relationship in sns community based on the graph theory—Taken sina micro-blog as an example. Econ. Geogr. 2013, 33, 77–83. (In Chinese) [Google Scholar]
- Gao, G.; Luo, Q.; Fan, X.; Li, E.; Li, X. China’s rural population inter-provincial flow: Based on the sixth nationwide population census data. Sci. Geogr. Sin. 2015, 35, 1511–1517. (In Chinese) [Google Scholar]
- Liu, Z.; Wang, S.; Zhao, M.; Wu, K. Exploratory analysis of directed weighted network of city. Geogr. Res. 2013, 32, 1253–1268. (In Chinese) [Google Scholar]
- Zhong, F. Community Detecting Algorithm for Complex Networks. Master’s Thesis, Xidian University of Electronic Technology, Xi’an, China, 2012. (In Chinese). [Google Scholar]
- Wang, Q.; Zeng, G.; Lu, G. Structural evolution of innovation networks of China’s equipment manufacturing industry. Acta Geogr. Sin. 2016, 71, 251–264. (In Chinese) [Google Scholar]
- Ter Wal, A.L.J. The dynamics of the inventor network in German biotechnology: Geographic proximity versus triadic closure. J. Econ. Geogr. 2013, 14, 589–620. [Google Scholar] [CrossRef]
- Li, D.; Wang, T.; Wei, Y.; Yuan, F. Spatial and temporal complexity of scientific knowledge network and technological knowledge network on China’s urban scale. Geogr. Res. 2015, 34, 525–540. (In Chinese) [Google Scholar]
- Cassi, L.; Plunket, A. Research collaboration in co-inventor networks: Combining closure, bridging and proximities. Reg. Stud. 2015, 49, 936–954. [Google Scholar] [CrossRef]
- Xu, Z. A Study on the Linkage Development of Regional Economics—Taking Economic Zone on the Western Coast of the Taiwan Straits as an Example. Ph.D. Thesis, Fujian Normal University, Fuzhou, China, April 2010. (In Chinese). [Google Scholar]
- Ning, B. Strategy Research on High-Speed Rail Economy Development in Jiangxi. Master’s Thesis, Jiangxi University of Finance and Economics, Jiangxi, China, December 2017. (In Chinese). [Google Scholar]
- Liu, W. Study on Coordinated Development of Reginal Economy in the Economy Zone of the West Coast of Taiwan Straits. Master’s Thesis, Fujian Normal University, Fuzhou, China, June 2011. (In Chinese). [Google Scholar]
- Mi, H.; Cao, H.; Pang, L. Location analysis and city competition ability of economic zone on the West Side of the Straits. Econ. Geogr. 2008, 28, 372–375. (In Chinese) [Google Scholar]


| Date | Average | Standard Deviation | Median | Maximum | Minimum |
|---|---|---|---|---|---|
| April 3 | 2308.09 | 6580.537 | 309 | 64,837 | 2 |
| April 26 | 1042.958 | 2782.742 | 191.5 | 20,889 | 1 |
| April 27 | 1062.071 | 2883.85 | 165 | 21,920 | 1 |
| April 28 | 894.388 | 2430.667 | 170 | 18,116 | 1 |
| April 29 | 1933.426 | 5515.523 | 232.5 | 52,075 | 1 |
| May 8 | 1265.929 | 3707.691 | 172 | 33,272 | 1 |
| May 9 | 986.3842 | 2799.771 | 156.5 | 21,618 | 1 |
| May 10 | 1234.703 | 3160.43 | 231.5 | 24,518 | 1 |
| May 11 | 925.278 | 2510.338 | 161.5 | 19,035 | 1 |
| May 14 | 1135.575 | 3451.58 | 167 | 31,577 | 1 |
| May 15 | 1349.989 | 4163.396 | 162 | 42,022 | 1 |
| May 21 | 1080.435 | 3200.805 | 157 | 29,377 | 1 |
| May 22 | 1233.206 | 3735.8 | 159 | 36,570 | 1 |
| May 28 | 1193.293 | 3545.245 | 183 | 32,650 | 2 |
| Cities | Functional Network (on Weekdays) | Cities | Functional Network (on Weekends) | Cities | Innovation Network |
|---|---|---|---|---|---|
| Fuzhou | 17 | Ganzhou | 17 | Fuzhou | 9 |
| Xiamen | 17 | Fuzhou | 16 | Xiamen | 7 |
| Ganzhou | 15 | Quanzhou | 16 | Nanping | 6 |
| Wenzhou | 14 | Xiamen | 16 | Meizhou | 4 |
| Zhangzhou | 14 | Nanping | 15 | Wenzhou | 4 |
| Nanping | 14 | Longyan | 15 | Lishui | 3 |
| Quanzhou | 13 | Zhangzhou | 15 | Quanzhou | 3 |
| Putian | 12 | Wenzhou | 13 | Sanming | 3 |
| Fuuzhou | 11 | Putian | 12 | Zhangzhou | 3 |
| Sanming | 11 | Sanming | 12 | Chaozhou | 2 |
| Shantou | 11 | Yingtan | 12 | Fuuzhou | 1 |
| Shangrao | 11 | Fuuzhou | 11 | Putian | 1 |
| Longyan | 9 | Ningde | 11 | Shantou | 1 |
| Ningde | 9 | Shangrao | 11 | Ganzhou | 0 |
| Chaozhou | 8 | Chaozhou | 9 | Jieyang | 0 |
| Jieyang | 8 | Jieyang | 9 | Longyan | 0 |
| Meizhou | 8 | Shantou | 9 | Ningde | 0 |
| Quzhou | 8 | Quzhou | 8 | Quzhou | 0 |
| Yingtan | 7 | Meizhou | 7 | Shangrao | 0 |
| Lishui | 5 | Lishui | 6 | Yingtan | 0 |
| Weekday | Weekend | ||||||
|---|---|---|---|---|---|---|---|
| Cities | Out-Degree Centrality (c) | Cities | In-Degree Centrality (a) | Cities | Out-Degree Centrality (d) | Cities | In-Degree Centrality (b) |
| Xiamen | 47 | Xiamen | 41 | Wenzhou | 34 | Xiamen | 36 |
| Fuzhou | 43 | Ganzhou | 38 | Xiamen | 33 | Ganzhou | 32 |
| Wenzhou | 41 | Fuzhou | 36 | Fuzhou | 30 | Shangrao | 30 |
| Quanzhou | 37 | Shangrao | 34 | Ganzhou | 30 | Fuzhou | 28 |
| Shangrao | 37 | Wenzhou | 34 | Shangrao | 29 | Quanzhou | 28 |
| Ganzhou | 35 | Quanzhou | 31 | Quanzhou | 27 | Wenzhou | 28 |
| Fuuzhou | 21 | Fuuzhou | 25 | Fuuzhou | 20 | Fuuzhou | 21 |
| Quzhou | 20 | Yingtan | 22 | Quzhou | 17 | Quzhou | 17 |
| Zhangzhou | 18 | Quzhou | 20 | Meizhou | 15 | Shantou | 17 |
| Nanping | 17 | Zhangzhou | 19 | Nanping | 15 | Zhangzhou | 17 |
| Shantou | 17 | Shantou | 18 | Shantou | 15 | Jieyang | 15 |
| Jieyang | 16 | Jieyang | 17 | Zhangzhou | 14 | Meizhou | 14 |
| Yingtan | 16 | Nanping | 17 | Jieyang | 14 | Nanping | 14 |
| Chaozhou | 13 | Meizhou | 15 | Chaozhou | 13 | Chaozhou | 12 |
| Meizhou | 13 | Chaozhou | 14 | Yingtan | 12 | Lishui | 12 |
| Putian | 13 | Ningde | 14 | Ningde | 11 | Ningde | 11 |
| Lishui | 12 | Putian | 14 | Sanming | 11 | Putian | 11 |
| Ningde | 12 | Sanming | 13 | Lishui | 10 | Yingtan | 11 |
| Sanming | 11 | Lishui | 12 | Putian | 10 | Longyan | 10 |
| Longyan | 10 | Longyan | 12 | Longyan | 8 | Sanming | 10 |
| Cities | Weekday | Cities | Weekend |
|---|---|---|---|
| Meizhou | 0.195 | Zhangzhou | 0.108 |
| Longyan | 0.156 | Longyan | 0.075 |
| Ganzhou | 0.151 | Ganzhou | 0.068 |
| Quzhou | 0.114 | Nanping | 0.067 |
| Fuuzhou | 0.100 | Ningde | 0.063 |
| Sanming | 0.098 | Meizhou | 0.056 |
| Shangrao | 0.093 | Shangrao | 0.054 |
| Ningde | 0.079 | Chaozhou | 0.052 |
| Chaozhou | 0.077 | Lishui | 0.052 |
| Putian | 0.066 | Fuuzhou | 0.051 |
| Zhangzhou | 0.066 | Quanzhou | 0.049 |
| Yingtan | 0.065 | Putian | 0.042 |
| Lishui | 0.058 | Quzhou | 0.040 |
| Nanping | 0.057 | Sanming | 0.029 |
| Shantou | 0.032 | Jieyang | 0.025 |
| Quanzhou | 0.022 | Yingtan | 0.017 |
| Jieyang | 0.019 | Shantou | −0.023 |
| Wenzhou | −0.014 | Wenzhou | −0.027 |
| Xiamen | −0.051 | Fuzhou | −0.075 |
| Fuzhou | −0.115 | Xiamen | −0.090 |
© 2019 by the authors. Licensee MDPI, Basel, Switzerland. This article is an open access article distributed under the terms and conditions of the Creative Commons Attribution (CC BY) license (http://creativecommons.org/licenses/by/4.0/).
Share and Cite
Ma, Y.; Xue, F. Deciphering the Spatial Structures of City Networks in the Economic Zone of the West Side of the Taiwan Strait through the Lens of Functional and Innovation Networks. Sustainability 2019, 11, 2975. https://0-doi-org.brum.beds.ac.uk/10.3390/su11102975
Ma Y, Xue F. Deciphering the Spatial Structures of City Networks in the Economic Zone of the West Side of the Taiwan Strait through the Lens of Functional and Innovation Networks. Sustainability. 2019; 11(10):2975. https://0-doi-org.brum.beds.ac.uk/10.3390/su11102975
Chicago/Turabian StyleMa, Yan, and Feng Xue. 2019. "Deciphering the Spatial Structures of City Networks in the Economic Zone of the West Side of the Taiwan Strait through the Lens of Functional and Innovation Networks" Sustainability 11, no. 10: 2975. https://0-doi-org.brum.beds.ac.uk/10.3390/su11102975