1. Introduction
Due to limited opportunities, a large portion of the rural population derives their income from the forest, and it serves as an anti-catalyst agent in rural livelihoods [
1,
2,
3]. Researchers cumulatively agree that forest-related resources provide substantial support to rural households in improving their livelihood [
4,
5,
6,
7,
8]. Studies indicate that forest-based rural living is correlated with lower poverty, higher incomes, and higher forest-goods consumption [
9,
10,
11,
12]. Evidently, small-to-medium-sized forest enterprises (SMFEs) serve as an engine boosting the rural economy through the proper utilization of forest resources and the generation of employment opportunities for the rural population. SMFEs refer to small-to-medium enterprises (SMEs) located within the forest sector [
13,
14]. SMFEs are not multinational companies, international corporations, publicly owned, or large facilities of any kind; they are actually forest-based enterprises that employ a limited number of people. These are considered as family-operated businesses that employ members of the family and relatives [
15] and are usually financed by family members and in some cases friends [
16]. Tieguhong et al. [
17] suggest that SMFEs are businesses that engage less than 60 individuals with an annual turnover between USD
$500–30,000. They are often managed in a variety of ways, for instance, private sole proprietors, partnerships, and community-owned enterprises [
16]. SMFEs share an engagement in forest-based activities as their primary sources of income, but these activities are almost limitless, ranging from the provision of ecosystem services and the production of timber and non-timber forest products (NTFPs), to the processing of an assortment of commodities and value-added wood products. According to the World Bank Group [
18], more than 90% of the worldwide poor population depends upon SMFEs for their livelihood [
18,
19,
20]. These enterprises are vital because they are inextricably associated with forest-dependent communities they operate in; their possible contributions go beyond wealth generation, to multiple dimensions of rural development.
SMFEs can contribute to employment opportunities and can also generate income activities in developing countries. According to Badini et al. [
21], SMFEs can account for 80–90% of forest-related enterprises in developing countries, with more than 50% of the employment related to forestry in tropical countries [
16], and at least 30 million worldwide are directly attributed to SMFEs [
14]. The Food and Agriculture Organization (FAO) has also worked to unleash the hidden benefits of SMFEs on livelihood outcomes. For instance, the FAO [
15] has provided a theoretical guide to policymakers on devising a comprehensive policy to promote SMFEs. Other studies by the FAO [
22,
23,
24,
25,
26] focus on different aspects of SMFEs to develop rural livelihood.
SMFEs can offer a significant role in the development of rural communities in Pakistan. SMFEs can substantially improve this ratio to comparable levels by producing goods at a minimum cost that are internationally acceptable and result in foreign exchange earnings. On a macro level, the natural resources have shown to enrich the livelihood of the rural population. Studies indicate that about 80% of the small forest firms in developing countries are SMEs and constitute about 60% of rural employment. The GDP ratio of Pakistan is considerably low compared to the neighboring countries. In forest-based regions, SMFEs of both the developed as well as developing countries provide sufficient opportunities for employment [
14,
15]. Moreover, the literature also highlights the historical, legal, and institutional matters of forest enterprises. For example, Lambini and Nguyen [
27] have studied the role of institutional property rights on forest conditions and have found key connections between secure property rights and sustainable livelihood frameworks. Additionally, Daur et al. [
28] explain the historical developments in forest governance in Sudan and suggest a supportive forest governance framework that alleviates vulnerabilities for rural populations that are dependent on forest resources.
The existing literature provides a comprehensive summary of different studies on the contribution of SMFEs in multiple contexts [
16,
21,
29,
30,
31]. However, we have not come across any study that takes into account the impact of SMFEs on the enhancement of the livelihood of rural communities, in Pakistan or any other country. The Khyber-Pakhtunkhwa (KPK) government launched a large-scale afforestation project called the Billion Trees Tsunami Afforestation Project (BTTAP). The objective of the project was to counter global warming by increasing the forest cover of the province by 2% by 2020 [
32]. With the launch of this project, a considerable increase in the number of small-scale nursery firms (i.e., SMFEs) has been witnessed, which is one of the significant forms of SMFEs. We believe that these nursery firms have significantly improved livelihood by generating wealth and providing employment opportunities. Moreover, the forest is an important source of several types of SMFEs that includes, carpentry firms, fuel woods, non-timber forest products (i.e., beeswax, honey, edible fruits, traditional medicines, mushrooms, etc.), ecotourism and so on, are expected to have contributed to the livelihood of understudy population. Based on these arguments, the current study empirically examines the impact of SMFEs on the livelihood of rural communities.
This paper is organized as follows:
Section 2 explains the conceptual framework.
Section 3 describes the materials and methods of the study.
Section 4 discusses the study results discussion and limitations and provides recommendations for future research.
Section 5 presents the main conclusions.
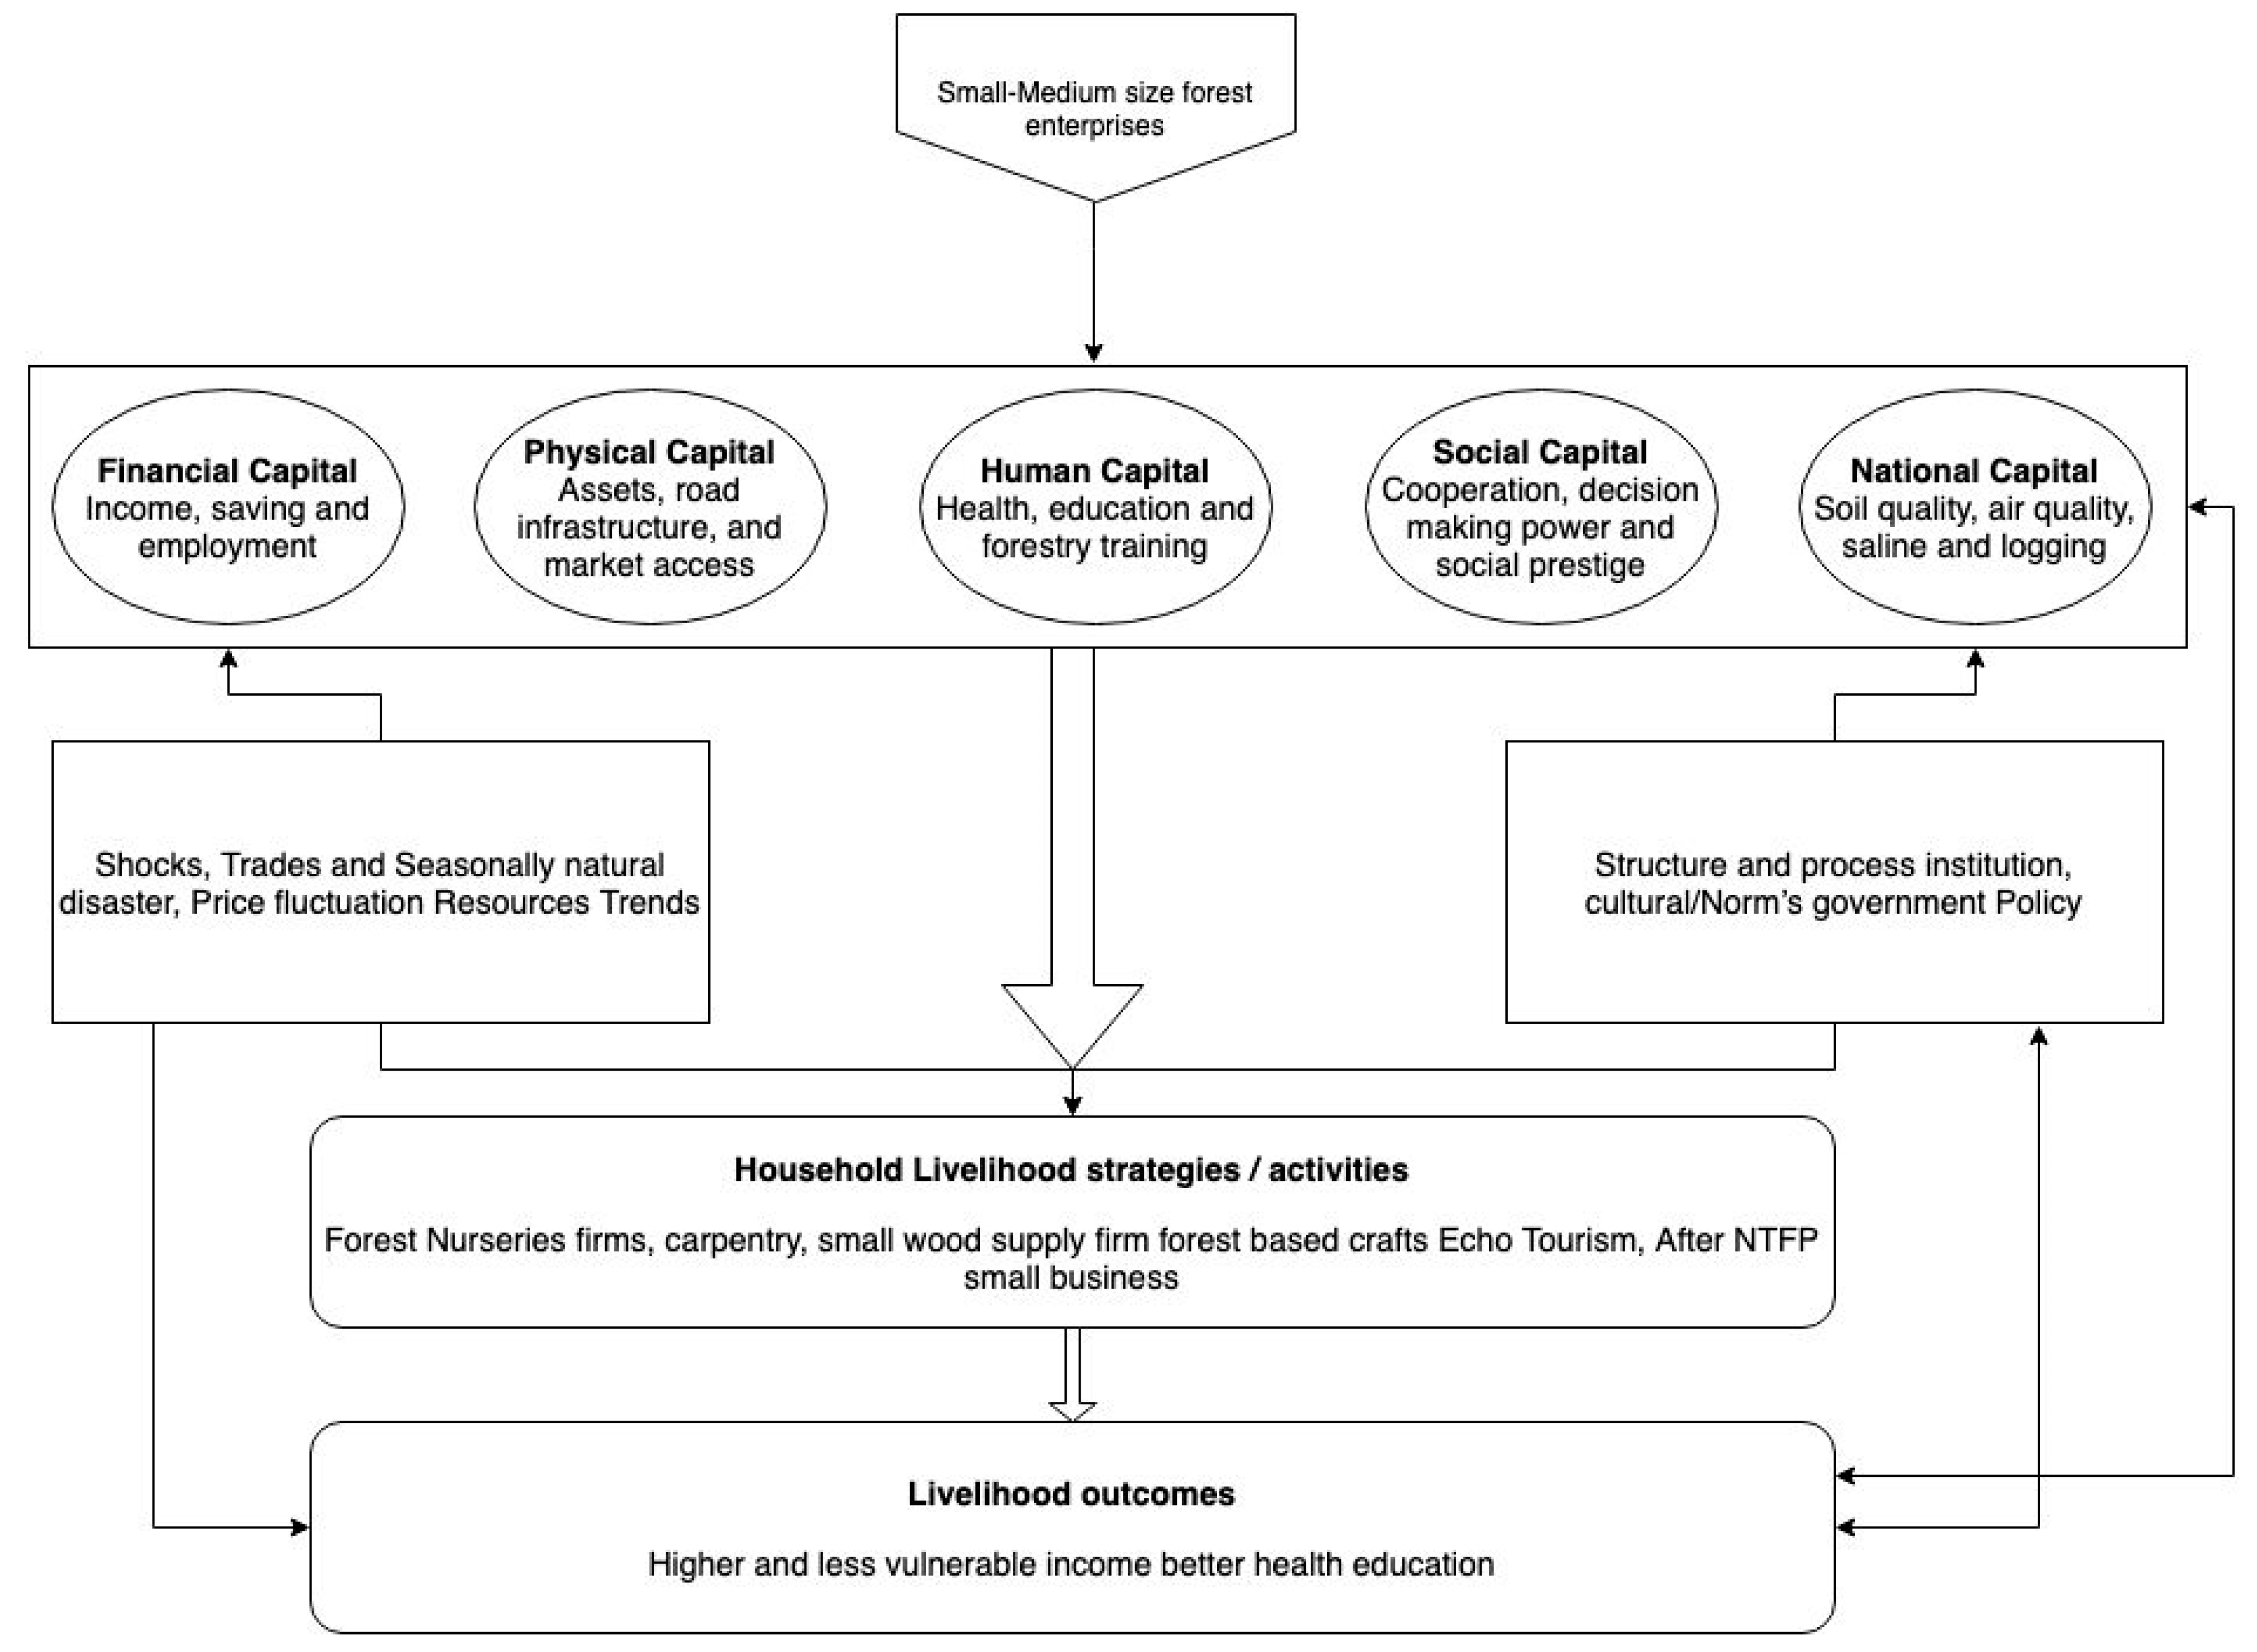
2. Conceptual Framework
The sustainable livelihood framework (SLF) is a conceptual framework with a holistic and interdisciplinary perspective that covers the multi-dimensional nature of livelihood and the wide range of socioeconomic and contextual factors that contribute to it. In the context of the SLF, the multi-dimensional nature of ‘livelihood’ refers to the livelihood asset, strategies/activities, and contextual factors that combine to determine a household. According to the theory, within the context of a range of vulnerabilities and prevailing polices, institutions, and processes, a household chooses certain livelihood strategies based on the assets that have been available, which results in certain livelihood outcomes that then feed back into the assets [
33,
34,
35,
36].
Figure 1 presents a conceptual model of the SLF and offers a concise description of the livelihood assets, strategies, outcomes, and context.
Recently, the SLF has received considerable attention among researchers. According to the SLF, an individual’s access to capital assets, their ability to create a livelihood through a combination of different capital assets, and the power to expand their asset base following the interaction with other actors and SMFEs [
34,
35,
36,
37,
38,
39,
40,
41] constitutes an individual’s livelihood. Capital assets that are required for a sustainable livelihood are financial, physical, natural, social, and human and encompass all ingredients that are necessary for a sustainable rural livelihood [
42,
43,
44,
45]. The current investigation uses this five-asset framework for gauging the impact of SMFEs on the livelihood of a rural community. Various studies have thus examined whether or not forest resources promote the rural livelihood [
46].
Financial capital describes the set of monetary resources that are required by an individual to meet livelihood objectives. These may include income, savings, employment, etc. [
43,
44,
47,
48].
Physical capital includes basic infrastructures and goods essential for supporting and promoting rural livelihood. These may involve infrastructure, transport, market access, etc. [
33,
42,
49,
50,
51].
Human capital refers to the knowledge, education, skills training, and the ability to work in good health that enables persons to pursue livelihood strategies [
45,
52,
53].
Social capital represents the features of a social organization that serve to coordinate actions. These are social resources individuals draw on in pursuit of livelihood objectives and include decision-making power, cooperation, and social prestige [
54,
55,
56,
57].
Natural capital encompasses the natural resource stocks that are necessary inputs for the poor and from which livelihood is usually derived. It ranges from tangibles to intangible goods, such as soil quality, air quality, and saline and lodging for a healthy atmosphere [
43,
44,
52].
To maintain well-being and adaptive capacity, a family is expected to require these five capitals in a balanced amount [
58]. The generation of livelihood capital assets may increase the capacity of families to respond to shocks. The SLF brings into view the variety of assets that individuals use when improving their livelihoods [
39] and looks to understand the varying arrangements of activities of livelihood in a changing and historical background [
59].
The SLF provides an innovative method for organizing indicators of SMFEs. As Campbell and Sayer [
43] state, “The capital assets method to assess livelihoods is probably a suitable organizing principle for the indicators’ selection to examine the impact of SMFEs on rural community livelihood.” It ensures that quite a few indicators are considered, including social, material, and natural components that are likely to assist in examining the effect of SMFEs.
Finally, SMFEs are key to sustainable rural livelihood [
41]. Based on previous work, we were able to address this critique by including local, subjective ideas of livelihood in indicators. To examine the effect of the impact of SMFEs on rural community livelihood, the indicators were turned into quantitative questions to ask research participants. Replies were then aggregated for every household for the five livelihood capitals and overall for each SMFE household. This process is illustrated in
Figure 1 and explained in more detail in the data analysis section. The methods used in this paper focus on evaluating the influence of SMFEs on the rural community livelihood. Using the five capital assets of livelihood enabled us to compare and contrast the livelihood capitals between households and examine the effect of SMFEs on rural livelihood. We used a sustainable livelihoods method to evaluate the effect of SMFEs on rural community livelihood because it has not been extensively used [
40,
41,
43,
44].
3. Materials and Methods
This section outlines the study site, the sampling and data collection techniques, and the empirical strategy used to identify the causal impact of SMFEs on rural livelihoods in KPK, Pakistan.
3.1. Study Site
The study was conducted in the northwest province of Pakistan known as KPK. This province is purposefully selected for the study because 40% of forest cover in Pakistan is present in KPK. Recently, the KPK government successfully completed the mega project known as BTTAP. KPK shares a border with Afghanistan on the northwest, the Punjab province on the southeast, and Gilgit Baltistan and Azad Kashmir on the northeast. The total area of the KPK province is 74,521 square kilometers and has a population of more than 22 million with a density of 238 per square kilometer, making up almost 14% of the overall population of the country [
60].
Furthermore, two adjacent districts of KPK, namely Shangla and Swat, were selected for the current research. According to UNDP [
61], Shangla is top-ranked with respect to forest resources (86%) in Pakistan followed by Swat (46%). Moreover, Shangla is one of the poorest and less-developed districts of KPK, with the majority of residents living in rural areas near the forests. On the other hand, Swat is an amalgamation of rural and urban areas. The overall population of the two sampled districts is about 3.07 million [
62], where Swat has a population of 2.31 million, and the population of Shangla is 0.76 million. In terms of administrative setup, Swat has 65 union councils, and Shangla has 28. The forestry and mining industries dominate the province; however, agriculture is still important in terms of providing the main cash crops, such as tobacco, cotton, and staple food items including wheat, maize, rice, sugar beets, and various fruits [
63]. Due to a large population and scarcity in employment opportunities, the household of these districts encounters difficulty in meeting the requirement of everyday life. They therefore mostly rely on SMEs, predominantly SMFEs, to meet both ends, because the government of KPK finances nurseries. Moreover, households are engaged in the businesses of carpentry, ecotourism, Handicrafts, firewood, Fodders and other NTFPs obtained from forests. Thus, the abovementioned factors make the region an ideal place for examining the impacts of SMFEs on rural livelihood.
3.2. The Data
Unlike the former studies based on secondary data, the current study employed primary data to analyze the casual impact of SMFEs on rural livelihood. The use of primary data makes this section more important, since the external validly and causality of results are chiefly based on the careful collection of information. This section provides adequate information about the questionnaire design, sampling techniques, and data collection.
3.2.1. Questionnaire Design and Sampling Technique
The next step was to systematically formulate the methodology to collect the representative sample from the given districts. As mentioned above, Swat and Shangla comprise 65 and 28 union councils. We randomly selected 5 union councils from each district and then randomly selected 350 households from the randomly selected union counsels for face-to-face interviews on a designed questionnaire. The primary data was collected on socio-economic outcomes for households in the districts of Shangla and Swat of KPK, Pakistan. The reason for choosing KPK is that it is the richest province regarding forestry [
61]. Moreover, the government of KPK has also focused on forests of the province by launching a massive afforestation project.
3.2.2. Data Collection
As mentioned above, the two-step cluster sampling methodology was originally designed and exploited by the Pakistan Bureau of Statistics to collect a national representative survey. In this study, given the logistic constraints, 10 union counsels were randomly selected from 93 union counsels of Swat and Shangla. Union councils from Swat included Kalam, Utroor, Beshigram, Bahrrain, and Shin, whereas those from Shangla were Pirkhana, Damorai, Shahpur, Alpuri, and Lilownai. The sample of 350 households was then randomly interviewed based on the designed questionnaire. We selected seven field officers from national non-government organizations with the minimum field experience of five years. We planned to investigate 260 households in Swat and 90 in Shangla considering the population of districts. To do so, we distributed 52 questionnaires each among five field officers to whom the Swat district was assigned. Meanwhile, 45 surveys each were distributed among field officers who were expected to collect data in Shangla. The data were collected through the designed questionnaire by face-to-face interviews, the rate of response was 100%. Data from 350 households revealed that 176 households (131 from Swat and 45 from Shangla) were beneficiaries of SMFEs, while 174 households (129 from Swat and 45 from Shangla) were not engaged in SMFEs. As we interviewed households relying on small- and medium-sized businesses for their livelihood, the educational background was mostly low.
3.3. Empirical Strategy
Once the data were collected, an empirical strategy was used to attain meaningful results from the information. The empirical strategy for this study was comprised of three mutually exclusive parts: The descriptive results, an estimate of the effects of SMFEs on income and wealth possessions of households, and an estimate of the households’ perceptions of the SMFE effect on rural livelihood using ordinal logit regression. The empirical strategy is explained in detail below.
3.3.1. SMFEs, Household Income, and Wealth Possessions: The Empirical Model
To find the causal impact of SMFEs on the income and wealth of households, this study estimates the following equations:
where
and
measure the level of income and wealth for the
ith individual, and
is a dummy variable that measures whether the given respondent is associated with the SMFEs.
are household level control variables.
is a disturbance term.
To empirically estimate these equations, the widely acknowledged ordinary least squares (OLS) methodology was used, where stand for the impact of SMFEs on household income and wealth.
Methodologically, there are various concerns related to these results. One of the possible concerns is reverse causality. It can be argued that, instead of SMFEs impact on wellbeing, it is also highly likely that people with higher levels of income and wealth invest more in SMFEs. However, to mitigate concerns of reverse causality, respondents were asked a retrospective question about income and wealth for comparison. Interestingly, the results (see
Table 1) of that comparison suggest that the probability of reverse causality is negligible.
3.3.2. SMFEs and Rural Livelihood: The Empirical Model
Besides income and wealth, the effects of the five capitals on SMFEs and rural livelihood were studied using the following equations:
where
, and
respectively measure financial, physical, human, social, and natural capital for the
ith individual, and
is a dummy variable that measures whether the given respondent is associated with the SMFEs.
in each equation is the set of household level control variables.
denotes a disturbance term.
To empirically estimate Equations (3)–(7), ordered logit methodology was used. As mentioned in the questionnaire, the five capitals are measured in 5-scale ordered responses. Technically, OLS methodology cannot provide optimal results when the explanatory variable is ordered responses [
64]. In such situations, there is a consensus among the econometricians that the ordered logistic regression model provides efficient results.
4. Results and Discussion
4.1. Descriptive Results
Table 1 below sketches the descriptive statistics of the collected data. It provides two separate columns for the households linked to SMFEs (as the treatment group) and those that are not (as the control group).
Columns (1) and (2) of
Table 1 shows the demographic characteristics of these two types of household. Furthermore, it also provides the wealth index for both groups. The results show that wealth index (out of 11: Tractor, computer, television, electric fan, car, air cooler, mobile phone, electric iron, motorcycle, air conditioner, and refrigerator) of both groups is 7.4 and 4.9, respectively. It is evident that there is a significant difference between the two groups. One question regarding the effects of SMFEs on rural livelihood is the possible presence of reverse causality. In order to mitigate the concern of reverse causality, the questionnaire also asks the retrospective question from the respondents to assess their wealth before investment in the SMFEs. We found that the wealth of households relying on SMFEs was 5.4 before their engagement in SMFEs, and the wealth index raised to 7.4 after their engagement in SMFEs. These results clearly indicate that SMFEs significantly improve the wealth of households.
Table 2 is based on the difference between descriptive statistics of the treatment and control groups. Based on these responses, it can be said that SMFEs contributed to all five assets of the SLF. Specifically, the positive difference with respect to income, employment, and savings suggest that households involved in SMFEs possess high financial capital compared to the control group.
Table 2 also suggests that households relying on SMFEs are more stable in terms of physical capital, as they possess more assets and access to the products they sell is more convenient compared to the other group. Further, regarding human capital, a stable financial position empowered SMFEs relying on households to deal with issues related to health in a better way and availed to them the best available option in terms of educating their family. In addition, government and NGOs operating in these areas constantly provided training that significantly improved their business productivity. The households engaged in SMFEs had higher social capital compared to their control counterparts, since they were in a position to cooperate with the people around them and thus enjoyed cooperation. In response, people valued their suggestions and respected their decisions. Finally, to some extent, the households engaged in SMFEs also contributed to natural capital; for example, SMFEs enhanced the biodiversity and plant species in the districts, and an increase in the number of plantation improved soil and air quality. While these descriptive statistics only provide suggestive evidence, the next section offers empirical evidence based on these statistics.
4.2. Results of OLS Regression
The previous section provides suggestive evidence of the impact of SMFEs on rural community livelihoods and poverty alleviation. To better understand this relationship, a rigorous empirical strategy is required. This section provides the empirical results of SMFE impact on the differences in observed outcomes (i.e., income and wealth) between the treatment and control groups. In order to do so, Equations (1) and (2) are estimated with OLS, and the results are presented in
Table 3. Column (1) of
Table 3 shows the results for income differences. It is evident that beneficiaries of SMFEs on average earn 3% more points. This result substantiates the suggestive evidence provided in the previous section. Similarly, Column (2) of the table shows that beneficiaries of SMFEs own 2.4 more assets (out of the 11 included in the wealth index), i.e., 24%, compared to their counterparts. Moreover, R
2 of income and wealth are 0.64 and 0.72 respectively, implying that SMFEs contribute 64% variance in predicting income while 72% in predicting wealth. Although the studies of the economic impacts of SMFEs are insufficient, findings of the current research coincide with the general literature on small agricultural enterprises. Various studies report the positive effects of small agricultural entrepreneurship. However, this study is different, as it measured the effects of self-financed informal SMFEs. Moreover, these findings indicate the impact of SMFEs on the income and wealth of households. It is possible to claim causality because the retrospective questions that respondents were asked suggested that SMFEs caused their wealth than their counterparts.
4.3. Results of the Ordered Logistic Regression Model
Similarly, the logit regression model was used to estimate Equations (2)–(7). The results in
Table 4 are based on the perceptions of households related to the relative effectiveness of SMFEs on rural livelihoods. All columns in
Table 4 show the significant effects of SMFEs on various dimensions of livelihoods. R
2 values in
Table 4 further specify that SMFEs contribute 63% variance to financial capital, 62% to physical capital, 65% to human capital 59% to social capital and 23% to the social capital of household linked to SMFEs. Column (1) indicates that those who are connected to SMFEs perceive a higher effectiveness of financial capital than their counterparts. Likewise, Columns (2–4) show a higher physical, human, and social capital, respectively, among the households who are related to forest-related services. It is worth mentioning that all these regressions include various demographic characteristics of individuals as control variables. Broadly, these findings are consistent with the literature on forest resources. Particularly, these findings are in line with those of [
1,
65,
66], where significant effects of forest resources on the livelihood of individuals were found. However, previous studies have only focused on income-related benefits of forest resources, whereas this paper also addresses the effects of SMFEs on the wealth of households.
We further analyzed three specific aspects of the five livelihood measures.
Table 5 indicates the perceived effects on income, employment, and savings due to a connection with SMFEs. Since the dependent variable is an ordinal variable, ordered logit regressions were used for the analysis. Columns (1–3) evidently show that SMFEs positively affect income, employment, and savings. These results are also consistent with the existing literature on small entrepreneurship, such as the findings of Ali [
9], who found a positive association between forest income and the saving behavior of households.
In connection to this,
Table 6 provides estimates of perceived physical capital due to involvement in forest-related businesses. We found a positive relationship between SMFEs and physical asset holdings. Interestingly, the results showed that a link to SMFEs help households to accumulate assets, improve infrastructure, and increase their market accessibility, which helps them manage their household and professional life properly. These findings are also controlled for various correlates.
Table 7 is based on the effects of SMFEs on different dimensions of human capital. Column (1) refers to findings related to health. Although the effect of SMFEs on health is significant, it is not sizable. Similarly, Column (3) also shows significant but minimal effects of connectedness to forest-related occupations. Conversely, the impact on education in Column (2) is sizable. The significance of these relationships indicates that households connected to SMFEs can efficiently manage their health-related problems and educate their families and that they have plenty of opportunities to train themselves so as to improve their professional performance and potentially their personal life. Broadly, this result is consistent with results of Kabir and Hou [
67], who measured the effect of SMFEs on the livelihoods of female entrepreneurs with small businesses.
The social capital of households is explored in
Table 8. The results suggest that households linked to SMFEs have more social capital. Of the different dimensions of social capital, cooperation outperforms decision-making and social prestige, but the coefficient of all three dimensions indicates a significant effect. It can be argued that SMFE-linked individuals help the people of their society in hard times because of their stable financial position. As a result, communities cooperate with them, value their suggestions, and respect their decisions.
The impact of SMFEs on natural capital is indicated in
Table 9. Specifically, findings indicate that SMFEs improve soil quality, air quality, saline and lodging, and biodiversity. Results suggest that the impact of SMFEs on natural capital was not that strong, but was significant. This indicates that an increase in SMFEs have a positive effect on the improvement of biodiversity and an increase in plants species. Moreover, a large number of plantations increases the soil and air quality of the districts.
This section discusses the empirical results of the effects of SMFEs on rural community livelihoods and poverty alleviation in KPK, Pakistan. Using varied econometric techniques, we found positive causal effects of SMFEs on livelihood and poverty in households associated with them. More specifically, the results suggest that households linked to SMFEs earn more income than other households, own more resources, and report higher ratings regarding various dimensions of livelihood. These results hold for the various aspects of livelihood and are robust in using the different econometric specifications.
4.4. Limitation and Recommendations
Finally, the research is based on data collected from one developing country, Pakistan. Other developing countries located in other regions may have a similar impact, but in a different context. Further, a cross-border comparative study may also provide better insight, so scholars should conduct a comparative study. Moreover, these results are based on data collected using semi-structured instruments, affording more information concerning the influence of SMFEs on rural livelihoods. Therefore, future investigators should conduct longitudinal research. Due to the cross-sectional nature of this study, we could not encompass the characteristics of SMFEs, which could be better performed in longitudinal research.
It has been shown that the launch of the BTTAP project has positively influenced local community involvement in SMFEs predominantly small-scale forest nursery firms. The government should broaden the threshold and support other types of SMFE, which can help the local community to engage in and improve their livelihood.
5. Conclusions
Existing research documents that forest resources can be important for poverty reduction and can improve rural livelihoods. However, less empirical attention has been paid to the role of SMFEs in improving rural livelihoods. This paper makes a substantial contribution to the existing literature on forestry economics by assessing the effects of SMFEs on rural livelihood and rural poverty reduction. By using primary data from two districts of Khyber-Pakhtunkhwa, Pakistan, SMFEs were found to be positively associated with rural livelihood. By applying the five livelihood capital assets from the SLF as a method for organizing indicators, this study found that households associated with SMFEs earn higher incomes and possess more assets than households that are not linked to SMFEs. Similarly, people associated with SMFEs reported a higher rating of these enterprises for their livelihoods. The results are robust for various dimensions of sustainable livelihood and show positive effects of SMFEs on physical, financial, human, social, and natural capital. Quantitatively, the effect of SMFEs on physical capital is stronger than other capitals.
This study calls for more comprehensive empirical evidence about the links between SMFEs on the rural community livelihood and poverty alleviation. The present study contributes to the existing literature in the following four areas. First, it provides direct evidence of the strong association between SMFEs and rural livelihoods and poverty reduction, especially in Pakistan where no SMFE research or evidence has been established to date. Secondly, this study also contributes to the existing literature using refined empirical analysis. Third, this study also employs an empirical strategy that illustrates causality and is thus a major contribution to the study. The study provides insight into the importance of SMFEs.

 ,
, 
