Article

Improving Municipal Solid Waste Collection Services in Developing Countries: A Case of Bharatpur Metropolitan City, Nepal

1
SANDEE-ICIMOD, International Centre for Integrated Mountain Development, Lalitpur 44703, Nepal
2
Independent Researcher, Kathmandu 44600, Nepal
3
Government of Nepal, Kathmandu 44600, Nepal
*
Author to whom correspondence should be addressed.
Sustainability 2019, 11(11), 3010; https://0-doi-org.brum.beds.ac.uk/10.3390/su11113010
Submission received: 27 March 2019 / Revised: 12 May 2019 / Accepted: 16 May 2019 / Published: 28 May 2019
(This article belongs to the Collection Sustainable Smart Cities and Villages)

Abstract

:
Municipal solid waste management is one of the major challenges that cities in developing countries are facing. Although waste collection services are critical to build a smart city, the focus of both scholarship and action/activism has been more on the utilization of waste than on collection. We devised a choice experiment to elicit the preferences of municipal residents with regard to the various attributes of solid waste collection services in the Bharatpur Metropolitan City of Nepal. The study showed that households identify waste collection frequency, timing of door-to-door waste collection services, and cleanliness of the streets as the critical elements of municipal waste collection that affect their welfare and willingness to pay. While almost all households (95%) were participating in the waste collection service in the study area, more than half (53%) expressed dissatisfaction with the existing service. Women were the main actors engaged in waste collection and disposal at household level. The results of the choice analysis suggest that households prefer a designated waste collection time with waste collection bins placed at regular intervals on the streets for use by pedestrians who often throw garbage on the streets in the absence of bins. For these improvements, households were willing to pay an additional service fee of 10–28% on top of what they were already paying. The study also finds that municipal waste collection can be improved through the involvement of Tole Lane Committees in designing the timing and frequency of the service and by introducing a system of progressive tariffs based on the number of storeys per house.

1. Introduction

Municipal solid waste (MSW) is a critical environmental issue in urban areas. Not only does it release greenhouse gases to the atmosphere, but its improper management impedes attempts to keep cities beautiful and clean. Unmanaged MSW pollutes the soil, water and atmosphere, which may have adverse impacts on public health [1,2,3,4]. On the other hand, MSW management activities such as composting, combustion and landfills release greenhouse gases such as methane, nitrous oxide and carbon dioxide to the atmosphere [5,6,7]. In addition, unmanaged waste could clog the drainage system, which would in turn contribute to flooding and water logging in urban areas during the rainy season [8,9].
MSW management is becoming a major challenge for municipal authorities particularly in developing economies because of the exponential increase in the volume of MSW due both to rapid population growth in urban areas as well as economic growth and improved living standards that have contributed to changes in the consumption patterns of urban dwellers [2,10,11,12,13]. At the same time, the resources available to, and the capacity of, MSW management authorities to collect and safely dispose of waste materials may not match the growing need [14]. In developing countries, rural to urban migration has led to unplanned settlements in the cities. As a result, household solid waste management has become a major challenge in urban planning [15]. Political instability, malfunctioning local authorities and poor MSW collection services have posed challenges in attempts to make cities livable in urban settings [14]. As one of the most challenging issues faced by many developing countries, MSW management undoubtedly requires specific strategies [14,16,17].
Municipal residents are aware of the environmental and health issues associated with MSW due to both to widening access to electronic media and increased levels of education and awareness. These developments have led to a growing demand for sustainable waste management and disposal. Municipalities are responsible for waste-management in cities. However, municipalities in developing countries have not been able to provide effective MSW collection services due to resource constraints and lack of technical knowhow [18,19]. In many cities, MSW management is one of the high cost activities of local authorities [20,21]. For instance, the budget required for MSW management could constitute as much as fifty percent of the total municipal budget in developing countries [14].
Because of resource constraints, MSW collection is incomplete in many developing countries. For e.g., in the Kolkata Municipal Corporation of India, the municipal waste collection service covers only 60-70 percent of registered settlements and less than 20 percent of unregistered settlements [18]. Therefore, there is a need for alternative financing models to expand coverage of MSW collection and disposal services [22]. In several cities in Nepal, households pay a fee to private contractors for the provision of door-to-door waste collection services [15]. Fees paid by households are a voluntary but crucial part of MSW management, as almost 70 percent of the MSW management budget goes generally towards collection [18]. However, as the tariff on MSW collection services is fixed on an ad- hoc basis most of the time, it is insufficient to cover operational costs [23].
Nevertheless, there is a gap between the demand and supply of these services in terms of quality and efficiency [24]. Among the reasons which make MSW management services inefficient in many developing economies are: inadequate human resources; lack of facilities including vehicles and infrastructure; and improper route planning [16,18,25]. This has resulted in irregularities in MSW collection requiring extra investment in waiting time on the part households for the collection vehicle. Among the negative outcomes of failure to collect waste on time are improper dumping and burning of waste at the source and for waste pickers, who are in search of reusable and recyclable items, to throw waste elsewhere, further aggravating the solid waste management problem.
On the other hand, there is no obligation on the part of households to contribute to waste collection services; participation is voluntary and one can opt out at any time. Households who do not participate in paid waste collection services either dispose of their waste free of charge if the city provides such collection services or dump/burn their waste in open spaces. In such situations, households who pay municipal waste collection fees suffer from negative externalities due both to poor services and the unhygienic waste disposal practices of non-participating households.
As the establishment of new facilities to manage MSW is expensive in developing countries, studies have recommended separation at the source for better recycling and reusing [10]. However, except for awareness-raising programs, little attention has been paid in scholarship to other means of increasing public participation in MSW such as eliciting public preferences when it comes to participation in waste management. For e.g., an aspect that has not been studied in low income contexts is how much a household would be willing to pay for provision of waste collection services not only on a given date but also at a pre-determined time notified in advance. The literature which focuses on eliciting public preferences also focuses disproportionately on waste separation [26,27] and waste disposal [24,28,29]. Where studies have attempted to elicit preferences of the public for waste collection services, their focus has been the more developed world [30].
This study is designed to elicit public preferences for solid waste collection from households on a given time and day in the Bharatpur Metropolitan City (BMC) of Nepal, using the choice experiment method, for the purpose of improving the existing MSW collection services. This study may contribute to the Government’s effort to make BMC as a smart city because an efficient waste collection service is a fundamental component of smart city [31].
The contribution of this study has three folds. First, it identifies household preferences and measures the willingness to pay not only for MSW collection services, but also for the provision of service at the given date and time in each week, for which households are willing to pay additional 10–28% on top of what they pay for MSW management. Second, charging collection costs based on the volume of the waste that households generate may result in undesirable outcome of mid-night dumping in drainages and open space [32,33], determining fee based on house structure, mainly number of floors of the house as a proxy indicator of the volume of the waste may be an alternative approach, which may help cities to get additional resources for managing solid wastes properly. Third, city dwellers may collaborate with the cities for reducing the waste that goes to the dumping sites if the wastes collection service is synchronized with the households’ effort of separating organic vs. other wastes, and composting the organic wastes instead of dumping in landfill sites. Other cities in South Asia in general and in Nepal in particular could easily take these elements while designing solid waste management plans.

2. Materials and Methods
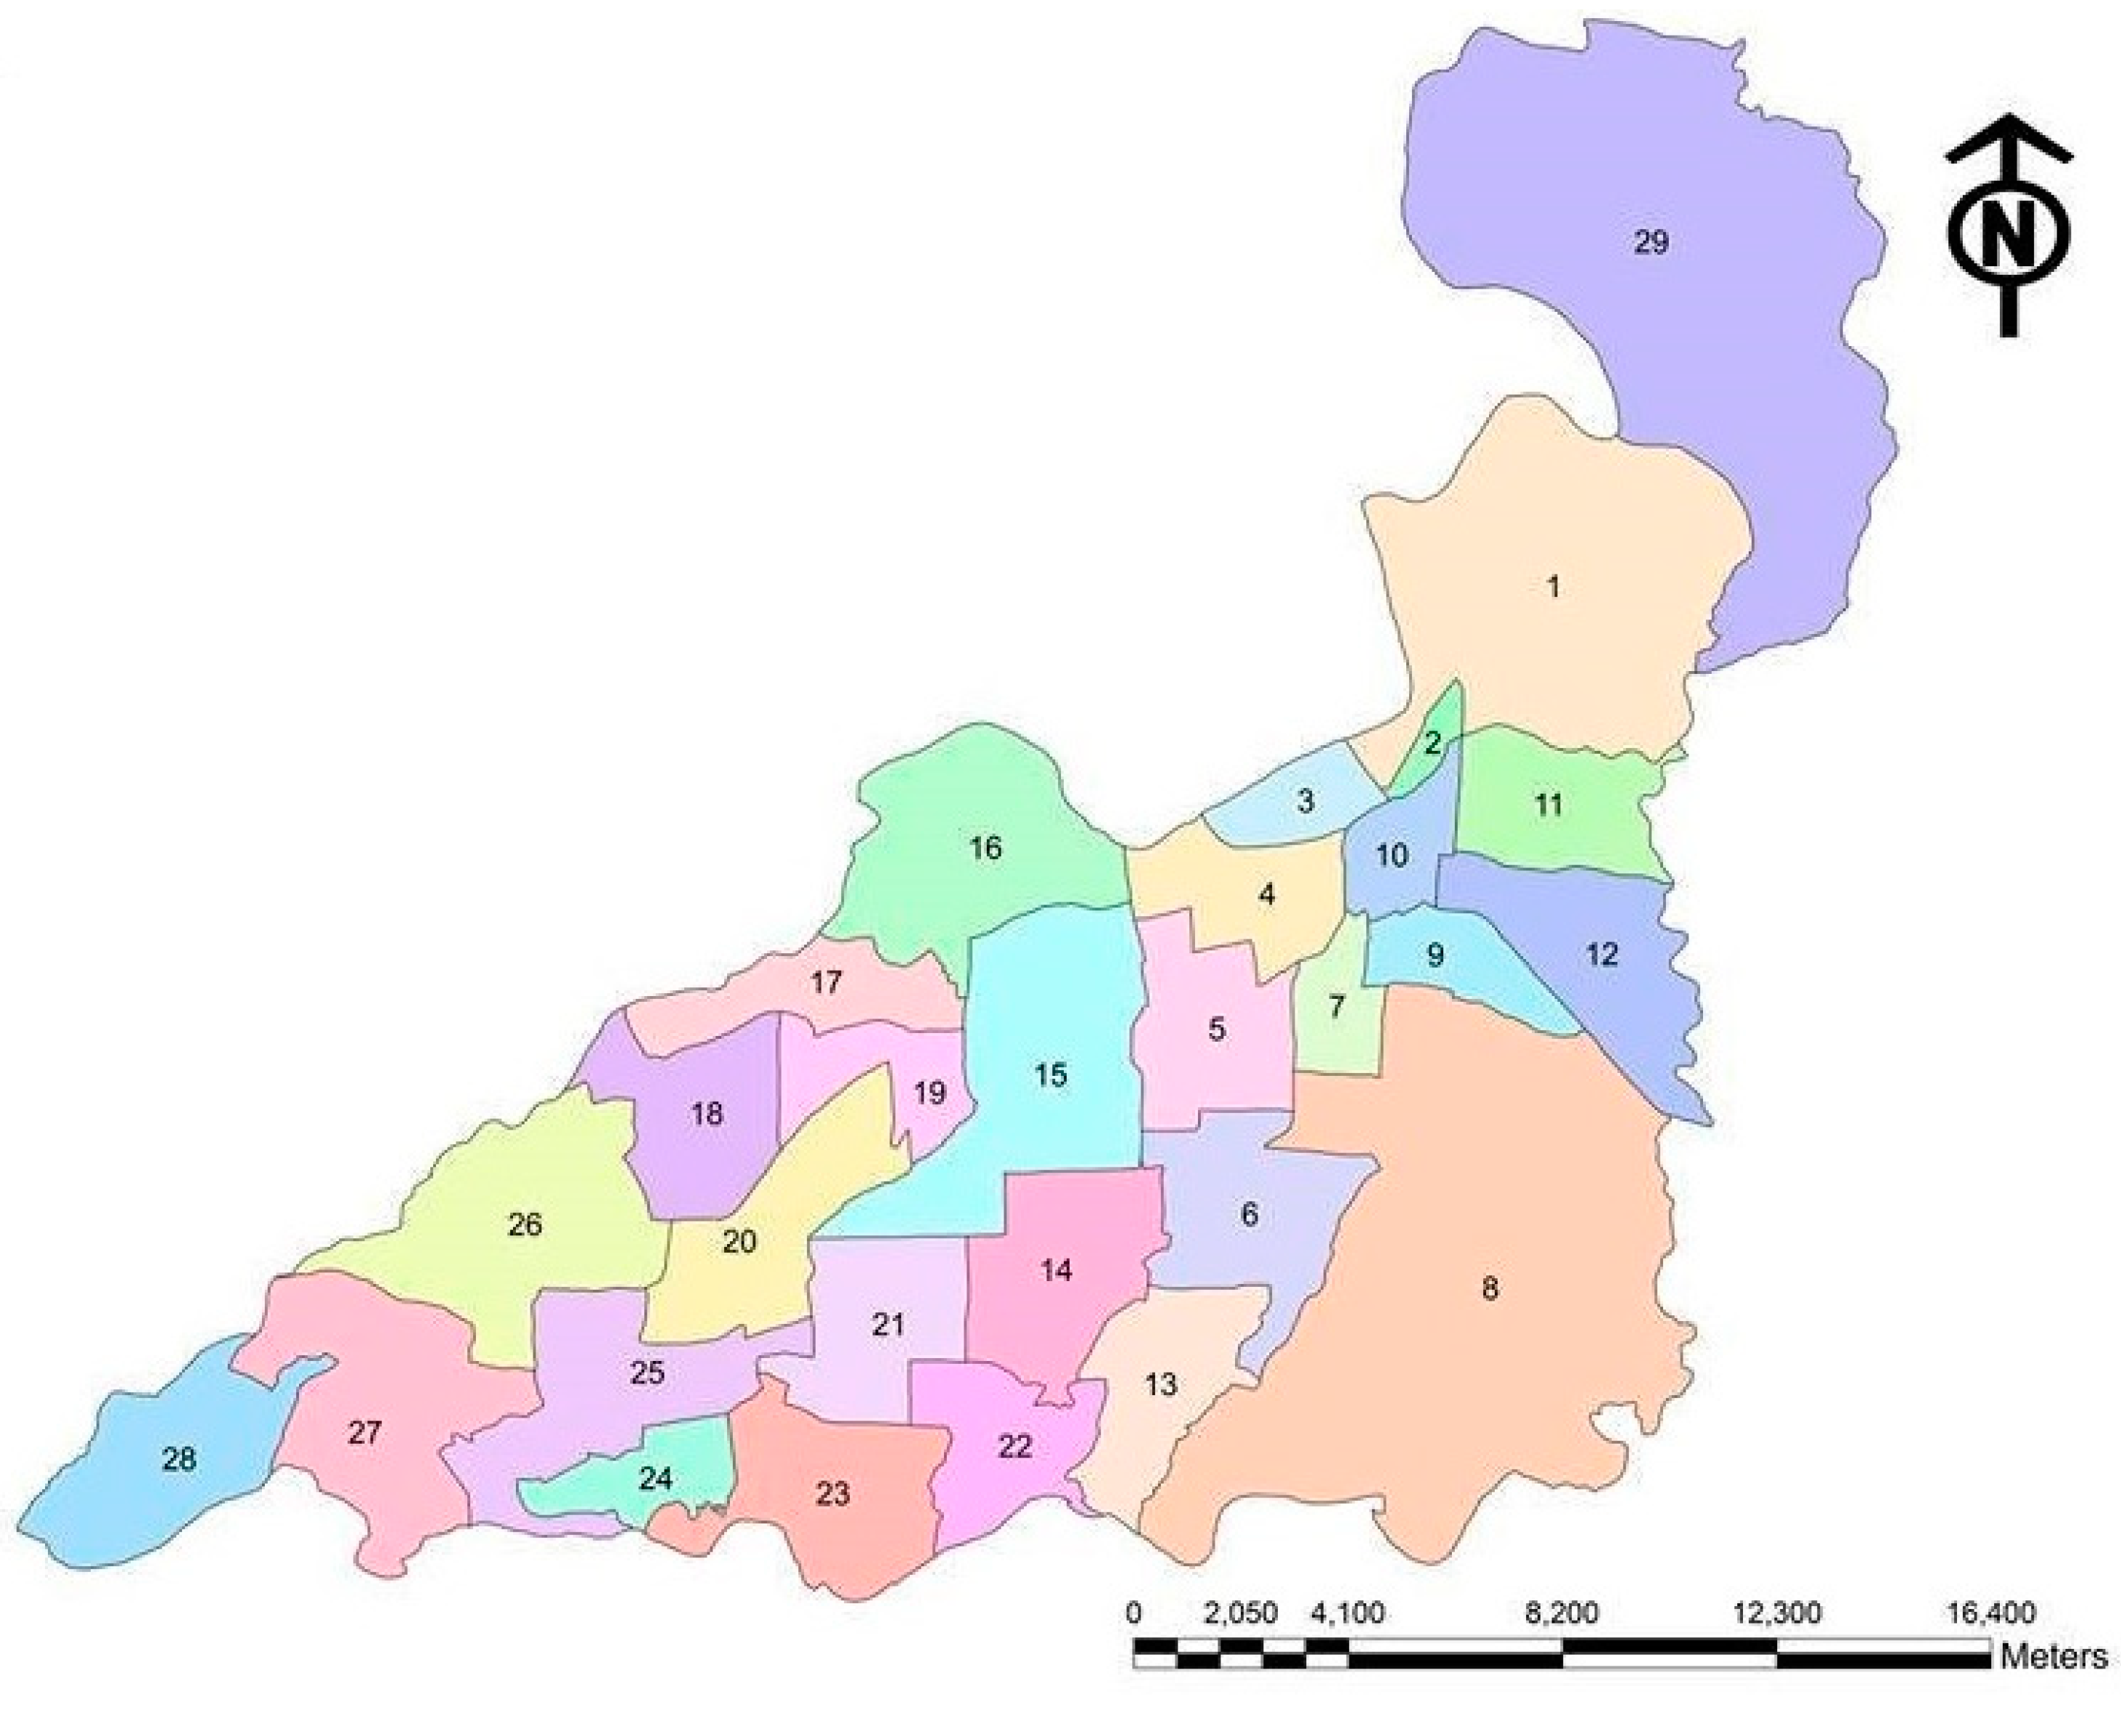
2.1. Study Area

The Bharatpur Municipality was established in 1979; it covers 162.16 sq km in the foothills of Siwaliks. It was declared a sub-metropolitan city in 2014 comprising the suburban areas of the neighbouring village development committees, namely, Gitanagar, Fulbari, Sivanagar, Mangalpur and Patihani. In 2017, the city was declared a Metropolitan City merging two neighbouring municipalities (Narayani and Chitrawan) and the Kabilas Village Development Committee (Figure 1). The metropolitan city spreads over a 432.95 sq km area with an approximate population of 300,000. The population growth rate of the city has been over 6% during the past few years with the average household size at 4.1. Located in the Central Terai Region, the city has earned a name as a centre for cereal production and the poultry industry.
A few years back, the amount of solid waste generated by Bharatpur constituted 32.52 tons of household solid waste and 6.82 tons of commercial waste per day, of which 80 percent was organic although only 25 percent of it was collected for disposal [34]. From the 2017/2018 fiscal year, the city has devoted roughly four percent (NPR 32.45 million) (NPR is the currency in Nepal. 1 USD ~ NPR 104) of its budget for municipal waste management while the remaining balance needed for waste management services comes from fees charged from households and businesses for the service. But the city is currently trying to gradually cover waste collection expenses fully from public contributions by raising the waste collection tariff. But, as the city has not been able to put in place so far a system where public contributions will fully cover the expenses of the collection system, the paid service, at the moment, is voluntary which leaves low-income households and communities living in slums mostly unable to pay the fee to ensure regular waste collection services. Consequently, households that are unable to pay the service fee generally dump their uncollected waste in open areas and nearby drains, which ends up clogging the drainage system and polluting water bodies. This in turn has resulted in the pollution of both the ground and surface water in the city due to open drainage and runoff during the monsoon season posing a public health hazard as the BMC relies on ground water for drinking purposes but can only supply 52% of the total household need [35]. The rest of the households use ground water from dug wells and tube wells to meet their daily needs.
The city has started a public-private partnership to manage its solid waste. Thus, private contractors provide door-to-door waste collection services. But this service is limited to only 13 wards (Ward Number 1-13) (Ward is the smallest administrative unit of municipalities) of the metropolitan city, the total population of which, based on the 2011 Census, was 143,836 living in 36,939 households [36]. The rest of the wards are more rural in nature, the households of which compost their organic waste using it as fertilizer. Households who have waste collection services pay a monthly waste collection fee based on the frequency of the collection service. For e.g., households pay NPR 100 for daily collection services while they pay NPR, 80, 50 and 30, respectively, for three times a week, twice a week, and once a week collection. In addition, businesses pay between NPR 200 and NPR 4000 depending on the volume of waste that they generate with the rate negotiated between the service providers and service seekers within upper and lower limits set by the city. Thus, vegetable wholesalers and hotel/restaurant owners pay more than retailers. The frequency of the waste collection service is decided by the Tole Lane Organization (TLO). (TLO is a community-based organization registered in the concerned municipal authority and formed at neighborhood level to coordinate development and sanitation activities. On average, a TLO comprises 100 households in the case of Bharatpur.) This means that the frequency of collection varies across the TLOs but remains the same for all households within the TLO. Out of the total waste collection fee paid by households, 30 percent goes back to the respective TLOs. The TLOs are expected to utilize the refund amount in order to keep their community clean.
In addition, the BMC encourages its residents to sort solid waste into organic and plastic waste and to compost organic waste as these measures would help reduce both the volume of waste and management expenses. There are two strategies in place to encourage municipal households to sort waste: (i) providing a 50 percent subsidy when purchasing a composter, and (ii) door-to-door collection of plastic waste from the households. Plastic entrepreneurs have distributed suiro (i.e., hooks) to municipal households for gathering their plastic waste to be collected when households are ready to dispose of it. The suiro programme expects to collect 25 ton of plastic waste per month [37]. Some TLOs have assigned a specific location to collect the plastic waste and to sell it to interested local vendors.

2.2. Methods

This study used the choice experiment (CE) method to elicit the preferences of BMC residents with regard to improving the existing MSW collection service. CE is one of the stated preference approaches, which determines individual preference in some hypothetical scenarios. Respondents are given choice sets with multiple policy alternatives from which to select their most preferred alternative. The CE method is based on the neo-classical economic theory that respondents would select the alternative that gives them the highest utility among a set of alternatives [38]. The alternatives are a set of attributes, which are related to the issue under investigation, and distinguished by the levels of attributes. The levels are measures of changes in quality or quantity of the selected attributes consequent to implementing project activities. It is assumed that respondents would make trade-offs among attributes to select the alternative that best fits their interest. Therefore, CE is built on Lancaster’s Characteristics Demand theory [39]. This theory states that consumers derive utility from the characteristics of the good rather than the good itself. In a choice experiment, a respondent is given more than one choice set for the purpose of assessing their consistency from which they select the alternative of their choice.
All attributes related to the issue under investigation cannot be included as that would increase the size of the experiment. Therefore, the key attributes used for the CE are generally decided based on the characteristics of the issue in question after consultation with the relevant stakeholders. A random utility model that an individual i derives utility U from an alternative j with a set of attributes X can be expressed as:
Uij = V (Xij) + εij,
Equation (1) suggests that the total utility (U) can be decomposed into two parts, where V refers to the observed component and ε refers to an unobserved component [40].

2.2.1. Data Collection

This study adopted both qualitative and quantitative approaches. The qualitative approach includes consultations with relevant stakeholders and focus group discussions at the study site while the quantitative approach includes a household survey. The qualitative approach generated information on and identified the critical issues that stakeholders are facing with regard to managing solid waste in the study area. We used this information to determine the attributes and levels for the choice experiment and to develop the questionnaire for the household survey. Developing the questionnaire based on information from the stakeholder consultation helps to make the questionnaire more context-specific for the purpose of understanding the solid waste management issue in the area under consideration [15,41].

Stakeholder Consultations and Focus Group Discussions
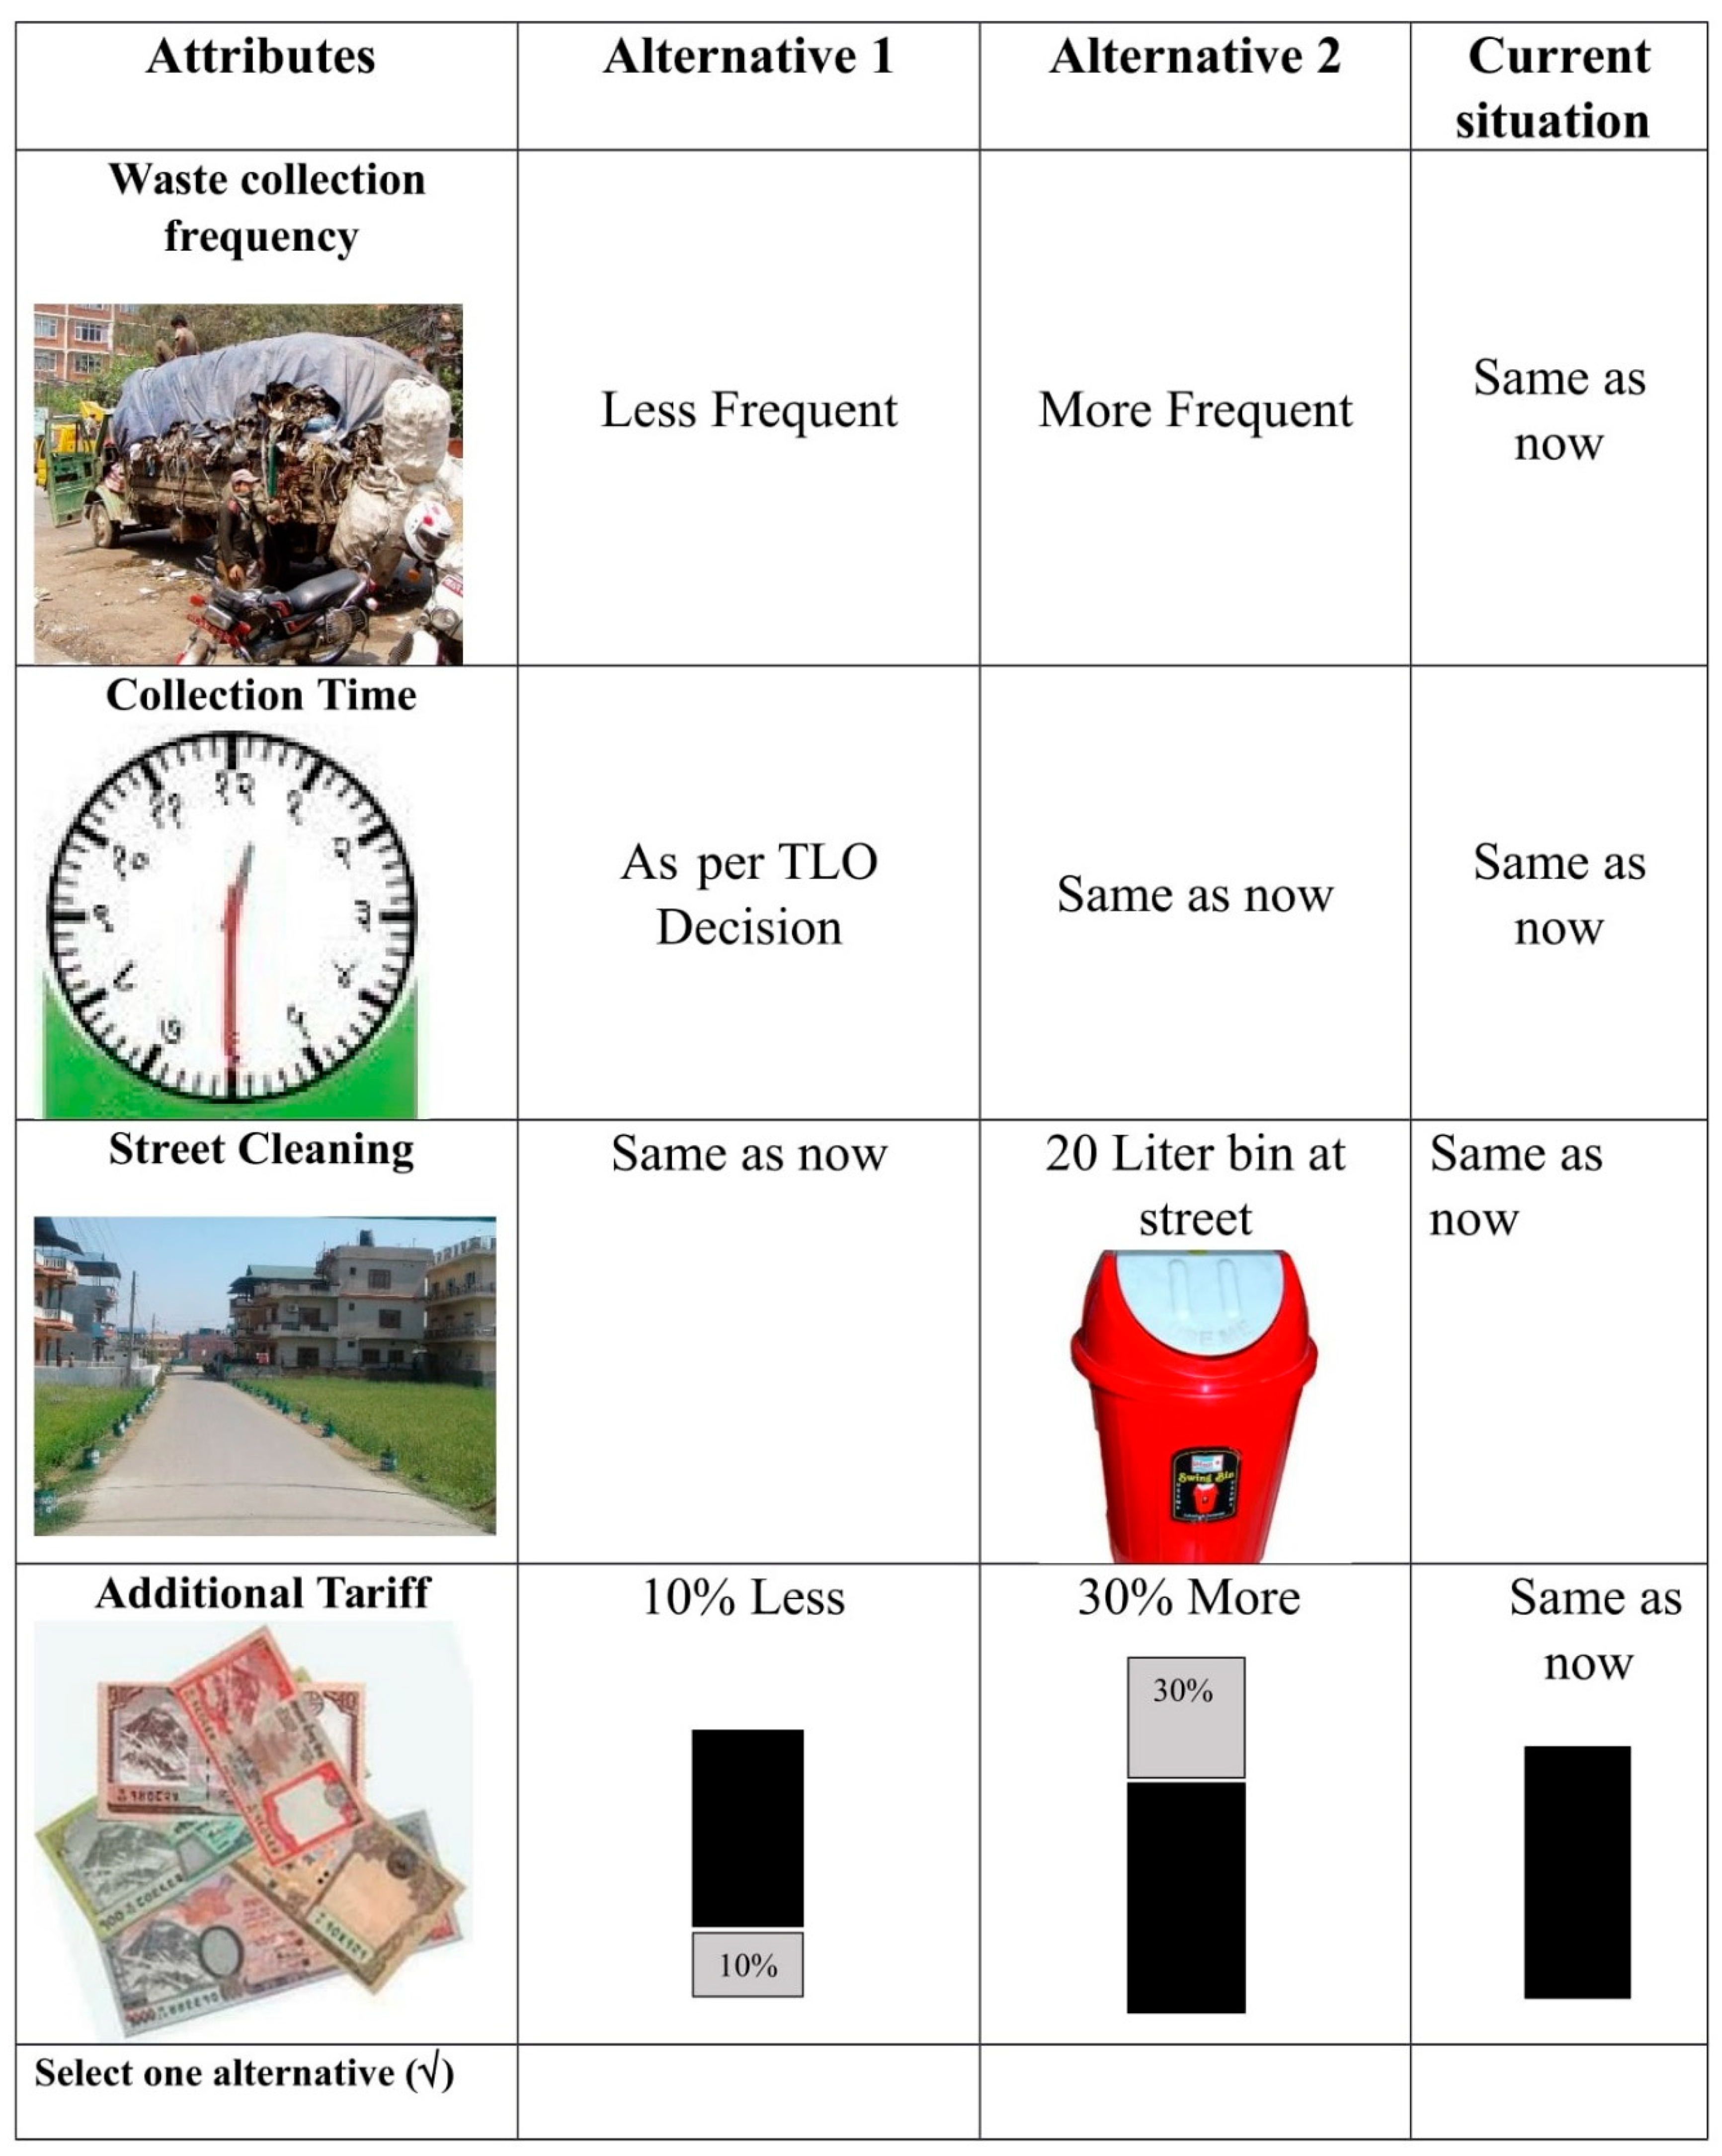
The study team carried out consultations with stakeholders on several occasions from July 2016 to March 2017. The consultations were to understand the past and present management activities as well as the issues and areas needing attention and improvement vis-a-vis MSW management. The team consulted the staff of BMC; private contractors who collect and dispose of MSW; and leaders of selected TLOs. The team visited the selected TLOs and observed their activities regarding waste separation at household level and composting. In addition, the team visited the landfill site in order to understand the waste disposal techniques as well as the issues faced by service providers. During the consultation, resource constraints, both financial and human, came to the fore as prominent issues. Though expressing interest in managing municipal solid waste better, the officials stated that they lack adequate resources to effectively collect solid waste as only 70% or so of residents pay a fee for the service. The private contractors indicated that besides financial constraints, they face shortages in the form of manpower and transportation, for example, trucks for MSW disposal. Additionally, they pointed to the high turnover of workers many of whom prefer to work on a part-time basis, which affects, in turn, timely and effective service delivery.
After the stakeholder consultation, the team developed two types of focus group discussion (FGDs) protocols for the residential and business areas. We carried out a total of six FGDs in April 2017—two in residential areas and four in business areas—in order to better understand the MSW management and municipal waste collection services provided by private contractors. Most of the focus group participants, particularly in business centres, expressed dissatisfaction with the existing waste collection service due to irregularities in the waste collection service and inconvenient timing. On the other hand, in the FGDs with participants from residential areas, some TLOs that sort waste and compost organic waste at home were undecided if they needed frequent door-to-door waste collection services.
The focus groups provided inputs on the key attributes and their levels for the choice experiment (Table 1). These attributes and levels were finalized after discussion with BMC officials and private contractors. Focus group participants selected three major attributes of MSW management including collection frequency, collection time, and street cleaning services. We found that the selected attributes for waste collection services were different from those identified in studies conducted in developed economies [30]. The FGD participants said that there was no fixed time on a given day when service provides picked up the waste from their homes or businesses; the frequency was not adequate in places where the volume of daily waste was high; and streets were not clean in most of the places. Indeed, variations in the MSW management system were reflected in collection frequencies and tariffs [16].

Experimental Design

We applied the D-efficient design to create choice scenarios combining the attributes and their levels as presented in Table 1. In this approach, the design showing the lowest D-error is selected for the experiment. This design is appropriate for CE as choice responses are analysed using non-linear models such as conditional logit (CL) [42].
An efficient design requires prior information about the parameters, which can be obtained through various methods. In this experiment, we first designed an experiment based on prior knowledge about the sign of the parameters [42,43]. We followed this via the preparation of a draft questionnaire which was piloted with 20 respondents. We analysed the responses from the piloting using the CL model while signs and coefficients of the respective variables were used to re-design the final experiment.
Figure 2 displays a sample choice set. A total of 16 choice sets were generated using an efficient design and grouped into four blocks. This meant that a respondent received four choice sets, requiring them to make their choice four times in a row during the survey. Such repeated decisions by the respondent helped us to assess the consistency in the trade-offs. The entire questionnaire was similar except when it came to the choice part. Hence, we numbered the questionnaire from Version 1 to Version 4 based on the group of choice sets. As the education levels of the respondents were different which affected, in turn, their understanding of the MSW management issue, the choice sets were visualized to make it easier for them to understand the trade-offs (Figure 2).

Household Survey

This study was carried out in the core city area of the BMC and the surrounding residential areas. Out of the 29 wards of the BMC, this study covered 13 wards, which constitute the area that previously belonged to the Bharatpur Municipality. Two contractors were providing MSW management services in these wards at the time of the study, with the wards clustered into two groups and assigned to two service providers for efficient MSW management. In the case of the remaining wards, which are more rural in nature and thus do not require daily or frequent service, the BMC provides waste collections services. In these rural wards where households tend to use their organic waste as agriculture input, they do not require a daily waste collection service. But the 11 wards in the core city area have municipal waste collection services on a regular basis with the wards comprising over 600 TLOs. For the purposes of this study, we randomly selected 150 TLOs through a lottery. From each TLO, we selected seven households using systematic random sampling. Hence, while the first household was selected randomly, the other six households were selected at given intervals. We computed the interval as a ratio of the number of households in the given TLO and the sample size. Each TLO had between 23 and 210 households.
We deployed a total of five enumerators for the household survey undertaken during the September-October period of 2017. All five enumerators were female. In August 2017, we gave the enumerators an extensive training for three days to familiarize them with the survey design and survey instruments with hands-on field practice in order to minimize differences between enumerators when it came to survey administration. In addition, after the extensive orientation, during the first few days, the study team closely supervised the enumerators in the field to ensure consistency. Thereafter, a field supervisor provided constant support to the enumerators whenever such support was needed. While electronic devices were used for data collection, the survey supervisor monitored the collected data on a real-time basis and provided on the spot support whenever necessary to maintain data quality. Each enumerator surveyed roughly 30 TLOs and 210 households with a total of 1,050 households as the sample. All approached households participated in the survey. Heads of the approached households of either gender were interviewed based on their availability. In case of non-availability of household heads during the first visit, the enumerators revisited the households when the household heads were available.

2.2.2. Data Analysis

In Equation (1), error terms (ε) are assumed to have an identical and independent distribution (iid). Therefore, choice responses are usually estimated using the conditional logit model [44]. This can be expressed as;
Uij = ASC + βiXij + α Si × ASC,
where ASC is the alternative specific constant and coded as 1 for policy alternatives and 0 for the current situation. It captures the effects of attributes that are not included in the experiment. β is the coefficient of attributes X reported in Table 1 and α is the coefficients of the interaction of socio-economic variables (S) and ASC. The socio-economic variables capture the heterogeneity of preference of sub-groups of the society while selecting the alternative of their interest. In this analysis, age, education, family size, gender, quantity of waste generation, and number of storeys per house are included as non-attribute variables. These variables could influence the attitudes and behavior of people with regard to household waste management [45,46,47].
The next step of the CE response analysis is to estimate the marginal willingness-to-pay (WTP) for each attribute reported in Table 1 except the additional tariff. The marginal WTP (WTPm) is the negative ratio between the coefficient of the attribute (βx) and the coefficient of the cost attribute (βc). In the present instance, βc is the coefficient of additional tariff. This can be expressed as:
W T P m = β x β c ,

3. Results

3.1. Descriptive Statistics

Out of 1050 respondents, over 63% were female. Table 2 reports the demographic information of sample households. The average age of household heads corresponds to the age of household heads in other parts of the district having off-farm activities as their main source of household income. The average household size is higher than that reported in the 2011 census (3.98) [35]. This could be due to increase in migrations to the city as it has been one of the prime destinations of internal migrants in recent years due to its central location and accessibility and proximity to both the capital city Kathmandu and the tourist hub Pokhara. The ratio of male to female population shows no difference from that reported in the Census.
In terms of ethnicity roughly two-thirds of the sampled households (65%) identify as Brahmin/Kshetry followed by hill indigenous (28%) and hill-dalit (4%). Of the total sampled respondents, 41 percent were homemakers while 27 percent were involved in businesses. The main source of income of the sampled households was business (34%), remittance (21%) and agriculture (15%). In addition, 70% of the respondents were residential while 7% were running businesses in rented facilities while 22% had set up shop in their own residence. Of the total respondents, 26% were renting out their houses (in full or in part). Moreover, 88% were owners of residences with 50% having ownership of residences with more than one storey.

3.2. Waste Generation and Management

The BMC households and businesses generate several types of waste. Of the total respondents, 94 percent were generating degradable waste either from household or business. Among non-degradable waste, plastic waste was the major type as 98 percent of the sampled households’ generated plastic waste. Other types of waste were paper, metal, glass, cloth and sanitary and construction materials. Most of the households (83%) were separating waste at their residences. Among the households practicing waste separation, almost all (99%) sorted the waste into degradable and non-degradable items. Of the respondents who were not sorting their waste, more than two-thirds (71%) stated that they did not like to sort the waste while one-fifth (21%) thought it was useless to sort waste. Four percent did not sort the waste either due to lack of knowledge on how to sort or lack of composting facilities.
Households practicing waste separation were producing 4.3 kg degradable waste and 1.6 kg non-degradable waste per week whereas households who did not sort waste were producing 5.71 kg of waste per week. Households had different strategies to manage the waste. In the case of organic waste, the majority of households who practiced separation (54%) made compost; one third (32%) fed it to domestic animals; a smaller percentage (5%) burnt it; 2% disposed it elsewhere; and the rest mostly dumped it into nearby vacant lots or drains. With reference to paper and plastic waste, approximately two-thirds of households (73%) handed it over to the waste collection service; 20 percent of households sold it; 4 percent of households burnt it; and the rest of the households either threw it somewhere or reused it.
The study results indicate that women are the primary managers of solid waste at household level at household level. In over 80% of the households, the waste is exclusively managed by women including separation and disposal. The average time spent on waste management activities is 30 minutes per day. The time spent includes separation and disposal after every meal. A majority of households (70%) were using plastic bags to store waste while the rest used plastic bins.

3.3. Municipal Waste Collection Service

Of the total number of respondents, 95% had access to the municipal waste collection service for which 1% of the households did not pay a fee. With regard to the frequency of collection, 62% of the respondents received solid waste collection services once a week. As for the rest, 5% received daily collection services; 3.5% received the service twice a week; 1% received the service on alternate days while 26% did not have a fixed schedule and required waste collection services only occasionally. Of the total households who pay a waste collection fee, 93% have a door-do-door collection system while the rest have a common collection point because they reside in places that the waste collectors cannot reach in their vehicles. The average monthly waste tariff is NPR 43.16 although more than 50% of the respondents were not satisfied with the municipal waste collection service. As with the focus group participants, the households’ main complaint was with regard to irregularity in waste collection time.
This study also assessed what influence the TLOs had in determining the collection frequency as it is decided by the respective TLO. For this purpose, we carried out a regression where collection frequency is the dependent variable (Table 3). The results of the regression show that TLOs with more women occupying major positions in executive committees and more businesses engage in waste separation have less frequent waste collection services than the TLOs where men occupy major positions in executive committees or fewer businesses engage in waste separation. On the other hand, TLOs with more business units have frequent waste collection services. Similarly, TLOs having black topped road, regardless of the condition, have more frequent waste collection services than those with gravel roads.

3.4. Household Preferences

Table 4 reports the results of the conditional logit (CL) model of the respondents who have access to the municipal waste collection service. Of the total number of households with access to municipal waste collection services, 43% have selected the current situation in all four choice scenarios indicating that they prefer the current municipal waste collection service to the alternatives presented to them. In response to the contingent question, 78% respondents rejected the idea of paying an additional monthly tariff for improvements in waste collection. This goes to show the preference of respondents for the status-quo if there is to be an additional payment for improvements in service.
The results of the CL model indicate that with regard to collection time, BMC residents have opted for alternatives more frequently than now with the option, convenient collection time, as the most preferred. With regard to street cleaning, respondents have shown their preference for the alternative which gives the option to place 20 litre bins in the street. Other options for street cleaning such as dedicated sweepers to clean the street and dedicated sweepers and 20 litre bins in the street were not statistically significant as alternatives among the respondents. Similarly, respondents did not prefer the alternatives having less frequent waste collection compared to now. The option of more frequent waste collection compared to now is significant only at 10%.
The coefficient of ASC indicates that other variables which are not included in the experiment do not have a significant effect with regard to changing the current situation to alternative scenarios (improved waste collection service). The results also indicate that owners of houses with more storeys to their houses selected alternatives more frequently than their neighbours who lived in houses with fewer stories. Other socio-economic variables were not significant in selecting alternatives.
We estimated the WTPm using Equation (iii) of the significant attributes at 5% level (see Table 3) and their lower and upper bound (see Table 5). The estimated WTPm indicates that respondents would like to pay an additional 11.66 percent on top of the current tariff on average if the collection time is scheduled as per the TLO decision. In other words, a household currently paying NPR 100 per month would like to pay an additional NPR 11.65 on average or a total of NPR 111.65 per month if the collection time in his/her TLO is as per the TLO decision and is communicated to the households in advance. Similarly, respondents were willing to pay an additional 10.26% on average as tariff for placing 20 litre bins in the street while they would like a reduction in 16.57% of the tariff if the collection frequency becomes less frequent than now.
In addition, the estimation also shows that WTP increases by 8.16% on average for every additional floor of the building. In other words, in a TLO with a NPR 100 per month waste collection tariff, a respondent with a three storied house was willing to pay an additional NPR 16.32, while it would increase by NPR 8.16 for those who reside in a two-storied house.
The monthly total WTP of the area with access to waste collection services at present was estimated and reported in Table 6. The first row lists four policy scenarios detailing four situations relating to the participation of households in the improved waste collection service. We developed the policy scenarios based on the attributes with significant coefficients and socio-economic variables (Table 2) while the estimations are drawn from Table 4. The participation of households in improved waste collection is based on the following assumptions:
  • Participation Scenario I: the number of households is estimated based on the number of households participating in the municipal waste collection service (95%) at present and the households who have not opted for the status-quo in all choice scenarios (57%);
  • Participation Scenario II: all households participating in the municipal waste collection service (95%) also participate in the improved waste collections service;
  • Participation Scenario III: all households participate in waste collection after improved collection system;
  • Participation Scenario IV: households who have purchased waste collection services more than once a week participate in the improved waste collection system. There are 16.5% of the sampled households in this category. For this sub-sample, the average number of storeys is 1.98 per household with the average monthly tariff at NPR 81.53.
The estimated monthly WTP of the households varies with different policy scenarios, as well as with the number of households participating in the waste collection system. For instance, if the BMC imposes a progressive tariff based on the number of storeys per house for those households who are willing to pay for the improved services including collection at an agreed-upon time and 20 litre bins in the street, the annual additional fee would be NPR 2.77 million while it would be NPR 1.76 million if the improved service is provided only to those TLOs which have a collection frequency more than once a week. If all households participate in the improved solid waste collection service, then the additional annual tariff would be NPR 5.11 million. These estimations are between 10% and 28% of the existing tariff collection.

4. Discussion

The government of Nepal is preparing a detailed project report to make BMC as a Smart City. The concept of smart city aims to improve the quality of life for the entire city [48]. Efficient waste management is fundamental to improve the service to citizen [49,50]. Therefore, this study attempted to understand different aspects of waste generation and collection system in BMC. Our study estimated the average waste generated in the study area to be close to 6 kg per week per household, which is consistent with the previous estimation of average daily per capita waste generation at 170 grams [34]. However, it may increase with increased income. For instance, in Kathmandu valley, which is the capital city of Nepal, the estimated average daily solid waste generation is more than half a kg per capita [22]. Another factor that contributes to increases in total waste volume is the number of households per TLO. Studies have shown that organic waste constitutes more than two-thirds of the municipal waste in Nepal [34,51].
A majority of household partly sort the solid waste, a practice that has many advantages. Sorting allows households to convert waste to resources [19]. For instance, BMC households who separate waste on their premises make compost while selling recyclable items such as plastic items and bottles in the market. Secondly, sorting waste at source and composting the organic part means reducing the volume of waste to be sent out, requiring in turn municipal waste collection services less frequently, ultimately reducing the collection costs. In addition, it also increases the lifespan of the landfill site as the volume of waste in the landfill would significantly decline with such practices [10]. As the data indicates that women members of households play a major role in waste management activities at household level, involving them in awareness raising efforts would ensure more effective waste management.
A majority (53%) of the service seekers did not express satisfaction with the existing MSW collection service due mainly to irregularities in collection as well as inconvenient collection times in the absence of prior notification. Such issues are not uncommon in other developing countries as well where waste collection services are also not efficient due to shortcomings in infrastructure, human resources and route planning [16,18]. In addition, users of smart city services have about the utility, safety, accessibility and efficiency of those services [50]. This may discourage municipal households from participating in MSW management services, even discontinuing payment of the service fee as a way of registering their protest at the inefficiency. As a result, the municipal authority has to either cover the cost of waste management from other sources at the expense of other public services or face environmental problems in the city due to neglect of solid waste management.
The results of the choice responses indicate that consumers of waste collection services would like to see improved service delivery as they are not satisfied with the current service as evident from their selection of alternatives against the current situation. Among improvements mentioned by respondents was the placing of 20-liter bins at regular intervals in the streets. Street-level bins are indubitably an effective way to keep the city clean and to make MSW collection services more efficient [52]. But, as with other towns in Nepal, respondents have shown a preference for frequency of collection [15].
At the top of their list of preferences is rescheduling of collection time in their TLOs to suit their convenience. It is noteworthy that community-based waste management systems have been found to work in parts of developing economies such as Puducherry in India [53]. Since, at present, the TLOs decide the collection frequency, it would be more effective if the waste collection schedule was designed as per their need. However, designing appropriate vehicle routing schedules for waste collection is complicated and may require additional resources [54,55]. Therefore, in the case of the BMC, motivating households to sort waste and to compost the organic part may not only reduce the volume of waste but require less frequent collection services, which would ultimately contribute towards providing on-time waste collection services at a lower cost.
However, these improvements are not possible without additional expenditure. The financial sustainability of the MSW management system is a crucial aspect to consider in developing countries [4]. In the case of the BMC, the additional cost needed to generate awareness among households to sort waste can be covered by the additional tariff that households are willing to pay, which could amount to between NPR 1.76 million and NPR 5.11 million. The results suggest that respondents with taller buildings in terms of the number of floors have more WTP for the improved scenario. This is in line with existing literature where the size of the house is one of the principal determinants of household waste management [47]. Thus, the MSW management system can be sustained financially if it is designed properly taking into consideration the concerns of stakeholders. These results are consistent with the results of research conducted in other Asian cities [15,26,56].

5. Conclusions

Our study discusses how the MSW collection service can be improved, which is the primary task of MSW management. Akin to other cities in developing countries, BMC has been facing several challenges in managing solid waste. Their first challenge has been to ensure the participation of all households in MSW management and the second is to address the grievances of households that already participate in the solid waste management programme so that the user fee collection does not diminish. The former can be addressed by revising the service charge for collection by linking it with other utilities or services provided by the city [23]. For instance, the BMC can link the fee for waste management with other service fees that the municipality collects, such as the property tax as in the case of Chile [57]. Doing so will make payment for waste management services mandatory for all residents thus marking a shift from the current practice of voluntary participation.
The results also suggest that the BMC should consider levying a progressive tariff on waste collection based on the number of floors per building unlike at present where one building is treated as one unit irrespective of the number of floors per residential building or even the number of families/households living under the same roof. However, this could be challenging in developing countries, where database of rental households is not systematic. This can be better addressed by coordination between the community organizations, such as TLOs and the private contractors who provide door-to-door waste collection services.
As in the case of waste collection frequency, the determination of waste collection timing and the placing of bins at street level for pedestrian use can be done in consultation with the concerned TLOs and ward offices. In addition, as women are the primary managers of waste at home, both the BMC and private contractors would do well to collaborate with the women for better management of solid waste. This indicates the need for inclusive participation of all stakeholders in the design phase of MSW management strategy in developing countries.
The study also suggests that waste separation at the household level without a separate pick up service may not address the problem since all waste goes together in the landfill even though households painstakingly sort it at home, which is one of the major issues of MSW management currently in BMC. Households tend to lose interest in sorting waste when the collector dumps everything in the same truck. The lifespan of the landfill site could be prolonged if waste collection and transfer are carried out separately for degradable and non-degradable waste and degradable waste is either composted or converted to energy [58]. There has been increased interest among South Asian policy makers and stakeholders on converting waste to energy [59]. Further study is needed in order investigate the incentives that would motivate waste collection service providers to collect and transfer degradable and non-degradable waste separately. This may provide cost effective solutions for enhancing the efficiency of MSW management through re-cycling and reusing rather than resorting to the establishment of new waste management facilities as the solution. This could be an effective way to build smart cities in developing economies.

Author Contributions

R.K.R.—conceptualization, methodology, formal analysis, and original draft preparation. M.N.—study design, methodology, review and editing, supervision, and project administration. M.S.K.—methodology, data curation, validation, and formal analysis. B.B.—conceptualization, review and editing.

Funding

This research was funded by the International Development Research Centre (IDRC), Ottawa, Canada (Grant #08283-001).

Acknowledgments

This research was carried out by the South Asian Network for Development and Environmental Economics (SANDEE), an initiative of the International Centre for Integrated Mountain Development (ICIMOD), with financial support from the International Development Research Centre (IDRC), Ottawa, Canada (Grant #08283-001), which the authors gratefully acknowledge. ICIMOD acknowledges with gratitude the support of its core donors: the Governments of Afghanistan, Australia, Austria, Bangladesh, Bhutan, China, India, Myanmar, Nepal, Norway, Pakistan, Sweden, and Switzerland. The authors would also like to acknowledge the support of Birat Ghimire and the Bharatpur Metropolitan City for facilitating the fieldwork. However, the views as well as interpretations of the results presented in this research are those of the authors and should not be attributed to their affiliated organizations.

Conflicts of Interest

The authors declare no conflict of interest.

References

  1. Batool, S.A.; Ch, M.N. Municipal solid waste management in Lahore city district, Pakistan. Waste Manag. 2009, 29, 1971–1981. [Google Scholar] [CrossRef] [PubMed]
  2. Seo, S.; Aramaki, T.; Hwang, Y.; Hanaki, K. Environmental impact of solid waste treatment methods in Korea. J. Environ. Eng. 2004, 130, 81–89. [Google Scholar] [CrossRef]
  3. Koda, E.; Sieczka, A.; Osinski, P. Ammonium concentration and migration in groundwater in the vicinity of waste management site located in the neighborhood of protected areas of Warsaw, Poland. Sustainability 2016, 8, 1253. [Google Scholar] [CrossRef]
  4. Ferronato, N.; Torretta, V. Waste Mismanagement in Developing Countries: A Review of Global Issues. Int. J. Environ. Res. Public Health 2019, 16, 1060. [Google Scholar] [CrossRef] [PubMed]
  5. Boldrin, A.; Andersen, J.K.; Møller, J.; Christensen, T.H.; Favoino, E. Composting and compost utilization: Accounting of greenhouse gases and global warming contributions. Waste Manag. Res. 2009, 27, 800–812. [Google Scholar] [CrossRef]
  6. Mohareb, A.K.; Warith, M.A.; Diaz, R. Modelling greenhouse gas emissions for municipal solid waste management strategies in Ottawa, Ontario, Canada. Resour. Conserv. Recycl. 2008, 52, 1241–1251. [Google Scholar] [CrossRef]
  7. Figueroa, V.K.; Mackie, K.R.; Guarriello, N.; Cooper, C.D. A robust method for estimating landfill methane emissions. J. Air Waste Manag. Assoc. 2009, 59, 925–935. [Google Scholar] [CrossRef]
  8. Rowe, R.K.; Armstrong, M.D.; Cullimore, D.R. Mass loading and the rate of clogging due to municipal solid waste leachate. Can. Geotech. J. 2000, 37, 355–370. [Google Scholar] [CrossRef]
  9. Pervin, I.A.; Rahman, S.M.; Nepal, M.; Hague, A.E.; Karim, H.; Dhakal, G. Adapting to urban flooding: A case of two cities in South Asia. Water Policy 2019. [Google Scholar] [CrossRef]
  10. Yukalang, N.; Clarke, B.; Ross, K. Solid waste management solutions for a rapidly urbanizing area in Thailand: Recommendations based on stakeholder input. Int. J. Environ. Res. Public Health 2018, 15, 1302. [Google Scholar] [CrossRef]
  11. Ozcan, H.K.; Guvenc, S.Y.; Guvenc, L.; Demir, G. Municipal solid waste characterization according to different income levels: A case study. Sustainability 2016, 8, 1044. [Google Scholar] [CrossRef]
  12. Wang, H.; Nie, Y. Municipal solid waste characteristics and management in China. J. Air Waste Manag. Assoc. 2001, 51, 250–263. [Google Scholar] [CrossRef]
  13. Jha, A.K.; Sharma, C.; Singh, N.; Ramesh, R.; Purvaja, R.; Gupta, P.K. Greenhouse gas emissions from municipal solid waste management in Indian mega-cities: A case study of Chennai landfill sites. Chemosphere 2008, 71, 750–758. [Google Scholar] [CrossRef]
  14. Henry, R.K.; Yongsheng, Z.; Jun, D. Municipal solid waste management challenges in developing countries—Kenyan case study. Waste Manag. 2006, 26, 92–100. [Google Scholar] [CrossRef] [PubMed]
  15. Rai, R.K.; Bhattarai, D.; Neupane, S. Designing solid waste collection strategy in small municipalities of developing countries using choice experiment. J. Urban Manag. 2019. [Google Scholar] [CrossRef]
  16. Al-Khatib, I.A.; Arafat, H.A.; Basheer, T.; Shawahneh, H.; Salahat, A.; Eid, J.; Ali, W. Trends and problems of solid waste management in developing countries: A case study in seven Palestinian districts. Waste Manag. 2007, 27, 1910–1919. [Google Scholar] [CrossRef] [PubMed]
  17. Avolio, R.; Spina, F.; Gentile, G.; Cocca, M.; Avella, M.; Carfagna, C.; Tealdo, G.; Errico, M.E. Recycling Polyethylene-Rich Plastic Waste from Landfill Reclamation: Toward an Enhanced Landfill-Mining Approach. Polymers (Basel) 2019, 11, 208. [Google Scholar] [CrossRef] [PubMed]
  18. Hazra, T.; Goel, S. Solid waste management in Kolkata, India: Practices and challenges. Waste Manag. 2009, 29, 470–478. [Google Scholar] [CrossRef]
  19. Sujauddin, M.; Huda, S.M.S.; Hoque, A.T.M.R. Household solid waste characteristics and management in Chittagong, Bangladesh. Waste Manag. 2008, 28, 1688–1695. [Google Scholar] [CrossRef] [PubMed]
  20. Guerrero, L.A.; Maas, G.; Hogland, W. Solid waste management challenges for cities in developing countries. Waste Manag. 2013, 33, 220–232. [Google Scholar] [CrossRef]
  21. Huang, Y.-T.; Pan, T.-C.; Kao, J.-J. Performance assessment for municipal solid waste collection in Taiwan. J. Environ. Manag. 2011, 92, 1277–1283. [Google Scholar] [CrossRef] [PubMed]
  22. Pokhrel, D.; Viraraghavan, T. Municipal solid waste management in Nepal: Practices and challenges. Waste Manag. 2005, 25, 555–562. [Google Scholar] [CrossRef] [PubMed]
  23. Lohri, C.R.; Camenzind, E.J.; Zurbrügg, C. Financial sustainability in municipal solid waste management—Costs and revenues in Bahir Dar, Ethiopia. Waste Manag. 2014, 34, 542–552. [Google Scholar] [CrossRef] [PubMed]
  24. Pek, C.-K.; Jamal, O. A choice experiment analysis for solid waste disposal option: A case study in Malaysia. J. Environ. Manag. 2011, 92, 2993–3001. [Google Scholar] [CrossRef] [PubMed] [Green Version]
  25. Sinthumule, N.I.; Mkumbuzi, S.H. Participation in Community-Based Solid Waste Management in Nkulumane Suburb, Bulawayo, Zimbabwe. Resources 2019, 81, 30. [Google Scholar] [CrossRef]
  26. Yuan, Y.; Yabe, M. Residents’ preferences for household kitchen waste source separation services in Beijing: A choice experiment approach. Int. J. Environ. Res. Public Health 2015, 12, 176–190. [Google Scholar] [CrossRef]
  27. Jin, J.J.; Wang, Z.S. Choice experiment method and its application to solid waste management in Macao. Huan Jing Ke Xue 2006, 27, 820–824. [Google Scholar]
  28. Ku, S.-J.; Yoo, S.-H.; Kwak, S.-J. Willingness to pay for improving the residential waste disposal system in Korea: A choice experiment study. Environ. Manag. 2009, 44, 278–287. [Google Scholar] [CrossRef] [PubMed]
  29. Sasao, T. An estimation of the social costs of landfill siting using a choice experiment. Waste Manag. 2004, 24, 753–762. [Google Scholar] [CrossRef] [PubMed] [Green Version]
  30. Sakata, Y. A choice experiment of the residential preference of waste management services–The example of Kagoshima city, Japan. Waste Manag. 2007, 27, 639–644. [Google Scholar] [CrossRef]
  31. Medvedev, A.; Fedchenkov, P.; Zaslavsky, A.; Anagnostopoulos, T.; Khoruzhnikov, S. Waste management as an IoT-enabled service in smart cities. In Internet of Things, Smart Spaces, and Next Generation Networks and Systems; Springer: Cham, Switzerland, 2015; pp. 104–115. [Google Scholar]
  32. Dahlén, L.; Lagerkvist, A. Pay as you throw: Strengths and weaknesses of weight-based billing in household waste collection systems in Sweden. Waste Manag. 2010, 30, 23–31. [Google Scholar] [CrossRef] [PubMed]
  33. Welivita, I.; Wattage, P.; Gunawardena, P. Review of household solid waste charges for developing countries–A focus on quantity-based charge methods. Waste Manag. 2015, 46, 637–645. [Google Scholar] [CrossRef] [PubMed]
  34. Asian Development Bank. Solid Waste Management in Nepal: Current Status and Policy Recommendations; Asian Development Bank (ADB): Manila, The Philippines, 2013. [Google Scholar]
  35. Central Bureau of Statistics (CBS). National Population and Housing Census 2011 (National Report) Central Bureau of Statistics; CBS: Kathmadu, Nepal, 2012. [Google Scholar]
  36. Central Bureau of Statistics (CBS). District/VDC Wise Population of Nepal; CBS: Kathmandu, Nepal, 2012. [Google Scholar]
  37. Solid Waste Management and Resource Mobilization Center. Solid Waste Managmenet in Nepalese Municipalities: Solid Waste Management in Bharatpur Municipality; SWMRMC: Kathmadu, Nepal, 2004. [Google Scholar]
  38. Ben-Akiva, M.; Lerman, S. Discrete Choice Analysis: Theory and Application to Travel Demand; MIT Press: Cambridge, MA, USA, 1985. [Google Scholar]
  39. Lancaster, K. A new approach to consumer theory. J. Polit. Econ. 1966, 74, 132–157. [Google Scholar] [CrossRef]
  40. Manski, C.F. The structure of random utility models. Theory Decis. 1977, 8, 229–254. [Google Scholar] [CrossRef]
  41. Rai, R.K.; Scarborough, H. Nonmarket valuation in developing countries: Incorporating labour contributions in environmental benefits estimates. Aust. J. Agric. 2015, 59, 479–498. [Google Scholar] [CrossRef]
  42. Ferrini, S.; Scarpa, R. Designs with a priori information for nonmarket valuation with choice experiments: A Monte Carlo study. J. Environ. Econ. Manag. 2007, 53, 342–363. [Google Scholar] [CrossRef]
  43. Rose, J.M.; Bliemer, M.C.J.; Hensher, D.A.; Collins, A.T. Designing efficient stated choice experiments in the presence of reference alternatives. Transp. Res. Part B Methodol. 2008, 42, 395–406. [Google Scholar] [CrossRef]
  44. McFadden, D. Conditional Logit Analysis of Qualitative Choice Behavior. 1973. Available online: https://eml.berkeley.edu/reprints/mcfadden/zarembka.pdf (accessed on 17 May 2019).
  45. Barr, S. Factors influencing environmental attitudes and behaviors: A UK case study of household waste management. Environ. Behav. 2007, 39, 435–473. [Google Scholar] [CrossRef]
  46. Troschinetz, A.M.; Mihelcic, J.R. Sustainable recycling of municipal solid waste in developing countries. Waste Manag. 2009, 29, 915–923. [Google Scholar] [CrossRef] [PubMed]
  47. Sterner, T.; Bartelings, H. Household waste management in a Swedish municipality: Determinants of waste disposal, recycling and composting. Environ. Resour. Econ. 1999, 13, 473–491. [Google Scholar]
  48. Visvizi, A.; Lytras, M.D.; Damiani, E.; Mathkour, H. Policy making for smart cities: Innovation and social inclusive economic growth for sustainability. J. Sci. Technol. Policy Manag. 2018, 9, 126–133. [Google Scholar] [CrossRef]
  49. Baud, I.S.A.; Grafakos, S.; Hordijk, M.; Post, J. Quality of life and alliances in solid waste management: Contributions to urban sustainable development. Cities 2001, 18, 3–12. [Google Scholar] [CrossRef]
  50. Lytras, M.; Visvizi, A. Who uses smart city services and what to make of it: Toward interdisciplinary smart cities research. Sustainability 2018, 10, 1998. [Google Scholar] [CrossRef]
  51. Dangi, M.B.; Pretz, C.R.; Urynowicz, M.A.; Gerow, K.G.; Reddy, J.M. Municipal solid waste generation in Kathmandu, Nepal. J. Environ. Manag. 2011, 92, 240–249. [Google Scholar] [CrossRef]
  52. Nunan, F. Urban organic waste markets: Responding to change in Hubli–Dharwad, India. Habitat Int. 2000, 24, 347–360. [Google Scholar] [CrossRef]
  53. Pattnaik, S.; Reddy, M.V. Assessment of Municipal Solid Waste management in Puducherry (Pondicherry), India. Resour. Conserv. Recycl. 2010, 54, 512–520. [Google Scholar] [CrossRef]
  54. Nuortio, T.; Kytöjoki, J.; Niska, H.; Bräysy, O. Improved route planning and scheduling of waste collection and transport. Expert Syst. Appl. 2006, 30, 223–232. [Google Scholar] [CrossRef]
  55. Tung, D.V.; Pinnoi, A. Vehicle routing–scheduling for waste collection in Hanoi. Eur. J. Oper. Res. 2000, 125, 449–468. [Google Scholar] [CrossRef]
  56. Takahashi, T.; Awaya, Y.; Hirata, Y.; Furuya, N.; Sakai, T.; Sakai, A. Stand volume estimation by combining low laser-sampling density LiDAR data with QuickBird panchromatic imagery in closed-canopy Japanese cedar (Cryptomeria japonica) plantations. Int. J. Remote Sens. 2010, 31, 1281–1301. [Google Scholar] [CrossRef]
  57. Psomopoulos, C.S.; Themelis, N.J. A guidebook for sustainable waste management in Latin America. In Proceedings of the International Resource Recovery Congress Waste-to-Energy, Vienna, Austria, 8–9 September 2014; pp. 8–9. [Google Scholar]
  58. Kalogirou, E.; Sakalis, A. Overview of the waste management situation and planning in Greece. Waste Manag. 2016, 6, 107–116. [Google Scholar]
  59. Haque, A.K.E.; Lohano, H.D.; Mukhopadhyay, P.; Nepal, M.; Shafeeqa, F.; Vidanage, S.P. NDC pledges of South Asia: Are the stakeholders onboard? Clim. Chang. 2019, 1–8. [Google Scholar] [CrossRef]
Figure 1. Bharatpur Metropolitan City (Numbers denote Ward Numbers).
Sustainability 11 03010 g001
Figure 2. An example of a choice set.
Sustainability 11 03010 g002
Table 1. Definition of the selected attributes and their levels.
AttributesDescriptionLevels
Frequency of collectionNumber of times door-to-door waste collection service is provided in a week. Currently, it varies from daily to once a week depending on the need of the TLOs.
  • As much as now
  • Less frequent than now
  • More frequent than now
Timing of collectionDoor-to-door waste collection time in a given day. Currently, it is irregular and mostly determined by the availability of the service vehicle.
  • As per now
  • Convenient time for the service seekers
Street cleaningMSW collection service provides both waste collection and street cleaning. Currently, the street cleaning service is occasional and hence streets are not clean.
  • As per now
  • Dedicated sweeper to clean the street
  • 20 liter bins in the street
  • Both sweepers and bins
Additional TariffCurrently, municipal households and the business community pay a monthly tariff based on the frequency of collection determined by their respective TLO. *
  • 10% less
  • 10% more
  • 20% more
  • 30% more
For the households, the frequency of collection is once a day, three times a week, twice a week and once a week. The monthly tariff is, respectively, NPR 100, Rs 80, Rs 50 and Rs 30. The tariff rates are fixed by the BMC.
Table 2. Descriptive statistics.
VariableMean (SD)
Age (Years)42.97 (13.50)
Education (Years)8.72 (4.62)
Family size5.00 (2.15)
Female household member2.53 (1.31)
Foreign employment0.51 (0.99)
Weekly waste generation (kg/house)5.85 (4.49)
Average number of storeys per house1.67 (0.69)
Table 3. Determinants of the collection frequency (daily = 1, alternate day = 2, twice a week = 3, weekly = 4, occasional = 5).
VariablesCoefficient (SE)Description
Constant3.92 (0.459) ***
Women in Committee0.145 (0.066) **Number of women occupying major post in TLO executive committee
House0.00151 (0.0009)Number of buildings in TLO
Business−1.687 (0/196) ***Percentage of business units in TLO
Separation0.00385(0.0017) **Percentage of business units practicing waste separation
Blacktopped−0.393 (0.167) **TLO having blacktopped road (Yes = 1, No = 0)
Damaged blacktopped road−0.488 (0.170) ***TLO having damaged blacktopped road (Yes = 1, No = 0)
Notes: *** and ** denote significance at 1%, and 5% levels respectively.
Table 4. Results of conditional logit (respondents with municipal waste collection service).
VariablesCoefficient (SE)
Attributes
Collection time as per convenience0.144 (0.066) **
Dedicated sweeper to clean the street−0.125 (0.082)
20 liter bin in the street0.127 (0.003) ***
Dedicated sweeper and 20 liter bin−0.183 (0.099)
Less frequent than now−0.205 (0.070) ***
More frequent than now0.161 (0.093) *
Additional tariff−0.012 (0.002) ***
Socio-economic variables
Current monthly tariff−0.0001 (0.0008)
Age0.002 (0.002)
Education0.005 (0.008)
Female−0.019 (0.067)
Family size0.008 (0.013)
Waste generation (kg)0.007 (0.006)
Number of storeys per house0.101 (0.035) ***
ASC0.715 (0.865)
Note: *, **, *** denote significance at 10%, 5% and 1% levels. Sample size = 996.
Table 5. Marginal WTP and their upper and lower bound in NPR (in %).
AttributesWTPm (Lower and Upper Bound)
Collection time as per convenience11.66 (2.14–21.18)
20 liter bin in the street10.26 (3.44–17.08)
Less frequent than now−16.57 (−30.05–−3.10)
Table 6. Total WTP in different scenarios and their upper and lower bound in parentheses (NPR/Month).
Policy ScenariosParticipation of Households in Improved Waste Collection
Participation Scenario IParticipation Scenario IIParticipation Scenario IIIParticipation Scenario IV
Scenario I: collection as per time100,662
(18,475–182,848)
176,599
(32,412–320,787)
185,894
(34,118–337,670)
56,754
(10,416–103,091)
Scenario II: 20 litre bins in the street88,575
(29,268–147,453)
155,395
(52,101–258,689)
163,574
(54,843–272,304)
49,939
(16,744–83,135)
Scenario III: collection time as per convenience and 20 litre bins in the street189,237
(48,173–330,301)
331,994
(84,513–579,476)
349,468
(88,961–609,974)
106,693
(27,160–186,226)
Scenario IV: Progressive tariff as per the number of stories for Scenario III230,772
(55,197–406,347)
404,863
(96,836–712,889)
426,171
(101,933–750,409)
146.411
(33,877–258,945)

