Article

A System Dynamics-Based Approach to Help Understand the Role of Food and Biodegradable Waste Management in Respect of Municipal Waste Management Systems

by
Micky A. Babalola
Graduate School of Education, Hiroshima University,1-1-1 Kagamiyama, Higashi-Hiroshima, Hiroshima 739-8524, Japan
Sustainability 2019, 11(12), 3456; https://0-doi-org.brum.beds.ac.uk/10.3390/su11123456
Submission received: 27 May 2019 / Revised: 16 June 2019 / Accepted: 17 June 2019 / Published: 24 June 2019

Abstract

:
The long-term plan of any city in Japan is to become a material recycling society. The use of all types of municipal waste is essential in maximizing the full potential of material recovery. As such, municipalities are responsible for managing their waste, including food and biodegradable waste (FBW), and this results in some complex schemes. This study uses the system dynamics approach to illustrate and investigate the benefits of separate treatment of FBW. At the same time, to understand the dynamic interactions between all aspects and elements of the current municipal solid waste management system in Oita City. The developed model includes total environmental benefit, motivation to manage waste and resources, and yield from treatment facilities. The result shows that with the introduction of an anaerobic digester (AD) plant for FBW increases the efficiency of incineration. Furthermore, the result indicates that strengthening the regulation of waste sorted and the reduction in the amount of FBW treated in incineration will improve the current system. This study concludes that any policy or regulation less than the proposed result will yield less benefit. Thus, strengthening regulation is a crucial part of the sustainability of FBW management in the long run.

1. Introduction

Municipal solid waste management is one of the most pertinent environmental protection challenges facing most cities in Japan. Significant portions of these solid waste streams are food scraps and biodegradable waste. It barely seems possible that waste disposal should present any significant challenge; however, unseen factors make it a complex problem of enormous magnitude for even a developed nation like Japan. The current municipal solid waste (MSW) management system is hampered by large amounts of food and biodegradable waste (FBW), the concerned costs, the disposal methods, and the impact of wastes on the local and global environment [1].
Currently, measures to handle FBW are being reexamined in and across Japan, and the Food Recycling Act (enacted in 2001 and revised in 2015) is promoting the recycling of recyclable food and biodegradable resources, mostly as raw materials. There are also waste preventive measures to reduce, reuse, and recycle the amount of FBW from households collected by local authorities.
FBW has a direct and strong influence on the composition and quantity of MSW, since it represents the largest share of MSW mixed with low calorific value and high-water content [2]. Taking FBW out of the MSW mix will not only be for the benefit of renewable sources of energy, but it will also reduce the cost of treatment and the quality of recyclable materials will largely increase due to less or no contamination with FBW substances which might be wet [1,2,3].
In spite of a sound foundation for material recycling and recovery, supported by legal regulations like “Biomass Nippon Strategy” and “Food Recycling Law,” incineration remains the primary and dominant method of MSW in most cities in Japan [4,5,6]. When these wastes are incinerated, it reduces the energy and combustion efficiency [3,6,7]. Intrinsically, there are significant benefits if these wastes are turned away from the incinerator to a more reliable recycling technology such as anaerobic digestion (AD) [3,6,8]. FBW has been acknowledged as a profitable resource that can be converted into useful products via AD, which appears to be one of the most effective technologies for the treatment of FWB among others [6,8,9]. Incineration or AD alone cannot realize the maximum potential of MSW, as renewable resources, and consequently the combination of various types of waste treatment technologies should be considered [1,4,10].
Recent studies have shown that when compared with incineration in terms of economic performance and environmental impact, AD has an upper hand, also a better source of electricity and heat, and reduces more greenhouse gases (GHG) [9,11,12]. Bernstad and la Cour Jansen [7] did a comparative analysis on food waste management systems. They argued that when support fuel (extra fuel, e.g., diesel) is mixed in MSW, due to the low calorific value in wet FBW, it reduces the incentive for material recycling. They also pointed out that it hinders the recycling of other waste materials such as paper and plastics, as they are used to boost the heating value in the incinerator. Villanueva and Wenzel, [13] reported that material recycling is more beneficial than incineration in relation to energy use and energy related imparts. After evaluation of different recycling methods in Japan, Takata et. al. [14] concluded that cost and GHG emission of food recycling facilities are lower than that of incineration facilities.
While acknowledging their contribution in confirming anaerobic digestion as the better option for treating FBW, it should be noted that these evaluations or analyses where carried out of the MSW management system, and the dynamic nature of the entire system are not taken into consideration. These approaches could not reflect the complex relationship among the key factors and variables. Additionally, they focused on identifying qualitative connections between key components or quantifying and modeling only one or two components of the MSW management. Thus, the incorporation of FWB management as a separate form of MSW management is required to tackle waste problems.
For this purpose, this study presents a comprehensive model of FBW management with quantitative and qualitative analysis using system dynamics (SDs). SDs is used to evaluate the contribution of separate treatment of FBW in the MSW system and its sustainability in Oita City, Japan. Therefore, the objectives of this study were: to model various waste management strategies, to analyze policy measure scenarios, and to understand the dynamic interactions. Along with the outcomes of FBW separate treatment on socio-cultural (regulation and policy), economic (total waste budget), and environmental benefits.

2. Materials and Methods

Waste management analysis requires consideration of complex criteria and evaluation steps to find the proper solution and at the same time eradicate the overall negative impact and the consequent effect on the local environment. The proposed study is intended to demonstrate the application, flexibility, and robustness of the SDs approach in MSW management. The application of SDs in waste management, building up to the model calibration and evaluation, is discussed in the following section.

2.1. Application of the System Dynamics Approach in Waste Management

In order to understand and highlight challenges and to propose solutions associated with food and biodegradable waste management (FBWM), the SDs approach is employed. SDs presents us with helpful means for better understanding of the scale of complexity in FBWM challenges, while placing special significance on the role of information feedback and behavior [15,16,17]. SDs, being a tool designed based on system thinking, is proposed in order to analyze and simulate the relationship among various variables in the municipal solid waste management system, while managing FBW.
SD is a deep-rooted technique for studying and managing simple and complex feedback systems which are involved in building causal loop diagrams, along with stock and flow diagrams to structure an applicative system dynamics model [15,18,19,20]. Moorcroft [19] and Sterman [20] both highlighted that system dynamics is about determining managerial structure in systems and taking insights into the association of causalities over time. Simultaneously, it is an application within a framework that is founded to examine a part or a component of a system in order to understand the contest of feedback relationships within and related to other systems, instead of looking at them separately [15,19,20]. The modeling process in SD as developed by Sterman [20] contains five phases, as shown in Figure 1. These phases show the cycle of accumulating experience, learning, and getting better understanding of the model through process of testing, questioning, improving, and supporting [21].
In recent times, large numbers of studies have been undertaken to describe, develop, and simulate economic, environmental, managerial, industrial, and social systems in the contest of the SDs approach, especially in studies such as environmental and resources system modeling [16], business managerial systems [19,20], traffic safety policy in transportation [22], power grid, and solar photovoltaics installations [23,24], and the water resource management system [25,26,27]. SDs has contributed to the effectiveness to the studies of solid waste management aspects ranging from MSW generation forecasting [28,29] to the eco-design policy on packaging waste management system [30], from evaluation of MSW generation and landfill capacity [31] to hospital waste management [32], and in different aspects of construction and demolition waste [18,33,34,35,36,37].
Although from these studies there were several efforts on modeling with regards to components mentioned above, there are no studies where SD is applied to model food and biodegradable waste management system along with the MSW systems. Additionally, these studies could not effectively reveal the interactions among various aspects of waste management systems. Considering the current studies, this study aims at establishing a model for the FBW management system to evaluate how improvement on the current practice and separated treatment of FBW will influence the entire MSW management system.
Therefore, the main steps undertaken in designing the study can be described as follows. The first stage introduced the problem being addressed and the modeling objectives of the studies. Subsequently, the dynamic relationship of the main variables and elements identified in stage 1 are revealed by the causal loop diagram in the second stage. In the third stage, the causal feedback relationship was transformed into quantitative system equations to execute the simulation process. Graph function and constant variables were the two methods used to quantify the system equation. At this stage, the simulated model was calibrated and modified using the data representing Oita City’s present condition and the government’s policies on FBW and MSW management system. The fourth stage examined the model validation using several test methods, including, boundary and structure adequacy test, extreme condition test, face validity test, dimensional consistency test, and time step adequacy test, as suggested by experts [32,33,34,35,36,37]. In the last stage, the SDs model was used to simulate different policy scenarios with the aim of coming up with different policy measures to be incorporated in real life situations.

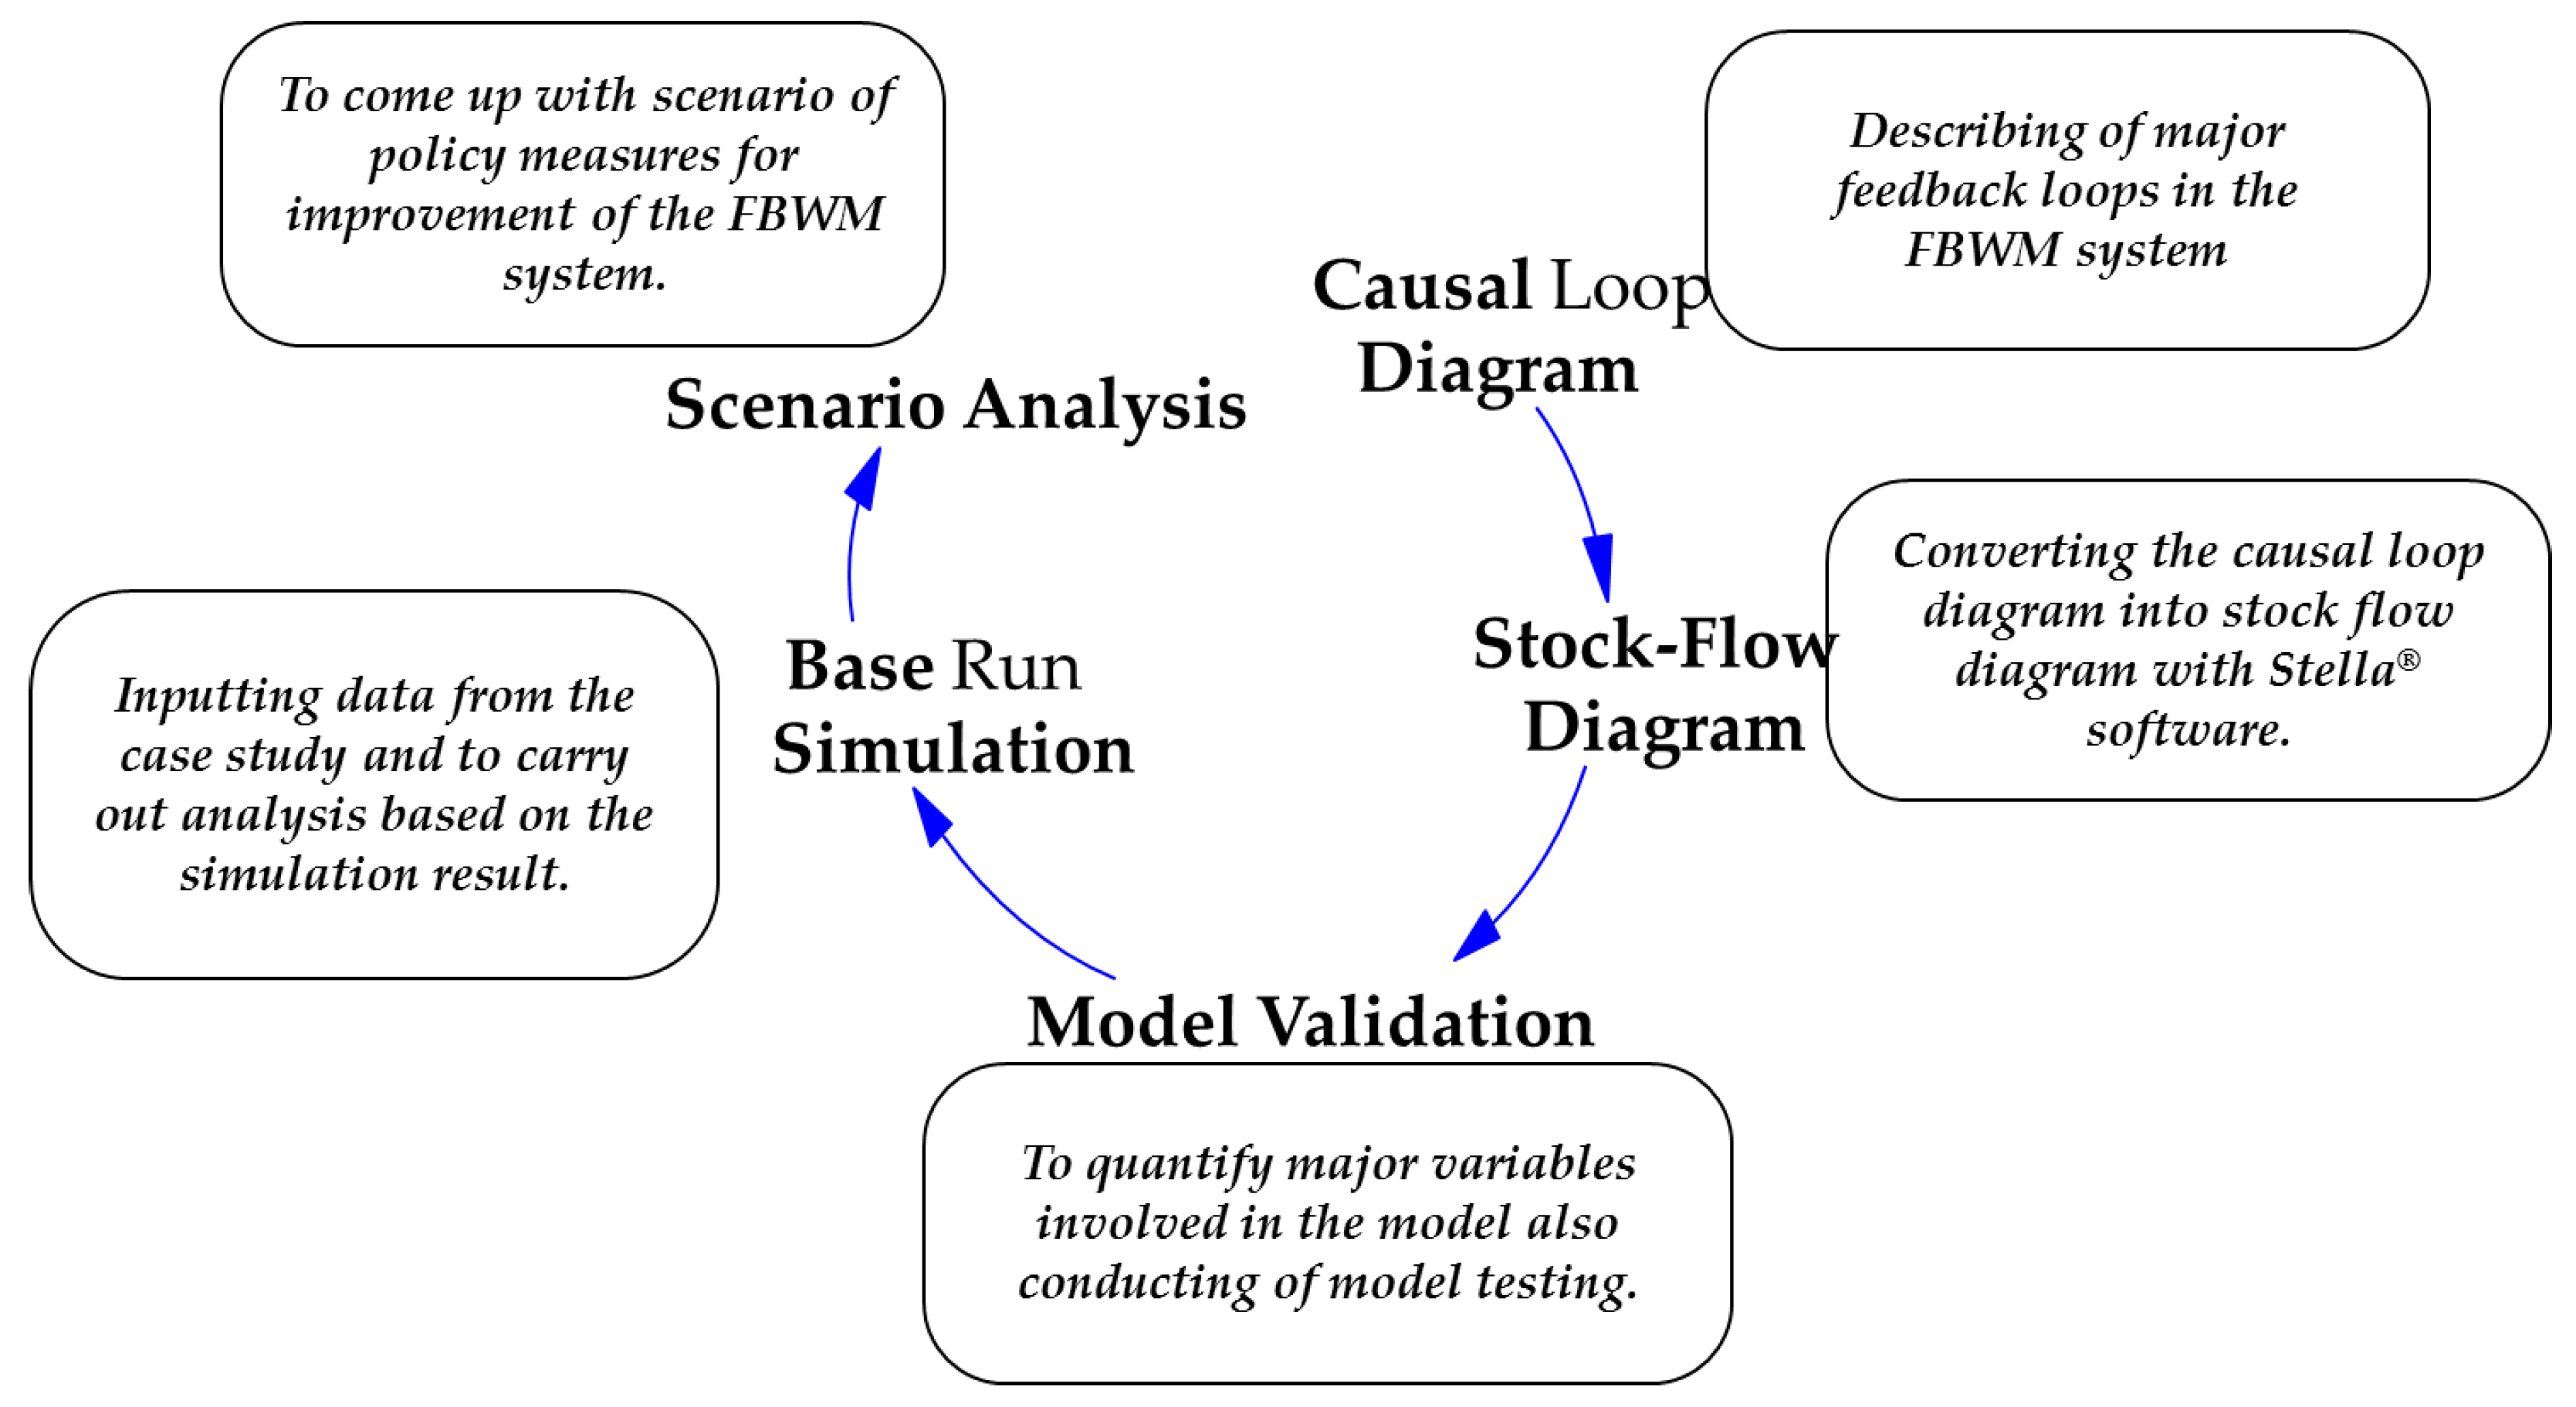
2.2. System Dynamics Model Development

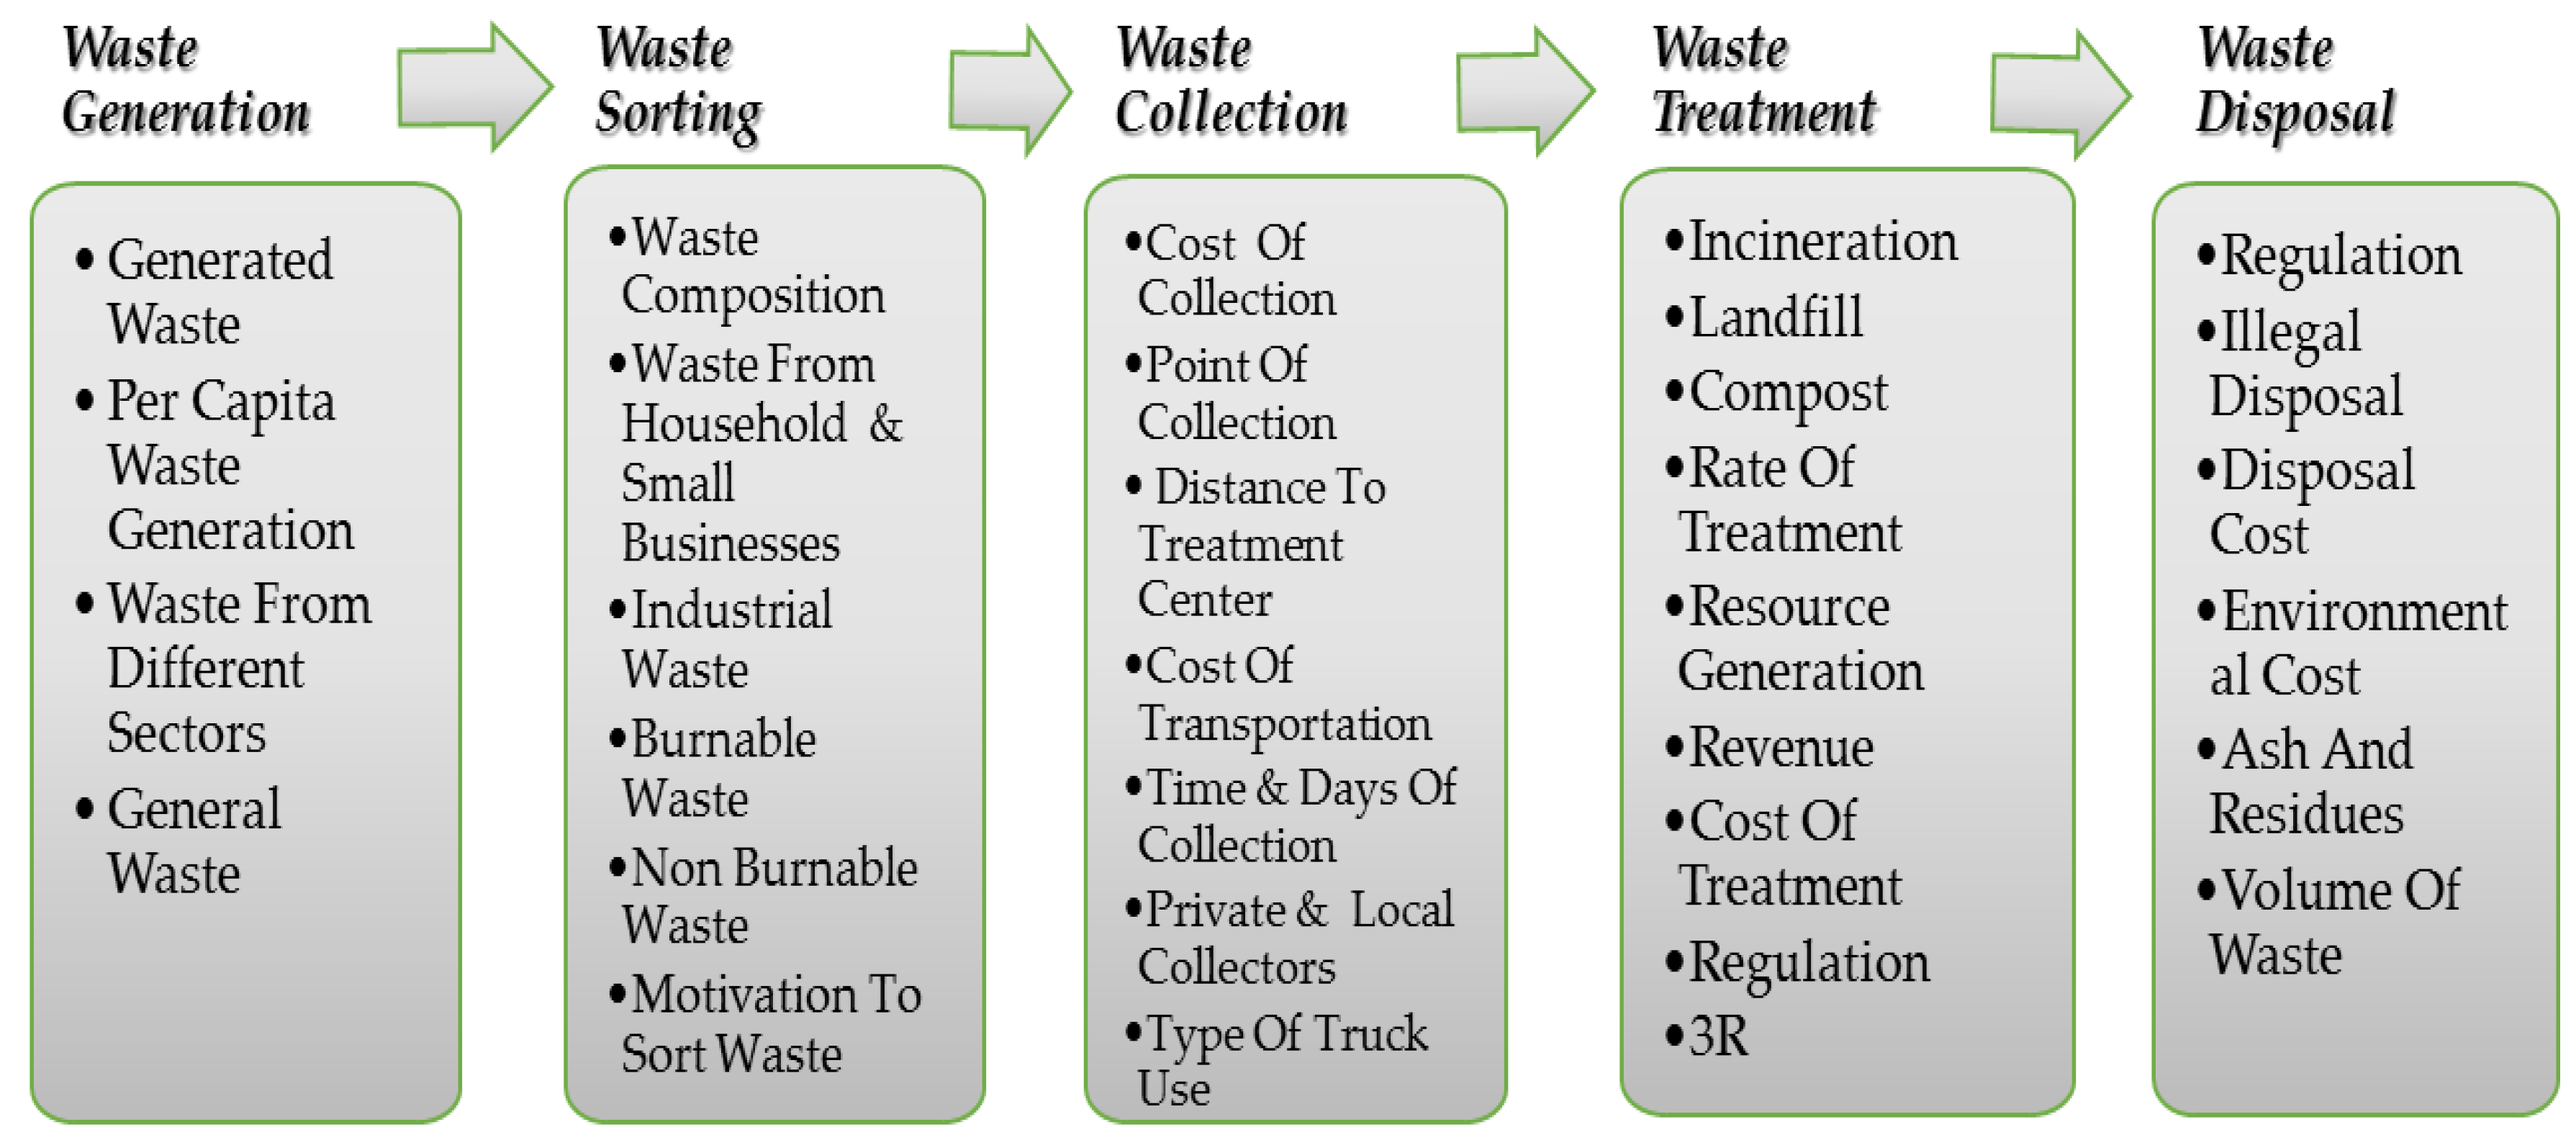
2.2.1. Articulation of the Problems

The recent developments in Japan have been towards promoting different national policies that place a high emphasis on the recovery of carbon-rich and biodegradable waste through material recycling [6,38]. Amidst these national policies is the promotion of the utilization of a recyclable food waste act known as the Food Recycling Law; the Sound Material-Cycle Society in the act references the Biomass Nippon Strategy [6,14,38]. Oita Prefecture is essentially implementing this policy, with its own Oita zero-waste strategy [39]. This strategy promotes the use of FBW as a primary material for ethanolization and bio-gasification technologies [5]. It also includes measures and legislation to carry out recycling through biomass gasification, conversion of solid fuel combined with sewage sludge and animal waste, and the application of the feed-in tariff (FiT) mechanism. For this cause, the proposed framework could contribute to a significant measure to the support of the above strategy, which may perhaps also provide solutions to MSW problems in the prefecture.
Awareness of issues related to FBW management in Oita City is on the increase and has brought about more challenging and related issues in the MSW management stream. Different policies have been put in place, but still some of these challenging issues remain and pose hindrance to MSW management. As most cities in Japan still consider waste generation, separation, collection, recycling/treatment, and disposal as independent operations, and yet, these components are closely interlinked (Figure 2).
Among these challenging issues is the amount of FBW generated by households and small food-related businesses. Presently, a total of 21,976 t of food and kitchen waste is generated per month, and the conditions of these generations show that the MSW generated contains a reasonable fraction (about 38.6%) of FBW [40]. It is difficult to distinguish between household and small food-related business once these wastes are placed at the collection points. FBW and other burnable waste types are sent straight to incineration, which is mostly handled by two incineration plants.
The unusual amount of waste generated was amidst the reasons for Oita City being chosen for this empirical study. Apparently, creation of these wastes is significantly more than the handling competence of the municipal government and local authorities. The city is struggling with inappropriate FBW treatment techniques, unlawful disposal, large amounts of FBW from small food-related businesses and households, the concern cost of treatment, as well as the impact on public health. The primary challenge is the reduction of the amount of FBW that is being treated in incineration facilities, and which mainly consists of agro-forest, food, kitchen, and garden waste. Consequently, this study proposes the use of system dynamics approach to analyze, illustrate, and investigate the benefit of separate treatment of FBW in the MSW management stream. As well as to understand the dynamic interactions between all aspects and elements of the current MSW management stream. It is anticipated that the dynamic interactions would strengthen the understanding of FBW as an integral part of the MSW management system.

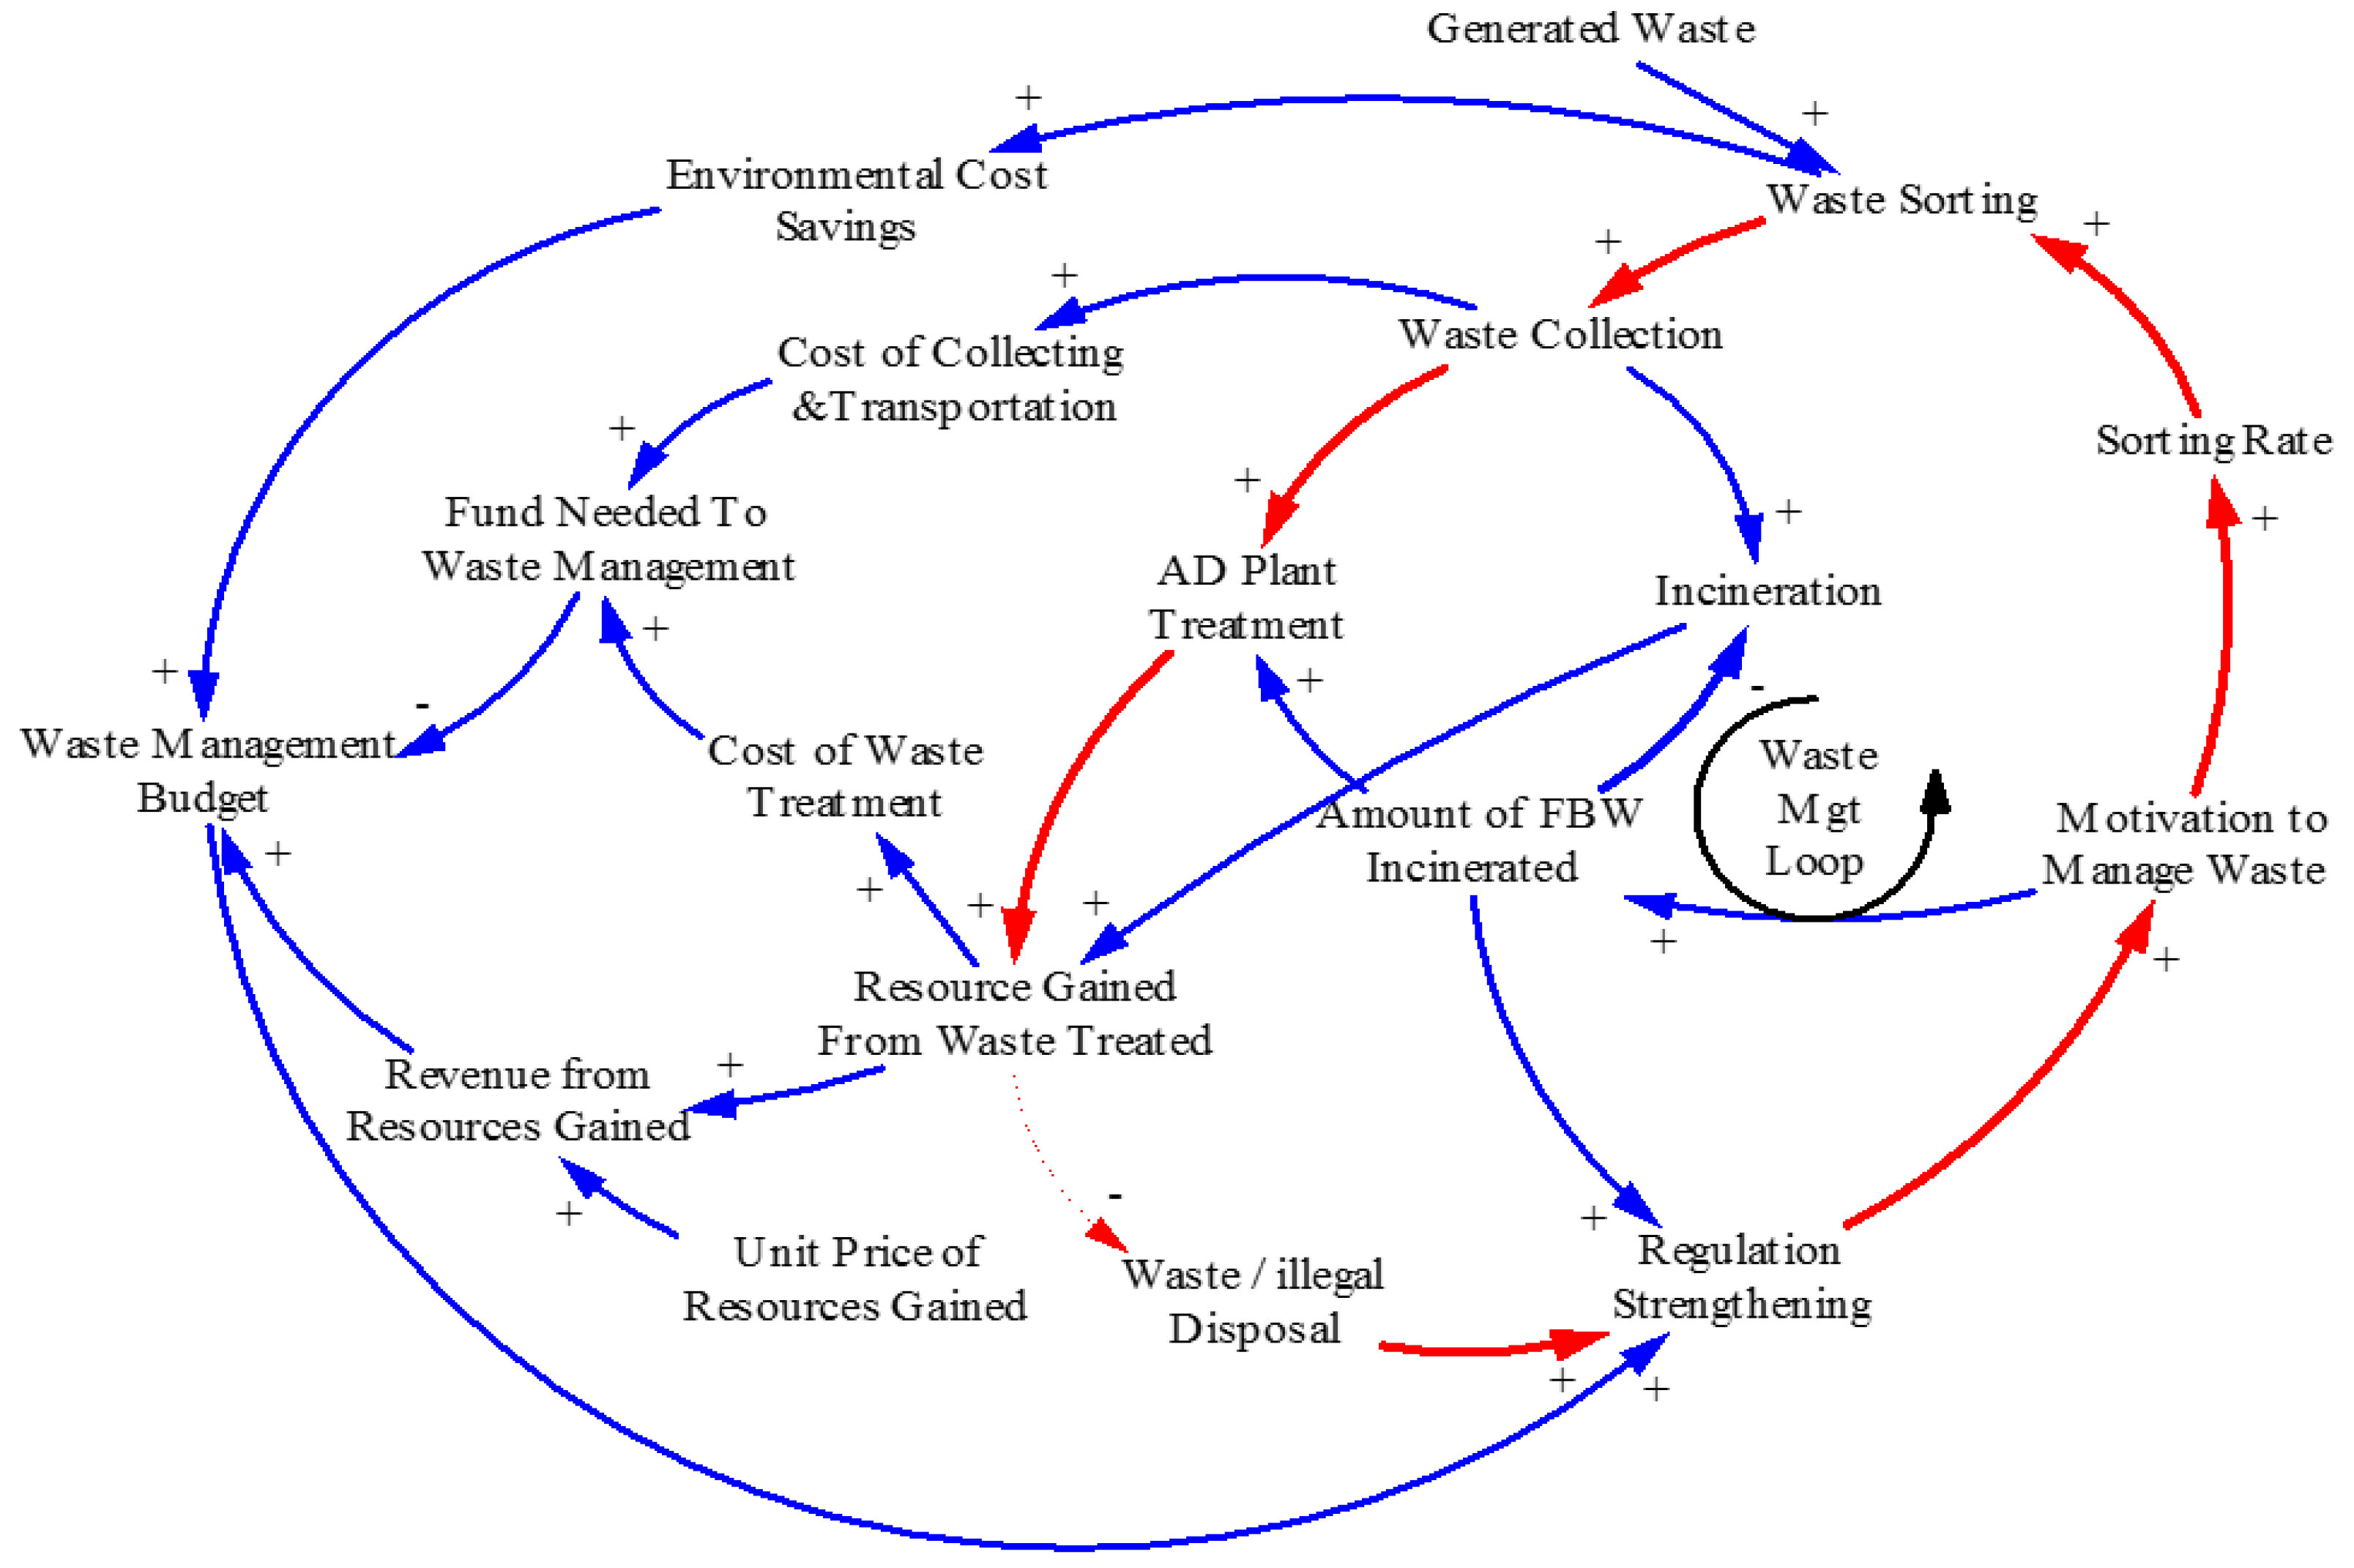
2.2.2. Causal Loop Diagram (CLD)

With respect to SD, causal loop diagrams (CLD) were applied to reveal the relationships of various systems. CLDs represent the information feedback in a system with the causal (i.e., cause-and-effect) relationship and loop, meaning a closed chain of cause-and-effect that generates the feedback [16]. It was applied in this study to illustrate the interrelationship through causalities (causes and effects) connecting several variables in the FBW management system, the extent of interconnectivity, and their dynamic circular influence on the main MSW management stream. In the CLD terminology, plus (+) or minus (–) sign at arrow heads were indicators showing positive or negative causal influence connecting two variables. However, the plus (+) sign symbolized a cause-and-effect relationship wherever the variables change in the same direction, while the minus (–) sign symbolized a change in the opposite direction of two variables. For instance, a plus (+) sign linking motivation to manage waste and sorting rate illustrated that an increase in motivation to manage waste would cause an increase in sorting rate, and vice versa. Additionally, the minus (–) sign linking incinerating percentage of FBW and incineration illustrated that a decrease in incinerating percentage of FBW would cause an increase in efficiency of incineration.
The CLD presented in this study is a conceptual model that targeted various aspects of MSW system and their dynamic interactions (Figure 3). The feedback loops were established by the dynamics of the CLD model presented in Figure 3. Generated waste was expected to be sorted at source, which is the current practice, and the sorted waste was collected from the collection centers and sent to AD treatment and incineration plants for treatment, respectively. The rate of waste sorting was largely dependent on the set regulation in order to avoid illegal waste disposal. The decrease in incineration of FBW would certainly yield benefits from/for both AD treatment and incineration plants that could be sold to generate revenue, which would in turn increase the waste management budget. Motivation to manage waste was influenced through reinforcement of regulation strengthening. Environmental cost savings was the cost saved by not sending FBW to landfill and dumping it illegally, which could be seen as a benefit of proper sorting of waste at source. Waste management budget was the overall financial benefit gained throughout the MSW stream, which was influenced by revenue generated from resource recovered from both AD treatment and incineration plant. Funds needed for waste management was the total cost incurred in the process of waste collection, transportation, maintenance and operation, and treatment. The only loop in the system was the waste management loop (a balancing loop), which was reinforced through regulation strengthening and waste management policy. Illegal waste disposal was reduced when material recovery is included as part of the MSW stream, which, in turn, strengthened regulation and waste management policies. The increase in illegal waste disposal would lead to the weakening and the demotivation to manage waste. As such, regulation played a very significant role in the entire MSW system.

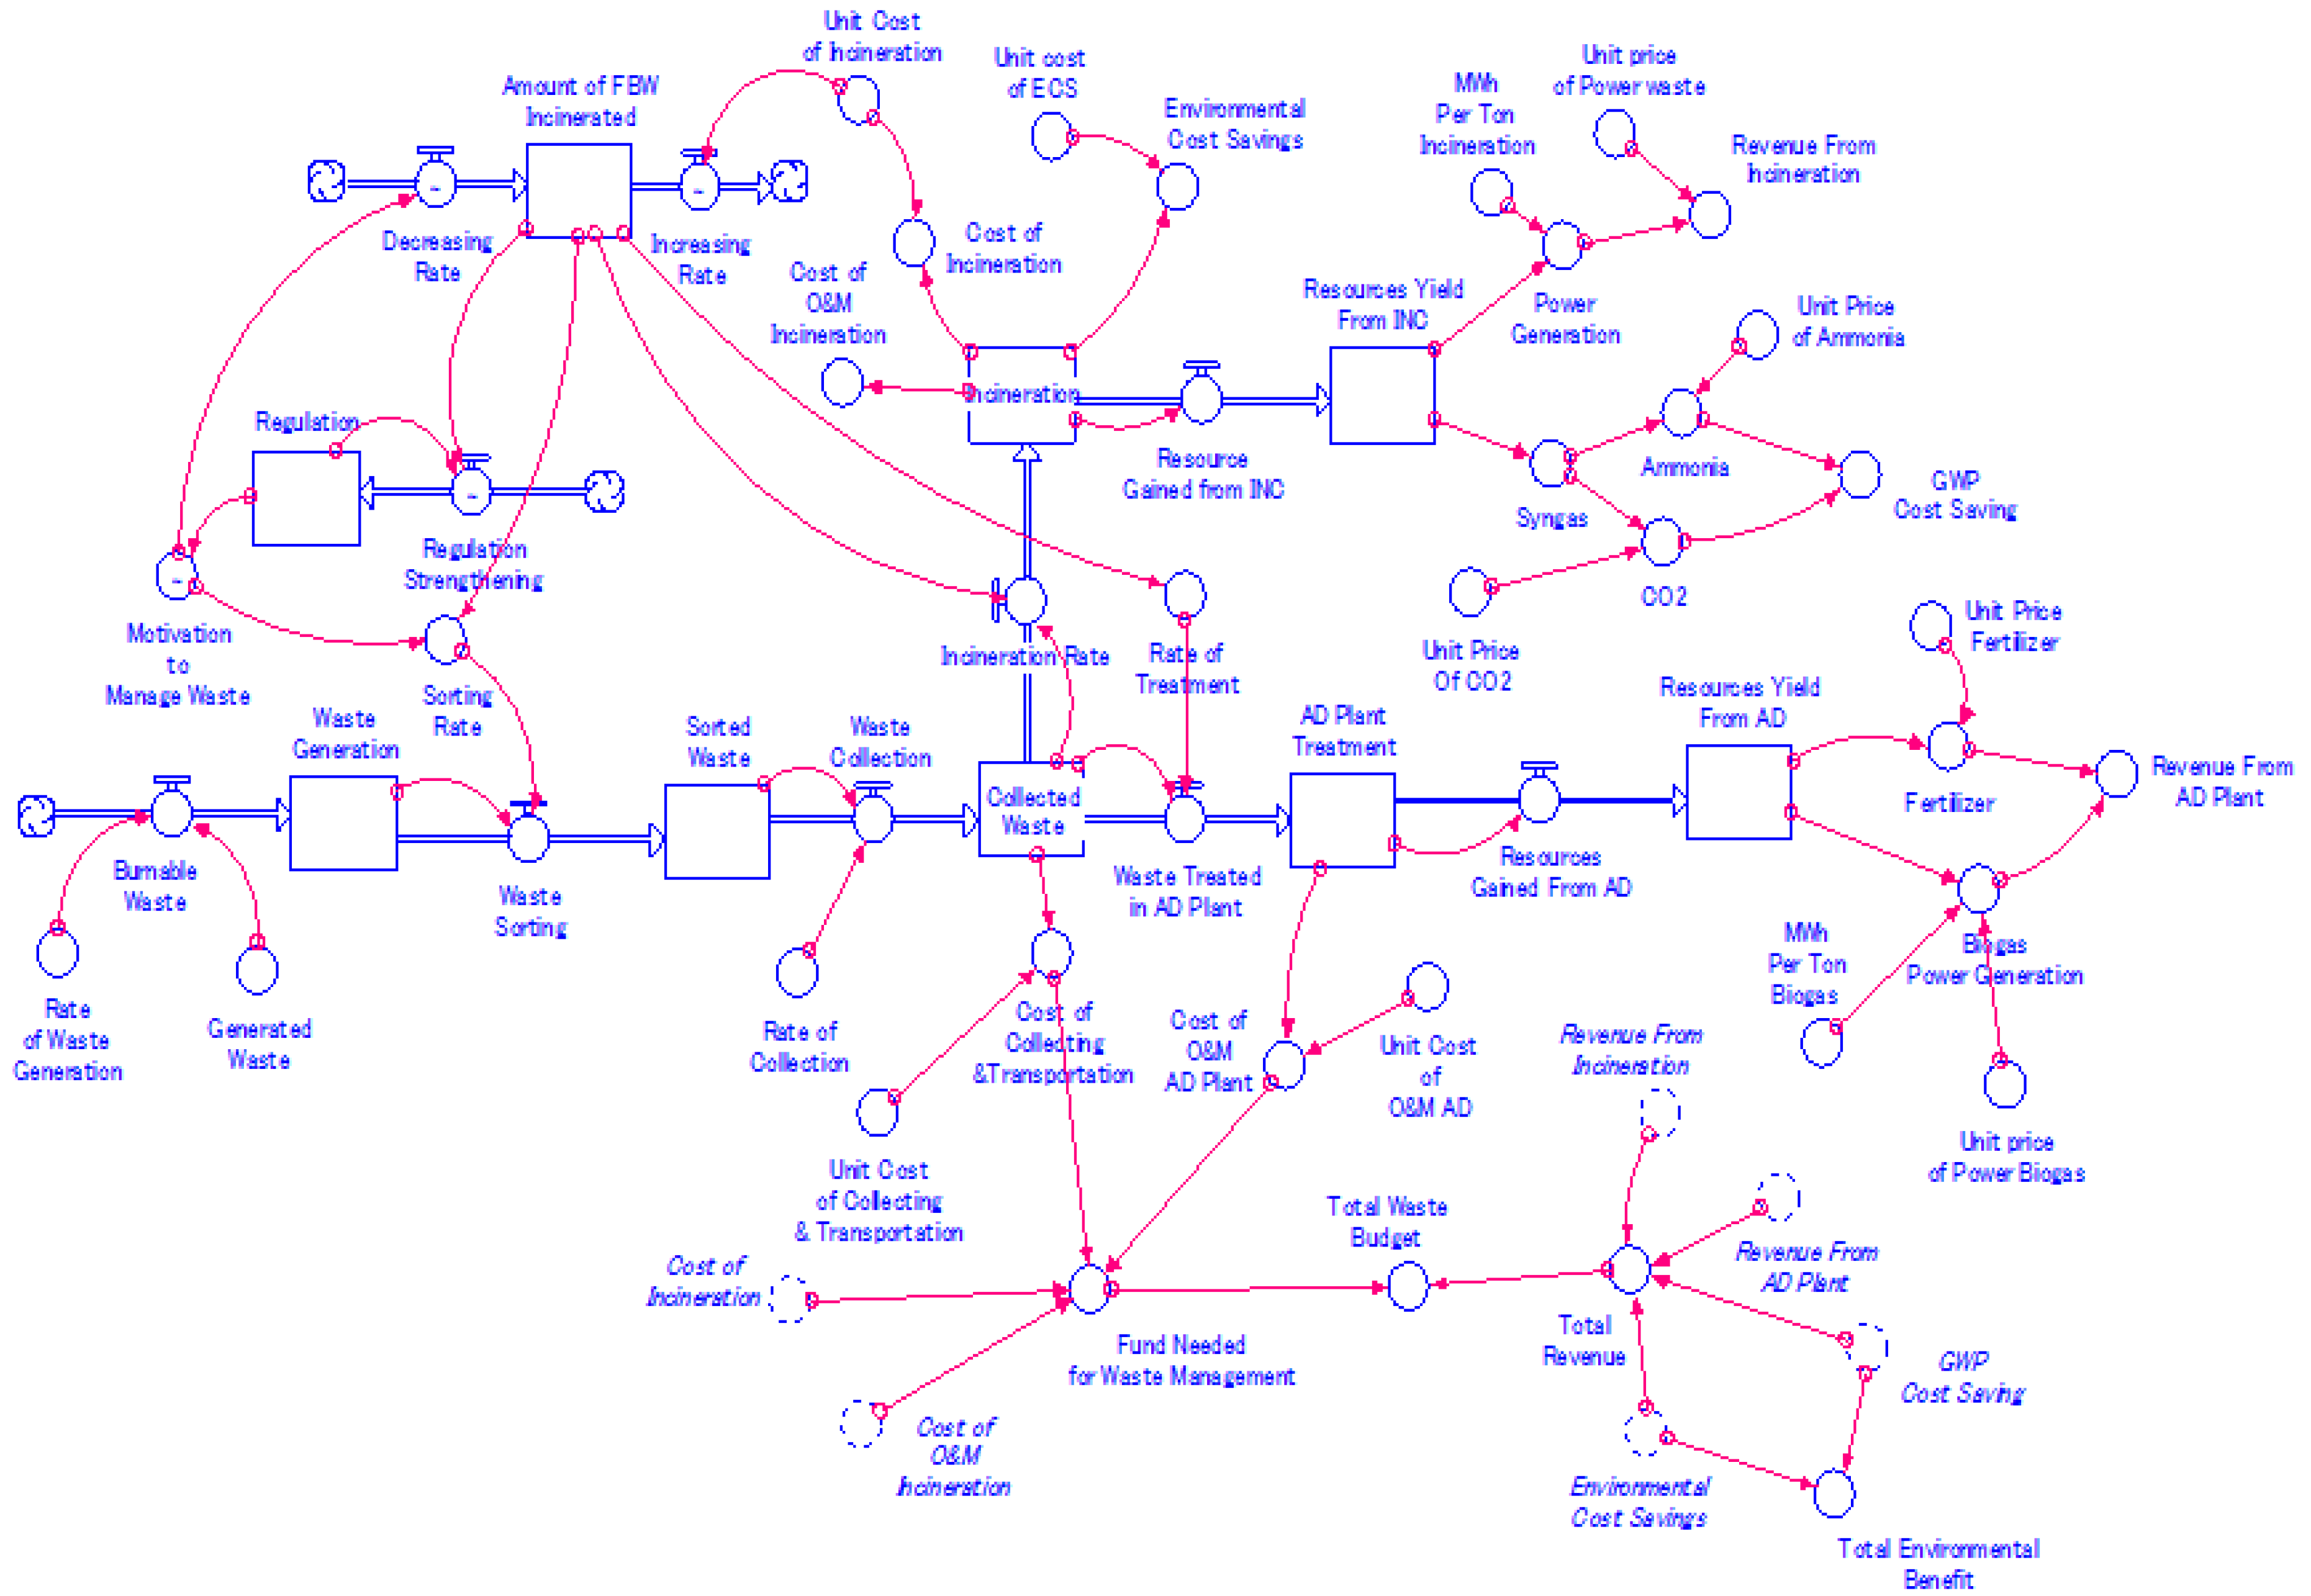
2.2.3. Stock and Flow Diagram

Based on the principles of MSW, the management of FBW is affected by different interdependent activities, which are dynamic and complex in nature. The dynamics and complexity are two of the reasons why we chose to use system dynamics approach in this study. STELLA® software was used to dynamically evaluate the model and simulate the management of FBW in Oita City. STELLA® is a tool that provides useful ways to visually and vividly communicate in terms of system thinking on how complex ideas and systems work together. There are four basic tools in the STELLA environment for model diagram development: stocks, flows, converters, and connectors. Consequently, this study followed the procedures mentioned earlier to construct this model for evaluating the stated objectives.
The corresponding stock and flow diagram to the CLD illustrated in Figure 3 is shown in Figure 4. These aspects and elements (variables) described in Figure 3 must be formulated into mathematical system equations to simulate and analyze the model. The stock and flow diagram contains the essential details that enable the model to be simulated. For better understanding and assumptions of all the variables, initial values and constants used in the model are given below. The essential elements and all the model system equations are illustrated in Appendix A.

2.2.4. Model Variable Estimation

The formulated variables in system equations need to be quantified before any simulation is performed. These variables were quantified using two methods. The first uses the graph function tool built in the STELLA® software to illustrate the interrelationship between any two variables. The second method consists of the constant variables, it contains the inputted data used in the simulation process and can influence other associated variables in the system. The data used for the quantitative simulation and analysis was collected from existing literature: Oita City waste management department, relevant research literature, official statistics, reports, interviews, and field observations. The data and initial values of all variables used for simulating and testing the model are illustrated in (the model equations) Appendix A. Table 1 summarizes the descriptions of the main variables used in the model.

2.2.5. Definition of Elements and Assumptions

Before proceeding to the validation and model testing it is crucial to explain the underlying assumptions in order to gain better understanding of the modeling process and applicability.
In Oita City, waste is usually separated at the point of generation into burnable, non-burnable and recyclable waste, and, for the benefit of this study, only burnable waste (about 78%) is considered. In addition, the composition of the total burnable waste is about 39% kitchen food waste and garden waste, while instant food containers, plastic containers of all sorts, tissue, cardboard and newspaper, book, cellophane wrap, and Styrofoam make up the remaining 62% [40]. However, in this model, waste generation was the total amount of burnable waste generated in Oita City per year and it was the product of burnable waste and rate of waste generation expressed in ton/year. The rate of waste generation was the amount of waste generated per capita in a year.
Sorted waste was the amount of waste that was already sorted to be collected and disposed/treated of in either an incineration plant or an AD treatment plant. In most cities in Japan waste is sorted at source/home, which makes it easier for collection, and this current practice was used as the basis for waste sorting in this model.
Regulation refers to the legislative guideline for MSW management that includes proper measures to encourage waste reduction and prevention, and waste harmfulness along with material recovery through recycling, reuse, reclamation of secondary raw materials (syngas), and energy recovery. Currently, the waste management regulation only allows for big food-related industries to manage their waste, while the small ones rely mainly on the local authorities. In this study, it was assumed that the situation will improve gradually over time as local authorities enforce regulation measure on the small food-related businesses to sort and send the FBW to be treated in an AD plant. In this case, regulation was set at the range of 0 to 1, where 0 is the worst case and 1 is the best case.
Resource yield (resource recovery) refers to the extraction of materials from waste after treatment in either an incineration plant or an AD treatment plant and this can be in the form of energy generation (power and heat), biogas, syngas (hydrogen gases), and fertilizer. It was assumed that these resources are readily available for market consumption.
In order to maximize the benefit of the already established waste and recycling market, it was important to know the quantities, locations, and potential demand for the various types of byproducts. Furthermore, demands for these byproducts may vary over time, which makes it essential to consider potential future developments in the various scenarios. In this study, the SD model was framed based on an assumed demand–supply balance, with the possibility to support the current and potential future waste market.
Funds needed for waste management is the total annual cost managing MSW and it includes the cost of treatments, operation and maintenance, and collection and transportation. Waste management budget refers to the annual total available fund for MSW management and it is the sum total of all revenue from sold resource recovered minus the fund needed for waste management.
The increase in motivation to manage waste could significantly enhance the reduction of incinerating FBW. It was assumed that motivation to manage waste is affected by regulation and subsequently influences the reduction of the amount of FBW incinerated. In this case, the graph function was used to illustrate this interrelationship.
A total of 80% of the general waste (MSW) generated in Japan is incinerated and only 28% of these incineration plants have the capability of energy recovery [5,51]. In this study, incineration refers to an energy recovery incineration plant (gasification plants) with the potential of producing syngas, chemical products, synthetic fuels, ammonia, hydrogen, electric power, and the ability to capture carbon dioxide.

3. Simulation Results and Discussion

3.1. Model Testing and Validation

After describing the assumption and variables used in the SDs model we must ascertain whether the model implements the assumptions correctly, and whether the assumptions, which were made, were reasonable with respect to the objectives of the study. Hence, it was essential to test and validate the model to gain confidence in the robustness and reliability of its output and the information extracted corresponding and representing the stated objective of the study. Validation was carried out using methods of validation suggested by Sterman [20] and Ford [16]. These tests included: (a) model verification, (b) detailed model check (boundary and structure adequacy test), (c) dimensional consistent tests, (d) time step adequacy test, and (e) the extreme condition test.
(a) Model verification is concerned with whether the model has all the essential assumptions and variables that are representative of the objectives of the study. This test was achieved by checking if all variables in the CLD are consistent with the SDs model. Subsequently, the test showed that each of the variables and assumptions were closely linked to the objectives of the study, which was to examine the benefit of FBW management in the MSW management system.
(b) Detailed model check (boundary and structural validation) is useful in confirming the logical and essential structure of the model. This was done by comparing the CLD and the SDs model with the real-life MSW management system. Apparently, the feedback loops and cause-and-effect chains illustrated in both the CLD and the SDs model were founded upon acknowledged knowledge in MSW management.
(c) Dimensional consistent tests entail that all measurement units in the SD model conformed to physical laws. The “units check” function in the STELLA® software was used to achieve this task and confirmed that all units of measurement and dimensions were satisfactory.
(d) Time step adequacy test allows the SDs model to be tested on the rate at which the numerical integration is conducted, which in the case of this model was one year. In other words, time step adequacy test subjects a model that has been created with a defined time step by changing the value of its delta time (DT) in order to examine the model at a different time step. The test was performed by decreasing the time step to half a year, as suggested by Sterman [20], and further tests of quarter to one tenth of a year were also conducted. Apparently, there were no significant changes in the behavior of the simulated results.
(e) The extreme condition test was performed to examine the model system behavior and whether logical results could be achieved when extreme parameter values were applied. For example, the parameters “Resources Yield from AD Plant” and “Amount of FBW Incinerated” were used as illustrations (in Figure 5) to investigate how “Resources Yield from AD Plant” would change when extreme values were assigned to “Amount of FBW Incinerated.” The test result in Figure 5 illustrates the resultant value of “Resources Yield from AD Plant” while changing the value of “Amount of FBW Incinerated” from 0.00 to 4.00 in five scenarios. In the case where “Amount of FBW Incinerated” was assigned to zero, a rapid increase of treated FBW and resources yield in AD plan was expected. In other words, as the amount of FBW incinerated decreases the more the yield increases in resources from AD plant due to more treatment of FBW (the lower the amount of FBW incinerated, the higher the yield in resources from the AD plant). The test and verification results certified that the essential elements and parameters that define and describe the dynamic behavior of the real MSW management system in detail were integrated in the SDs model. In addition, behavior verification test was used to compare the simulated result with actual data collected from the Oita City waste department (from 2008 to 2014) and the model behaved as expected [52]. Consequently, it can be concluded that since the test results were achieved, and the SDs model showed a significant amount of reliability, confidence, and robustness, it can be used for in-depth analysis and policy simulation.

3.2. Simulation Analysis

The SDs model was used to simulate and analyze the MSW management system in Oita City, and it was set to run over a period of 30 years, from 2011 to 2041, with 2011 being the base year. The simulation was performed in two parts; the first part was the base run simulation with focus on the MSW management, and the second part was the analysis of different scenarios of policy measure such as “regulation” and “unit cost of incineration” on “sorted waste,” “total environmental benefit,” “total waste management budget,” and “amount of FBW incinerated.”

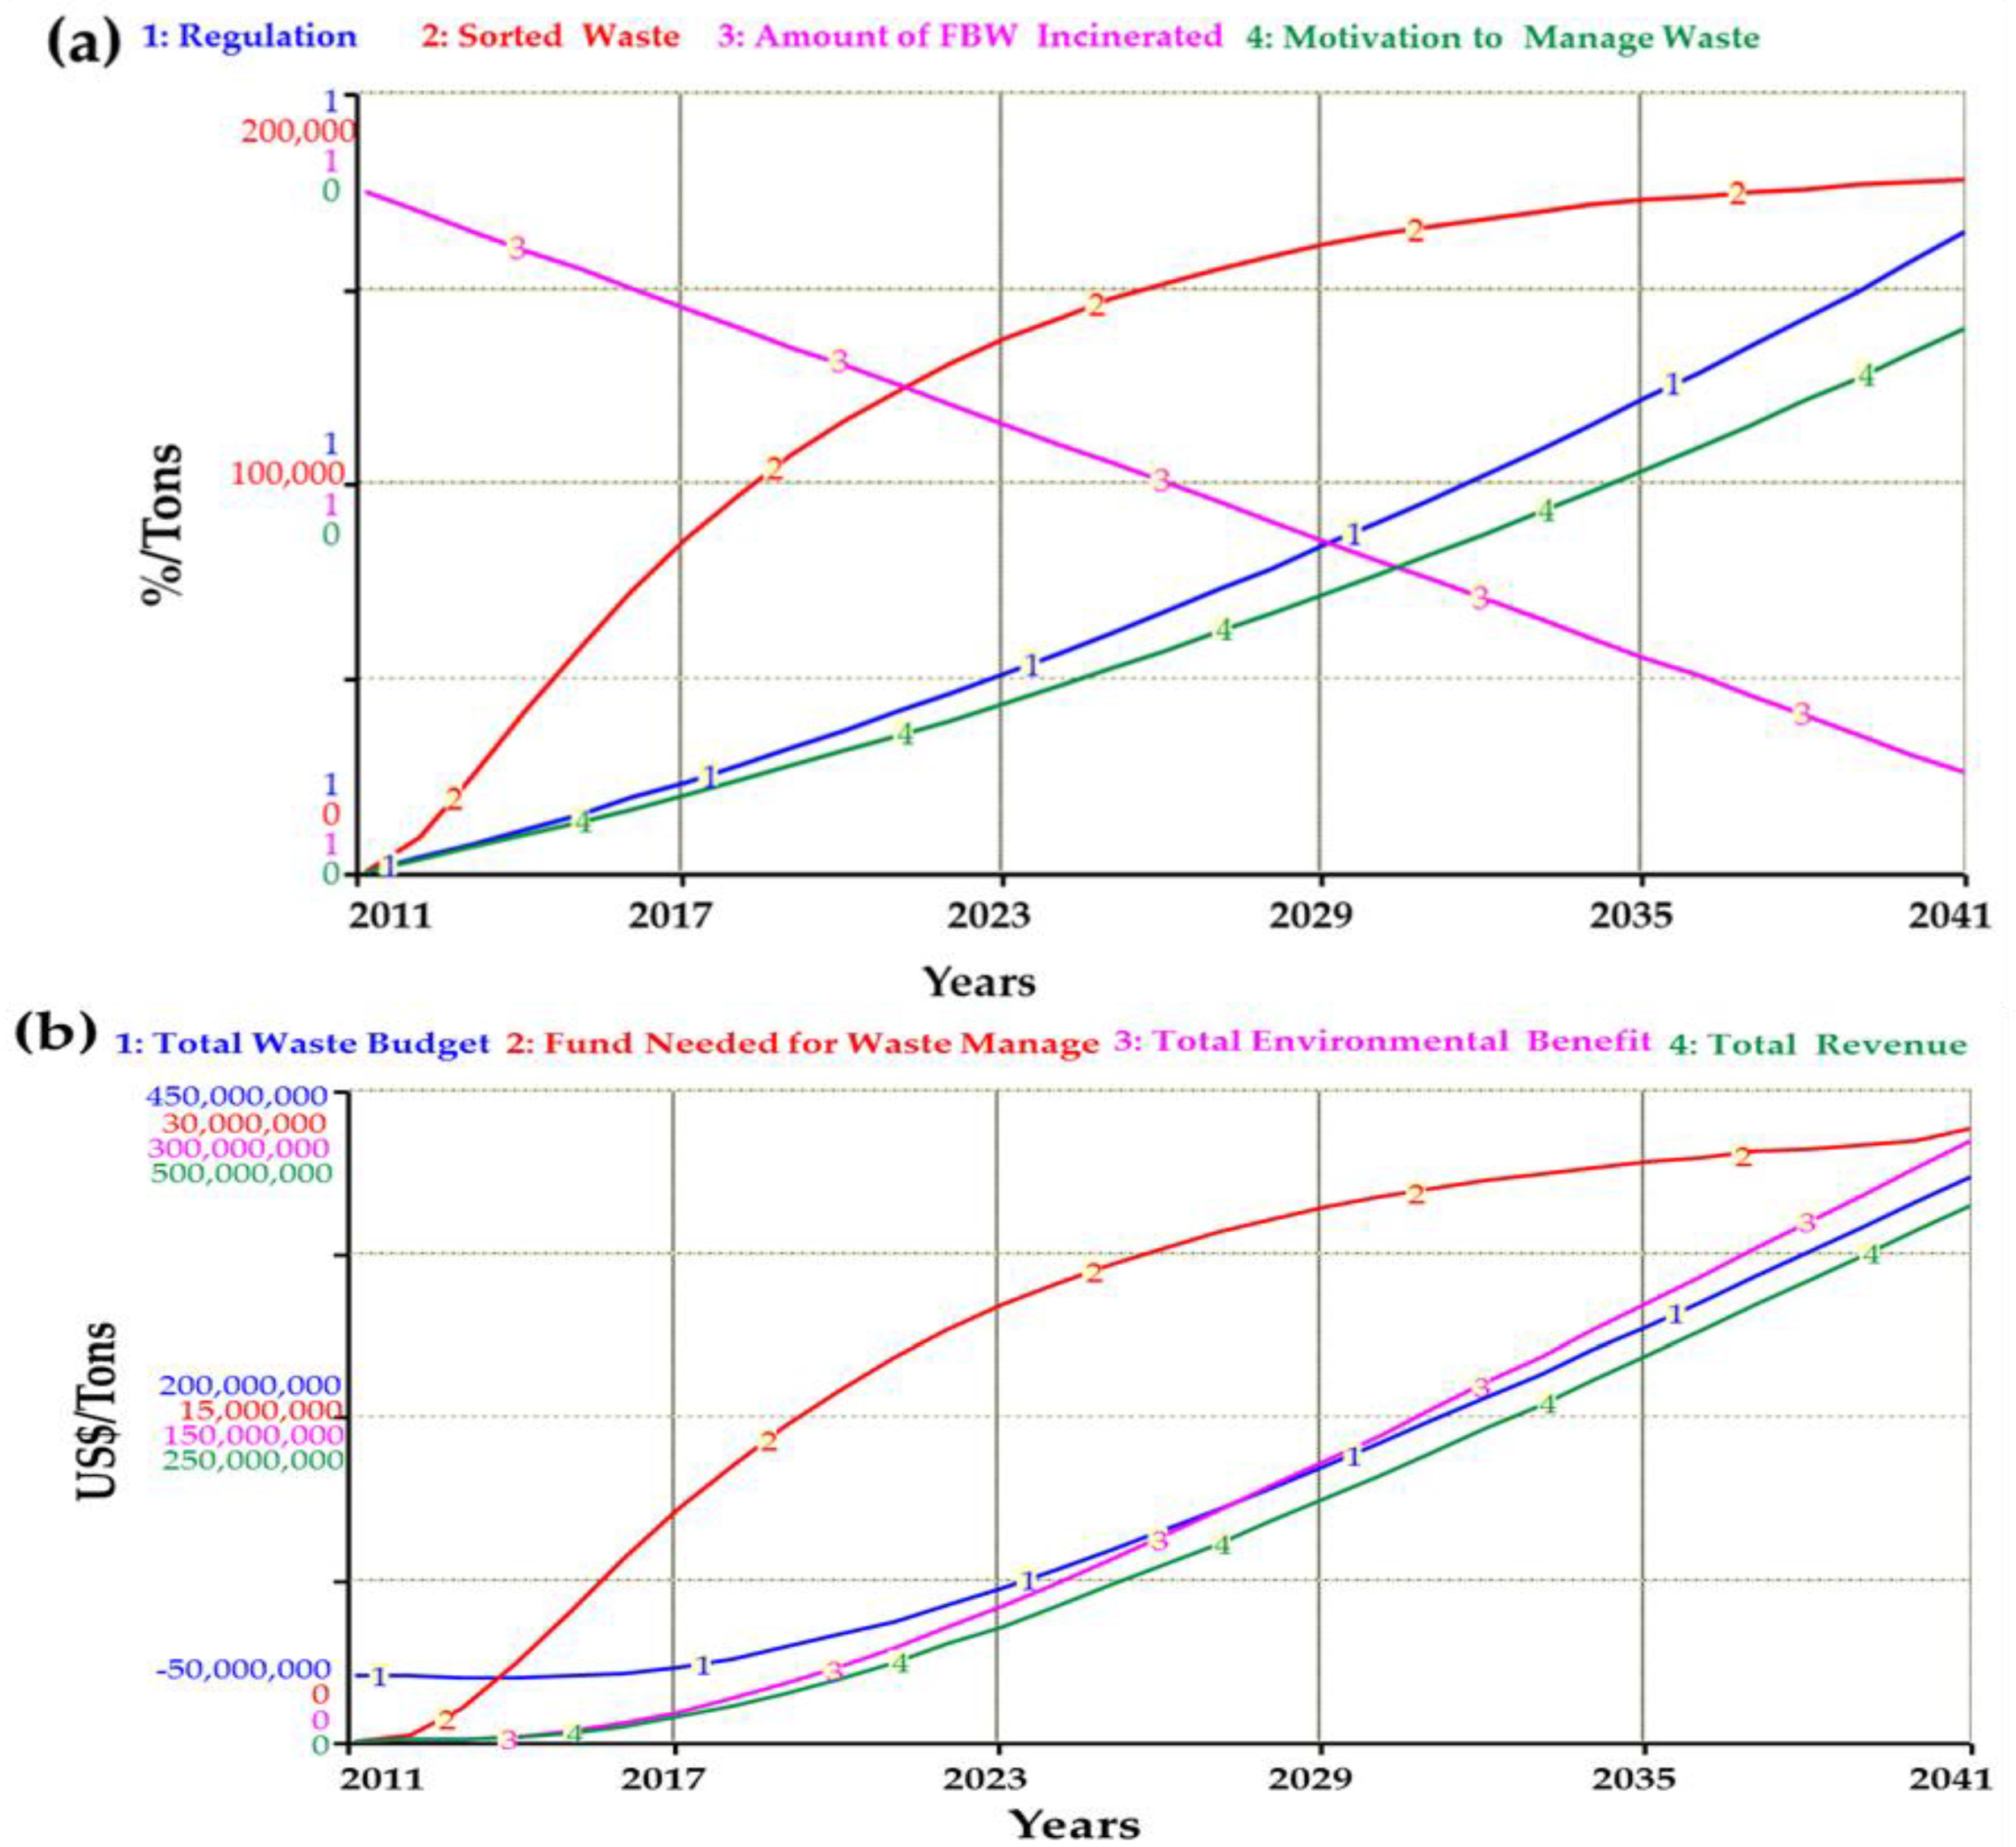
3.2.1. Base Run Model

The base run simulation results were achieved by using parameter values illustrated in Table 1. These results show that regulation strengthens (increases) the necessity to manage waste (motivation to manage waste) increase due to increase in the amount of sorted waste (Figure 6a). Additionally, the rate of general waste (ton/year) increases with time, while the FBW generation (ton/year) is affected significantly by the level of sorting process at home or source of waste generation. As the amount of general waste grows, the sorted waste also increases attaining stability after the first eight years (i.e., 2018). The steady increase in the sorted waste would be adequate to provide bigger amounts of FBW to be the treated in the AD plant. The amount of FBW treated in the AD plant would increase as the amount of FBW incinerated decreases, also the total environmental benefit will increase as the amount of FBW incinerated decreases (Figure 6a). The amount of resources yield in both the incineration and AD plant increases with time; however, the amount of resources yield in incineration remains lower than that of the AD plant. The revenue generated from both the incineration and AD plant was added up to make the total waste management budget and approximately five years would be required for the total waste management budget to become positive, meaning income generation from 2016 is valuable to the MSW management system (Figure 6b). This implies that it would be beneficial to treat FBW separately. The base run results demonstrate that the use of an AD plant as a treatment for FBW would increase the efficiency of incineration.

3.2.2. Policy Scenarios Analysis

After examining the base run results, the policy scenarios analysis is focused on using different scenarios to study and investigate whether regulation measures and unit cost of incineration could definitely contribute to the changes in sorted waste, amount of FBW incinerated, total waste management budget, and total environmental benefits. Thus, two sets of policy scenarios were developed to test the effect of separate treatment of FBW in the MSW management system:
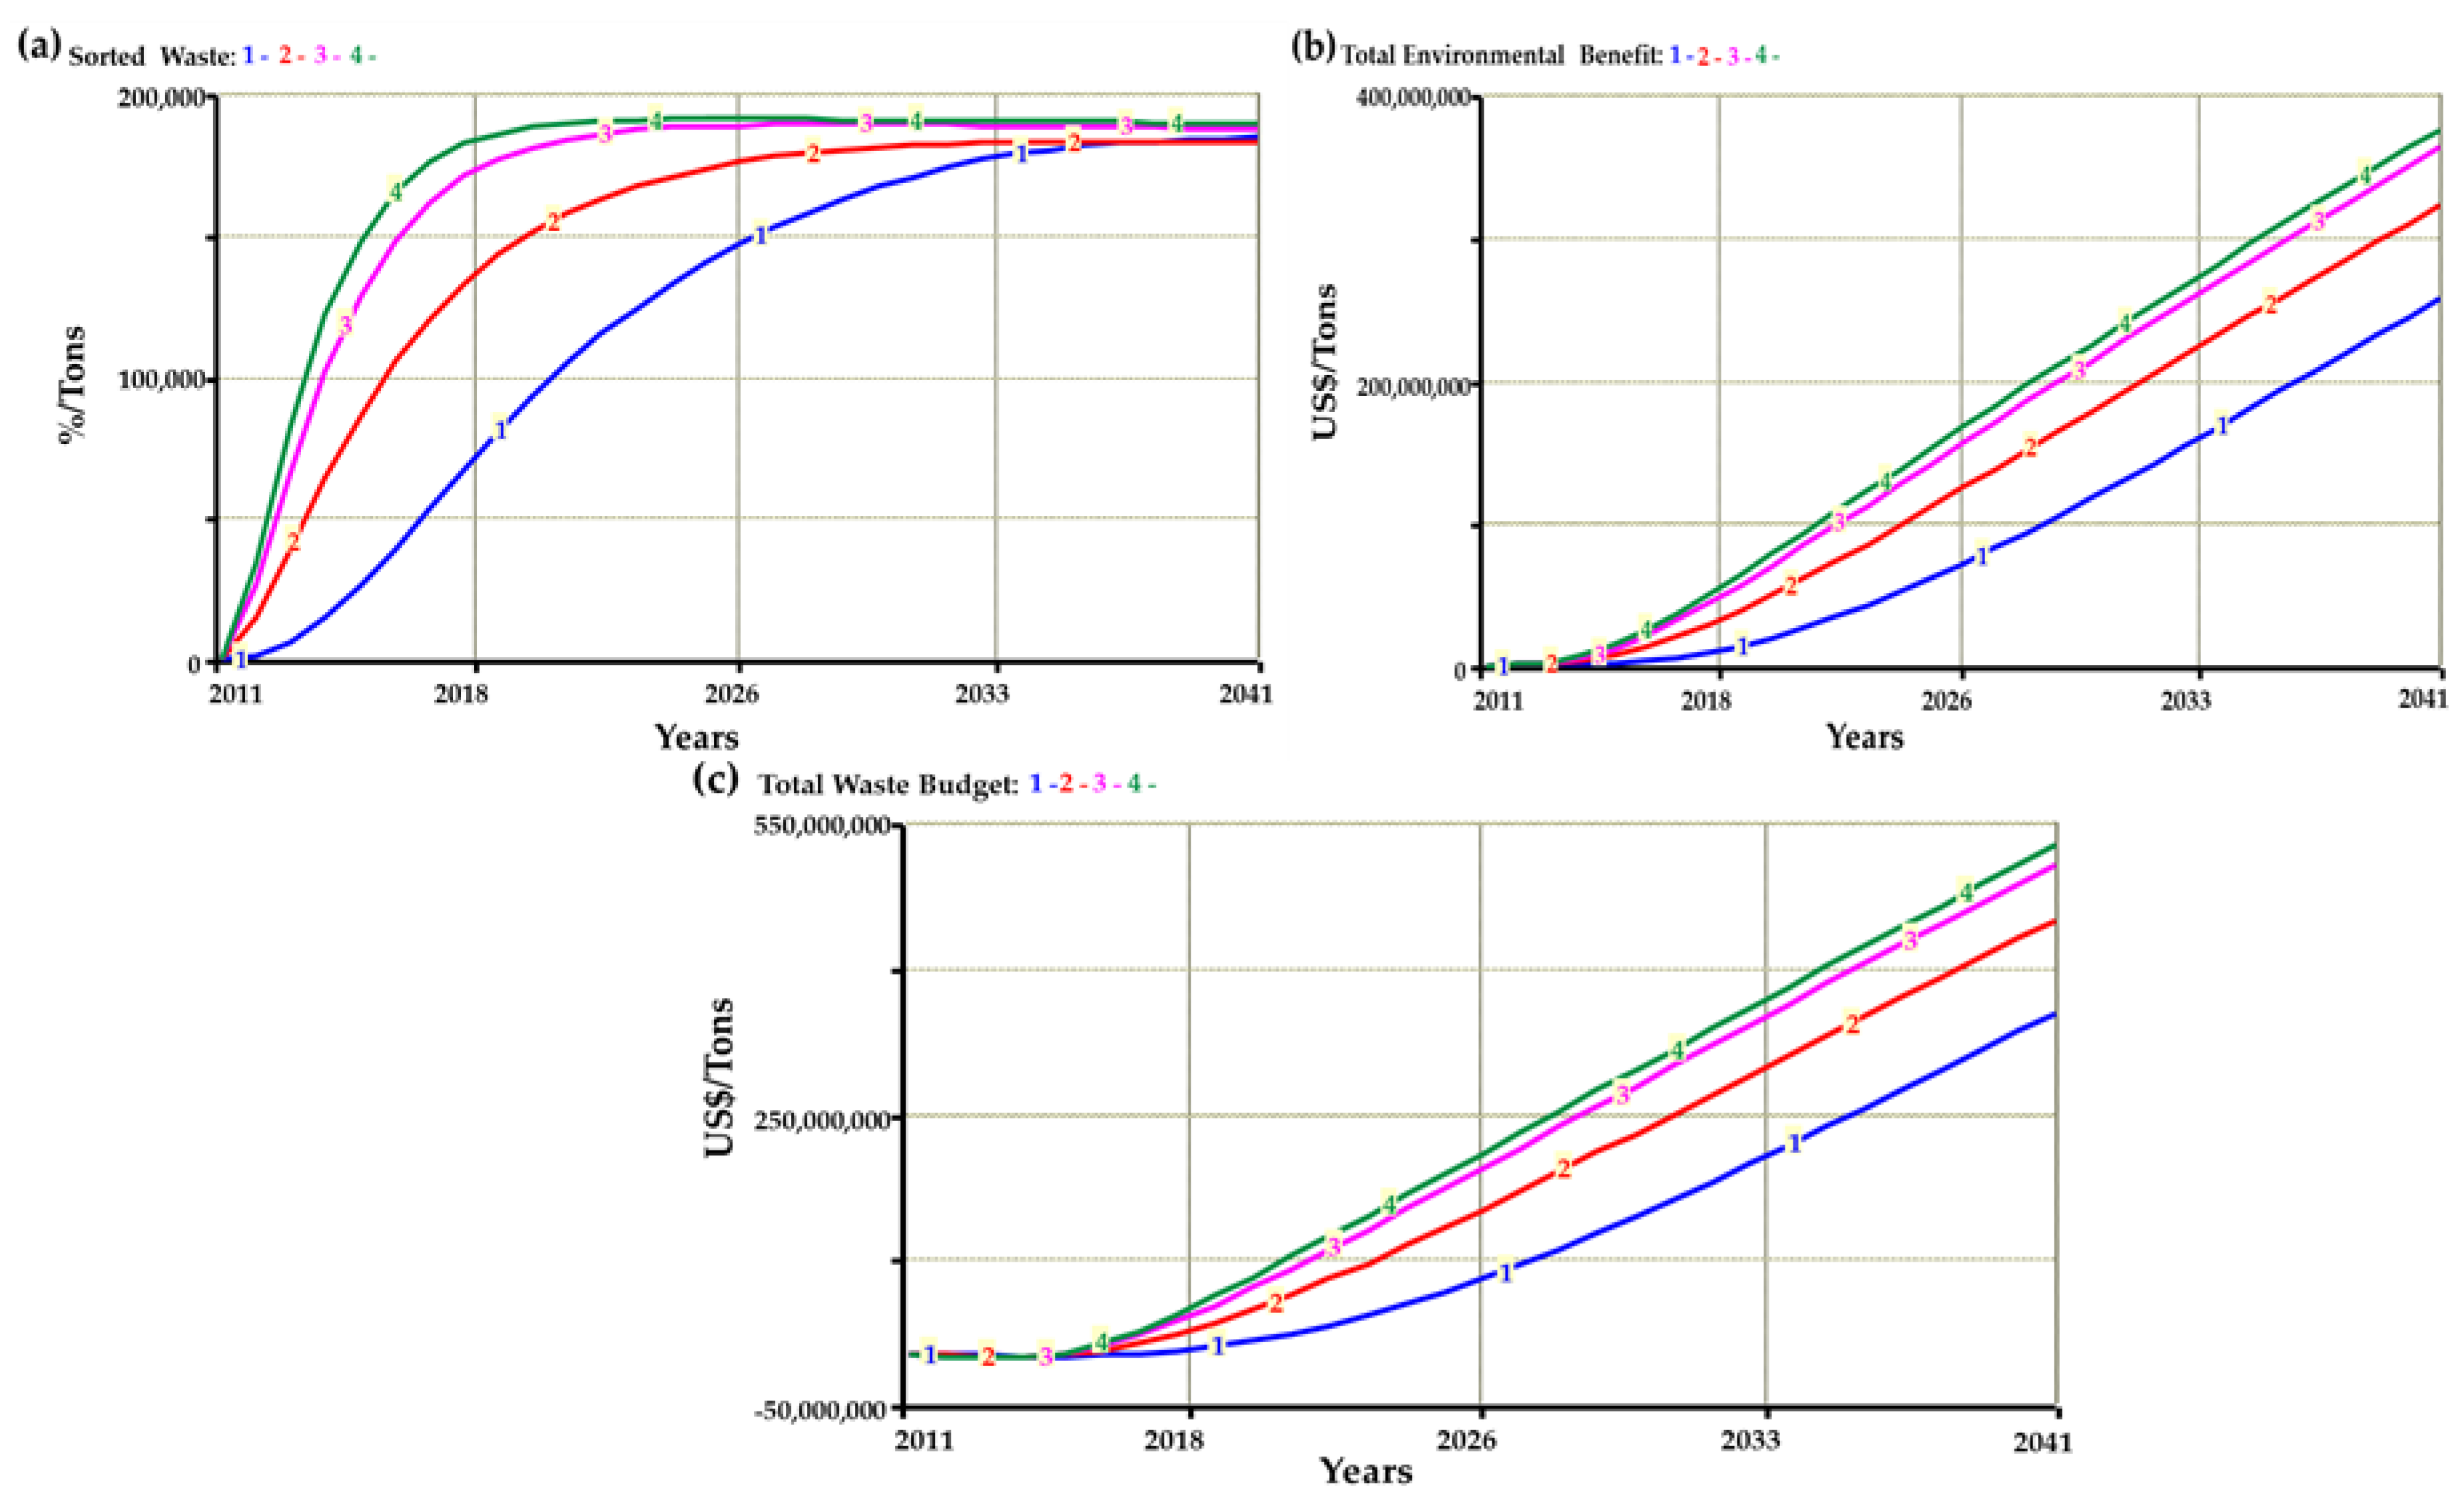
  • Policy Scenario 1 (PS1): This policy scenario analysis is concerned with whether improvements in the regulation would have an effect on the amount of sorted waste, total waste management budget, and total environmental benefits. Four alternative values of regulation (regulation strengthening) ranging from 0 to 6 (0, 2, 4, and 6, respectively) are assigned and simulated.
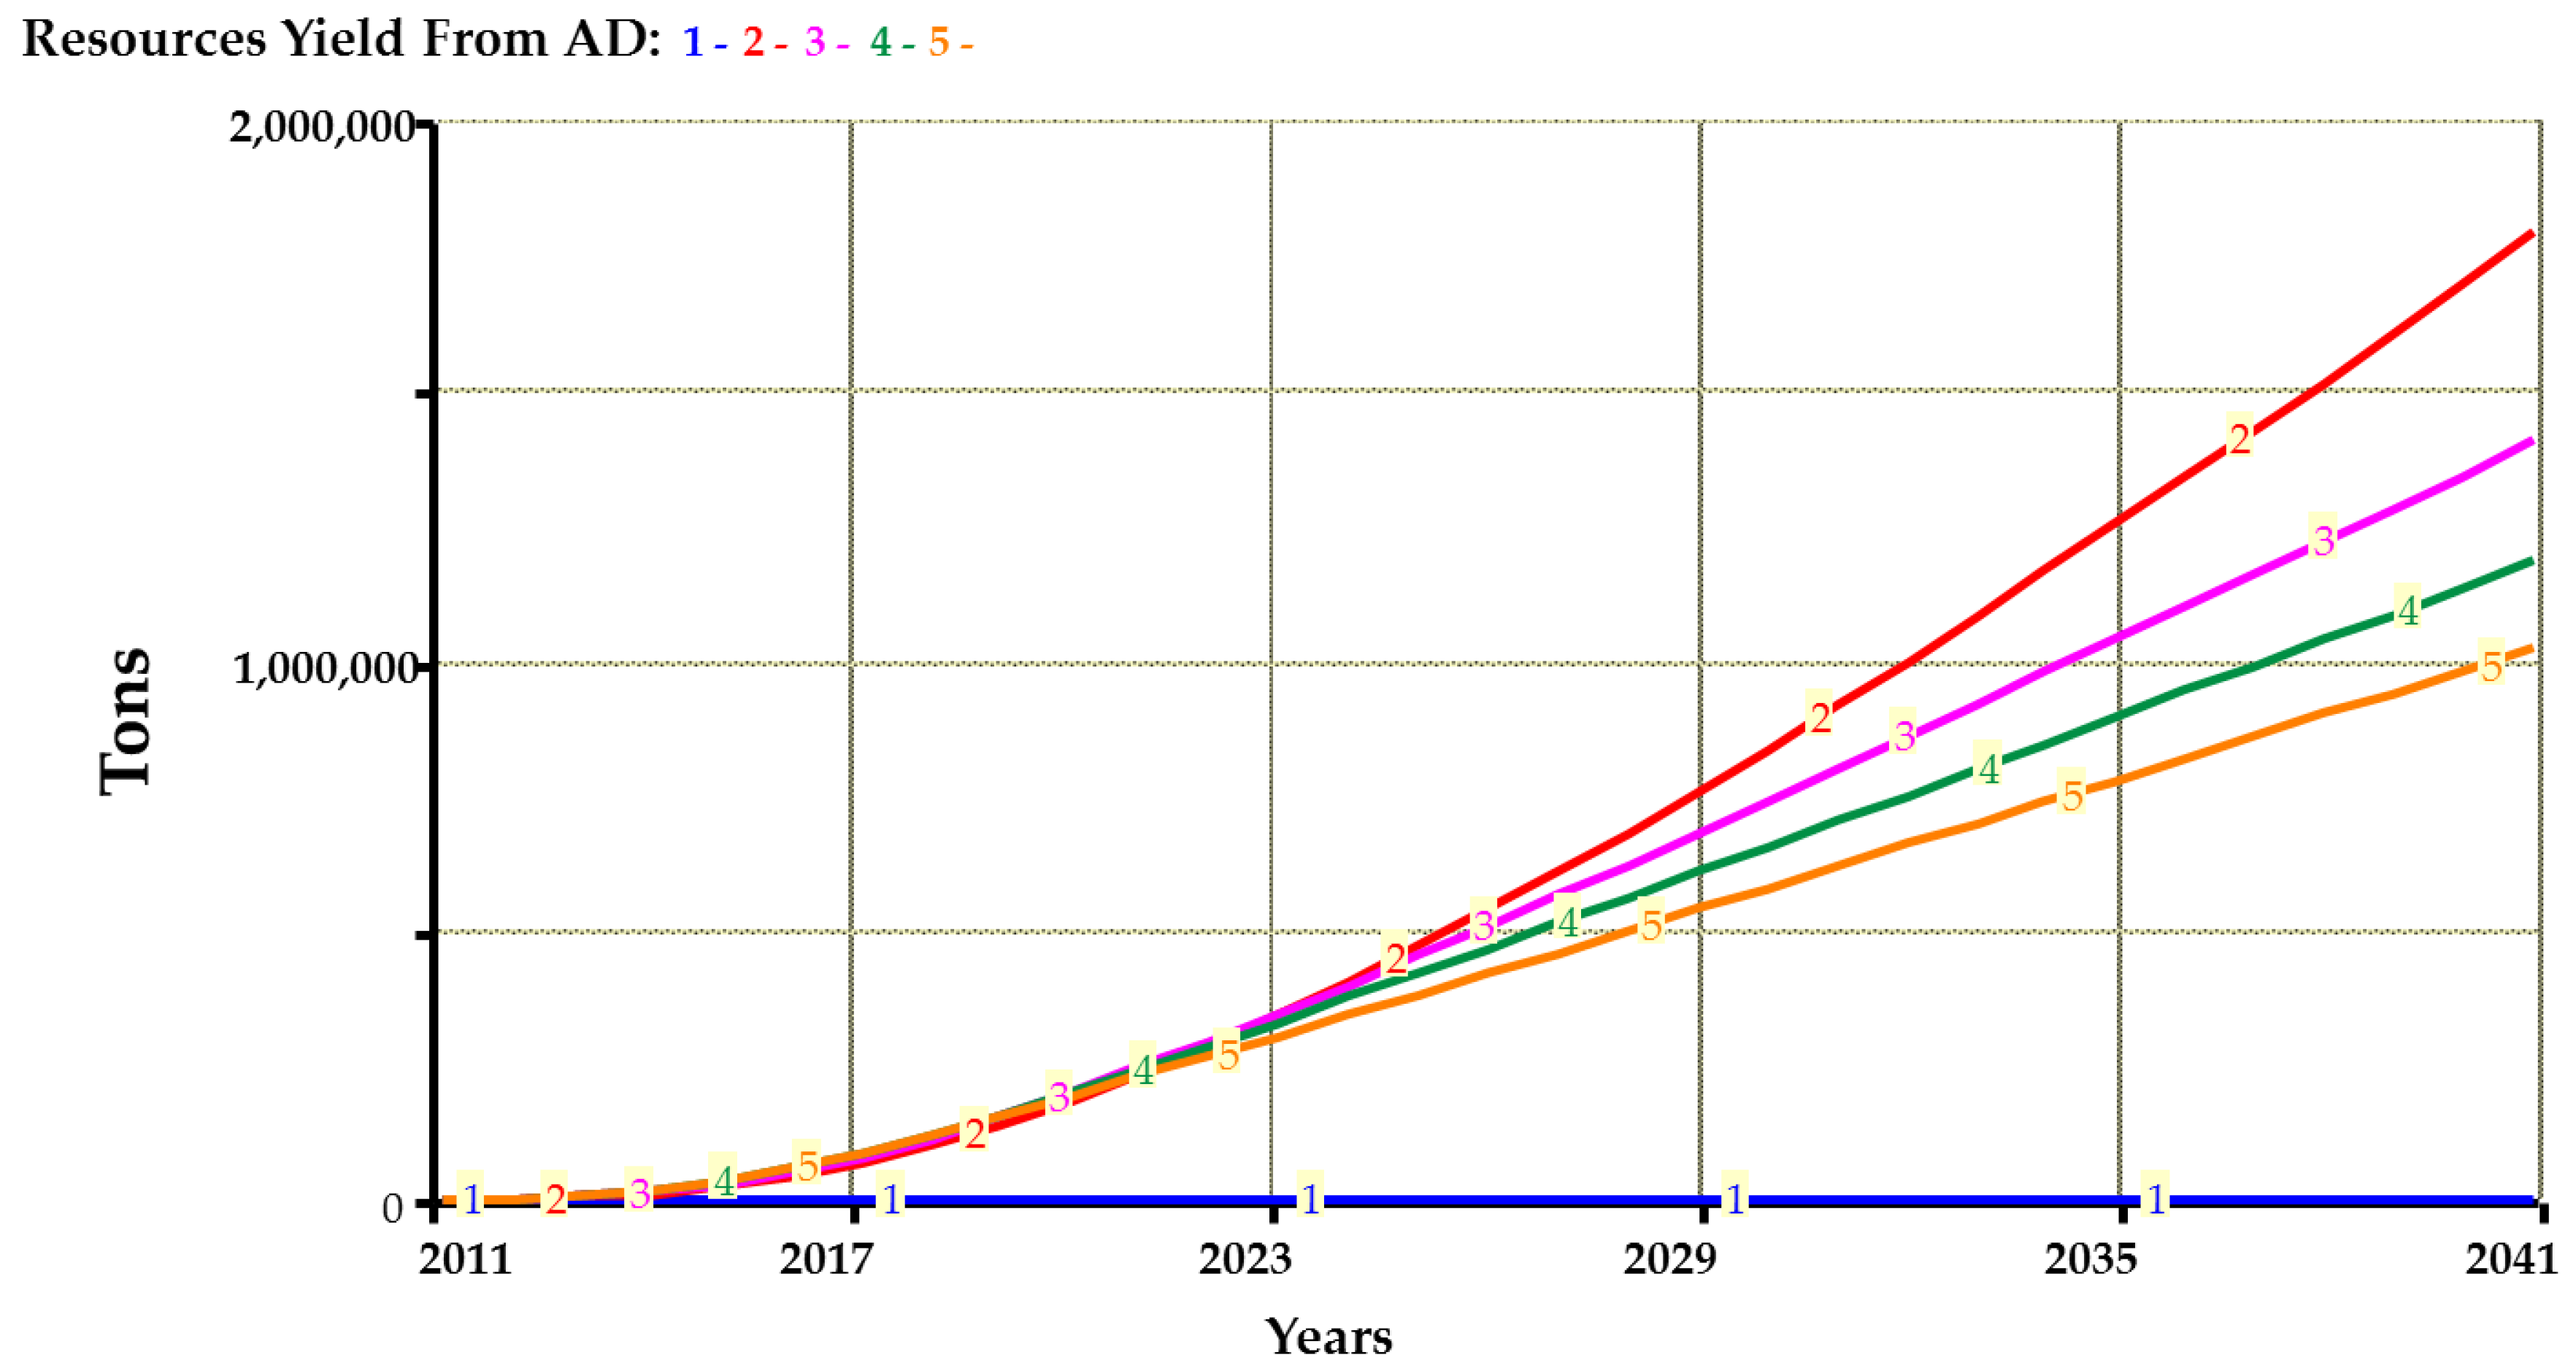
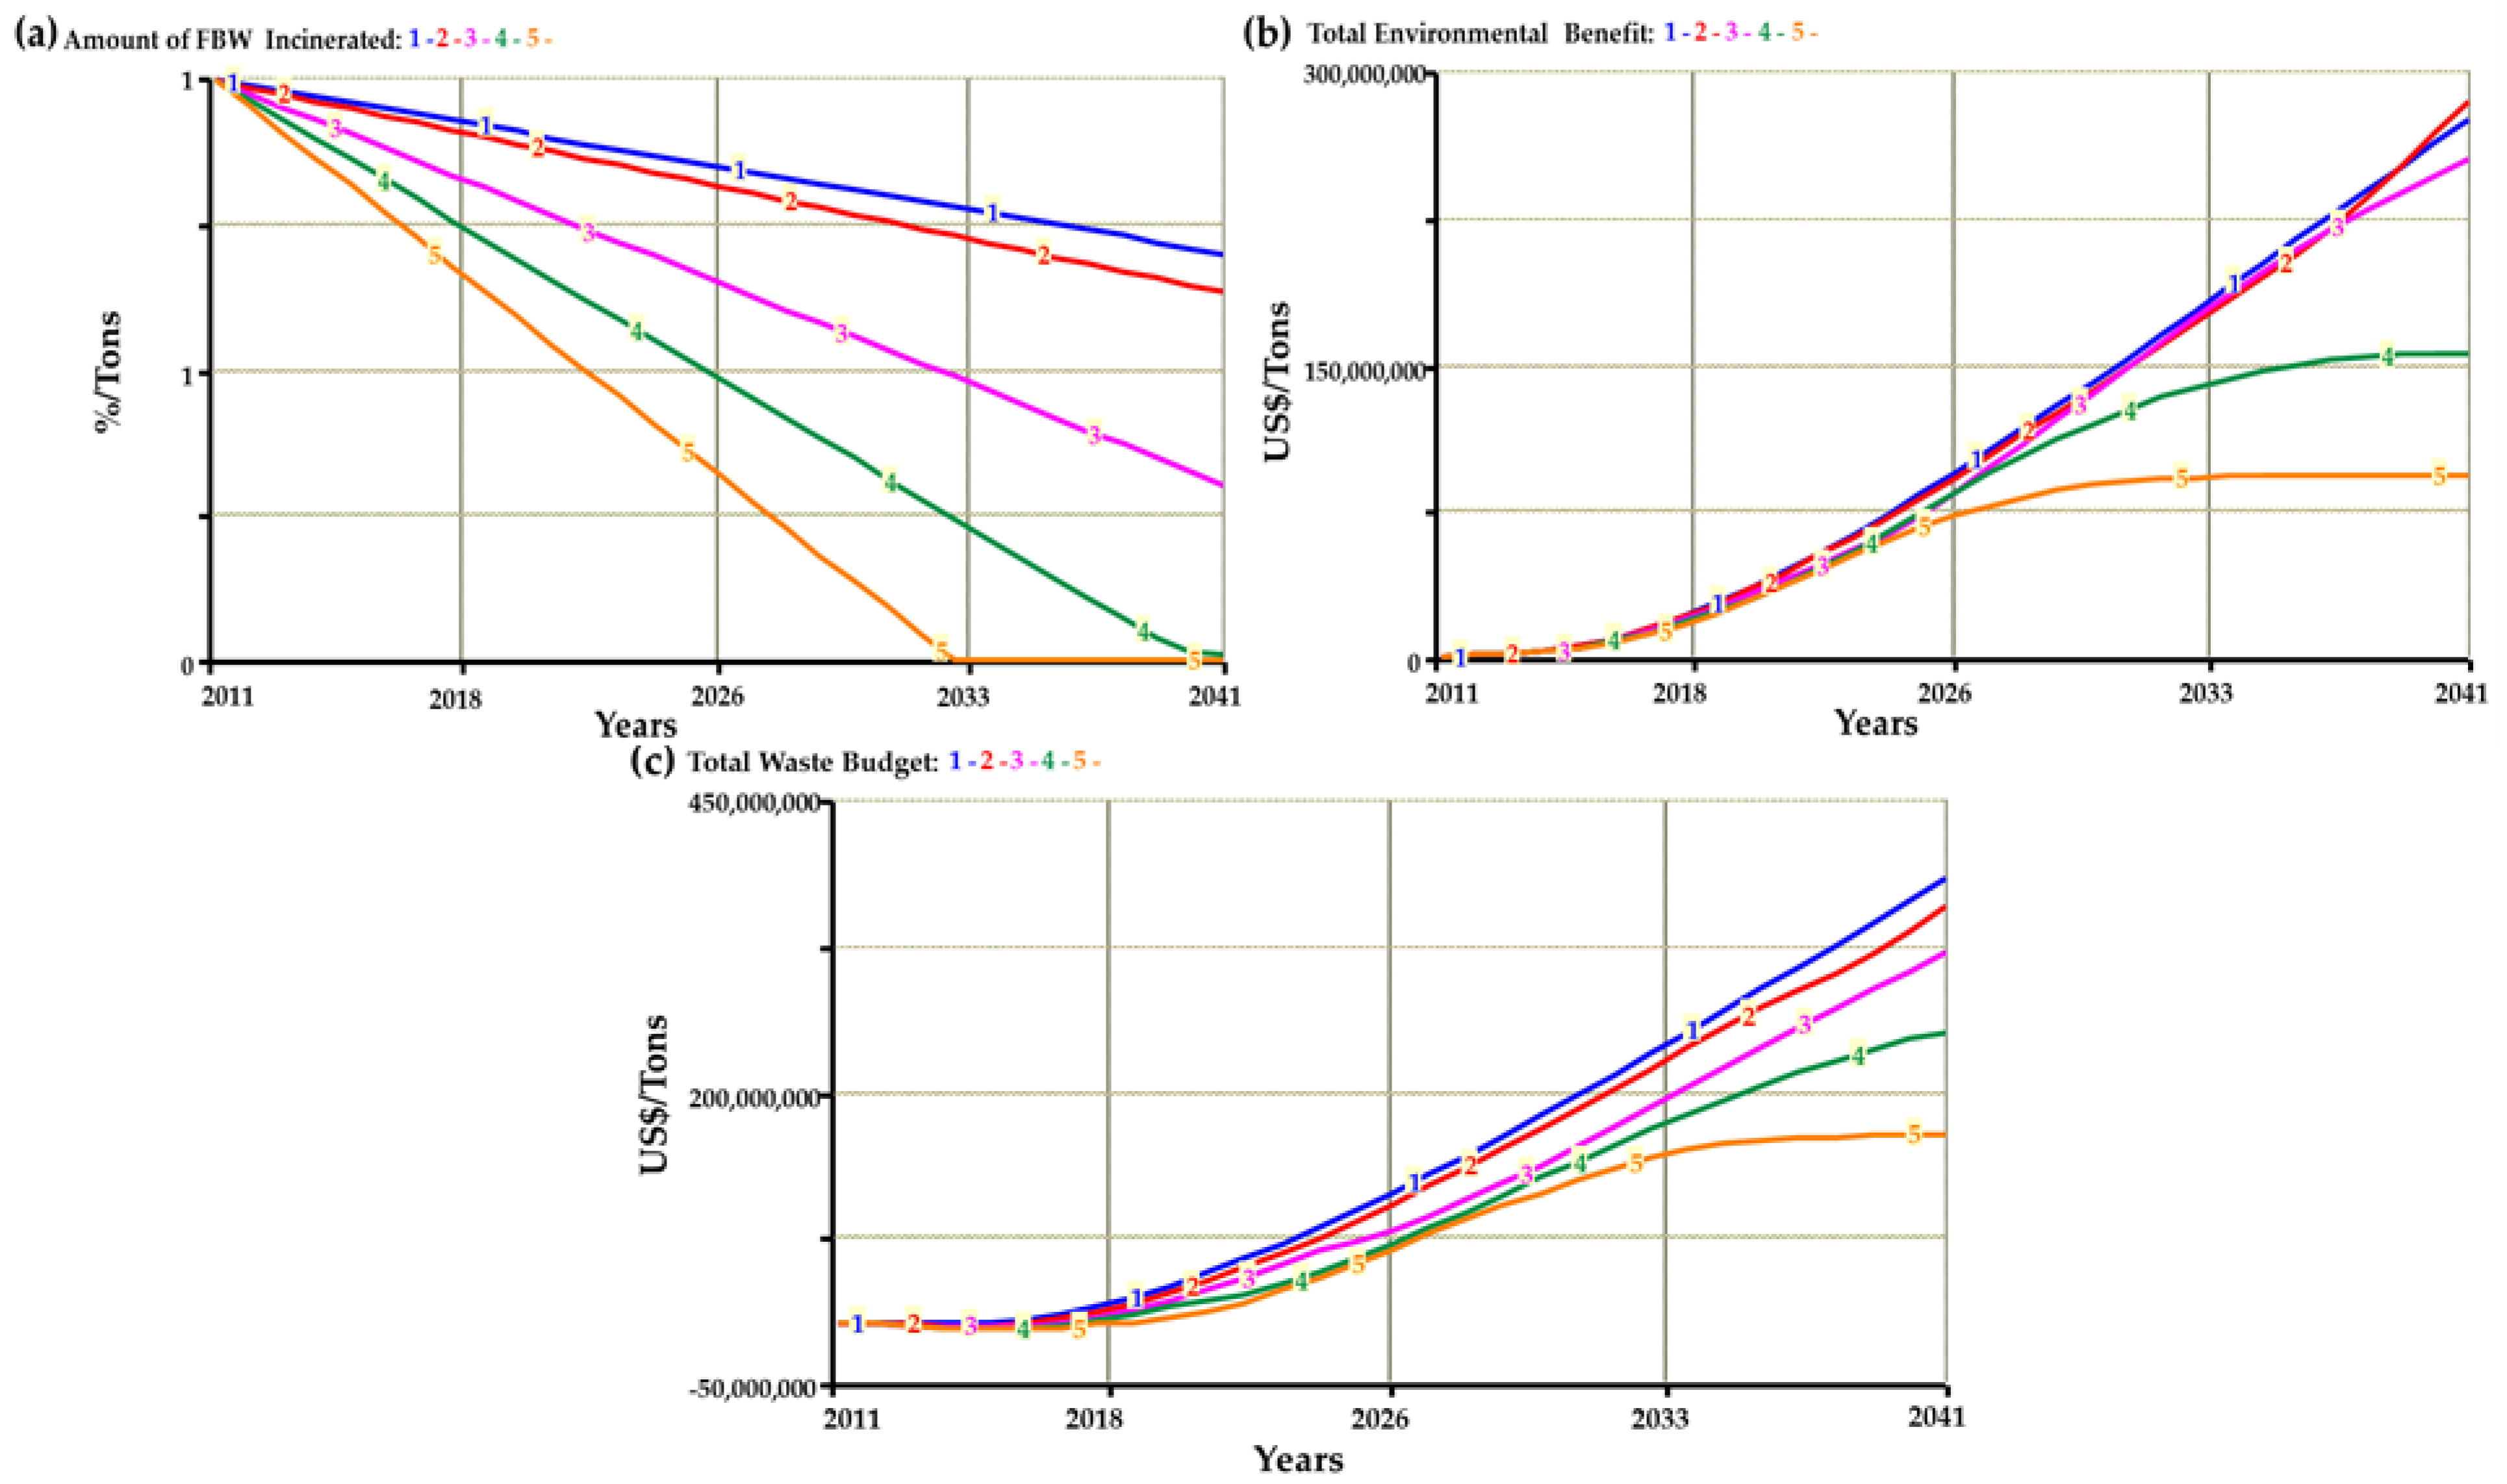
  • Policy Scenario 2 (PS2): In this policy scenario analysis, five alternatives of the Unit Cost of Incineration, including the base run set at 100 (Case 1), 200 (Case 2), 300 (Case 3), 400 (Case 4), and 500 (Case) dollars/ton, respectively, are simulated to examine its influence on the amount of FBW incinerated, total waste management budget, and total environmental benefits. The main aim is to examine the influence of Unit Cost of Incineration on the base run simulated result.

Policy Scenario 1—Regulation

The simulated results in Figure 7a show that as regulation strengthens (increases) the amount of sorted waste, it also increases it. Although, the corresponding values for all the four cases are not linearly correlated. In the first case (Case 1) where the value of regulation is set at 0, the result shows a steady increase at the rate of 20% of the total general waste generated at the end of 2041. The Case 2 result shows the same pattern as that of case 1 but reaches equilibrium in 2030 at the rate of 9%. Case 3 and Case 4 show a rapid increase for the first 10 years followed by a longer-term equilibrium. With the stable rate of 7% and 6%, respectively, a larger amount of sorted waste is achieved at the end of 2041. Thus, regulation strengthening is significant and the influence of regulation on waste sorting plays a vital role in the MSW management system. This implies that the stronger the regulation is, the more waste is sorted, which is in accordance with the present practice of MSW management in Japan.
Having seen the result of the influence of regulation on sorted waste, it was also necessary to study the influence of regulation change on total waste budget and the total environmental benefits. To perform the simulation, the same values of regulation (regulation strengthening) used in sorted waste were applied. The cases (Case 1 to 4: 0, 2, 4, and 6, respectively) are designed to perform different states of regulation strengthening. Figure 7b,c show that the environmental benefit and total waste budget achieved from managing the MSW increases as the regulation is strengthened, signifying that the success of FBW management can be improved by establishing a sound regulation. Figure 7b,c show an identical pattern and they are linearly correlated. The trend is similar to both variables when the regulation is 0. In Case 1 the predicted value decreases by 7.35% (7% for environmental benefits) on the base run simulation. In terms of Case 2(2), 3(4), and 4(6) which are on the increase, the values achieved are 15.01% (15%), 24.78% (24%), and 27.44% (27%), respectively. Nonetheless, for both environmental benefit and total waste budget it is substantial to say that the best policy for regulation is between Cases 2 and 3, and there is an apparent variance between Cases 1 and 2. Consequently, enforcement of the base run regulation and those in Cases 2 to 4 will result in an increase and any policy regulation less than the base run simulation will yield less benefit in general. Judging from the result illustrated above, it could be said that regulation has a crucial and significant part and role in sustainable FBW management in the long run.

Policy Scenario 2—Unit Cost of Incineration

Simulation results in Figure 8a illustrate the amount of FBW that has to be treated in the AD plant due to high cost of incineration of waste. It can be seen that if the cost of incineration goes higher, the amount of FBW will decline, and this pattern is seen in all cases. In terms of the decreasing rate of the amount of FWB incinerated, the values achieved for Cases 1 to 5 are 0.70 ($100/ton), 0.63($200/ton), 0.30($300/ton), and 0.00, starting from year 2030 ($500/ton), respectively, at the end of the simulated year (2041). Case 5 implies that a very high cost of incineration will lead to no incineration of FBW by the year 2030. Additionally, higher unit cost of incineration of waste can encourage the municipal government to seek other means of sustainable waste treatment. Cost of incineration plays a significant role in the sustainability of the FBW treatment in the long run, because the cheaper the unit cost of incineration is the less chance of treating FBW in a separate waste treatment plant (AD plant) gets. The current unit cost of incineration of general waste is estimated at 100 dollars per ton in Japan.
As illustrated in Figure 8b, the total amount of environmental benefits increases throughout the simulation period of 30 years. It is indicated that there is an overall trend of decline in the amount of environmental benefits in Case 4 and Case 5 when the unit cost of incineration is higher. In other words, the marginal utility of increasing the unit cost of incineration (on maximizing the environmental benefits) declines when the unit cost of incineration is set at $400/ton and $500/ton (Cases 4 and 5). In terms of Cases 1 to 3, when the unit of incineration is raised between $100/ton to $300/ton there was no significant difference in the trend of environmental benefits. This implies that the best unit cost of incineration should be between $100/ton to $300/ton (Case 1 to 3) in order to make the most use of the waste resources.
The simulation in Figure 8c illustrates the influence of unit cost of incineration on the total waste management budget under different cases mentioned above. The result implies that under all the five cases, extra investment of resources by the municipal government is needed in order to manage the MSW system during the first few years of commencement. Apparently, the result is similar to Figure 8b, and it shows extra benefits of managing waste under the unit cost of incineration between $100/ton and $300/ton (e.g., Cases 1 to 3). Additionally, under these five cases of unit cost of incineration (from Cases 1 to 5), extra benefits (i.e., the profit margin will start in the years 2016 (sixth), 2017 (seventh), 2018 (eighth), and 2019 (ninth), respectively). However, the marginal utility of increasing the unit cost of incineration on maximizing the total waste management budget obtained declines when the unit cost of incineration is set at $400/ton and $500/ton (Case 4 and 5). This shows that it will be better to set the basic unit cost of incineration between $100/ton and $300/ton in order to make the most use of the resources yield from MSW management. Thus, it is reasonable to say that the appropriate unit cost of incineration of waste as described above should be set between $100/ton and $300/ton and should not be higher than $300/ton. Further increase will yield less benefit in the long run.

5. Conclusions

The SDs approach was employed to illustrate and investigate the benefit of separate treatment of FBW in the MSW management stream. At the same time, to understand the dynamic interactions between all aspects and elements of the current MSW management system in Oita City through the use of a causal loop diagram. It was anticipated that the dynamic interactions would strengthen the understanding of FBW as an integral part of the MSW management system. In turn, this serves as a decision-making instrument for assessment of different policy measures.
The simulated results illustrate that an increase in regulation, sorted waste, and the reduction in the amount of FBW treated in incineration will improve the current MSW management system in Oita City. It is also demonstrated that waste sorting at home/source plays a significant role in determining which treatment plant is suitable for treating each kind of waste. As the amount of FBW incinerated decreases the total waste management budget, total environmental benefit, and the amount of resources yield in both incineration and the AD plant increases with time. The base run simulated results imply that the use of an AD plant as a treatment for FBW would increase the efficiency of incineration. The first five years would require extra financial support from the municipal council, and from 2016 the profit margin for the total waste management budget will become positive.
The SD model was further used to simulate policy measures under different scenarios such as regulation and unit cost of incineration, in order to achieve the benefit of separate treatment of FBW under different conditions. The analysis was performed using two sets of policy scenarios with PS1 (regulation) in four different cases and PS2 (unit cost of incineration) in five different cases.
The result in PS1 shows that regulation strengthening is significant and the influence of regulation on waste sorting plays an important role in the MSW management systems. Consequently, the reinforcement of stronger regulation would apparently increase both the total waste management budget and the environmental benefits, and any policy regulation less than the base run simulation will yield less benefit to the MSW management system. This signified that regulation strengthening is a crucial part in the suitability of FBW management.
In the case of PS2, the unit cost of incineration was used as an economic policy measuring instrument and the result illustrates that the effective unit cost of incineration is between $100/ton and $300/ton. Additionally, the total amount of environmental benefits and the total waste management budget increase throughout the simulation period of 30 years (2011 to 2041), and the general trend declines as the unit cost of incineration goes higher. However, the influence of the cost of incineration on the amount of FBW incinerated shows that as the cost of incineration goes higher the amount of FBW will decline in all cases examined. This indicates that higher unit cost of incineration of waste can encourage the municipal government to seek other means of sustainable waste treatment. Thus, cost of incineration plays a significant role in the sustainability of the FBW treatment in the long run, because the cheaper the unit cost of incineration, the less chance of treating FBW in a separate waste treatment plant (AD plant).
The SDs model developed was applied to the case of Oita City in this study. However, this SD model can still be applied to any city in Japan to analyze and simulate policy mechanisms for material recovery efficiency, as the model is developed based on the waste management law in Japan [53]. Furthermore, the boundaries of the system can be expanded by adding new policy instruments, variables, and elements (e.g., waste market). The contribution of this study is demonstrated in the interdependent relationships between the major elements and variables depicted by the causal loop diagram, which have helped in enriching and deepening the understanding and research on FBW management. Another contribution is the SDs model, which can be used as an experimental simulation platform for simulating and testing various policy measures and management strategies of FBW management. Finally, the results achieved, and inferences drawn from this study offer insights into policy measures and management strategies that could play a significant role in the sustainable management of FBW in the long run.
Further research could be directed to reconstructing a more comprehensive model and scenarios that depict detailed financial (circular economy) and population impact on the FBW management system. The consequences of managing waste differ in different sectors (from household to large food-related businesses) and incorporating this in the model should be considered as this may have a major impact on the sustainability of FBW management.

Funding

This research received no external funding

Conflicts of Interest

The author declares no conflicts of interest.

Appendix A

Equations of the SDs Model
The AD Plant Treatment (t) = AD Plant Treatment (t – dt) + (Waste Treated in AD Plant – Resources Gained From AD) x dt
INIT AD Plant Treatment = 0
INFLOWS:
Waste Treated in AD Plant = Collected Waste x Rate of Treatment
OUTFLOWS:
Resources Gained from AD = AD Plant Treatment
Amount of FBW Incinerated (t) = Amount of FBW Incinerated (t – dt) + (Decreasing Rate – Increasing Rate) x dt
INIT Amount of FBW Incinerated = 1
INFLOWS:
Decreasing Rate = GRAPH (1—Motivation to Manage Waste)
(1.00, 0.01), (1.40, 0.02), (1.80, 0.03), (2.20, 0.04), (2.60, 0.04), (3.00, 0.05), (3.40, 0.06), (3.80, 0.07), (4.20, 0.08), (4.60, 0.09), (5.00, 0.1)
OUTFLOWS:
Increasing Rate = GRAPH (Unit Cost of Incineration)
(0.00, 0.01), (90.0, 0.02), (180, 0.02), (270, 0.03), (360, 0.04), (450, 0.05), (540, 0.06), (630, 0.07), (720, 0.08), (810, 0.09), (900, 0.1)
Collected Waste (t) = Collected Waste (t – dt) + (Waste Collection – Waste Treated in AD Plant – Incineration Rate) x dt
INIT Collected Waste = 0
INFLOWS:
Waste Collection = Sorted Waste x Rate of Collection
OUTFLOWS:
Waste Treated in AD Plant = Collected Waste x Rate of Treatment
Incineration Rate = Collected Waste x Amount of FBW Incinerated
Incineration (t) = Incineration (t – dt) + (Incineration Rate – Resource Gained from INC) x dt
INIT Incineration = 0
INFLOWS:
Incineration Rate = Collected Waste x Amount of FBW Incinerated
OUTFLOWS:
Resource Gained from INC = Incineration
Regulation (t) = Regulation (t – dt) + (Regulation Strengthening) x dt
INIT Regulation = 1
INFLOWS:
Regulation Strengthening = GRAPH (1—Amount of FBW Incinerated * Regulation)
(0.00, 0.005), (0.1, 0.01), (0.2, 0.015), (0.3, 0.025), (0.4, 0.045), (0.5, 0.065), (0.6, 0.085), (0.7, 0.105), (0.8, 0.12), (0.9, 0.145), (1, 0.165)
Resources Yield from AD (t) = Resources Yield from AD (t – dt) + (Resources Gained From AD) x dt
INIT Resources Yield from AD = 0
INFLOWS:
Resources Gained from AD = AD Plant Treatment
Resources Yield from INC (t) = Resources Yield from INC (t – dt) + (Resource Gained from INC) x dt
INIT Resources Yield from INC = 0
INFLOWS:
Resource Gained from INC = Incineration
Sorted Waste (t) = Sorted Waste (t – dt) + (Waste Sorting – Waste Collection) x dt
INIT Sorted Waste = 0
INFLOWS:
Waste Sorting = Waste Generation x Sorting Rate
OUTFLOWS:
Waste Collection = Sorted Waste x Rate of Collection
Waste Generation (t) = Waste Generation (t – dt) + (Burnable Waste – Waste Sorting) x dt
INIT Waste Generation = 0
INFLOWS:
Burnable Waste = Generated Waste x Rate of Waste Generation
OUTFLOWS:
Waste Sorting = Waste Generation x Sorting Rate
Ammonia = Syngas x 0.64 x Unit Price of Ammonia
Biogas Power Generation = Resources Yield from AD * MWh per Ton Biogas * Unit Price of Power Biogas
CO2 = Syngas x 2.07 x Unit Price of CO2
Cost of Collecting and Transportation = Collected Waste x Unit Cost of Collecting and Transportation
Cost of Incineration = Incineration x Unit Cost of Incineration
Cost of O&M AD Plant = AD Plant Treatment x Unit Cost of O&M AD
Cost of O&M Incineration = Incineration x 47
Environmental Cost Savings = Unit Cost of ECS x Incineration
Fertilizer = (Resources Yield from AD * Unit Price Fertilizer) * 0.75
Fund Needed for Waste Management = Cost of Collecting and Transportation + Cost of Incineration + Cost of O&M AD Plant + Cost of O&M Incineration
Generated Waste = 132151.81
GWP Cost Saving = Ammonia + CO2
MWh per Ton Biogas = 0.6
MWh per Ton Incineration = 0.52
Power Generation = Resources Yield from INC * MWh per Ton Incineration
Rate of Collection = 0.99
Rate of Treatment = IF Amount of FBW Incinerated < 0.1 THEN 0.83 ELSE IF Amount of FBW Incinerated < 0.2 THEN 0.72 ELSE IF Amount of FBW Incinerated < 0.3 THEN 0.61 ELSE IF Amount of FBW Incinerated < 0.4 THEN 0.50 ELSE IF Amount of FBW Incinerated < 0.5 THEN 0.40 ELSE IF Amount of FBW Incinerated < 0.7 THEN 0.30 ELSE 0.83
Rate of Waste Generation = 1.47
Revenue from AD Plant = Biogas Power Generation + Fertilizer
Revenue from Incineration = Power Generation x Unit Price of Power waste
Sorting Rate = Amount of FBW Incinerated * Motivation to Manage Waste
Syngas = Resources Yield From INC
Total Environmental Benefit = Environmental Cost Savings + GWP Cost Saving
Total Waste Budget = Total Revenue Funds Needed for Waste Management
Total Revenue = Environmental Cost Savings + GWP Cost Saving + Revenue from AD Plant + Revenue from Incineration
Unit Cost of Collecting and Transportation = 100
Unit Cost of Incineration = 100
Unit Cost of O&M AD = 48
Unit cost of ECS = 63.1
Unit Price Fertilizer = 100
Unit Price of Ammonia = 150
Unit Price of CO2 = 27.594
Unit Price of Power Biogas = .40
Unit Price of Power waste = 0.17
Motivation to Manage Waste = GRAPH (Regulation)
(0.00, 0.00), (1.00, 0.12), (2.00, 0.205), (3.00, 0.31), (4.00, 0.395), (5.00, 0.48), (6.00, 0.54), (7.00, 0.64), (8.00, 0.725), (9.00, 0.82), (10.0, 0.955)

References

  1. Babalola, M.A. A multi-criteria decision analysis of waste treatment options for food and biodegradable waste management in Japan. Environments 2015, 2, 471–488. [Google Scholar] [CrossRef]
  2. Caruso, M.C.; Braghieri, A.; Capece, A.; Napolitano, F.; Romano, P.; Galgano, F.; Altieri, G.; Genovese, F. Recent Updates on the Use of Agro-Food Waste for Biogas Production. Appl. Sci. 2019, 9, 1217. [Google Scholar] [CrossRef]
  3. ISWA—The International Solid Waste Association. Food Waste as a Global Issue—From the Perspective of Municipal Solid Waste Management; Key Issue Paper; ISWA Publications: Vienna, Austria, 2013. [Google Scholar]
  4. Geng, Y.; Tsuyoshi, F.; Chen, X. Evaluation of innovative municipal solid waste management through urban symbiosis: A case study of Kawasaki. J. Clean. Prod. 2010, 18, 993–1000. [Google Scholar] [CrossRef]
  5. Yolin, C. Waste Management and Recycling in Japan Opportunities for European Companies (SMEs Focus); EU-Japan Centre for Industrial Cooperation: Tokyo, Japan, 2015; Available online: https://www.eu-japan.eu/publications/waste-management-and-recycling-japan-opportunities-european-companies-smes-focus (accessed on 20 October 2016).
  6. Wong, L.-F.; Fujita, T.; Xu, K. Evaluation of regional bioenergy recovery by local methane fermentation thermal recycling systems. Waste Manag. 2008, 28, 2259–2270. [Google Scholar] [CrossRef]
  7. Bernstad, A.; la Cour Jansen, J. Review of comparative LCAs of food waste management systems—Current status and potential improvements. Waste Manag. 2012, 32, 2439–2455. [Google Scholar] [CrossRef] [PubMed]
  8. Franchetti, M. Economic and environmental analysis of four different configurations of anaerobic digestion for food waste to energy conversion using LCA for: A food service provider case study. J. Environ. Manag. 2013, 123, 42–48. [Google Scholar] [CrossRef] [PubMed]
  9. Khalid, A.; Arshad, M.; Anjum, M.; Mahmood, T.; Dawson, L. The anaerobic digestion of solid organic waste. Waste Manag. 2011, 31, 1737–1744. [Google Scholar] [CrossRef] [PubMed]
  10. Santibañez-Aguilar, J.E.; Ponce-Ortega, J.M.; Betzabe González-Campos, J.; Serna-González, M.; El-Halwagi, M.M. Optimal planning for the sustainable utilization of municipal solid waste. Waste Manag. 2013, 33, 2607–2622. [Google Scholar] [CrossRef] [PubMed]
  11. Khoo, H.H.; Lim, T.Z.; Tan, R.B.H. Food waste conversion options in Singapore: Environmental impacts based on an LCA perspective. Sci. Total Environ. 2010, 408, 1367–1373. [Google Scholar] [CrossRef]
  12. Kim, M.-H.; Kim, J.-W. Comparison through an LCA evaluation analysis of food waste disposal options from the perspective of global warming and resource recovery. Sci. Total Environ. 2010, 408, 3998–4006. [Google Scholar] [CrossRef]
  13. Villanueva, A.; Wenzel, H. Paper waste—Recycling, incineration or landfilling? A review of existing life cycle assessments. Life Cycle Assessment in Waste Management. Waste Manag. 2007, 27, 29–46. [Google Scholar] [CrossRef] [PubMed]
  14. Takata, M.; Fukushima, K.; Kino-Kimata, N.; Nagao, N.; Niwa, C.; Toda, T. The effects of recycling loops in food waste management in Japan: Based on the environmental and economic evaluation of food recycling. Sci. Total Environ. 2012, 432, 309–317. [Google Scholar] [CrossRef] [PubMed]
  15. Bouloiz, H.; Garbolino, E.; Tkiouat, M.; Guarnieri, F. A system dynamics model for behavioral analysis of safety conditions in a chemical storage unit. Saf. Sci. 2013, 58, 32–40. [Google Scholar] [CrossRef] [Green Version]
  16. Ford, A. Modeling the Environment, 2nd ed.; Island Press: Washington, DC, USA, 2010. [Google Scholar]
  17. Suryani, E.; Chou, S.-Y.; Hartono, R.; Chen, C.-H. Demand scenario analysis and planned capacity expansion: A system dynamics framework. Simul. Model. Pract. Theory 2010, 18, 732–751. [Google Scholar] [CrossRef]
  18. Yuan, H.; Wang, J. A system dynamics model for determining the waste disposal charging fee in construction. Eur. J. Oper. Res. 2014, 237, 988–996. [Google Scholar] [CrossRef]
  19. Morecroft, J.D.W. Strategic Modeling and Business Dynamics: A Feedback Systems Approach; John Wiley: Chichester, UK, 2007. [Google Scholar]
  20. Sterman, J.D. Business Dynamics: Systems Thinking and Modeling for A Complex World; Irwin McGraw-Hill: Boston, MA, USA, 2000. [Google Scholar]
  21. Qi, C.; Chang, N.B. System dynamics modeling for municipal water demand estimation in an urban region under uncertain economic impacts. J. Environ. Manag. 2011, 92, 1628–1641. [Google Scholar] [CrossRef]
  22. Goh, Y.M.; Love, P.E.D. Methodological application of system dynamics for evaluating traffic safety policy. Saf. Sci. 2012, 50, 1594–1605. [Google Scholar] [CrossRef]
  23. Chen, L.; Lisha, Z.; Na, L.; Ming, Z. Modelling and Simulation of Power Grid Engineering Project based on System Dynamics on the Background of Smart Grid. Special issue: Information Engineering and Complexity Science—Part I. Syst. Eng. Procedia 2012, 3, 92–99. [Google Scholar] [CrossRef]
  24. Hsu, C.-W. Using a system dynamics model to assess the effects of capital subsidies and feed-in tariffs on solar PV installations. Special issue: Clean Energy for Future Generations. Appl. Energy 2012, 100, 205–217. [Google Scholar] [CrossRef]
  25. Gohari, A.; Eslamian, S.; Mirchi, A.; Abedi-Koupaei, J.; Bavani, A.M.; Madani, K. Water transfer as a solution to water shortage: A fix that can Backfire. J. Hydrol. 2013, 491, 23–39. [Google Scholar] [CrossRef]
  26. Park, S.; Sahleh, V.; Jung, S. A system dynamics computer model to assess the effects of developing an alternate water source on the water supply systems management. Procedia Eng. 2015, 119, 753–760. [Google Scholar] [CrossRef] [Green Version]
  27. Zarghami, M.; Akbariyeh, S. System dynamics modeling for complex urban water systems: Application to the city of Tabriz, Iran. Resour. Conserv. Recycl. 2012, 60, 99–106. [Google Scholar] [CrossRef]
  28. Dyson, B.; Chang, N.-B. Forecasting municipal solid waste generation in a fast-growing urban region with system dynamics modeling. Waste Manag. 2005, 25, 669–679. [Google Scholar] [CrossRef] [PubMed]
  29. Karavezyris, V.; Timpe, K.-P.; Marzi, R. Application of system dynamics and fuzzy logic to forecasting of municipal solid waste. Special issue: Intelligent Forecasting, Fault Diagnosis, Scheduling, and Control. Math. Comput. Simul. 2002, 60, 149–158. [Google Scholar] [CrossRef]
  30. Dace, E.; Bazbauers, G.; Berzina, A.; Davidsen, P.I. System dynamics model for analyzing effects of eco-design policy on packaging waste management system. Resour. Conserv. Recycl. 2014, 87, 175–190. [Google Scholar] [CrossRef]
  31. Kollikkathara, N.; Feng, H.; Yu, D. A system dynamic modeling approach for evaluating municipal solid waste generation, landfill capacity and related cost management issues. Special issue: Special Thematic Section: Sanitary Landfilling. Waste Manag. 2010, 30, 2194–2203. [Google Scholar] [CrossRef] [PubMed]
  32. Chaerul, M.; Tanaka, M.; Shekdar, A.V. A system dynamics approach for hospital waste management. Waste Manag. 2008, 28, 442–449. [Google Scholar] [CrossRef] [PubMed]
  33. Ye, G.; Yuan, H.; Shen, L.; Wang, H. Simulating effects of management measures on the improvement of the environmental performance of construction waste management. Resour. Conserv. Recycl. 2012, 62, 56–63. [Google Scholar] [CrossRef]
  34. Yuan, H.P.; Shen, L.Y.; Hao, J.J.L.; Lu, W.S. A model for cost–benefit analysis of construction and demolition waste management throughout the waste chain. Special issue: Environmental Supply Chain Management. Resour. Conserv. Recycl. 2011, 55, 604–612. [Google Scholar] [CrossRef]
  35. Yuan, H. A model for evaluating the social performance of construction waste management. Waste Manag. 2012, 32, 1218–1228. [Google Scholar] [CrossRef]
  36. Yuan, H.; Chini, A.R.; Lu, Y.; Shen, L. A dynamic model for assessing the effects of management strategies on the reduction of construction and demolition waste. Waste Manag. 2012, 32, 521–531. [Google Scholar] [CrossRef] [PubMed]
  37. Zhao, W.; Ren, H.; Rotter, V.S. A system dynamics model for evaluating the alternative of type in construction and demolition waste recycling center—The case of Chongqing, China. Resour. Conserv. Recycl. 2011, 55, 933–944. [Google Scholar] [CrossRef]
  38. Ministry of the Environment (MOE). Establishing a Sound Material-Cycle Society: Milestone toward a Sound Material-Cycle Society through Changes in Business and Life Styles; Ministry of the Environment Government: Tokyo, Japan, 2010. Available online: http://www.env.go.jp/en/recycle/smcs/a-rep/2010gs_full.pdf (accessed on 20 September 2015).
  39. Oita Municipal Government. Oita Zero Waste Strategy: The Status and Plans of Biomass Resource Utilization; Oita Municipal Government: Oita City, Japan, 2014. [Google Scholar]
  40. Oita Pride. Oita City Outline 2017. Available online: http://www.city.oita.oita.jp/o029/shisejoho/annai/documents/english.pdf (accessed on 22 April 2018).
  41. Showa Denko. Shaping CSR: Showa Denko CSR Report 2013; Showa Denko Group: Tokyo, Japan, 2013; Available online: http://www.sdk.co.jp/assets/files/english/csr/library/report/pdf/csr_f2013_e_all.pdf (accessed on 20 September 2015).
  42. Starr, K.; Gabarrell, X.; Villalba, G.; Peiro, L.T.; Lombardi, L. Potential CO2 savings through biomethane generation from municipal waste biogas. Biomass Bioenergy 2014, 62, 8–16. [Google Scholar] [CrossRef]
  43. The Ministry of Environment (MOE). Solid Waste Management and Recycling Technology of Japan: Toward a Sustainable Society; The Ministry of Environment (MOE): Tokyo, Japan, 2012. Available online: https://www.env.go.jp/en/recycle/smcs/attach/swmrt.pdf (accessed on 18 October 2015).
  44. Assamoi, B.; Lawryshyn, Y. The environmental comparison of landfilling vs. incineration of MSW accounting for waste diversion. Waste Manag. 2012, 32, 1019–1030. [Google Scholar] [CrossRef]
  45. Moriarty, K. Feasibility Study of Anaerobic Digestion of Food Waste in St. Bernard, Louisiana; The National Renewable Energy Laboratory (NREL): Lakewood, CO, USA, 2013; Technical Report. Available online: http://www.nrel.gov/docs/fy13osti/57082.pdf (accessed on 20 August 2015).
  46. Ecoprog GmbH. Waste to Energy 2018/2019: Technologies, Plants, Projects, Players and Backgrounds of the Global Thermal Waste Treatment Business; Ecoprog GmbH: Köln, Germany, 2018; Available online: https://www.ecoprog.de/fileadmin/user_upload/leseproben/extract_market_report_WtE_2018-2019_ecoprog.pdf (accessed on 10 October 2018).
  47. World Energy Council. World Energy Resources: Waste to Energy; World Energy Council: London, UK, 2013; Available online: https://www.worldenergy.org/wp-content/uploads/2013/10/WER_2013_7b_Waste_to_Energy.pdf (accessed on 9 August 2016).
  48. Koupaie, E.H.; Leiva, M.B.; Eskicioglu, C.; Dutil, C. Mesophilic batch anaerobic co-digestion of fruit-juice industrial waste and municipal waste sludge: Process and cost-benefit analysis. Bioresour. Technol. 2014, 152, 66–73. [Google Scholar] [CrossRef]
  49. Dijkgraaf, E.; Vollebergh, H.R.J. Burn or bury? A social cost comparison of final waste disposal methods. Ecol. Econ. 2004, 50, 233–247. [Google Scholar] [CrossRef] [Green Version]
  50. The Ministry of Economy, Trade and Industry (METI). Feed-in-Tariff Scheme in Japan; The Ministry of Economy, Trade and Industry (METI): Tokyo, Japan, 2012. Available online: http://www.meti.go.jp/english/policy/energy_environment/renewable/pdf/summary201207.pdf (accessed on 20 August 2015).
  51. Tabata, T. Waste-to-energy incineration plants as greenhouse gas reducers: A case study of seven Japanese metropolises. Waste Manag. Res. 2013, 31, 1110–1117. [Google Scholar] [CrossRef] [PubMed]
  52. Au, L.S.; Ahn, S.; Kim, T.W. System Dynamic Analysis of Impacts of Government Charges on Disposal of Construction and Demolition Waste: A Hong Kong Case Study. Sustainability 2018, 10, 1077. [Google Scholar] [CrossRef]
  53. Ordinance No. 35 of Ministry of Health and Welfare of 1971. In Regulations of Waste Management and Public Cleansing Law; Ministry of the Environment: Tokyo, Japan, 2002. Available online: https://www.env.go.jp/en/laws/recycle/03.pdf (accessed on 20 September 2015).
Figure 1. The modeling process in system dynamics.
Sustainability 11 03456 g001
Figure 2. Conceptual model of the municipal solid waste management system in Japan.
Sustainability 11 03456 g002
Figure 3. The causal loop diagram depicting various aspects of municipal solid waste system and their dynamic interactions.
Sustainability 11 03456 g003
Figure 4. The stock and flow diagram.
Sustainability 11 03456 g004
Figure 5. Extreme condition test.
Sustainability 11 03456 g005
Figure 6. Base run simulation results: (a) waste management regulation; (b) waste management revenue.
Sustainability 11 03456 g006
Figure 7. Policy scenario 1—regulation: (a) sorted waste; (b) total environmental benefit; (c) total waste budget.
Sustainability 11 03456 g007
Figure 8. Policy scenario 2—unit cost of incineration: (a) amount of food and biodegradable waste incinerated; (b) total environmental benefit; (c) total waste budget.
Sustainability 11 03456 g008
Table 1. Summary of the main variables estimates used in the model.
NoVariables (Unit)DescriptionSources
1Total Annual Generated Waste (ton/year)Burnable waste generated from different sectors including household and small businesses. [40]
2Annual Rate of Waste Collection and Sorting (ton/year)The amount of sorted waste collected at the collection centers.[40]
3Annual Amount of FBW Waste Generated (ton/year)The fraction of burnable waste that can be treated in an AD plant. [40]
4Annual Increase Rate of FBW (percentage)The increasing rate of treating FBW in AD plant. [40]
5Rate of Incinerating FBW (percentage)The decreasing rate of incinerating FBW in incinerator.
6Motivation to Manage Waste (dimensionless)The incentive to sort and dispose of FBW appropriately, illustrate with the graph function.
7Waste Management Regulation (dimensionless)Legislative standard for proper FBW management demonstrated with a graph function.
8Annual Resources Yield from AD and Incineration (ton/year)The extracted materials from waste after treatment in either incinerator or AD plant (e.g., power and heat, biogas, syngas, and fertilizer).[3,41,42]
9Annual Cost of Waste Collection and Transportation ($/ton)The fund needed to cover the cost of collecting and transporting waste from collection centers to the incinerator and AD Plant.[5,43]
10Annual Cost of Operating and Maintaining both Incinerator and AD Plant ($/ton)Fund available for maintaining the operations of both incinerator and AD Plant.[5,44,45,46,47,48]
11Annual Cost of Resources Yield ($)The revenue generated from recovered resources. [49,50]

