Article

The Pleasure of Walking: An Innovative Methodology to Assess Appropriate Walkable Performance in Urban Areas to Support Transport Planning

by
Letizia Appolloni
,
Maria Vittoria Corazza
* and
Daniela D’Alessandro
Department of Civil, Building and Environmental Engineering, Sapienza University of Rome, 00185 Rome, Italy
*
Author to whom correspondence should be addressed.
Sustainability 2019, 11(12), 3467; https://0-doi-org.brum.beds.ac.uk/10.3390/su11123467
Submission received: 21 May 2019 / Revised: 14 June 2019 / Accepted: 20 June 2019 / Published: 24 June 2019
(This article belongs to the Special Issue Sustainable Mobility: Social, Technological and Environmental Issues)

Abstract

:
The Walking Suitability Index of the Territory–T-WSI is an innovative methodology to assess walkability. Unlike other methods and tools in this field designed to evaluate walkability on given origin-destination paths, T-WSI is conceived for area-wide assessments, typically at the neighborhood level. This can be achieved by visual surveys to collect data, which are easy to perform at street level, their further process via an algorithm, and their aggregation to assess the walking performance levels of the test area. The paper describes such methodology, which includes the development of 12 indicators associated with four main evaluation categories (Practicability, Safety, Urbanity and Appeal), and its application to a case study in a medium-size town in central Italy. Results are described and elaborated to highlight T-WSI’s contribution to help decision makers in the urban governance process, typically in the fields of land use, mobility management and maintenance, coherently with the research objective to enlarge the potential of walkability methodologies thus far available up to area-level assessment.

1. Introduction

Every trip, generally, starts and ends with walking. This has been long-acknowledged in health studies, where walking is considered the keystone to promote healthier lifestyles based on physical activities. Reducing physical inactivity by walking is also one of the World Health Organization’s priorities and considered one of the best investments to achieve health and sustainable development for all, with a goal to attain a 15% reduction of sedentary activities by 2030 [1,2]. Scientific evidence on the possibility of improving health conditions and consequently gaining economic benefits from the reduction of complications for most chronic diseases due to increased physical activity corroborates this vision [3,4,5]. The built environment is considered a major health determinant in this process [6,7], and the ”neighborhood” a key player in promoting or enhancing walking due to the variety of its public spaces and everyday functions [8,9,10].
Nevertheless, walking is usually assessed as ancillary to other modes and, as such, often underestimated when simulating or planning transportation systems. The main reason for this is the unpredictability of solo walking; pedestrians are erratic, walking where they feel safe, secure, comfortable and/or attracted, and when they do not feel at ease they simply walk elsewhere. Modelling such behaviors can be difficult. However, in the scientific literature, examples of quantitative calculation or qualitative interpretation of how pedestrians move are numerous. Quantitative calculations mostly rely on assumptions and methods for platoons, i.e., groups of pedestrians assembled to move together. When in a group, and/or driven by a specific purpose, behaviors become more predictable and their modelling reliable. This is the case when planning to accommodate pedestrian flows in transport facilities (rail stations and airports, typically) or during large gatherings (sport arenas, outdoor events), or simply at crossings, with special emphasis placed on meeting safety and security requirements. The underpinning concept is to consider the group as one individual who will walk as expected, planned or instructed. This results in a wide number of examples of agent-based simulations with applications in very different scenarios, both in outdoor and indoor environments (for instance as in case studies in real urban areas [11,12,13], for special events [14], under conflicting situations [15], and models [16,17]), pioneered by seminal studies on behavioral patterns of pedestrian groups (either to assess safety levels [18,19], or how they interact [20], or to associate them with Levels of Service–LoS [21,22]), and then supported by handbooks and manuals (one of the most popular of which is [23]), and software. The same approach is used for vehicles’ layouts design, e.g., trams, buses and trolleybuses, where boarding and alighting operations are based on platoon-behaviors [24].
This approach typically relies on the LoS, where quality is associated with quantitative parameters like density and capacity (the different amounts of pedestrian space per person and the equivalent maximum flow rate per unit width of infrastructure [23,25]). LoS are also necessary to validate the suitability of existing infrastructure in terms of comfort or safety, but certainly need to be integrated when their attractiveness and friendliness to walking is to be assessed. This is where walkability comes into play. From here this paper moves to describe a comprehensive methodology to assess walkability quality and potential for consolidated urban areas (fully described in Section 2), in line with the vision just introduced at the beginning of this section. This methodology is multi-site tested in an urban area in central Italy with results presented (Section 3) and elaborated (Section 4 and Section 5). The crux of this work was to evaluate walking friendliness at area level and not specifically linked to given origins, destinations or routes (as currently done), thanks to a methodology adaptable to different urban scenarios with the research objective to disseminate an innovative way to assess walkability and provide directions for its replicability elsewhere, within transport planning practice.

1.1. Walkability: A Key Concept to Promote Health and Sustainable Mobility

As a key concept in both sustainable urban design and sustainable mobility theories and practice, walkability measures the extent to which an area is walkable according to manifold features of the built environment (density, morphology, land use, accessibility, place-making, vegetation, traffic patterns, level of pollution, etc.). Main contributors to the development of this concept are the many studies on how people move within, experience, use and perceive the built environment [26,27,28,29,30].
Comprehensiveness and flexibility are the drivers of walkability’s large reception in scientific literature and practice, as it can be adapted to any urban environment and at different scales (from street to area levels); may include any pedestrians’ requirements; be qualitatively and/or quantitatively evaluated (as further described), and eventually easily re-assessed whenever any modification (changes in mobility patterns, land use development, temporary events) might affect walking. This also explains why walkability, as a concept, is currently used in a number of fields, from society and economy [31,32,33], to transportation planning [34,35,36,37,38], to tourism [39,40,41], and to urban planning and design [42,43,44], but it is more frequently associated with health and well-being.
As introduced above, scientific evidence stresses that more walkable neighborhoods are linked to increased physical activity, may mitigate overweight, depression, alcohol and drug abuse problems and contribute to higher sociability [45].
An intuitive but effective way to correlate all of the above can be adapted from the definition of the quality of life as a ratio between the welfare of the environment and the costs of access, developed by Koenig [46]. Mutatis mutandis, walkability can be defined as:
W a l k a b i l i t y   = B u i l t   e n v i r o n m e n t   e u d a i m o n i a   E f f o r t s   f o r   w a l k i n g
Eudaimonia can be defined as the condition of being happy and healthy and prosperous, and for the built environment it represents its livability, thus including all the social, cultural and economic features which contribute to welfare. It should be noted that, although usually associated with regular financial supports provided by the government to citizens in need, in economic studies, the term “welfare” is actually a synonym for health, happiness, prosperity, and well-being in general.
Coherently with this definition, parameters entering the numerator are not only the well-known density, diversity, and design [26], but also pollution mitigation, waste management, cultural heritage, maintenance and care of building stocks and public commons, opportunities for exchange, accessibility for all, leisure, and equitable transit options.
Walking effort can be broken down into four main components: time, physical energy, mental energy and risks. Time is the factor estimated or experienced in walking to a given destination, but also the one spent performing other ancillary functions: waiting (at crossings, queues, etc.) or transit boarding/alighting, for example. Walking also requires both physical and psychological energy, strictly linked to personal health conditions, age and walking purpose (walking a pet can be as demanding as pushing prams). Risks in turn can be subdivided into three additional components: uncertainty, instability, and insecurity. Uncertainty is related to unmet expectations: typically, the walking trip may be more challenging than estimated, unplanned time is spent in line, the route is unattractive, the built environment is hostile, etc. Instability represents all the possible temporary conditions which can turn walking into an inconvenient mobility option: pollution levels, packed sidewalks, adverse weather conditions, among the most recurring. Eventually, insecurity includes circumstances or feelings which suggest reduced safeguard: crime, unexpected events, lack of confidence in personal abilities, etc. [47,48].

1.1.1. Current Methods to Assess Walkability

Needless to say, scientific literature linking built environment, health, well-being and walkability abounds, as synthesized in D’Alessandro et al. [47,48]; at the same time, the many examples and case studies reported highlight at least four recurring methods for assessing walkability: (i) connectivity-based; (ii) GIS-based; (iii) perception-based; (iv) audits.
As regards (i) connectivity-based methods, initial studies focused on the physical features of the road network, placing emphasis on density of nodes and links, and developing indexes for assessing the quality of connectivity accordingly [36,49,50]. The basic assumption is that the more nodes (i.e., intersections) are available, the higher the possibilities for pedestrians to optimize Origin-Destination–O/D trips. Pedestrian Catchment Area–PCA is the most common parameter, regularly used to assess how much a given origin/destination is walkable (or accessible). PCAs can be determined according to the relevance of the considered O/D facilities, typically transit facilities or parks and correspondingly scalable (e.g., from street level for a bus stop, to neighborhood level for a metro station, up to area level for an urban park). Examples of connectivity-based methods abound, since they are used whenever walkable access to basic urban services, public commons, and transport infrastructure is to be calculated to assess the population served. Although applicable to every urban area, this approach only focuses on the physical structure of the road network, thus failing to address the quality of the built environment and how pedestrians perceive it.
Such an approach has evolved in line with the progress of image processing giving rise to (ii) GIS-based methods. If connectivity-based methods enable the calculation of simple objectively-measurable walkability physical parameters (e.g., links and nodes), the GIS-based ones enable more complex calculations and analyses considering a large number of variables thanks to embedded full-featured GIS software. In this way, it is possible not only for the easy estimation of PCAs, but the development of more complex composite indices and functions accordingly (for examples, the “Walkability Index–WI”, and the “Walk Opportunities Index”, as in Frank et al., Leslie et al. and Kuzmyak et al. [51,52,53], or the walking cost distance function associated with links as in Corazza and Favaretto [38]). In this second type of measurements, along with GIS, the use of IT systems, such as the Personal Digital Assistant (PDA), which supports researchers in detecting certain specific characteristics of the built environment (mostly those related to the building stock, land use, vegetation, infrastructure), and can be used to assess walkability with more accuracy. Eventually, GIS-based methods also include the possibility to process more variables from statistical data associated with the area in hand (for example, population characteristics and dynamics, socio-economic trends, lifestyles, etc.). Examples of successful GIS-based application for the assessment of transit facilities and land use development can be found, for example, in [38,54,55]. However, GIS-processed analyses’ potential to associate walking features with statistical data specifically related to health and transport is still largely underestimated, for the focus (as for connectivity-based methods) is still on the physical side of the pedestrian realm, i.e., the physically built environment.
To cope with that, a third type of measurement is introduced, i.e., the (iii) perception-based, which relies on how individuals perceive their surroundings and how, in turn, the environmental characteristics of these affect walking behavior [56].
In this case, the focus is oftentimes on how to walk to given facilities (commercial, educational, leisure, etc.) and more in general, outdoor spaces, and factors affecting modal choices, such as quality of infrastructures, social status, environmental conditions, aesthetics, perceived safety, but also vegetation, public lighting, cleanliness, etc., can be also included in the measurement [57,58,59,60]. Unlike the two methods previously described which are purely quantitative, the perception-based introduces qualitative parameters (mostly pedestrians’ assessment of perceived barriers or drivers of a given O/D path), collected via surveys, interviews and questionnaires which give rise to several types of Walkability Lists. This approach is favored by local administrators and planners when deciding the location of new facilities or assessing the suitability of specific O/D paths, typically home-to-school routes, (and a plethora of grey literature on such lists and how to manage the decision process accordingly is available, one example for all provided by the U.S. Department of Health and Human Services [61]).
The attempt to standardize these procedures gives rise to the last type of assessment, i.e., (iv) the walkability audits, promoted by advocacy groups to evaluate pedestrian facilities and identify specific improvements that would increase the routes’ attractiveness to pedestrians. Along with that, this formal process usually results in local policy recommendations, social media coverage and support, fundraising, and social marketing products, all aimed at promoting safer and/or healthier behaviors among the community members and ensuring local administrators’ full commitment and long-term visions. Again, examples are numerous, but a particularly comprehensive one is the Seattle case, where local advocacy group activities enabled new pedestrian infrastructure to be funded, the development of a pedestrian master plan, and the issue of a dedicated policy (”Complete Streets”) [62].
Audit methods involve initial studies to clearly define pedestrian problems, data collection to quantify severity and consequences, elaboration of proposals to overcome, communication and participation strategies to involve citizens and decision-makers and reach consensus. The usual tools like questionnaires, public meetings, talks, social communications, etc., are designed to ask participants about their perception of problems related to pedestrians (typically road safety or attractiveness, and built environment aesthetics). Additional tools could involve cost-benefit or multicriteria analyses associated with possible improvements, and the assessment of their consensus or acceptance among the community. Although direct and reliable, such tools are often demanding because of the time required for data processing (data can be both quantitative and qualitative), and the efforts to engage communities and decision makers, for the process duration.
Each of the four methods has pros and cons. Connectivity and GIS-based methods are quantitative, whereas the perception-based one is qualitative. The former two are suitable to assess built environment’s physical drivers and barriers, respectively promoting or preventing walking, but do not include the perception factor; moreover, they require specific skills to process GIS information and calculations, and generally speaking can be included among the desk research field. The latter, in turn, is fed by personal assessments, dictated by individual convenience and affected by local conditions (geographical, cultural, social, etc.); it can highlight the most diverse qualitative factors promoting or preventing walking, not detectable by the quantitative methods (from smells, to quality of light, to perception of hostility or friendliness, etc.). Outcomes might differ from those achieved through quantitative methods. Perception-based methods, mostly relying on direct or mediated communication (questionnaires, surveys, interviews, mental maps, etc.), can be classified as “field research”, and require specific skills to analyze (and mediate between) opposing viewpoints, and ensure that all participants’ views are considered. All in all, these three methods can be defined as “built environment-driven”: the common goal being to highlight factors and functions to improve and redesign to create more walkable environments.
The fourth method, based on audits, benefits from the scientific soundness of all the three above, as it might include both quantitative and qualitative data process and analyses, and is community-driven: the goal is to develop programs and policy to improve walking conditions shared by the whole community, including additional aspects like funding, consensus-building and decision-making. Needless to say, if compared to the other three, and although more ambitious, audits are certainly more demanding in terms of resources and skills needed.

1.1.2. Innovating the Way to Evaluate Walkability

The ideal method for assessing how much an environment is walking-friendly would be to merge all of the above into one, since connectivity and GIS-based methods enable one to associate maps with a huge amount of data (and especially those related to the physical features of the built environment plus any other statistical facts), whereas audits and questionnaires cover policy making and perceptional issues, respectively. Nevertheless, a combination of the four methods would be extremely demanding and expensive (effort, time needed, funding, multidisciplinary contributions, community-engagement, etc.), and thus in the end, not really feasible. The issue that all of these methods are applied to selected routes to given facilities, i.e., to specific O/Ds, represents an additional, common limitation.
Eventually, such a combined assessment would be far from comprehensive if the goal is to evaluate the opportunities to perform physical activity on the one hand, and to switch walking from ancillary to the main leg of everyday trips across the neighborhood, on the other. To this end, a specific assessment method was developed and is here presented: the “Walking Suitability Index of the Territory–T-WSI”. It includes a number of suitable walkability indicators (to describe the different urban features) and consistent with the walkability equation above reported; an undemanding data collection process (through a mix of surveys, measurements and interviews); and an easy calculation procedure (all reported in the next Section). This synergy creates a multi-scope assessment (with Practicability, Safety, Urbanity and Appeal as evaluation categories), with emphasis placed on the specific impact areas (comfort, safety and security, attractiveness) which can shed light on the potential of a given neighborhood to promote and support active walking, and therefore its walkability, according to objective and subjective measurement results. If compared to the other methods, T-WSI is certainly less demanding and expensive, as clarified in Section 2.
As shortly introduced, unlike the usual methods to assess walkability, T-WSI is not designed to evaluate walking-friendliness of given origin-destination paths or trips, but of the whole walking environment where such activities take place, independently from the distance to walk. One might argue that for example, also GIS, per se, can be applied at area level (the neighborhood and even larger areas); but when analyzing walkability, GIS is solely applied to the routes walkability is designed to be associated with: home-to-school, home-to-station, home-to-parks, etc.
For T-WSI, the need to overcome limitations due to the route-approach and to cover the entire neighborhood areas instead, it also relies on the observation that distance to walk to destination can affect behaviors and therefore pedestrians’ acceptance [63,64]. This makes T-WSI a reliable tool to assess where people really walk and orient transport planning towards decisions where walking can be considered among the leading criteria.
Moreover, T-WSI, although not route-approach based, can also provide useful directions about the ease of reaching local facilities by people living in the study area or nearby. By assessing which could be the more comfortable, safer or attractive link, in relation to its length (as further described in Section 2.2.), it is possible to analyze where people would be more willing to walk by combining personal convenience and shortest legs in their everyday trips.

2. Materials and Method to Calculate the T-WSI

The methodology to evaluate walkability quality and potential in consolidated urban areas is centered on the development of both the T-WSI composite index and the calculation procedure, both described in the following sections.

2.1. T-WSI Concept

As a composite index, T-WSI includes the evaluation categories, Practicability, Safety, Urbanity and Appeal, each in turn involving three indicators, for a total set of 12. Each indicator measures the associated performance via a qualitative 0–1 scale and is weighed according to an expert assessment (further described).
More specifically, the four evaluation categories and related indicators are:
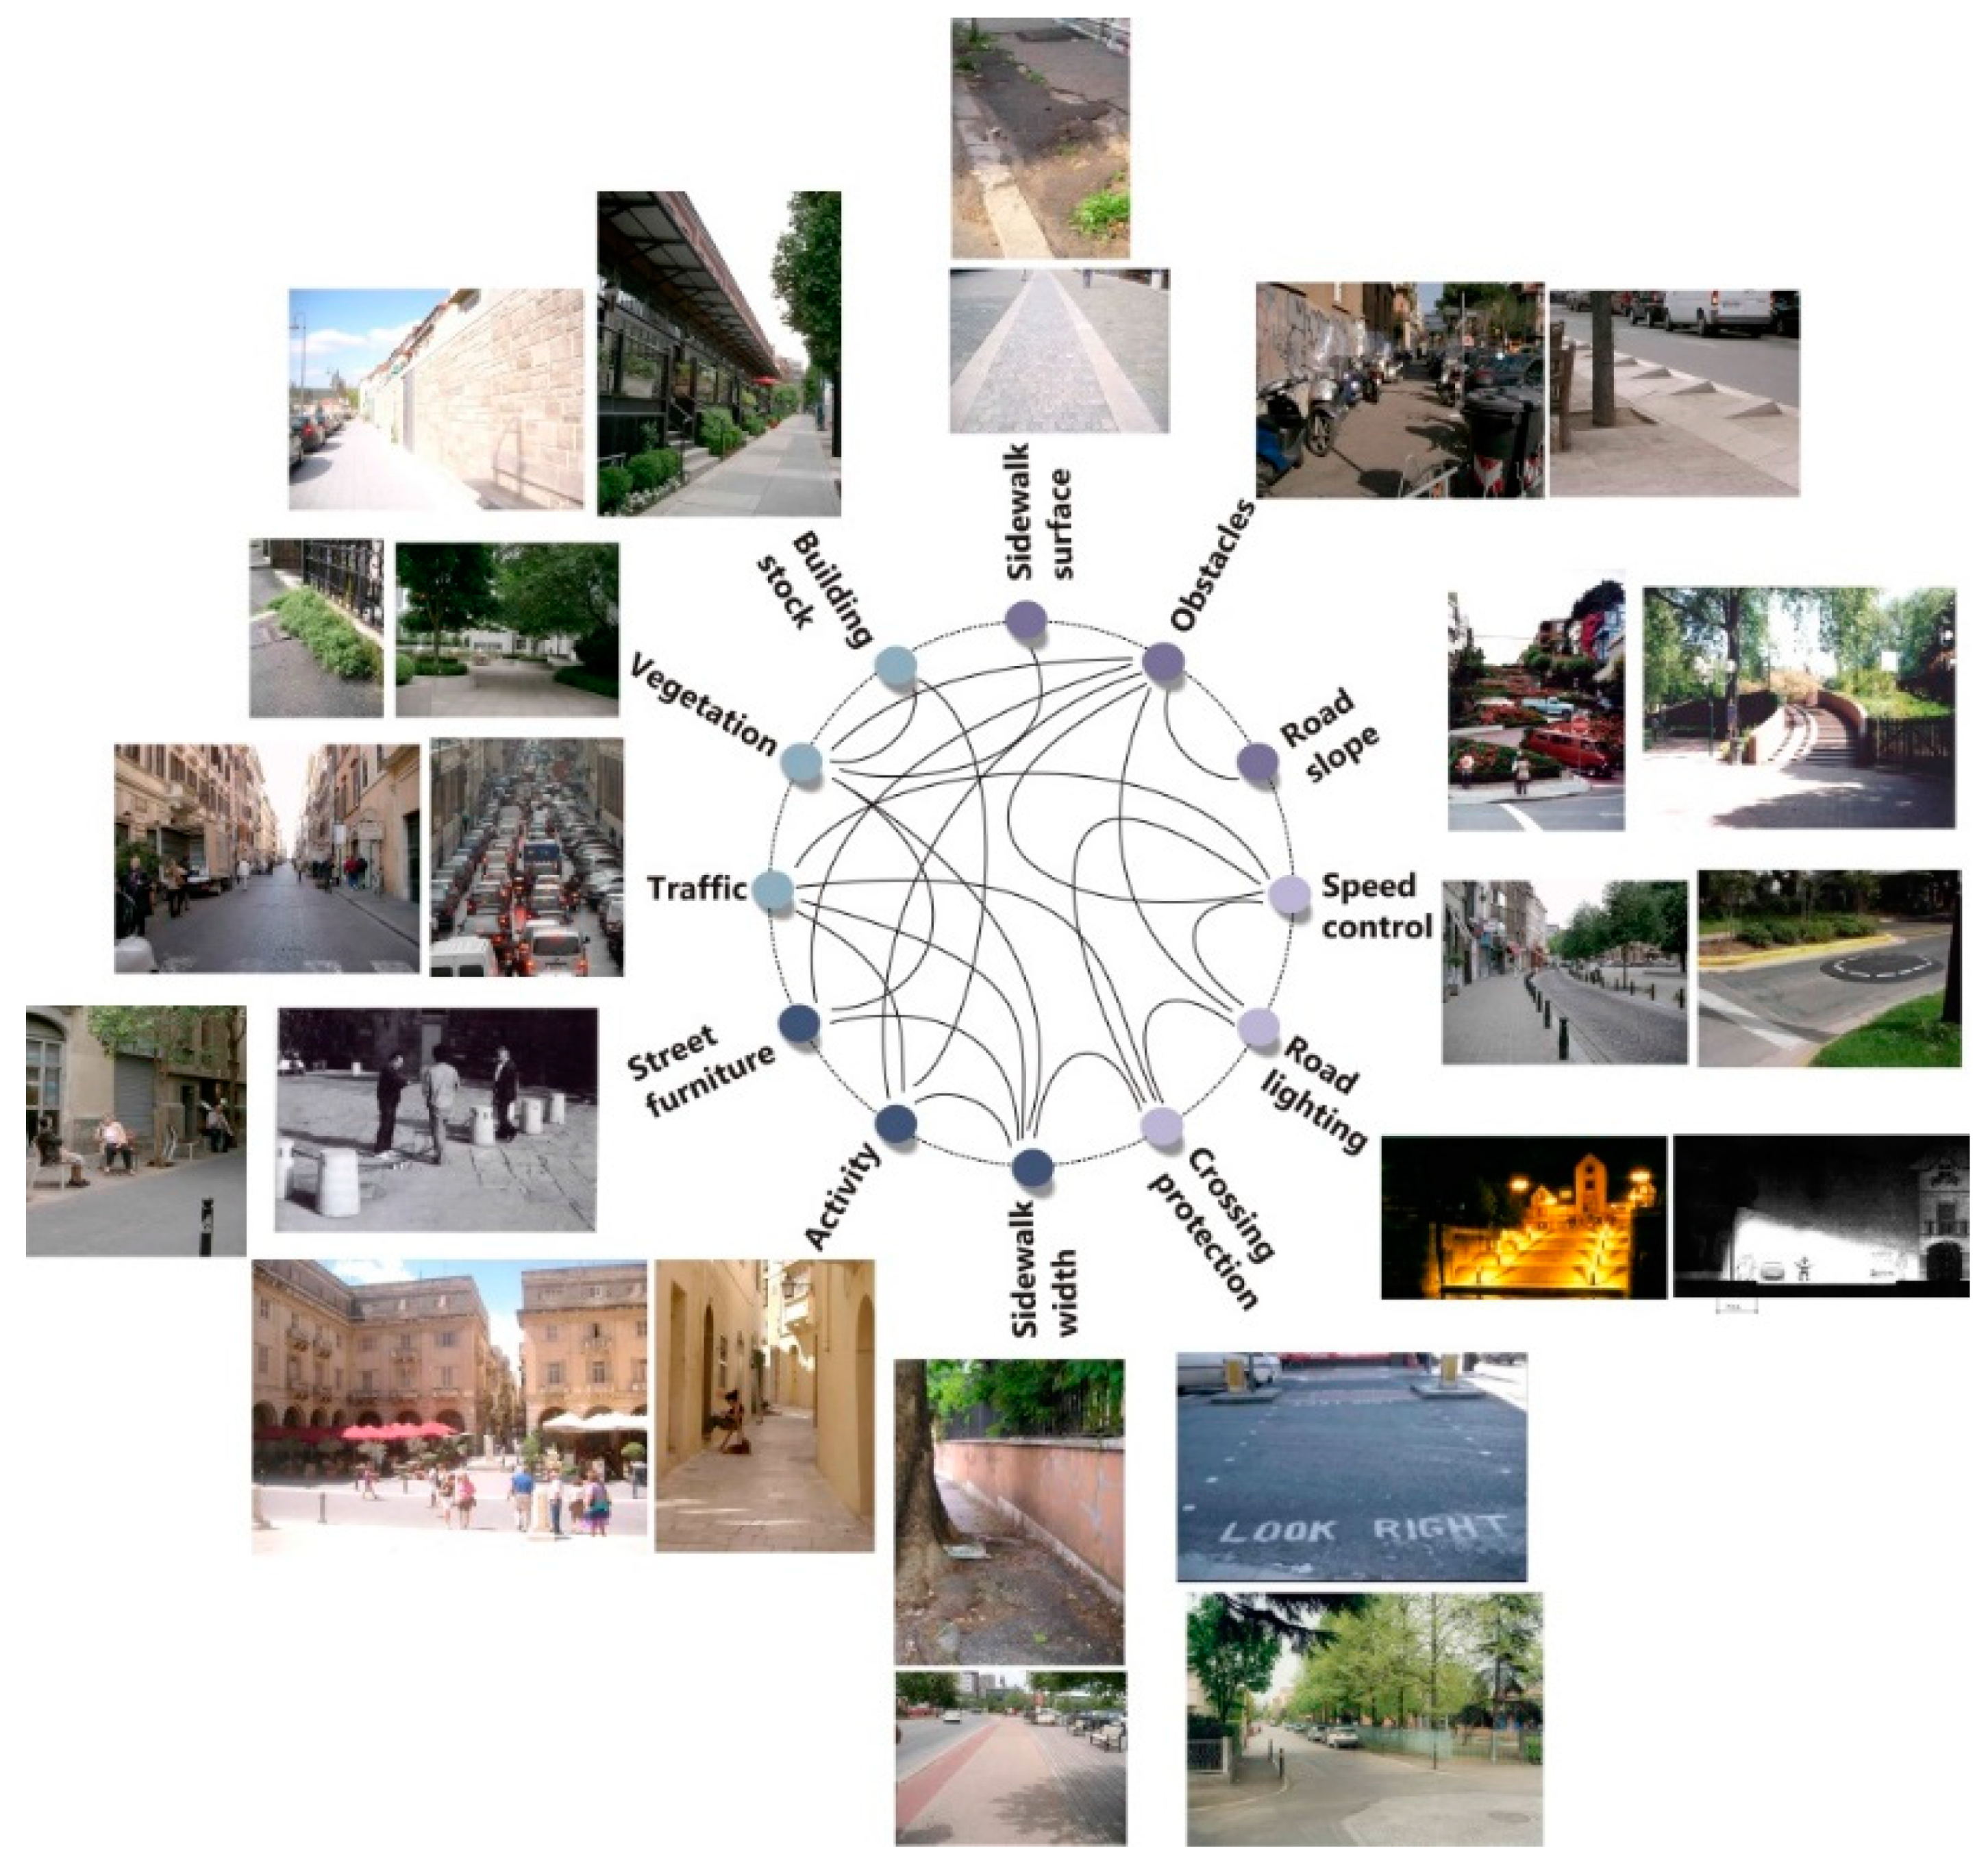
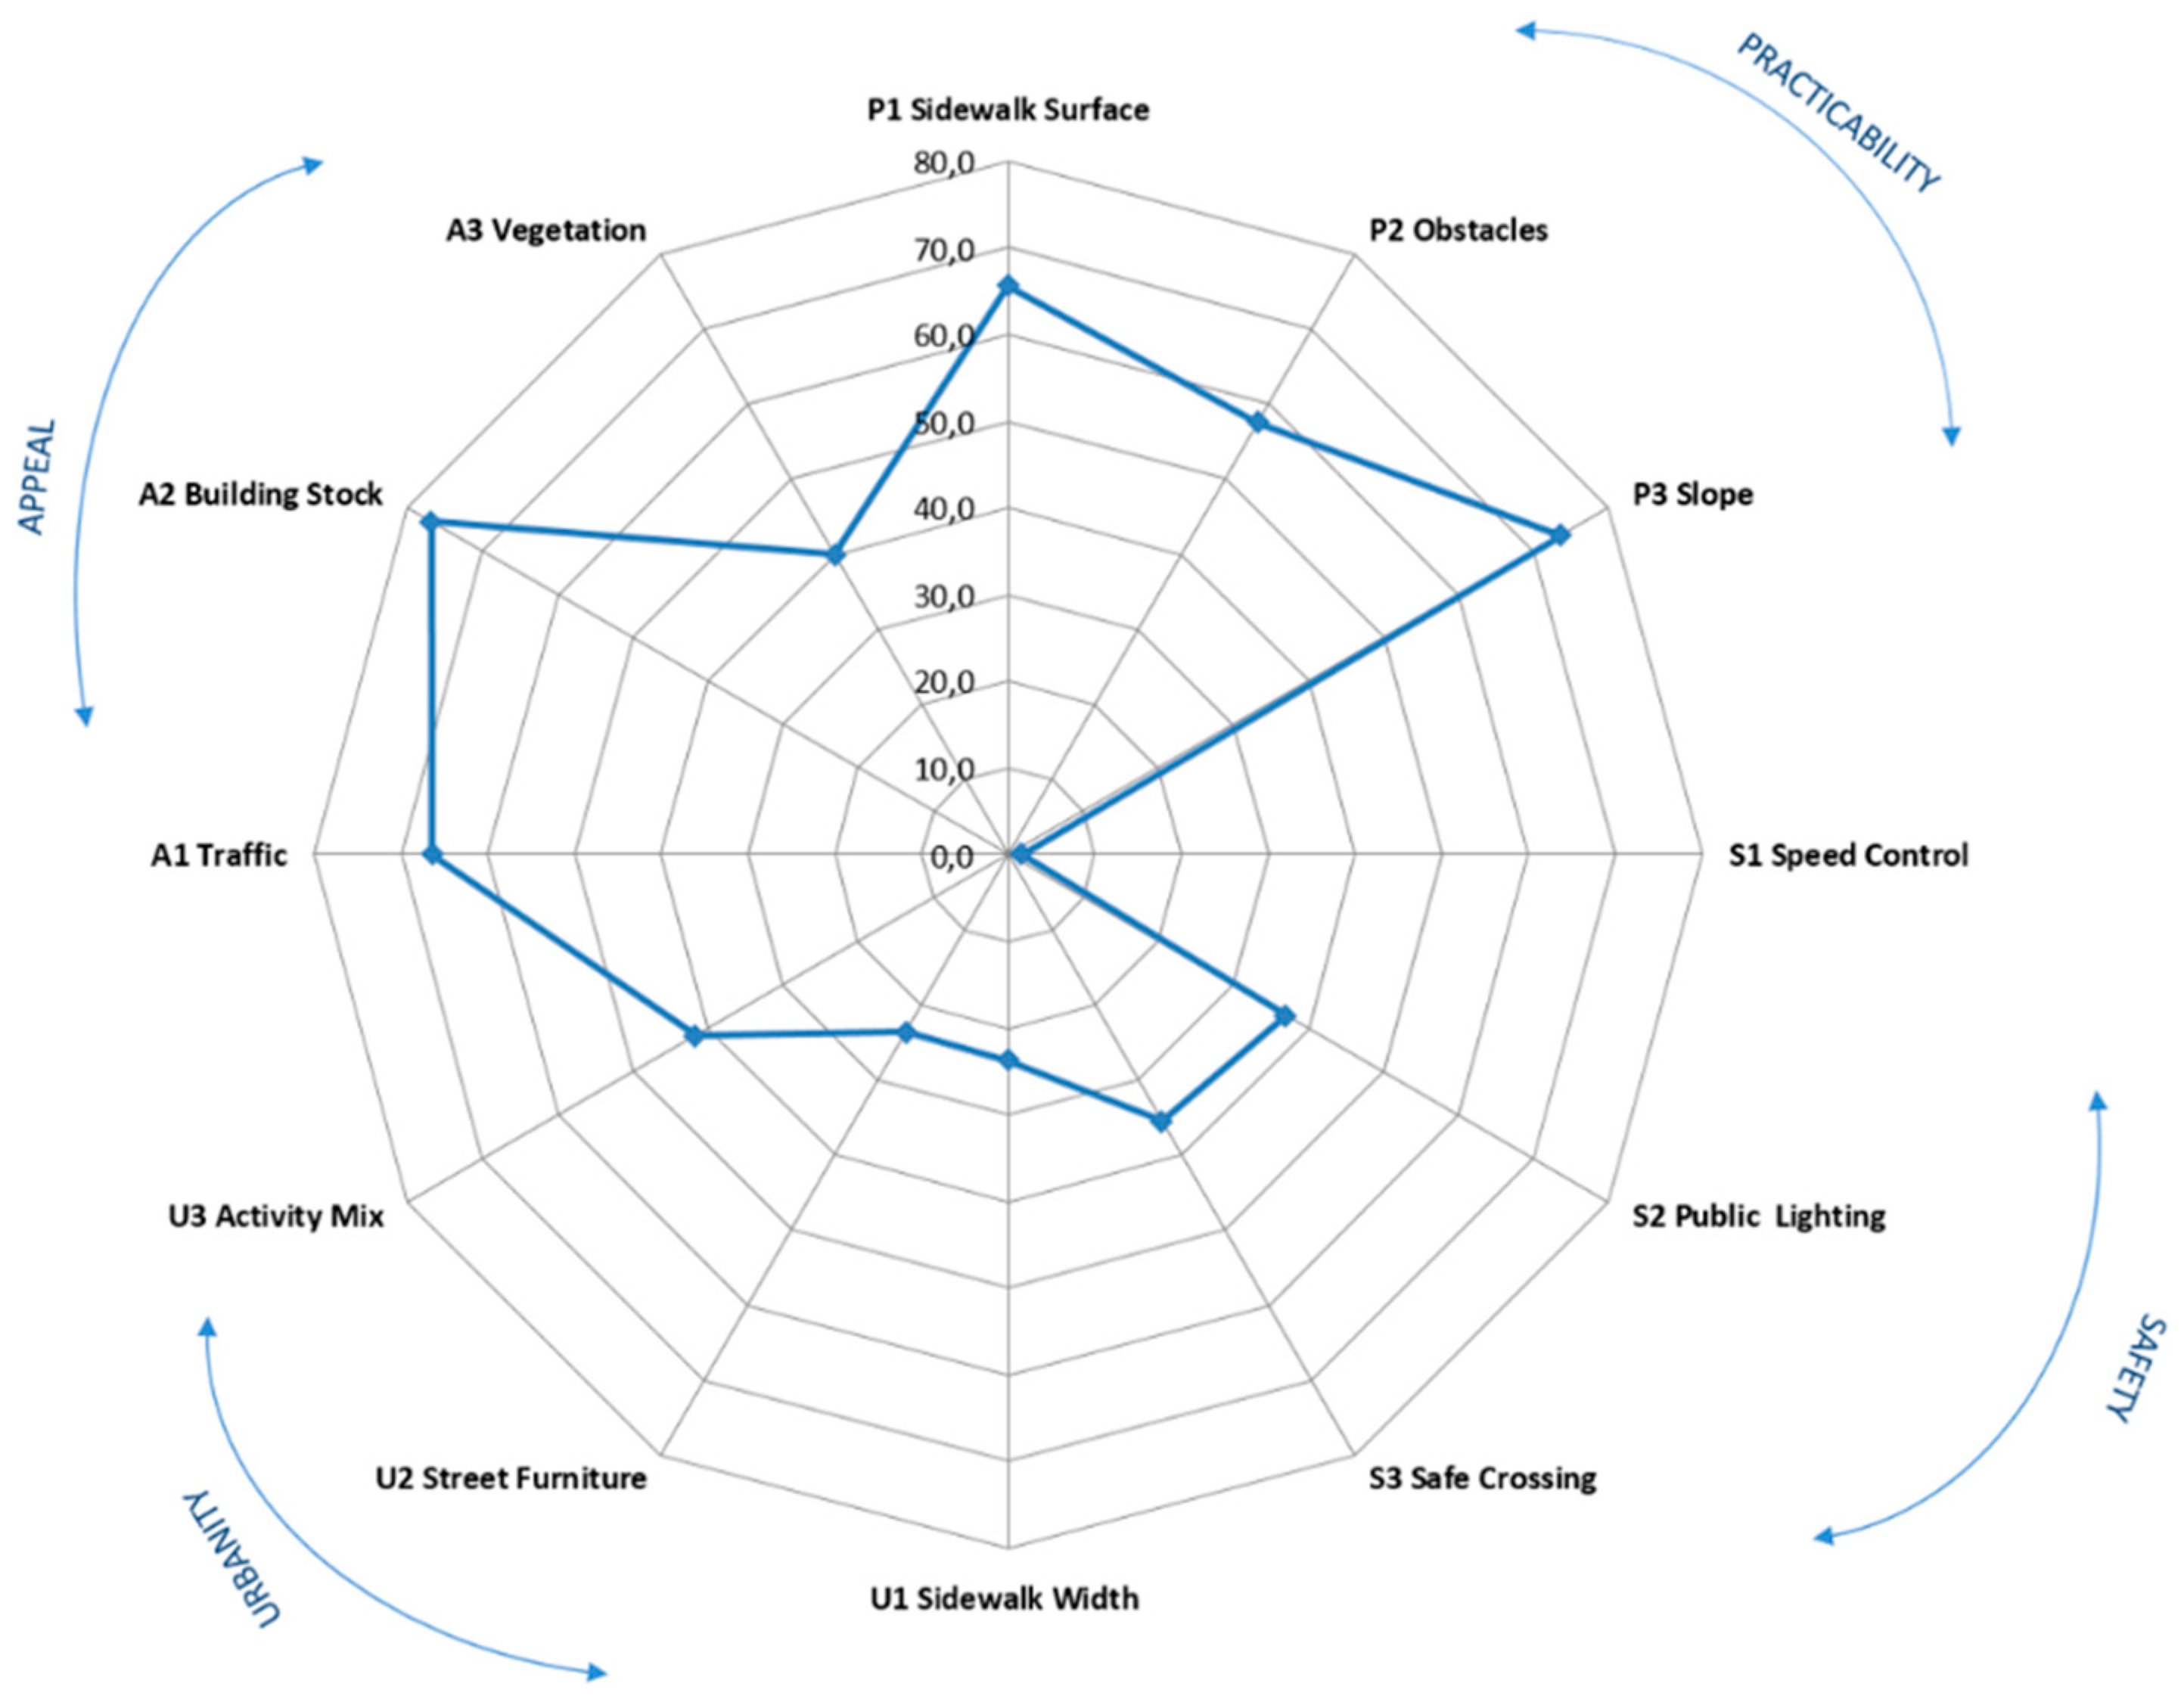
  • Practicability, i.e., the pedestrian’s comfort and ease according to the actual physical conditions of the walking surfaces. This evaluation category, meant to assess how the current quality of sidewalks may affect the actual usability of the walking infrastructure, relies on the following three indicators: P1Sidewalk surface, P2 Obstacles, and P3 Slope. Sidewalk surface optimal condition is considered when evenness is total, and it deteriorates as much as the amount of stresses and damages (chinks, potholes, cracks, etc.) increases. Obstacles (from urban furniture to utility poles and equipment), although necessary, might reduce the available walking space and help decrease LoS. Therefore, the absence of obstacles would be optimal, whereas their increasing recurrence is a contributing factor to walk elsewhere. Eventually, for Slope, optimal solutions would require no incline at all, and a 2% longitudinal slope is still generally considered usable for the majority of physically-challenged users, with 8% as a limit for walkability. However, it should be noted that road slope is a long-debated parameter, since the 8% limit can turn into a recurring condition in areas with hilly morphology.
  • Safety, as the level of avoidance of danger from motorized modes. There is a plethora of indicators to assess road safety levels, mostly based on the consequences of accidents. These are certainly essential to define black spots, but do not describe the sidewalks’ safety quality per se. In this case, emphasis is to be placed on the possibility to assess whether the major safety criterion to see and be seen can be met, and especially while crossing. This calls for three indicators: S1 Safeguard from vehicles, S2 Road lighting, and S3 Safe Crossing. Safeguard from vehicles is planned to assess whether pedestrians are able to walk free from risks originating from private cars (typically due to illegal, overspill parking onto sidewalks, or at conflict areas such as driveways) and/or have an unobstructed view when approaching the crossing areas. High levels of protection can be achieved when the sidewalks are: (i) equipped with bollards (or any other similar traffic calming device) to prevent cars from conflicting with pedestrians, mid-block or at the intersections; (ii) designed with curb extensions (typically build-outs) to reduce the crossing distance and enable driver and pedestrian to see each other; (iii) cleared from any other obstacle which might reduce visibility (vegetation, utility equipment, ads, etc.). Road lighting is targeted to assess quality of public lighting, the design of which is generally not meant to meet pedestrians’ requirements (e.g., fear of crime). Streetlights’ specific performance like illuminance and brightness is essential in preventing accidents [65], but benefits can be strongly diminished if light poles are too high, or placed in a way to create shadowy areas on sidewalks. Eventually the Safe Crossing indicator measures the level of pedestrian safety specifically at junctions, by the availability of appropriate signs and signals, according to regulations.
  • Urbanity denotes the quality or character of urban life, and in its Latin origin was a synonym for cultivation and refinement. Incidentally, this evaluation category clusters the many parameters which contribute to create comfortable and attractive walking conditions: variety of functions (by the indicator U3 Activity Mix), suitability of the infrastructure to accommodate pedestrian flows accordingly (measured by the indicator U1 Sidewalk width) and the availability of equipment and elements to support and facilitate walking (by the indicator U2 Street furniture). As an additional contribution, all are also useful parameters to assess the level of street clutter.
  • Appeal, or more general pleasantness, concerns the sphere of welfare, based on the feeling and perception caused by agreeable (or disagreeable) stimuli and how they affect walking and attract people to walk. To this end, this evaluation category includes the following indicators: A1 Traffic (for the assessment of its capability to disturb or limit walking, according to motorized traffic flows), A2 Building stock (where attractiveness is evaluated according to the type of building stock) and A3 Vegetation (availability of planted strips, or more simply trees, hedges, flowerbeds, when properly located and maintained, are certainly perceived by pedestrians as an added value). A non-negligible annotation: the role of vegetation is underestimated in transport-oriented planning and practice. On the contrary, flora in urban environments provide the visually-challenged with natural guidance via thermal and olfactory signals (for example, bus shelters can be perceived by the thermal change produced by the facility’s shadow).
Some of the walking requirements the above-mentioned indicators are associated with affect each other or are strictly interrelated. For example, uneven pavements are certainly obstacles for walking, as much as steep routes; likewise, the synergy between speed control and protection of crossings by traffic calming devices can increase safety of pedestrians; eventually, availability of suitable width for sidewalks can be an appealing factor as vegetation or appropriate lighting. A synthesis of how all these requirements interplay is provided in Figure 1.

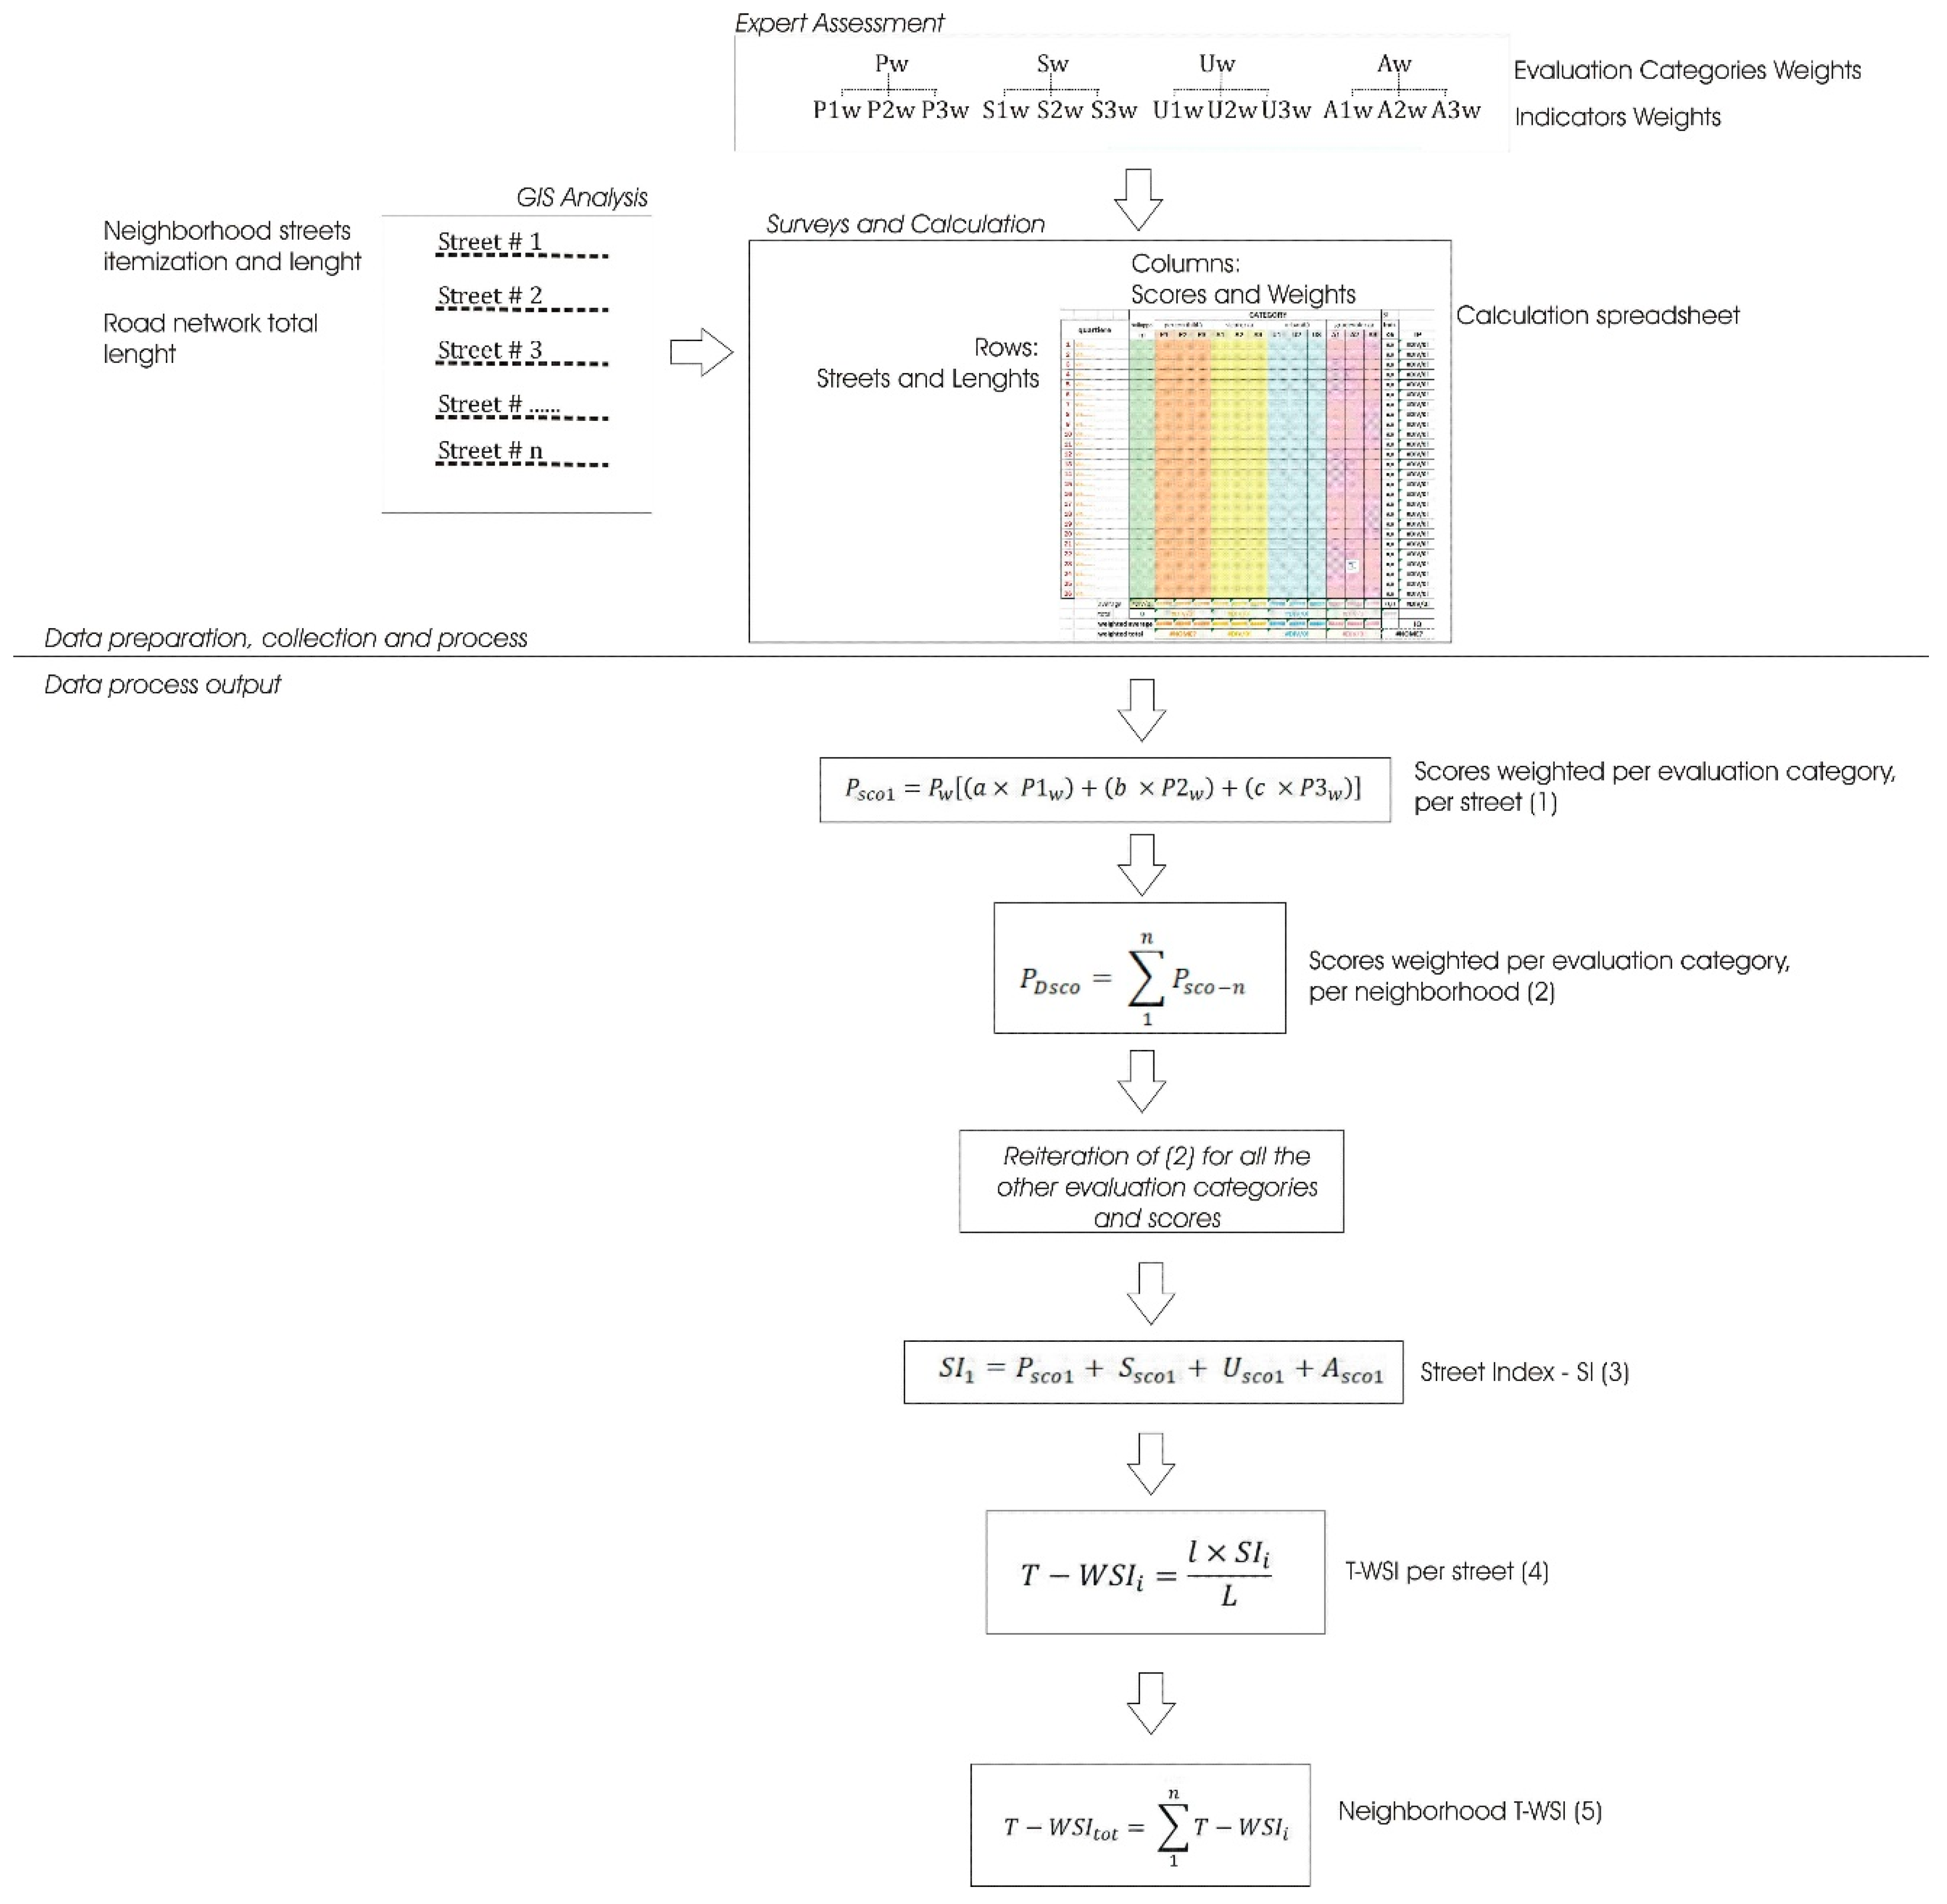
2.2. Calculating T-WSI

The calculation of T-WSI relies on (i) surveys to assess the performance level of the walkable environment according to the four evaluation categories and 12 indicators associated and (ii) the weighting procedure to highlight the relevance of a given performance over the others in impact on walkability, according to an expert assessment.
Regarding the surveys, along with the univocal definition of the meaning of each indicator (as in Section 2.1), special attention has to be attached to instruct surveyors on how to rank the performance levels, according to a 1 to 0 scale, with 1 as excellent, 0.7 good, 0.35 poor and 0.00 not acceptable, i.e., not suitable for walking. To this end, performance levels associated with each score, for each indicator, are described and surveyors instructed to rank them accordingly, as described in Section 2.4.
This process is reiterated for all the links in the district, in order to have a final score of the district walkability. A synthesis of the definition of performance levels and associated scores for each indicator is reported in Table 1, along with a description of the performance for each evaluation category.
Weights for evaluation categories and indicators were developed by a multidisciplinary panel of 49 experts. The preliminary literature review analysis on neighborhood environmental factors affecting walking was the basis to define the above-mentioned indicators, evaluation categories and criteria for scores and weights, which were presented to the experts, all coming from three different fields: urban planning, transportation and public health. They were asked to assess the overall T-WSI index and define weights for each category and indicator. After this first round, a final restricted panel of nine experts, representing the three involved field studies accepted to participate in a discussion to finalize the weights. The weights reported in Table 1 are the shared result of this discussion.
Along with that, a spreadsheet was developed to facilitate calculations. This spreadsheet is specifically designed to enter survey data and calculate the index for each evaluation category, according to the score assigned to each of the 12 indicators. The spreadsheet includes a 12 × n matrix, where n is the number of rows, each corresponding to a link (or a street) of the neighborhood or study area network. This requires an initial itemization of each link or street in the network to survey and the knowledge of its length. For example, if the Practicability category is considered, its score Psco1 for link n.1 (i.e., the street itemized first in the matrix) is calculated according to Equation (1):
P s c o 1 = P w   [ ( a × P 1 w ) + ( b × P 2 w ) +   ( c × P 3 w   ) ]
where:
  • Pw = category weight for Practicability
  • P1w, P2w, P3w = weights for the indicators P1, P2 and P3, respectively
  • a, b, c = scores assigned by the surveyors to the indicators P1, P2 and P3, respectively, in the 1–0 range.
The total score for all the n-links in the neighborhood, for the Practicability category still as the example in hand, is then calculated as PDsco in (2) as the sum of all the n-Psco calculated.
P D s c o =   1 n P s c o i
The same procedure is reiterated for the other three evaluation categories and associated indicators, each with the related weight reported in Table 1. Therefore, still considering link n.1 as an example, it is possible to calculate the Street Index–SI1 as:
S I 1 =   P s c o 1 +   S s c o 1 +   U s c o 1 + A s c o 1
where Asco1, Usco1, Ssco1 = scores for link n.1, for the Appeal, Urbanity and Safety categories, respectively.
Likewise, total scores for all the links in the network for each of the other three evaluation categories can be calculated applying Equation (2).
Consequently, Equation (3) is applied for all the rows of the matrix, i.e., for all the links considered in the surveys. However, the length of each link is not negligible in the overall assessment, both as self-standing parameter and as related to the total neighborhood network. To this end, for each n-link, SI is also assessed in terms of relevance of the link itself, compared to the whole network, thus calculating the walkability index T-WSIi for that given i-link as:
T W S I i =   l × S I i L
where l = length of the link (m), L = length of the neighborhood network (m).
T-WSIi can be reiterated for all the n- links of the network, thus calculating its total value in the neighborhood T-WSItot as:
T W S I t o t =   1 n T W S I i
In Figure 2 the algorithm for the T-WSI calculation is synthesized from the assessment of each link of the road network up to the calculation of the neighborhood T-WSI.

Additional Calculations

It is also possible to calculate for each indicator its Weighted Average WA compared to the total network length. For example, for indicator P1 Sidewalk surface, the average is:
P 1 W A   =   1 L ×   1 n ( a i × l i )
where:
  • a = score given by the surveyor to the performance indicator P1 is associated with on link n, with 0 < a < 1
  • l = length of the link (m)
  • L = length of the neighborhood network (m)
Equation (6), reiterated for the other two indicators constituting the set of 3 associated to each Evaluation Category provides its average value WAtot. For example, in the case of P–Practicability, this becomes:
P W A t o t = ( P 1 w × P 1 W A )   + ( P 2 w × P 2 W A )   +   ( P 3 w × P 3 W A )
and in turn Equation (7) can be reiterated for the remaining 3 evaluation categories, providing SWAtot, UWAtot and AWAtot, for Safety, Urbanity and Appeal, respectively.
Eventually the total average value DAW for the neighborhood can be calculated as
D A W =   ( P w × P W A t o t ) + ( S w × S W A t o t ) + ( U w × U W A t o t ) +   ( A w × A W A t o t )
where to the category weights Pw, Sw, Uw and Aw correspond the values reported in Table 1.
The spreadsheet also enables the calculation of the average value of each set of scores given by the surveyors for every indicator at every link, IAvg and to calculate accordingly the relevance of each evaluation category.
As an example, if P1avg, P2avg, and P3avg are respectively the average values of all the scores given by the surveyors for all the links in the district for indicators P1 Sidewalk surface, P2 Obstacles and P3 Slope respectively, the relevance of the Practicability evaluation category RelP is:
R e l p =   ( P 1 a v g × P 1 w ) + ( P 2 a v g × P 2 w ) + ( P 3 a v g × P 3 w )
Equation (9) can be reiterated to calculate the relevance of the other evaluation categories by simply entering the values associated with the indicators.

2.3. Reliability of the Algorithm

As further described in Section 3, the algorithm was applied to a real case study with a high number of neighborhoods to analyze, and consequently an even higher amount of links. A prerequisite was therefore the selection of a method which could validate the reliability of this algorithm “fed” by a very large number of items (links, each in turn assessed via 12 indicators and weighted as above reported). To this end, Cronbach’s alpha coefficient [66] seemed the most appropriate way to estimate the average correlation of all the case study items and composite scores achieved.
The testlet is given by the n-links and associated scores R (as itemized in the algorithm matrix) considered in the case study, according to Equation (10):
α = R R 1 ( 1   1 R σ i t e m 2 σ t e s t 2 )
where:
  • R is the sum of the n-items considered in the test T: r1, r2, r3…rn,
  • σ2itemis the variance of i—component for the current testlet σ2ri,
  • σ2test is the variance of the total scores collected σ2T,
The threshold to achieve soundness of results is α > 0.70 [66].

2.4. Surveys Organization

A core task in the development of the T-WSI calculation is to have surveyors assess the areas univocally and coherently. To this end, surveyors were instructed on how to provide scores, by comprehensively describing the meaning of each evaluation category, indicator and performance correspondence to scores to be given (descriptions in Table 1 are just a synthesis).
Each description was narrative, in Italian. Major accuracy was dedicated to defining some characteristics which might cause uncertainty, or subjectivity, in the surveyors. One case for all: Obstacles. They were clearly listed (misplaced posts, trees, urban furniture, service equipment; parked cars spilling on the sidewalks) and their assessment of performance was described in quantitative terms (density, as different amounts of items per unit area) and under the qualitative point of view (if they reduced the amount of walkable space and/or compelled pedestrians to detour and walk elsewhere, easily detectable by observing how pedestrians walked).
In some cases, the description of the performance to assess and the meaning of the scores resulted as being self-explanatory or not necessary, as the surveyors, all being locals, were familiar with the different types of “urban landscape” they were going to evaluate. For example, in Activity Mix, “mixed and continuous” referred to the typical local situation of buildings with continuous street level storefronts or entrances to public facilities and residences, ”moderately mixed” to discontinued storefronts, “mostly monofunctional” to no stores or any kind of other services, blind corners and just entrances to residences. All turned out to be well-known patterns among the surveyors.
In some other cases, specific clarifications were needed to cope with innovation. For instance, speed control was essentially aimed at assessing availability and effectiveness of devices to slow down traffic, not only as enforced by speed limit signs and signals (which are not sufficient in the case study), but also through traffic calming devices. As traffic calming is still pioneering in Italy, the list of devices was accurately described, to help surveyors who were not familiar with them.
All the information and explanations were collected and annexed to the calculation spreadsheet where surveyors were asked to enter scores. In this way, surveyors had the possibility to promptly check and avoid on-the-spot uncertainties while are already operating on the test area.
Surveyors were trained to the task (as said, were explained the goal of the research, what to survey, when, how to enter data, meaning of scores and weights) and trial sessions occurred prior to the actual surveys.
Survey sessions were organized by dividing the case study into subareas (each corresponding to the neighborhoods described in Section 2.5.2) and assigning them to the surveyors. Each of them was in charge of surveying one or more subareas and entering data for each of the itemized links. Length of each link was pre-calculated when preparing the spreadsheets. This task was relatively easy, as the average length of links never exceeded 350 m (on the contrary, should links have been in the range of half or one kilometer, they would have been subdivided into shorter legs).

2.5. The Case Study

After a preliminary study on three areas in Rome targeted to test the feasibility of the assessment method, the survey procedure and the reliability of the collected data [48], the application of the algorithm was extended to a larger area, with the goal to have a city-level test field. To this end, the middle-size city of Rieti (just less than 50,000 inhabitants), in central Italy was selected.

2.5.1. The Local Context

Already a settlement along the Velino river much ahead of the Romans, Rieti prospered through the centuries until the present day. The result is a unique, entirely walled historic city center with several landmarks and a premium-value built environment, totally walkable. Around the city center, a series of neighborhoods were developed mostly during the first part of the 20th century, as further described. Differences between the city center and the surrounding areas are numerous: (i) a self-standing city developed for non-motorized modes the former, satellite-conceived, urbanized to progressively meet the motorization requirements of the latter; (ii) mixed land use in the city center vs the dominant residential use of the more modern districts; (iii) the hilly morphology of the historic city (the originating pre-Roman settlement was located on a hilltop) versus the flatter areas of the 20th century development.
Nevertheless, as capital city of the province, the identity of Rieti is clear: a typical, quiet provincial Italian town, with a car access-restricted city center; walking still being the main modal option for performing everyday errands; functions attracting commuters from the surrounding towns; and generating traffic demand with usual peak time problems. In Table 2 the main figures of which rank, under the environmental point of view, Rieti as 61st out of the 103 Italian provincial capital cities in 2017 [67].
Rieti inhabitants are used to walking because the distances are relatively short (the total urban area could be covered by a 7 km × 10 km rectangle); this and the large use of private cars explain the modest use of transit (buses) and bike options. Due to the different development between the city center and the surrounding areas, and given the characteristics of the former (“natural born pedestrian-friendly”), the study focused on the latter where the increased motorization process competes with walking.

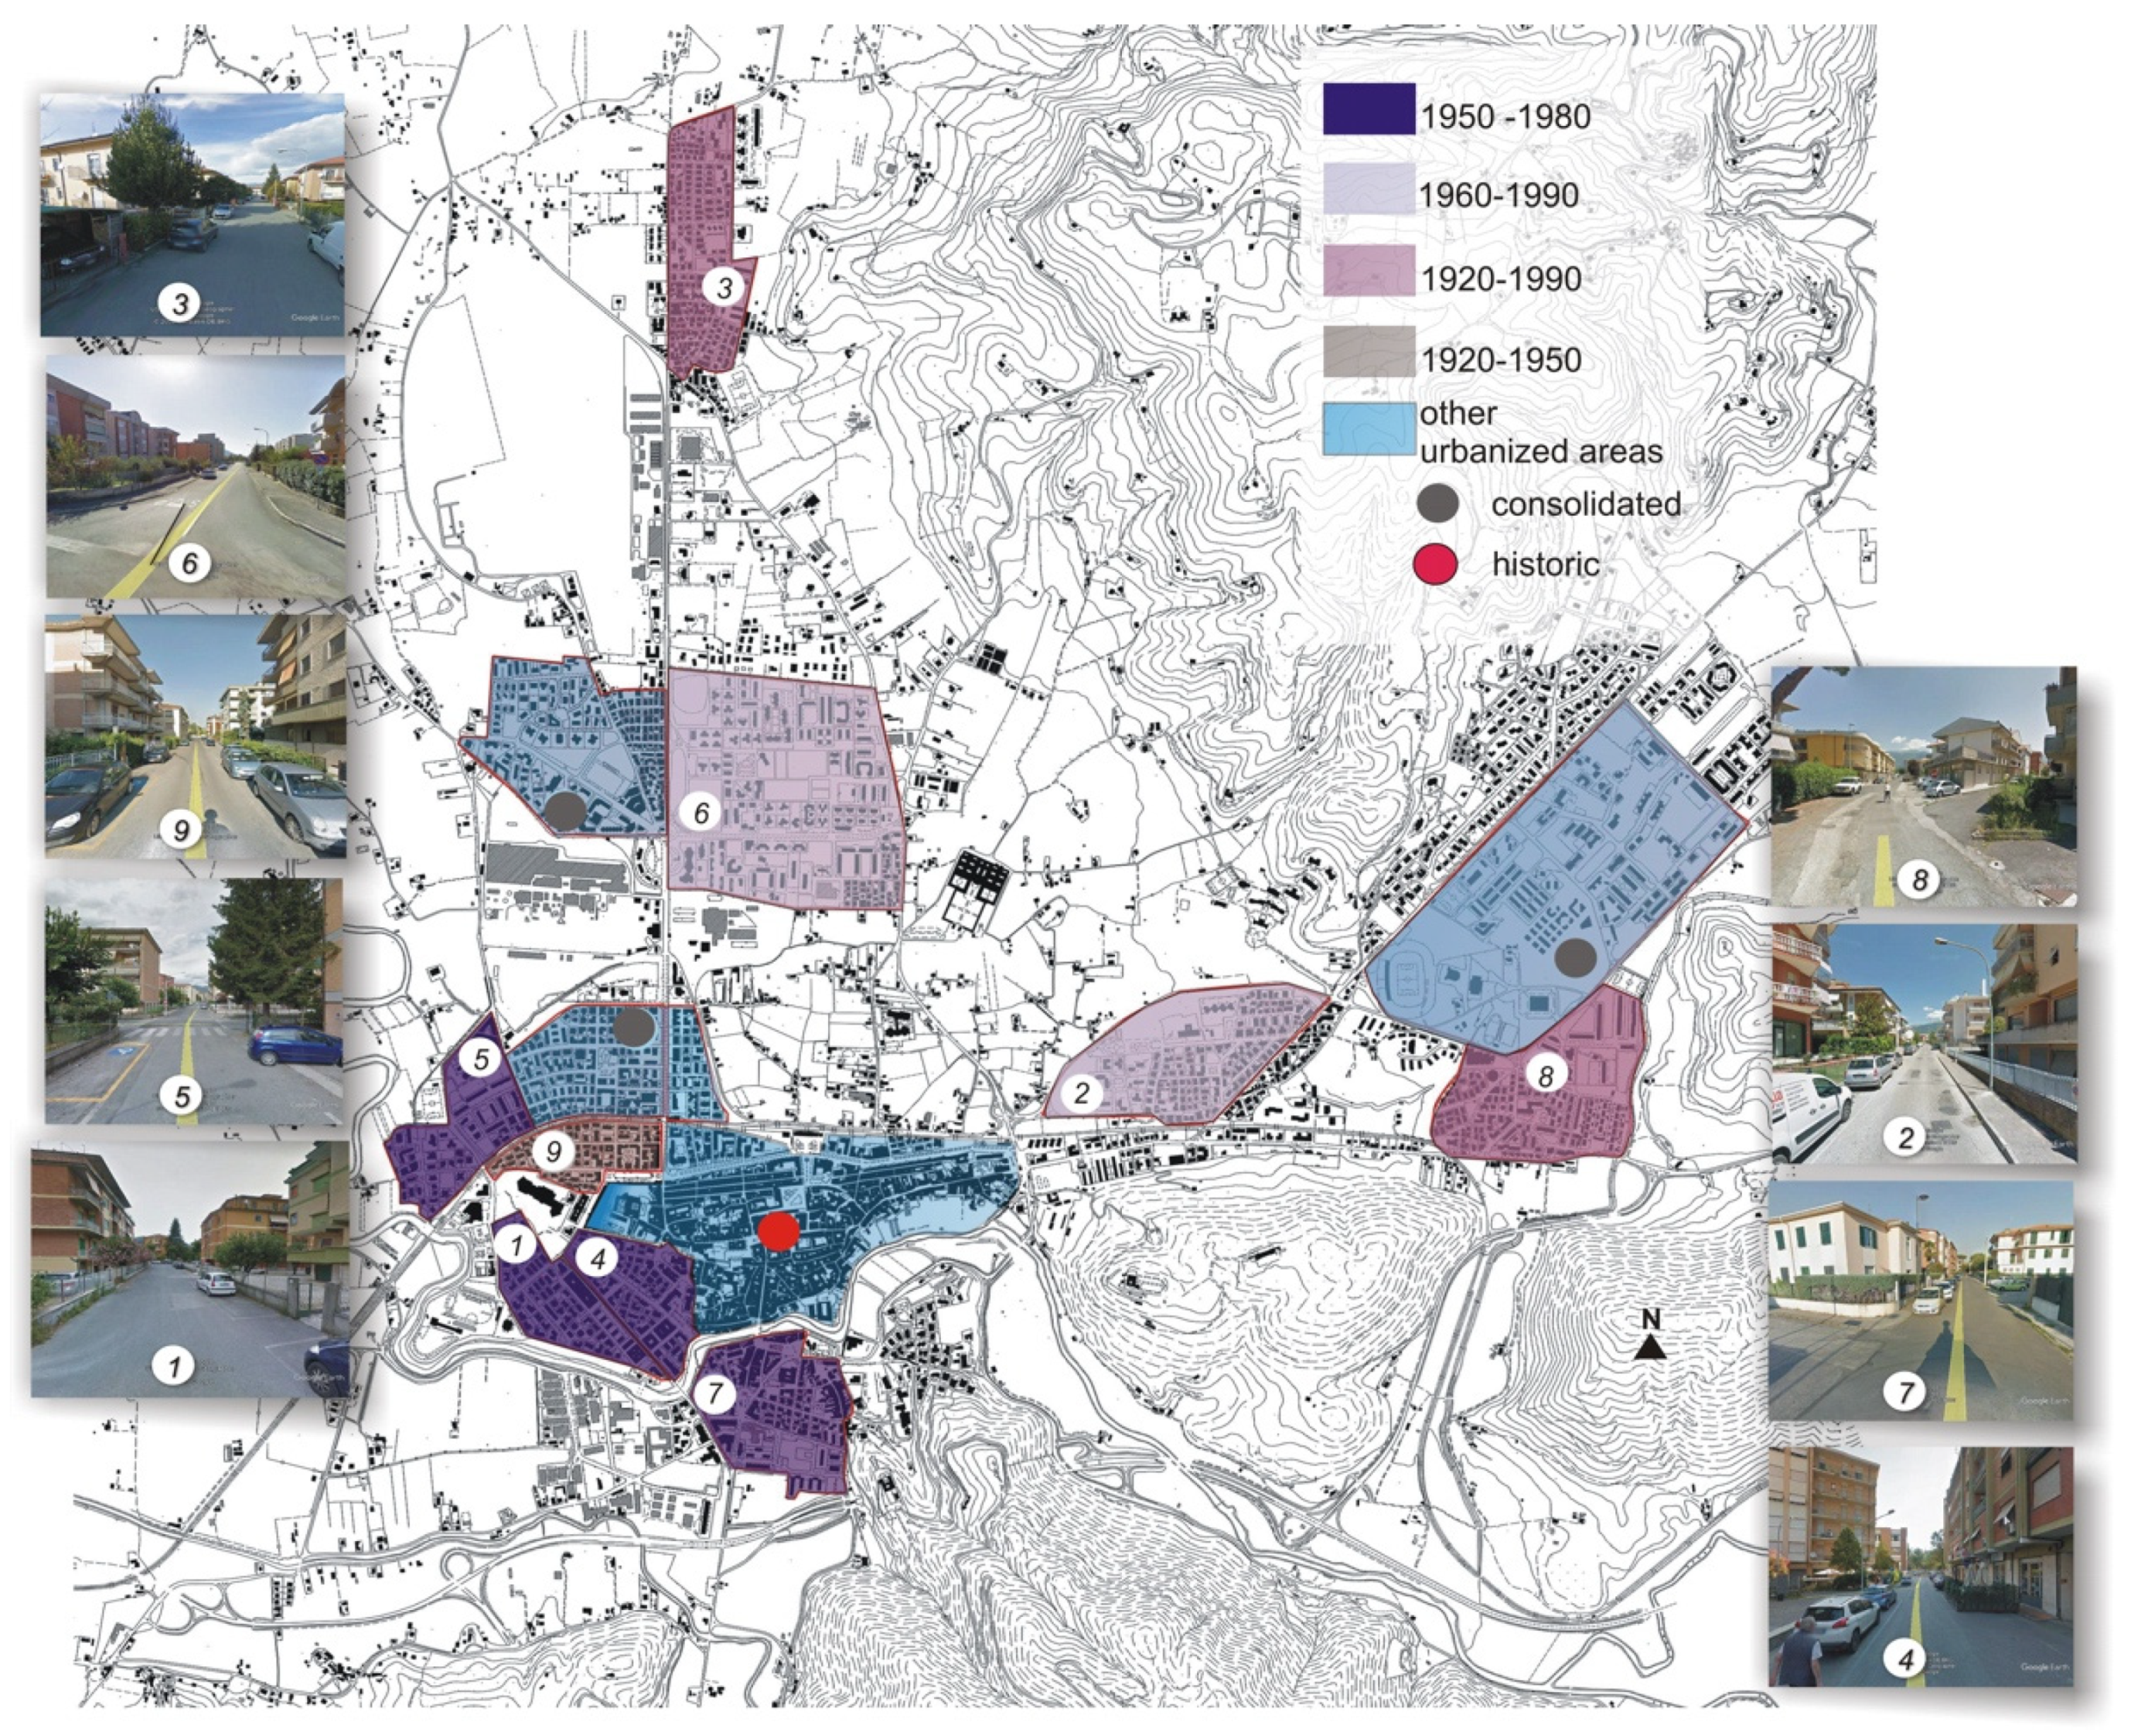
2.5.2. The Case Study Areas

The nine test areas (Figure 3), each corresponding to a specific neighborhood, can be associated with four main periods of urbanization, with different local urban texture and building characteristics.
More specifically they can be clustered as:
  • 1920–1990s neighborhoods: urbanized first during the Fascist period and later expanded, these are satellite, residential, working class areas, characterized by a mix of building types: one- or two-family houses, built from the early 1940s to mid-1960s; and two or three-storey apartment buildings (some within social housing projects) built between the 1960s and 1990s (in Figure 3, areas: 3–Quattro Strade and 8–Villa Reatina).
  • 1950–1980s neighborhoods: although mostly built during 1950s (but with some parts completed in the 1980s), these middle-class areas, close to the city center, feature a mixed building stock composed of detached and terraced houses, little villas, and low-rise apartment blocks, all with residential main function (in Figure 3, areas: 1–Città Giardino, 4–Fiume dei Nobili, 5–Molino della Salce and 7–Borgo).
  • 1960–1990s neighborhoods: these suburban areas include a mix of prevalently low-rise apartment blocks and terraced houses (in Figure 3, areas: 2–Piazza Tevere and 6–Micioccoli)
  • 1920–1950s neighborhood: the initial development of this area (in Figure 3, area: 9–Viale dei Flavi) started during the 1920s, lasting until the early 1940s as first expansion close to Rieti historic core (highlighted with the red dot in Figure 3), and ended in the 1950s. Unlike other contemporary districts, the quality of the built environment is higher and land use is mixed (small villas, low-rise apartment blocks, public buildings).
Accounting for 63% of the population living outside the city center, i.e., 15,469 inhabitants, the nine neighborhoods markedly differ in terms of population density (Figure 4). If referring to the average density of the whole study area (8304 inh./sq. km), the 1960–1990s neighborhoods are the less densely inhabited, coherently with their suburban nature, whereas the highest values are recorded both in the 1920–1990s and in the 1950–1980s neighborhoods, with 10,751 inh./sq. km (at area 3–Quattro Strade) and 11,052 inh./sq. km (at area 3–Città Giardino), respectively.

3. Quantitative Results: From Study Area to Street Levels

As from Figure 3, the nine neighborhoods cover the majority of the built area of the Rieti municipality with the exception of the city center which, as said, is naturally walkable and car-access restricted. The availability of such a large area ensures soundness of results (173 items, i.e., streets processed by the algorithm) and the possibility to detect recurring performance levels and critical factors affecting walkability, according to real built environment conditions. All of the above is described in the next sections.

3.1. The “Most and the Least Walkable” Neighborhoods

A most sought-after outcome was to identify the “most walkable”, and conversely, the “least walkable” neighborhoods according to the algorithm application and T-WSI results. T-WSI values (calculated according to Equation (5)), if analyzed per period cluster (Table 3), stress the poorer walkability performance of the 1920–1990s neighborhoods, which rank far below the average, if compared to the other clusters. These, in turn, show more homogeneous scores, with area 1–Città Giardino ranked first. The analysis of the relevance of a given evaluation category over the others clearly evidences that requirements associated with Safety and Urbanity are far from being properly met, whereas those in the fields of Practicability and Appeal, although with large variability, seem to achieve more satisfactory performance levels. More specifically, it should be noted that Appeal can be considered a quality factor for the least walkable neighborhoods, being this is the highest ranked for both areas 8 and 3. Modest performance assessment for the Urbanity Evaluation Category is also highlighted by its average value, according to which only four out of the nine neighborhoods are above such a threshold, whereas values above the threshold for Safety are reached in five out the nine neighborhoods.
Focusing on the average value for T-WSI, the six neighborhoods ranking above it account for the 70% of the total study area and 44% of the whole urban area, historical center not included.
Table 3 results can be grounded in the analysis of the specific indicators associated with each evaluation category. Drivers towards scores above the average are performance levels associated with the indicators in the upper part of Figure 5, with A2 Building Stock, P1 Sidewalk Surface, P3 Slope and A1 Traffic the leading ones. U1 Sidewalk Width, U2 Street Furniture, S2 Public Lighting and S3 Safe Crossing are, in turn, clear barriers in reaching walkability’s satisfactory levels.
Large variations of scores can be observed among the different cluster periods and associated neighborhoods (Table 4).
Coherently with the aggregated results of Table 3, the 1920–1990s neighborhoods are below the average of every indicator, with the exception of A1 Traffic and A2 Building Stock, ranked far above it. However, the most unexpected result is the overall poor S1 Speed Control levels in seven out of the nine neighborhoods.
A concluding remark concerns the full soundness of results achieved. Cronbach’s alpha test results reported α-values always above the requested 0.70 threshold.

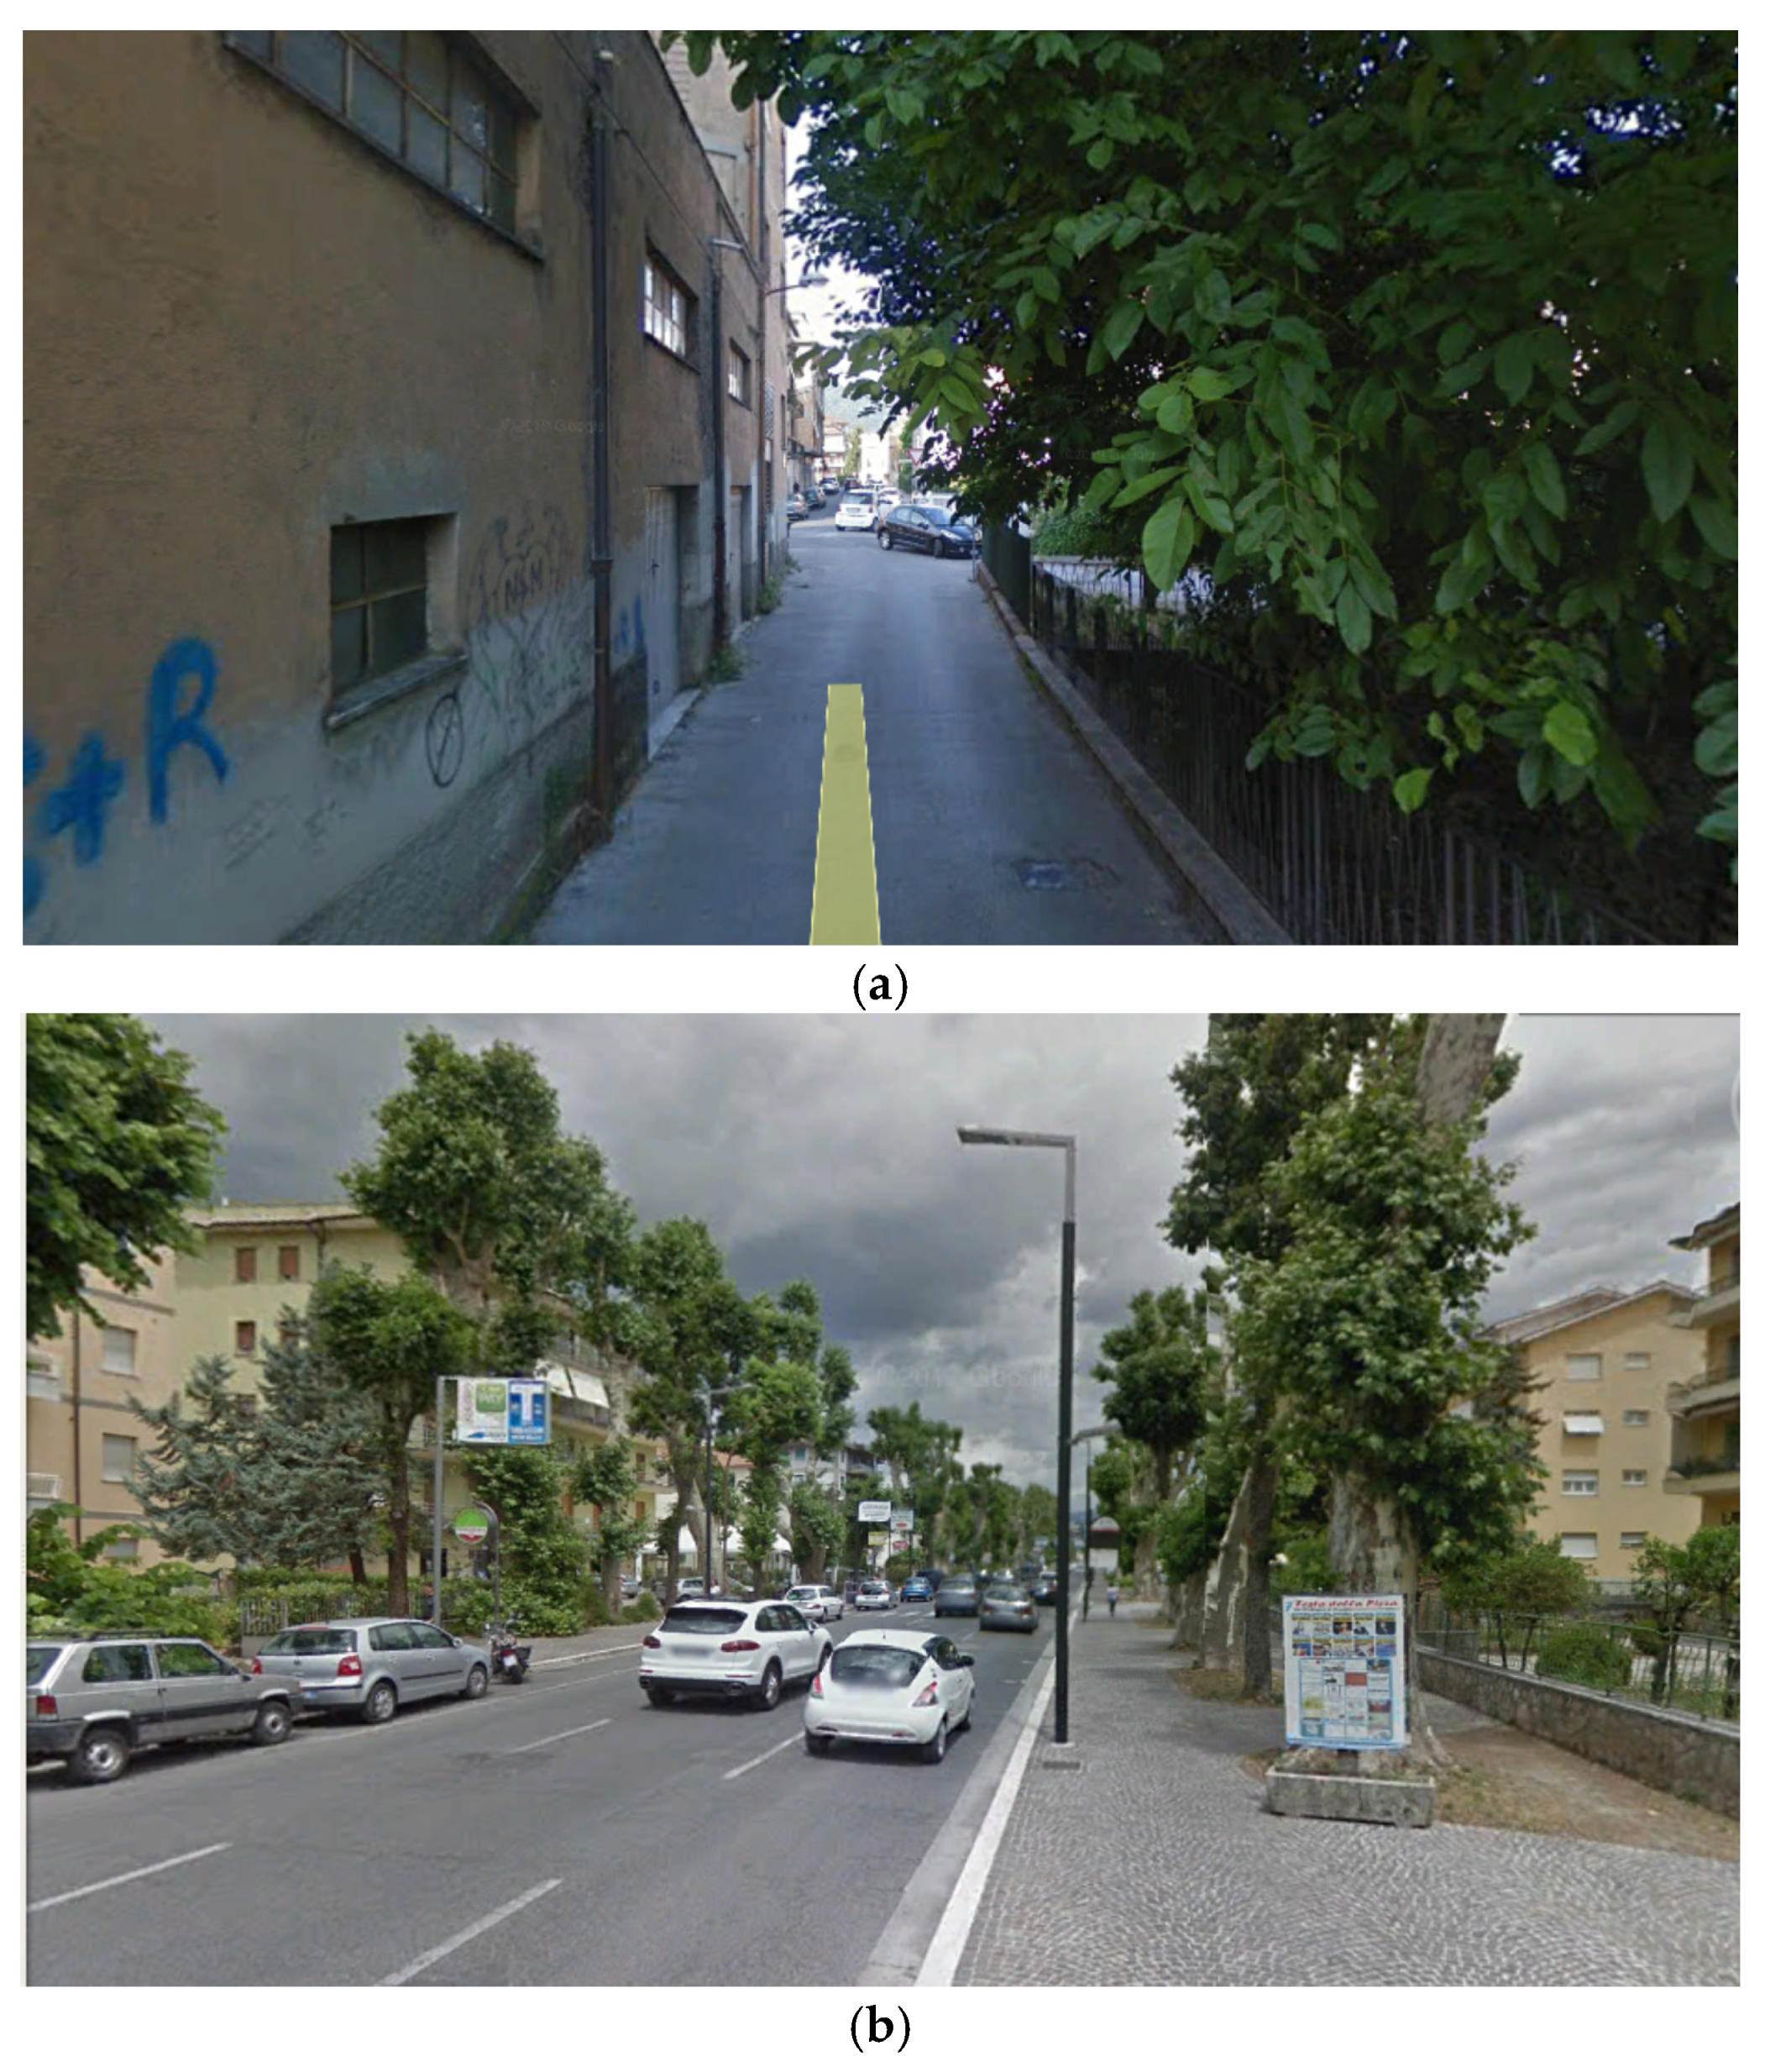
3.2. Best and Worst Cases

Results reported in the previous section synthesize those calculated for each of the 173 links of the study area’s street network. Variability of results, given the high number of processed items, was expected, but limits in the range values of each indicator (and especially the lower ones) are difficult to interpret without considering the real environmental features behind them. To this end, two specific cases in point are reported representing typical best and worst conditions generating high or low scores of Table 3 and Table 4, calculated according to the SI (i.e., the sum of the weighted scores given to each indicator of each Evaluation Category for a given link as described in Equation (3)) and the related T-WSIi. calculated as in Equation (4). The two cases are, respectively a) Via Selci in Sabina in the Borgo neighborhood and b) Viale Maraini in the Viale dei Flavi neighborhood, with SI 13.7 and 79.7 and T-WSIi. 0.16 and 5.61 (Table 5). The former is a typical alley connecting two local roads and the latter is one of the city’s boulevards. Aside from the scores from Table 5, the overall quality level of both in terms of walkability, according to Figure 6, is intuitive and no further comments are needed to stress how the synergy among the “canyon effect” and lack of sidewalks and on-street functions are the main generators of the low scores for (a). Likewise, for (b), full availability of walking areas, vegetation, public lighting, and appropriate urban furniture all contribute to make Viale Maraini the best case.
Moreover, alleys like case (a) are rather common in the urban fabric and oftentimes represent connections or shortcuts to more walkable links and, as such, are used by pedestrians just out of personal convenience.
Best and worst cases are certainly partly representative of the other “in between” 171 items of the Rieti street network and they become useful examples to define actual performance targets to aim for, as well as thresholds not to be reached, within further successful transport plans, local rehabilitation or road safety programs. Needless to say, the variety of results evidenced in Table 3, Table 4 and Table 5 and Figure 5, although consistent with the large number of items analyzed, raises several issues and paves the way for further elaboration, all reported in Section 4.

4. Results Interpretation and Discussion

The Rieti case study outcomes above described a two-pronged discussion: on the one hand, some considerations on the T-WSI algorithm in light of the results achieved; on the other hand, an interpretation of the results to highlight patterns affecting local walkability, both useful for further T-WSI calculations elsewhere.

4.1. Methodological Achievements and Lines for Advances

The consistency and soundness of the survey adopted to evaluate the performance levels of the street network in hand is high; as said, the reliability coefficient α > 0.7 enables the survey data to be quantitatively analyzed.
However, it is not possible to neglect the reasons behind the overall modest performance in the field of Safety, and more specifically those associated with the indicator S1 Speed Control, which is equal to 0 in 7 out of the 9 neighborhoods, and that might convey the idea of an unsuitable assessment or inaccuracy.
As explained in Section 2.1, S1 is designed to assess pedestrian safety in terms of: safeguard from conflicts from motorized modes (drivers’ illegal behaviors, mostly); compliance with the general principle “to see and be seen” at crossing areas; speed control enforcement. All of the above can be achieved by enforcing the so-called “Environmental Areas” (the Italian version of the Zones 30 s) and extensively implementing traffic calming devices. Unfortunately, in Italy practice for both is still lagging behind and cities with consolidated examples are still few (unfortunately, Rieti is not among these).
Performance levels scored 0 in the field of S1 Speed Control can be, then, translated into the need to progress with the enforcement of traffic calming devices and speed control regulations.
At the same time, S1 represents not a minor requirement but the experts’ assessment for its weight was mild (just 31, whereas issues such as sidewalk surface and width were both given a weight equating to 40, for example), driven by the awareness that traffic calming and environmental areas are still under development in Italy. This raises the issue of the appropriateness of weights when dealing with road safety and whether, when transferring methodologies like this in hand, these must be re-assessed according to local conditions. Concepts like the “Road Safety Space”, according to which economic resources, institutions and regulations, as well as social patterns, affect the possibility to successfully transfer road safety measures and concepts from one place to another [68], and, more generally, transferability policies for sustainable mobility measures [69], would clearly suggest the need to re-align scores when dealing with road safety conditions and local contexts different from to the origin one. This certainly represents a recommendation for further adoptions of the T-WSI methodology.

4.2. Lerning Lessons from the Case Study

Results reported in Section 3 create a kind of snapshot of local walkability performance levels. As such, they can be used to prompt local policies and solutions to solve poor performance problems whenever they have been detected in each of the 9 neighborhoods, according to the T-WSI scores. However, results achieved can be also interpreted beyond the Rieti case study, and more specifically in perspective of the application of the T-WSI methodology and algorithm farther afield.

4.2.1. Relevance of Urban Development Processes

An initial example is the analysis of the reason for the low T-WSI values for both the 1920–1990s neighborhoods. This can be ascribed to the long development of the areas, started prior to the massive motorization phenomenon and concluded when this fully escalated. Infrastructure for motorized and non-motorized modes were initially planned to accommodate modest traffic flows. Typical related problems such as, for example, appropriate parking supply were not even contemplated. The same did not occur to the other neighborhoods of the case study, since some were developed contemporarily to the massive motorization phenomenon (the 1960–1990s and 1950–1980s) and others were already fully developed (1920–1950s).
Adaptation of the “pre-car” built environment to massive motorization is always a long-term process, where dominant traffic components’ requirements, i.e., passenger cars, are usually considered the top priority since they are conceived within regulatory visions based on traffic plans, and not integrated with land use policies. This is due to discrepancies between the time horizons of mobility and land use policies, and between their scales of applications which result, in the long run, into the unsuitability of infrastructures for both drivers and pedestrians and the consequent adaptation of the built environment to meet the requirements of the former. For example, reduction of walkable sidewalks’ width to accommodate on-street parking requires a relatively short time to be enforced and is usually small-scale (street level, area level). On the contrary, land use regulatory tools, e.g., master plans, forecast changes that entail slower physical alterations of the local built or natural environments (at district level, such as rehabilitations in favor of pedestrianization programs, Transit Oriented Developments, revegetation processes, etc.), which although affecting the local mobility patterns at a larger scale, will require longer periods to be enforced and even longer ones to assess their benefits for the local community.
The 1920–1990s neighborhoods low walkable performance is therefore a typical sign of how the complexity of urban environments calls for the need to integrate land use and mobility planning visions [70,71].

4.2.2. Switching Priorities: Non-Motorized Modes First

The need to intervene on safety, highlighted by the low scores of Table 4, along with the need to improve speed control and progress with the enforcement of traffic calming, is also one more sign of prioritization of motorized traffic requirements. Public lighting, although fully available in all of the 9 neighborhoods, is supplied by high poles engineered to support luminaires to deliver general lighting output to the area to serve, with no specific lighting objectives (carriageways, sidewalks or both). This could be sufficient for driving but not for walking. Safe and comfortable walking paths require specific solutions like cutoff, directional optical devices to meet pedestrian needs for light distribution: typically, uniform light patterns, no light above the horizon, no glare, no shadows. Likewise, modest scores for safe crossings shows that the mere compliance with the regulations in terms of signs and signals is not enough to increase the perception of safety when crossing a street.
The lesson learnt, in this case, is to avoid general solutions, either simply dictated by regulations or meant to meet the requirements of both motorized and non-motorized road users at the same time, because pedestrians have very specific safety requirements, with well-known consequences if left unmet [72]. At the same time low scores in the field of safety can also prompt local administrations to prioritize amending policies. This shifts the focus on the need to link road safety priorities to the enforcement of regular maintenance programs for sidewalks, consistently to the concept of Safety Potential–SaPo [73], which enables us to draw a priority list of road links in need of urgent safety interventions, and to calculate the resulting decrease of accidents and costs [74,75].

4.2.3. Diversity, Density and Design Dimensions are not Equally Manageable

One more remark rises from the outcomes in the Urbanity and Appeal evaluation categories. Although both equal in contributing to generate the eudaimonia of the built environment elaborated in Section 2, results achieved in the study area stress the different relevance exerted by Urbanity, as the quality of life in a city, and by Appeal, as the power to attract or generate interest. If data in Table 3 are considered, the scores for Urbanity are just above the average in four out of the nine neighborhoods, whereas Appeal is more favorably assessed in the whole study area. More specifically, according to Table 4, U2 Urban Furniture and U3 Activity Mix seem to be the most contributing factors within the Urbanity evaluation category, unlike Appeal where only A3 Vegetation achieves low scores.
Such results are certainly affected by local conditions and can be locally elaborated, as well. For example, modest performance for A3 Vegetation in Table 3 is generated by a relative paucity of green areas, but this is coherent with the local context: towns like Rieti developed from compact settlements, with dense stones and bricks and textured urban fabric and infrastructure, resulting in mineral landscapes. Likewise, U2 Urban Furniture stresses the same paucity in terms of equipment to create more comfortable conditions for walking, mostly benches on which to rest. U3 Activity Mix low performance simply describes that the surveyed areas are monofunctional, i.e., residential and that the other services are basic and simply designed to function at area scale (typically facilities like the local church, primary schools, the corner shops), attracting and/or generating local pedestrian traffic. An initial solution would be, in this case, to start a beautification process and increase green and urban furniture supply (possibly avoiding street clutter), but there is no certainty that this would automatically result in more walking trips in the areas, there being no reason to walk aside from reaching the few local destinations from home. At the same time the local building stock cannot be modified to accommodate more functions different from the residential or the basic tertiary ones, and even if so, this would be detrimental to the natural centrality of the historic city.
The Rieti T-WSI elaboration highlights therefore a typical situation of many historic city centers surrounded by consolidated and recently-built residential areas, with the well-known 3 Ds [26] difficult to manage: urban Density and Diversity which are difficult to adapt to influence everyday travel patterns, with only the Design dimension left available to intervene upon. Again, this is one more sign that solutions can be found in the enforcement of overall mobility management policies at city level, based on a “stick-and-carrot” approach, i.e., with measures targeted to “provide incentives to attract passengers to transit” and “disincentives to the use of private cars” [76]. Pedestrianization or improved walking conditions by creating dedicated routes are recurring measures associated to the disincentives in Europe [71,77], especially in central areas like Rieti’s.
But the challenge is to enforce measures to orient travel patterns towards transit in medium towns like Rieti, where short distances, the dominance of private cars and parking as a minor problem make conventional modes like buses poorly attractive. The integration with paratransit, collective taxis especially on fixed routes, could be highly effective not only in boosting the use of public modes but also to extend the share and length of related ancillary walking, thus promoting healthier lifestyles.
One last point to stress: in towns where walking is not common, T-WSI certainly helps highlighting priority areas in which to intervene first. One might argue that in provincial towns, such as Rieti, which might seem to offer ideal conditions for walking, T-WSI might be redundant. However, in towns even where walking would appear to be a natural mode, such as in Rieti, the increased motorization process is jeopardizing traditional walking-based lifestyles. Tools like T-WSI are then equally needed to help decision makers to keep fostering walking and direct interventions where walking is at risk.

5. Concluding Remarks

Results achieved in the initial Rome test [48] and those herein presented proved the feasibility and flexibility of the T-WSI methodology to calculate walkability levels on a given area. Unlike other walkability assessment tools designed to assess performance on a selected O/D paths only, T-WSI easily enables the assessment on each link of the local street network, compare related performance levels, aggregate data at neighborhood level and determine the overall walkability status. Flexibility is ensured by the possibility to: (i) use the same weights here presented or update them, if local context calls for specific requirements; (ii) introduce more indicators, if need be; and (iii) extend the assessment, i.e., including more and more links, by simply adding more rows in the calculation spreadsheet. Therefore, if compared with other tools, the possibility to adapt weights, scores, and indicators to accurately reflect the local context (either historic, consolidated, contemporary, or all of the above), while still providing area-wide assessments, is a T-WSI actual point of strength.
However, the interpretation of T-WSI results highlighted more important functions; first, whenever indicators shows critical values, the possibility to use data for fast on-street recovery interventions; then, in the case of evaluation categories’ critical aggregated values, the possibility to enforce area-wide rehabilitation programs; and, consequently, the possibility to use the aggregated data to support decision-making process at city level.
The latter is a new dimension in the walkability assessment, as introduces walking performance levels, synthesized by T-WSI, as indicators of the quality of the components of the built environment’s eudaimonia and more in general of the city quality of life. In fact, low walking performance levels evidence needs of improvement in a number of fields in urban governance: mobility management to enhance the share of non-motorized modes, maintenance programs to ensure quality of sidewalks, road safety and speed control regulations to provide vulnerable road users with safer walking conditions and healthier lifestyle promotion. At the same time, walking performance levels can stress limits of the built environment and consequently prevent decision makers from planning or enforcing unsuitable solutions, typically in historic and long-consolidated areas where local land use cannot be further modified to accommodate more functions or modifications would become detrimental to the quality of other urban areas. All of the above was fully corroborated by the lesson learned from the Rieti case study herein presented.
To conclude, future research directions for the T-WSI development include more case studies for further refinement of the overall methodology, and the study of integration of the T-WSI evaluation with that of the SaPo and other economic indicators, to focus on the economic benefits of walking in the urban governance decision making process, and more specifically within transport planning and practice. More case studies would also enable us to complete the reliability assessment of this free tool, whose English version is in progress.

Author Contributions

Conceptualization, Methodology, Validation D.D. and L.A.; Conceptualization and Integration M.V.C.; Original Draft Preparation M.V.C.; Software and Data Curation, L.A.; Formal Analysis, Writing—Review and Editing M.V.C., D.D. and L.A.

Funding

This research received no external funding.

Conflicts of Interest

The authors declare no conflict of interest.

References

  1. Bettcher, D.; Krug, E. Saving Lives, Spending Less: A Strategic Response to Noncommunicable Diseases; World Health Organization: Geneva, Switzerland, 2018; pp. 1–37. [Google Scholar]
  2. Global Action Plan on Physical Activity 2018–2030: More Active People for a Healthier World; World Health Organization: Geneva, Switzerland, 2018; pp. 6–25.
  3. Jarrett, J.; Woodcock, J.; Griffiths, U.K.; Chalabi, Z.; Edwards, P.; Roberts, I.; Haines, A. Effect of increasing active travel in urban England and Wales on costs to the National Health Service. Lancet 2012, 379, 2198–2205. [Google Scholar] [CrossRef]
  4. Kahlmeier, S.; Cavill, N.; Dinsdale, H.; Rutter, H.; Gotschi, T.; Foster, C.; Racioppi, F. Health Economic Assessment Tool (HEAT) for Walking and for Cycling; World Health Organization: Geneva, Switzerland, 2014; pp. 12–42. [Google Scholar]
  5. Forni, A.; Petronio, G. L’inquinamento atmosferico. In Proceedings of the 7e Giornate Italiane Mediche dell’Ambiente, Arezzo, Italy, 18–19 October 2013; ENEA: Rome, Italy, 2014; pp. 124–142. [Google Scholar]
  6. D’Alessandro, D.; Arletti, S.; Azara, A.; Buffoli, M.; Capasso, L. Strategies for disease prevention and health promotion in urban areas: The Erice 50 Charter. Ann. Ig. 2017, 29, 481–493. [Google Scholar]
  7. D’Alessandro, D.; Appolloni, L.; Capasso, L. Public Health and urban planning: A powerful alliance to be enhanced in Italy. Ann. Ig. 2017, 29, 453–463. [Google Scholar] [PubMed]
  8. Ludwig, J.; Duncan, G.J.; Gennetian, L.A.; Katz, L.F.; Kessler, R.C.; Kling, J.R.; Sanbonmatsu, L. Neighborhood effects on the long-term well-being of low-income adults. Science 2012, 337, 1505–1510. [Google Scholar] [CrossRef] [PubMed]
  9. Koohsari, M.J.; Mavoa, S.; Villanueva, K.; Sugiyama, T.; Badland, H.; Kaczynski, A.T.; Owen, N.; Giles-Corti, B. Public open space, physical activity, urban design and public health: Concepts, methods and research agenda. Health Place 2015, 33, 75–82. [Google Scholar] [CrossRef] [PubMed] [Green Version]
  10. Capasso, L.; Faggioli, A.; Rebecchi, A.; Capolongo, S.; Gaeta, M.; Appolloni, L.; De Martino, A.; D’Alessandro, D. Hygienic and sanitary aspects in urban planning: Contradiction in national and local urban legislation regarding public health. Epidemiol. Prev. 2018, 42, 60–64. [Google Scholar]
  11. Hussein, M.; Sayed, T. Validation of an agent-based microscopic pedestrian simulation model in a crowded pedestrian walking environment. Transp. Plan. Tech. 2019, 42, 1–22. [Google Scholar] [CrossRef]
  12. Batty, M.; Desyllas, J.; Duxbury, E. Safety in Numbers? Modelling Crowds and Designing Control for the Notting Hill Carnival. Urban Stud. 2003, 40, 1573–1590. [Google Scholar] [CrossRef]
  13. Bandini, S.; Crociani, L.; Gorrini, A.; Vizzari, G. An agent-based model of pedestrian dynamics considering groups: A real world case study. In Proceedings of the 17th International IEEE Conference on Intelligent Transportation Systems (ITSC), Qingdao, China, 8–11 October 2014; IEEE: New York, NY, USA, 2014; pp. 572–577. [Google Scholar]
  14. Karbovsk, V.; Voloshin, D.; Karsakov, A.; Bezgodov, A.; Gershenson, C. Multimodel agent-based simulation environment for mass-gatherings and pedestrian dynamics. Future Gener. Comput. Syst. 2016, 79, 155–165. [Google Scholar] [CrossRef]
  15. Kerridge, J.; Hine, J.; Wigan, M. Agent-Based Modelling of Pedestrian Movements: The Questions That Need to Be Asked and Answered. Environ. Plan. B Plan. Des. 2001, 28, 327–341. [Google Scholar] [CrossRef]
  16. Dijkstra, J.; Jessurun, A.J.; Timmermans, H.J.P. A MultiAgent Cellular Automata Model of Pedestrian Movement. In Pedestrian and Evacuation Dynamics; Schreckenberg, M., Sharma, S.D., Eds.; Springer: Berlin, Germany, 2001; pp. 173–181. [Google Scholar]
  17. Antonini, G.; Bierlaire, M.; Weber, M. Discrete choice models of pedestrian walking behavior. Transp. Res. Part B Methodol. 2006, 40, 667–687. [Google Scholar] [CrossRef]
  18. Oeding, D. Verkehersbelastung und Dimensionierung von Gehwegen und anderen Anlagen des Fussgaengersverkehrs. Strassenbau Und Str. 1963, 22, 160–163. [Google Scholar]
  19. Navin, P.D.; Wheeler, R.J. Pedestrian Flows Characteristics. Traffic Eng. Control 1968, 19, 30–36. [Google Scholar]
  20. Helbing, D.; Molnar, P. Social Force Model for Pedestrians Dynamics. Phys. Rev. E 1995, 51, 4282–4296. [Google Scholar] [CrossRef]
  21. Pushkarev, B.S.; Zupan, J.M. Urban Space for Pedestrians; The MIT Press: Cambridge, MA, USA, 1975; pp. 77–109. [Google Scholar]
  22. Fink, J.K. People Walking; Penguin: Oxford, UK, 1988; pp. 70–78. [Google Scholar]
  23. Ackerman, A.N.; Awan, J.; Solomon, N. Highway Capacity Manual, 4th ed.; Transportation Research Board: Washington, DC, USA, 2000; Chapter 18; pp. 1–32. [Google Scholar]
  24. Corazza, M.V.; Guida, U.; Musso, A.; Tozzi, M. From EBSF to EBSF_2: A compelling agenda for the bus of the future: A decade of research for more attractive and sustainable buses. In Proceedings of the 2016 IEEE 16th International Conference on Environment and Electrical Engineering (EEEIC), Florence, Italy, 7–10 June 2016; pp. 1–6. [Google Scholar]
  25. National Academies of Sciences, Engineering, and Medicine. NCHRP Report 61—Multimodal Level of Service Analysis for Urban Streets; The National Academies Press: Washington, DC, USA, 2008; pp. 86–91. [Google Scholar]
  26. Cervero, R.; Kockelman, K. Travel demand and the 3Ds: Density, diversity, and design. Transp. Res. D Transp. Environ. 1997, 2, 199–219. [Google Scholar] [CrossRef]
  27. Appleyard, D. Livable Streets; University of California Press: Los Angeles, CA, USA, 1981; pp. 199–214. [Google Scholar]
  28. Whyte, W.H. Social Life of Small Urban Spaces; The Conservation Foundation: New York, NY, USA, 1980; pp. 16–75. [Google Scholar]
  29. Gehl, J. Life between Buildings; Island Press: Washington, DC, USA, 2011; pp. 129–154. [Google Scholar]
  30. Engwicht, D. Reclaiming Our Cities and Town; New Society Publishers: Philadelphia, PA, USA, 1992; pp. 94–104. [Google Scholar]
  31. Won, J.; Lee, C.; Li, W. Are Walkable Neighborhoods More Resilient to the Foreclosure Spillover Effects? J. Plan. Educ. Res. 2018, 38, 463–476. [Google Scholar] [CrossRef]
  32. Litman, T.A. Economic Value of Walkability. Transp. Res. Rec. 2003, 1828, 3–11. [Google Scholar] [CrossRef] [Green Version]
  33. Guimpert, I.; Hurtubia, R.M. Easuring, understanding and modelling the Walking Neighborhood as a function of built environment and socioeconomic variables. J. Transp. Geogr. 2018, 71, 32–44. [Google Scholar] [CrossRef]
  34. Shaaban, K.; Siam, A.; Badran, A.; Shamiyah, M. A simple method to assess walkability around metro stations. Int. J. Sustain. Soc. 2018, 10, 1–19. [Google Scholar] [CrossRef]
  35. Capolongo, S.; Rebecchi, A.; Dettori, M.; Appolloni, L.; Azara, A.; Buffoli, M.; Capasso, L.; Casuccio, A.; Oliveri Conti, G.; D’Amico, A.; et al. Healthy Design and Urban Planning Strategies, Actions, and Policy to Achieve Salutogenic Cities. Int. J. Environ. Res. Public Health 2018, 15, 2698. [Google Scholar] [CrossRef] [PubMed]
  36. Schlossberg, M.; Brown, N. Comparing transit-oriented development sites by walkability indicators. Transp. Res. Rec. 2004, 1887, 34–42. [Google Scholar] [CrossRef]
  37. Werner, C.M.; Brown, B.B.; Gallimore, J. Light rail use is more likely on “walkable” blocks: Further support for using micro-level environmental audit measures. J. Environ. Psychol. 2010, 30, 206–214. [Google Scholar] [CrossRef]
  38. Corazza, M.V.; Favaretto, N. A methodology to evaluate accessibility to bus stops as a contribution to improve sustainability in urban mobility. Sustainability 2019, 11, 803. [Google Scholar] [CrossRef]
  39. Farkic, J.; Peric, D.; Lesjak, M.; Petelin, M. Urban walking: Perspectives of locals and tourists. Geogr. Pannon. 2015, 19, 212–222. [Google Scholar] [CrossRef] [Green Version]
  40. Ram, Y.; Hall, C.M. Walk Score and tourist accommodation. Int. J. Tour. Cities 2018, 4, 369–375. [Google Scholar] [CrossRef]
  41. Aranburu, I.; Plaza, B.; Esteban, M. Sustainable Cultural Tourism in Urban Destinations: Does Space Matter? Sustainability 2016, 8, 699. [Google Scholar] [CrossRef]
  42. Ewing, R.; Handy, S. Measuring the unmeasurable: Urban design qualities related to walkability. J. Urban Des. 2009, 14, 65–84. [Google Scholar] [CrossRef]
  43. Sepe, M. PlaceMaker method: Planning ‘walkability’ by mapping place identity. J. Urban Des. 2009, 14, 463–487. [Google Scholar] [CrossRef]
  44. Rakha, T.; Reinhart, C. Generative urban modeling: A design work flow for walkability-optimized cities. Proc. Simbuild 2012, 5, 255–262. [Google Scholar]
  45. Southworth, M. Designing the walkable city. J. Urban Plan. Dev. 2005, 131, 246–257. [Google Scholar] [CrossRef]
  46. Koenig, K.M. Come si misura la qualità della vita di una città. Ottagono 1986, 83, 56–59. [Google Scholar]
  47. D’Alessandro, D.; Appolloni, L.; Capasso, L. How walkable is the city? Application of the Walking Suitability Index of the Territory (T-WSI) to the city of Rieti. Epidemiol. Prev. 2016, 40, 237–242. [Google Scholar]
  48. D’Alessandro, D.; Assenso, M.; Appolloni, L.; Cappucciti, A. The Walking Suitability Index of the Territory (T-WSI): A new tool to evaluate urban neighborhood walkability. Ann. Ig. 2015, 27, 678–687. [Google Scholar]
  49. Zhang, M.; Kukadia, N. Metrics of Urban Form and the Modifiable Areal Unit Problem. Transp. Res. Rec. 2005, 1902, 71–79. [Google Scholar] [CrossRef]
  50. Dill, J. Measuring Network Connectivity for Bicycling and Walking. In Proceedings of the Compendium of Papers of the 2004 TRB Annual Meeting, Washington, DC, USA, 11–15 January 2004. [Google Scholar]
  51. Frank, L.D.; Schmid, T.L.; Sallis, J.F.; Chapman, J.; Saelens, B.E. Linking objectively measured physical activity with objectively measured urban form: Findings from SMARTRAQ. Am. J. Prev. Med. 2005, 28 (Suppl. 2), 117–125. [Google Scholar] [CrossRef] [PubMed]
  52. Leslie, E.; Coffee, N.; Frank, L.; Owen, N.; Bauman, A.; Hugo, G. Walkability of local communities: Using geographic information systems to objectively assess relevant environmental attributes. Health Place 2007, 13, 111–122. [Google Scholar] [CrossRef] [PubMed]
  53. Kuzmyak, J.R.; Baber, C.; Savory, D. Use of Walk Opportunities Index to Quantify Local Accessibility. Transp. Res. Rec. 2006, 1977, 145–153. [Google Scholar] [CrossRef]
  54. Lopez Suarez, E.; Gutierrez, J.; Gomez, G. Measuring regional cohesion effects of large-scale transport infrastructure investments: An accessibility approach. J. Eur. Plan. Stud. 2008, 16, 277–301. [Google Scholar] [CrossRef]
  55. Ortega, E.; Martín, B.; Nuñez, E.; Ezquerra, A. Urban fragmentation map of the Chamberí district in Madrid. J. Maps 2015, 11, 788–797. [Google Scholar] [CrossRef]
  56. Duncan, M.J.; Spence, J.C.; Mummery, W.K. Perceived environment and physical activity: A meta-analysis of selected environmental characteristics. Int. J. Behav. Nutr. Phys. Act. 2005, 2, 11. [Google Scholar] [CrossRef]
  57. Santos, R.; Silva, P.; Santos, P.; Ribeiro, J.C.; Mota, J. Physical activity and perceived environmental attributes in a sample of Portuguese adults: Results from the Azorean Physical Activity and Health study. Prev. Med. 2008, 47, 83–88. [Google Scholar] [CrossRef] [PubMed]
  58. Saelens, B.E.; Sallis, J.F.; Black, J.B.; Chen, D. Neighbourhood-based differences in physical activity: An environment scale evaluation. Am. J. Public Health 2003, 93, 1552–1558. [Google Scholar] [CrossRef] [PubMed]
  59. Tilt, J.H.; Unfried, T.M.; Roca, B. Using objective and subjective measures of neighborhood greenness and accessible destinations for understanding walking trips and BMI in Seattle, Washington. Am. J. Health Promot. 2007, 21, 371–379. [Google Scholar] [CrossRef]
  60. Leyden, K.M. Social capital and the built environment. Am. J. Public Health 2003, 93, 1546–1551. [Google Scholar] [CrossRef]
  61. U.S. Department of Health and Human Services. Kidswalk-to-School, A Guide to Promote Walking to School; U.S. Department of Health and Human Services: Washington, DC, USA, 2018; pp. 54–58.
  62. Deehr, R.C.; Shumann, A. Active Seattle: Achieving Walkability in Diverse Neighborhoods. Am. J. Prev. Med. 2009, 37 (Suppl. 2), S403–S411. [Google Scholar] [CrossRef] [PubMed]
  63. Pikora, T.; Giles-Corti, B.; Knuiman, M.; Bull, F.; Jamrozik, K.; Donovan, R. Neighbourhood environmental factors correlated with walking near home: Using Spaces. Med. Sci. Sports Exerc. 2005, 38, 708–714. [Google Scholar] [CrossRef]
  64. Saelens, B.E.; Handy, S.L. Built environment correlates of walking: A review. Med. Sci. Sports Exerc. 2008, 40, 550–566. [Google Scholar] [CrossRef] [PubMed]
  65. Oya, H.; Ando, K.; Kanoshima, H. A Research on Interrelation between Illuminance at Intersections and Reduction in Traffic Accidents. J. Light Vis. Environ. 2002, 26, 29–34. [Google Scholar] [CrossRef]
  66. Cronbach, L.J. Coefficient alpha and the internal structure of tests. Psychometrika 1951, 16, 297–334. [Google Scholar] [CrossRef] [Green Version]
  67. Fiorillo, A.; Laurenti, M.; Bono, L. Ecosistema Urbano 2018; Legambiente: Rome, Italy, 2018; pp. 123–140. [Google Scholar]
  68. King, M.J. Case Studies of the Transfer of Road Safety Knowledge and Expertise from Western Countries to Thailand and Vietnam, Using an Ecological ‘Road Safety Space’ Model: Elephants in Traffic and Rice Cooker Helmet. Ph.D. Thesis, Queensland University of Technology, Brisbane, Australia, 2005. [Google Scholar]
  69. Macário, R.; Marques, C.F. Transferability of sustainable urban mobility measures. Res. Transp. Econ. 2008, 22, 146–156. [Google Scholar] [CrossRef]
  70. Banister, D. The sustainable mobility paradigm. Transp. Policy 2008, 15, 73–80. [Google Scholar] [CrossRef]
  71. Lopez Lambas, M.E.; Corazza, M.V.; Monzon, A.; Musso, A. Rebalancing urban mobility: A tale of four cities. Urban Des. Plan. Proc. ICE 2013, 166, 274–287. [Google Scholar] [CrossRef]
  72. Demasi, F.; Loprencipe, G.; Moretti, L. Road Safety Analysis of Urban Roads: Case Study of an Italian Municipality. Safety 2018, 4, 58. [Google Scholar] [CrossRef]
  73. MIT—Ministero delle Infrastrutture e dei Trasporti. D.M. 2.5.2012. Linee Guida per la Gestione della Sicurezza delle Infrastrutture Stradali. Gazz. Uff. 2012, 35, 182–209. [Google Scholar]
  74. Sgarra, V.; Di Mascio, P.; Corazza, M.V.; Musso, A. An application of ITS devices for powered two-wheelers safety analysis: The Rome case study. Adv. Transp. Stud. 2014, 33, 85–96. [Google Scholar]
  75. Corazza, M.V.; Moretti, L.; Di Mascio, P. Management of sidewalk maintenance to improve walking comfort for senior citizens. Wit Trans. Built Environ. 2018, 176, 195–206. [Google Scholar]
  76. Vuchic, V.R. Transportation for Livable Cities; CUPR: New Brunswick, NJ, USA, 1999; pp. 198–201. [Google Scholar]
  77. Musso, A.; Corazza, M.V. Improving Urban Mobility Management: The Rome Case. Transp. Res. Rec. 2006, 1956, 52–59. [Google Scholar] [CrossRef]
Figure 1. Interrelation among the different walking requirements.
Sustainability 11 03467 g001
Figure 2. Algorithm for the definition of the T-WSI.
Sustainability 11 03467 g002
Figure 3. The study areas in the city of Rieti.
Sustainability 11 03467 g003
Figure 4. Population density in the study areas.
Sustainability 11 03467 g004
Figure 5. Performance scores, average values.
Sustainability 11 03467 g005
Figure 6. (a) Worst and (b) best cases.
Sustainability 11 03467 g006
Table 1. Evaluation categories, indicators, weights and assessment scores.
Evaluation Category and WeightsIdeal PerformanceIndicators and WeightsAssessment and Scores
YesNoExcellent 1Good 0.70Poor 0.35Not Acceptable 0.00
P
Practicability
Pw 0.30
even, level pathsdistress, weeds obstacles rating, unstable partsP1
Sidewalk surface
P1w 40
Even with no distress, levelEven though scarcely distressed, levelUneven as recurrently distressed, not totally levelUneven as severely distressed, unlevelled
P2
Obstacles
P2w 25
NoneScarceFew Continuous
P3
Slope
P3w 35
<2%2–5%6–8%>8%
S
Safety
Sw 0.25
traffic calming, lighting designed for pedestrians, signaled crossing areasconflicts with motorized modesS1
Speed control
S1w 31
Zone 30 with speed reduction devices Zone 50 with speed reduction devices Just few speed reduction devicesNone
S2
Public Lighting
S2w 31
Bollard/pencil lights fully availableBollard/pencil type partly availableJust light polesPoor overall lighting
S3
Safe crossing
S3w 38
All signaled and protectedMost signaled and/or protectedSome signaled and/or protected Neither signaled nor protected
U
Urbanity
Uw 0.22
canopied/covered areas, well-maintained street furniture, appropriate level of service, vibrant street lifestreet clutter, mono functional land useU1
Sidewalk width
U1w 40
Clearance >4 m (>3 m residential street)2.5–4 m clearance (2–3 m residential street)1.5–2.5 m clearance (1–2 m residential street)Clearance <1.5 m (>1 m residential street)
U2
Street furniture
U2w 25
Available, well-maintained, partly covered Partly available, maintainedPoorly available unmaintained/vandalizedNot available
U3
Activity mix
U3w 35
Mixed, and continuous Moderately mixedMostly monofunctional, residentialNone, just fences and walls
A
Appeal
Aw 0.23
variety of low-rise buildings and plenty of vegetationheavy traffic flowsA1
Traffic
A1w 38
< 300 veh/h300–600 veh/h600–1000 veh/h1000 veh/h
A2
Building stock
A2w: 31
Detached houses, 3 stories maxLow rise blocks, 3 stories maxHigh rise blocks, 9 stories maxHigh rise and towers, ≥10 stories
A3
Vegetation
A3w 31
Continuous and variedscatteredscarcenone
Table 2. Main environmental indicators for the city of Rieti, 2017 [50].
IndicatorValue *Unit of Measurement
Motorization rate (including PTWs)82((veh/inh.) × 100)
Use of public transport52trip/inh.
Public transport supply30Veh × km/inh.
Road safety fatality index1.26event/10,000 inh.
Road safety injured index62event/10,000 inh.
Bike track supply11.5m/100 inh.
Pedestrian areas availability0.04m2/inh.
Air quality, PM1020μg/m3 (average)
Available green areas16.3m2/inh.
Trees stock14unit/100 inh.
* all yearly.
Table 3. T-WSI for the neighborhoods in the study area.
PeriodNeighborhoodEvaluation CategoryT-WSI
P PracticabilityS SafetyU UrbanityA Appeal
1950–19801.Citta′ Giardino75.331.342.957.353.06
4.Fiume dei Nobili64.738.027.145.545.34
5.Molino della Salce85.728.825.752.050.52
7.Borgo75.527.135.162.351.55
1920–19908.Villa Reatina41.210.923.672.536.95
3.Quattro Strade24.812.516.763.828.90
1960–19902.Piazza Tevere75.924.128.970.951.46
6.Micioccoli76.931.433.064.052.89
1920–19509.Viale dei Flavi77.424.436.264.552.12
Average66.3725.3829.9161.4246.97
Table 4. Performance assessment for the neighborhoods in the study area.
PeriodNeighborhoodEvaluation Category
P PracticabilityS SafetyU UrbanityA Appeal
P1P2P3S1S2S3U1U2U3A1A2A3
1950–19801.Citta’ Giardino75717904447354054616050
4.Fiume dei Nobili69586404861171448447617
5.Molino della Salce91709103051142441278154
7.Borgo69589603246272651688731
1920–19908.Villa Reatina413447419922837948335
3.Quattro Strade242228030981230778329
1960–19902.Piazza Tevere76688103733212441877448
6.Micioccoli707090104637303733706952
1920–1950 9.Viale dei Flavi76678704726392740707944
Average65.757.673.71.637.035.423.723.641.766.476.940.0
Key: P1: Sidewalk Surface; P2: Obstacles; P3: Slope; S1: Speed Control, S2: Public Lighting, S3: Safe Crossing; U1: Sidewalk Width; U2: Street Furniture; U3: Activity Mix; A1: Traffic; A2: Building Stock; A3: Vegetation.
Table 5. Performance assessment, Street Index and T-WSI for the best and worst cases in the study area.
NeighborhoodStreetEvaluation CategorySIT-WSIi
P PracticabilityS SafetyU UrbanityA Appeal
P1P2P3S1S2S3U1U2U3A1A2A3
Borgo(a) Via Selci 00000000010.7013.70.16
Neighborhood average0.630.480.8700.250.330.200.180.510.710.870.22461.83
Viale dei Flavi(b) Viale Maraini11101110.7100.7179.75.61
Neighborhood average0.750.650.8400.380.210.350.210.420.750.760.3449.24.90
Key: P1: Sidewalk Surface; P2: Obstacles; P3: Slope; S1: Speed Control, S2: Public Lighting, S3: Safe Crossing; U1: Sidewalk Width; U2: Street Furniture; U3: Activity Mix; A1: Traffic; A2: Building Stock; A3: Vegetation.

