Article

Forest Investment Framework as a Support Tool for the Sustainable Management of Planted Forests

1
Scion (New Zealand Forest Research Institute Ltd.), Private Bag 3020, Rotorua 3046, New Zealand
2
Candleford, P.O. Box 7365, Rotorua 3042, New Zealand
3
Sector Partnerships and Programmes, Ministry for Primary Industries, Gisborne 4010, New Zealand
4
Toi Ohomai Institute of Technology, Private Bag 3028, Rotorua 3046, New Zealand
*
Author to whom correspondence should be addressed.
Sustainability 2019, 11(12), 3477; https://0-doi-org.brum.beds.ac.uk/10.3390/su11123477
Submission received: 24 April 2019 / Revised: 7 June 2019 / Accepted: 18 June 2019 / Published: 25 June 2019
(This article belongs to the Special Issue Sustainable Forest Management)

Abstract

:
Planted forest ecosystems provide a wide range of goods and services such as timber, carbon sequestration, and avoided erosion. However, only ecosystem services with market values (e.g., timber) are usually represented in decision making while those with non-market values (e.g., avoided erosion) that are difficult to quantify are often ignored. A spatial economic tool, the Forest Investment Framework (FIF), integrates data from forest growth models with spatial, biophysical, and economic data, to quantify the broader value of planted forests and to represent non-market values in sustainable forest management. In this paper, we have tested the applicability of FIF in three types of case studies: assessment of afforestation feasibility, regional economic analyses, and ecosystem service assessment. This study provides evidence that a spatial economic tool that quantifies the economic, environmental, and social values of the planted forest ecosystem is valuable in informing land management decisions for maintaining and enhancing the provision of market and non-market ecosystem services to society.

1. Introduction

Forest management has a long history of focusing mainly on the more tangible products from forests, such as timber-based and non-timber forest products [1]. However, forests are also ecosystems that provide goods and services that cover a wide range of environmental, ecological, social, and cultural considerations and processes [2]. These include carbon sequestration, water filtration, soil stabilization, avoided sedimentation of waterways, nutrient mitigation, recreation, biodiversity conservation, and understory cropping [3,4]. We collectively refer to these goods and services as forest ecosystem services (FES). Timber and understory crops can be classified as tangible FES; they have market values which are clearly understood and reported in the current national system of accounting (i.e., Gross Domestic Product (GDP)). Carbon sequestration and nutrient mitigation can be considered as FES with emerging markets, for example emissions trading schemes and nutrient trading schemes, respectively [5,6]. Other services such as avoided sedimentation and water flow regulation have environmental and social values that are not readily realized in market transactions and are less visible in policy [7,8]. The United Nations is leading an ongoing global initiative to develop environmental accounting systems for key non-market FES which are envisioned to support decision making processes and sustainable management [9].
The invisibility of the less tangible services in policy discussions has attracted the attention of researchers and practitioners. A number of approaches, models, and frameworks have been developed to quantify these services so as to account for them in policy and investment decisions [10]. One group of frameworks increasingly gaining attention are the spatially explicit economic models that use ecosystem services approaches to help decision makers account for the broader value of forest ecosystems [11,12,13,14]. The frameworks not only account for both market and non-market values of ecosystem services, but also for space, time, and geographic scale, which enables the presentation of an increasingly holistic view of the goods and services for managing and sustaining their provisions.
It is important to evaluate and compare the growing number of decision-support tools, models, and frameworks for analyzing ecosystem services, and to assess their strengths and weaknesses. For example, Bagstad, et al. [15] describes 17 ecosystem services models and evaluated their performance using eight major criteria, including generalizability, scalability, and affordability. Peh, et al. [16] provides an overview of six multi-ecosystem service assessment tools and compared them based on key features and resource requirements. They emphasize that the key limitation amongst existing tools was the lack of a rapid approach for assessing ecosystem services. Consequently, to address the gap, a rapid assessment Toolkit for Ecosystem Service Site-based Assessment (TESSA) was developed. TESSA uses stakeholder engagement, simple field, and household surveys, as well as spreadsheets to conduct an assessment and hence does not require substantial technical background, resources, or data. Hart et al. (2013) conducted workshops to evaluate and prioritize ecosystem services models to refine the Waikato Integrated Scenario Explorer, a spatially-explicit policy support system developed by a New Zealand regional government [17]. The five major ecosystem services identified were food, timber, water supply, and water quality improvement. The above papers and reports have provided a useful description of the various tools and identified some of the gaps that could be addressed by the development of new tools in the future.
In this paper, we ask the question: “Is a spatial economic tool that quantifies the economic, environmental, and social values of ecosystems important for decision makers? And if so, how did it help in their decision-making processes?” To answer this question, we tested the applicability of FIF in three types of case studies, which were: (1) afforestation feasibility of Māori lands; (2) forestry for regional economic development; and (3) ecosystem service assessment. The aim of FIF is to fill key gaps in the analysis of planted forests as a land use, including the ability to provide a better understanding of the broad suite of benefits they provide to society. We have also described FIF alongside other spatial economic or ecosystem services frameworks for forests.
This paper has seven sections. The second section that follows provides an overview of the key ecosystem services provided by forests in New Zealand and overseas using the ecosystem services approach. A description of spatial economic frameworks for FES are presented in Section 3. In Section 4 we present FIF’s data inputs, processes, and outputs. In Section 5 we describe the applications of the framework in 17 New Zealand case studies and provide highlights of those applications to end users. In Section 6 we discuss the advance that the framework demonstrates, how FIF outputs contribute towards policy and investment decisions, and describe future directions of FIF. We finish with conclusions in Section 7.

2. Ecosystem Services Provided by Planted Forests

The ecosystem services approach described in the Millennium Ecosystem Assessment [18] enables an analyst to provide a more inclusive view of planted forests. Globally, planted forests are mainly recognized for their provision of timber as they help supply the large international demand for roundwood and pulp [19]. This ecosystem is also increasingly recognized in New Zealand for providing other services such as climate change mitigation [20,21], provision of habitats for native species [22,23], recreation [8,24], improved water quality [25], avoided sedimentation [26,27], and flood mitigation [27,28]. Other FES that have yet to be quantified in New Zealand but have been studied overseas include health benefits [29,30], drinking water filtration [31,32], water conservation [33], and water regulation [34]. All these ecosystem services contribute to prosperity and improved human well-being, including basic materials for good life, employment, better health, and social cohesion [18]. Spatially quantified values of ecosystem services have been proven useful for guiding regional planning and development [35,36].
The first component of the ecosystem services framework is the ecosystem processes, which includes supporting services such as soil formation, nutrient cycling and primary production [18]. These supporting services underpin the provision of three groups of ecosystem services: (1) provisioning services; (2) regulating services; and (3) cultural services. Provisioning services include the products derived from a planted forest ecosystem such as logs, processed wood, fiber, fuel, and freshwater [25,37,38]. Globally, most planted forests provide raw materials (e.g., logging residues, saw dust) that can be used to generate heat and power for sawmilling operations and other primary industries [39,40]. In some planted forests across New Zealand, wild-simulated ginseng, a high-value crop, can be grown successfully as mature pine trees provide adequate shading [41,42]. Another example of a provisioning service is high-value mānuka honey [43], which is provided by New Zealand tea trees (e.g., mānuka, Leptospermum scoparium). The quantification of products from provisioning services can be approximated with the available data on market prices and trade figures, enabling their values to be represented in, for example, a national system of accounting such as GDP [9].
Regulating services are defined as “the benefits obtained from the regulation of ecosystem processes” [18]. Some of these services include carbon sequestration, avoided erosion, improved water quality, and flood mitigation [37]. Planted forests help produce quality water for most of the (multi-decade) rotation length, providing a useful freshwater resource to downstream users [25]. There is evidence that afforestation of pastoral lands leads to an improvement of a number of water quality attributes including nutrient and sediment concentrations, temperature of waterways, shade for native invertebrates, and reduced microbial contamination within four to six years of planting [25]. Conversely, planted forests have the potential to reduce water yield [44,45] as well as increase the risk of sedimentation and debris flows post-harvest [46,47].
In New Zealand, only the carbon sequestration service presently has an economic market through the Emissions Trading Scheme [48]. Markets for other regulating services such as biodiversity and avoided nutrients are developing [49,50]. However, indicative values of those regulating services (e.g., avoided erosion) that still do not have a market value can be estimated and may be used in policy and investment discussions [24,38]. Other regulating services in New Zealand planted forests, such as habitat provisioning, have been described by Deconchat, et al. [51,52].
Cultural services are the non-material or non-consumptive benefits derived from an ecosystem, such as recreation, aesthetic experience, spiritual enrichment, appreciation of biodiversity, and heritage values of conservation. Many planted forests around the world provide recreational opportunities to the people who visit them, including walking, mountain biking, horse riding, running, and exercising dogs [8,53,54]. Estimating the non-market value of cultural services provided by forests or tree blocks have been undertaken for recreation [8,55,56,57], species conservation [23,58], and aesthetic experience [59,60] (Non-market valuation techniques include travel cost, hedonic pricing, contingent valuation, and choice modelling. Those techniques are described in detail in [61]. Some estimated non-market values of cultural services have been incorporated into assessing the benefits of forestry to the environment and society (for example Wu, et al. [61]). Other types of forest cultural services have also been quantified in non-monetary terms by other methods such as Delphi [62], regression [63], and improved health scoring indexes [30].
The combinations of ecosystem services provided by planted forests contribute to various components of human well-being. In addition to timber, planted forests on farms provide shelter to farm animals thereby helping sustain livelihoods of farmers [64]. In terms of health, planted forests, especially those located next to urban areas, provide recreational amenities allowing forest users to gain access to fresh air and/or water ways for recreational fishing. The Whakarewarewa Forest, an urban planted forest neighboring Rotorua, New Zealand, provides an excellent venue for walking, running, and cycling events. These foster the establishment of social interactions amongst the local people, and domestic and international visitors [54].

3. Spatial Economic Frameworks for Forest Ecosystem Services

Globally, several spatial economic models and frameworks have been developed to analyze FES. We identified some that assess key FES and categorize them into three types based on the targeted end user(s): (1) forest industry; (2) government; and (3) civil society, which includes indigenous groups and the general public. Frameworks developed for the forest industry or private businesses tend to focus on the marketable goods and services from forests such as wood production, understory cropping, and the sale of carbon sequestration credits. Frameworks developed for the other end user groups have been found to overlap. The government agencies and civil society focus more on regulating services (e.g., cleaner water, cleaner air, enhanced biodiversity) that for the most part have no market prices but have non-market values that can be estimated using economic valuation techniques. Frameworks that account for both market and non-market values are used by end users of all three groups (industry, government, and civil society). We present selected spatial economic frameworks for assessing FES in Table 1. The models in this table represent both conventional profitability frameworks and emerging FES spatial modelling frameworks for forestry.
There are many frameworks or software packages for analyzing forestry’s marketable goods. There are two commercial packages of note in New Zealand: (1) Forecaster and (2) Forest-Oriented Linear Programming Interpreter (FOLPI). The first operates at the stand level, while the second is optimum at the regional or catchment scale.
Forecaster is a framework that puts together various stem and stand-level models developed for New Zealand and Australian forestry to help forest managers with their planning and operations [65,66]. This framework is a standalone piece of software but can be linked to Geographic Information System (GIS) software, which enables it to serve as a spatial economic framework. The software includes growth models that allow the volume prediction of different log grades on a per hectare basis at nominated rotation ages. It has a built-in carbon sequestration model called C-change [67] that enables the estimation of the whole stand biomass and carbon sequestered in a forest stand anywhere across New Zealand. Forecaster also has models for wood stiffness, density, and branching that include spatial parameters for the estimation of harvested logs wood quality. The software also has a financial package that can be used for profitability analysis. Yao et al. [42] used Forecaster and additional economic data to estimate the profitability of two selected stands of Pinus radiata forests in New Zealand’s central North Island region. They estimated profits from: (1) timber production; (2) carbon credits; and (3) a ginseng understory crop. In summary, Forecaster can be used to estimate the economic value of two provisioning services (logs and understory crops) and one regulating service (carbon sequestration). However, this framework does not have growth models for ginseng or any other understory crops. Data on cost and returns were collected from interviews with ginseng growers. Those were used to undertake the profitability analysis.
Landscape-level modelling for operational, tactical, and strategic planning is a fundamental part of forest management. Techniques applied include simulation, heuristic solution approaches, and linear and integer programming. These models may be tightly or loosely integrated with stand-level models that provide yield estimates. The Forest-Oriented Linear Programming Interpreter (FOLPI) is an example of a commercial software application that became widely used by the forestry industry from the late 1980s [68]. FOLPI is a flexible framework within which forestry and land use problems can be formulated, allowing for optimization by using a Mixed Integer Programming solver. The main uses in a planted forestry context are harvest scheduling and forest valuation and it also allows the analysis of the optimal delivery of logs to processing plants given varying transport costs, mill demands, and delivered prices [69]. It has also been routinely used to model carbon sequestration and provides enough flexibility to allow scenarios that include non-timber products, non-forestry land uses, and other ecosystem services to be analyzed at the landscape level, provided that suitable data and functions are available. Example applications include modelling of forestry and forest products as a carbon sink [70] and multiple objective optimization for erosion control, profit and employment [71].
Frameworks for analyzing ecosystem services include the system developed by Virginia Tech for the Virginia Department of Forestry. The website-based framework InFOREST amalgamates selected spatial models to provide spatial environmental “credit calculators” that accumulate “credits” or “debits” for environmental effects [72]. The interactive website provides calculators for quantifying key regulating services such as air quality, biodiversity, carbon sequestration, and nutrient and sediment runoff. Estimated quantities are reported in non-monetary units such as a bird community index and metric tons of CO2 per acre. A website user can calculate the effect of land use change (e.g., conversion of pasture area to forestry) on the level of provision of the above ecosystem services. However, this framework is spatially constrained to quantifying ecosystem services only in specific locations in the US state of Virginia.
There are also FES frameworks designed for the combined needs of the industry, government, and civil society groups (e.g., indigenous tribal minorities). These frameworks include the Scenario Planning and Investment Framework (SPIF), European Forest Information Scenario model (EFISCEN), and Integrated Valuation of Ecosystem Services and Tradeoffs (InVEST). These frameworks have been validated and are well documented with manuals and user guides available.
The SPIF has been developed by Australia’s national science agency, Commonwealth Scientific and Industrial Research Organisation (CSIRO). The framework is described in Hawkins [14] as “a decision support framework that can predict outcomes associated with establishment of plantations and other forms of revegetation at catchment and farm scale. This tool enables the user to generate ‘what if scenarios’ with different commercial plantations and environmental plantings, determine optimum locations for new forests, and estimate the expected environmental and economic outcomes of these plantings.” The main ecosystem services modelled from the forest establishment are timber volume, carbon sequestration, salinity, water yield, sediment load, and biodiversity. It is recommended that outputs from SPIF should be used to guide and validate decision making. The predicted outcomes of forest investments from SPIF are derived from calibrations of a physiological growth model (3-PG+) based on data collected from over 250 sites across south eastern Australia.
The EFISCEN is a large-scale forest scenario framework developed by the European Forest Institute and Wageningen University. It enables the projection of forest resource development at regional to European scales, based on national forest inventory data for forest area available for wood supply, and average growing stock and net annual increment [73]. The model has been validated using long-term forest inventory data for Finland and Switzerland [74,75]. EFISCEN had been used to estimate the value of selected FES in 26 European countries [40]. Among the services estimated were round wood production, residue, stump biomass, carbon sequestration, habitats services (deadwood), and recreation.
InVEST is another large scale framework that was jointly developed by research institutions in the United States [13,76]. It is an add-in package to GIS software that contains a family of models to evaluate ecosystem service benefits and tradeoffs of pre-determined spatial planning scenarios at a regional scale [12]. This tool uses spatially explicit approaches that enables the user to assess how the location, quantity and value of ecosystem services change under different scenarios. In terrestrial and freshwater ecosystems, InVEST can be used to model the benefits of timber production, non-timber forest products, carbon storage and sequestration, water yield for hydropower generation, water purification, erosion control, and crop pollination [13,76]. In addition to InVEST’s terrestrial and freshwater component, it also has a module that deals with the marine and coastal ecosystems [76].
ARtificial Intelligence for Ecosystem Services (ARIES) is an integrated modelling framework for ecosystem services that is based on an artificial intelligence platform, rather than a single model or collection of models [77]. ARIES chooses ecological process models where appropriate and turns to simpler models where process models do not exist or are inadequate. Based on a simple user query, ARIES builds all the agents involved in the nature/society interaction, connects them into a flow network, and creates the best possible models for each agent and connection. ARIES can model forest related ecosystem services such as carbon storage, outdoor recreation, pollination, and sediment regulation [78]. Its analytic results consist of a detailed, adaptive, and dynamic assessment of how nature provides benefits to society.
A spatial economic framework for New Zealand planted forests, FIF, was developed to combine concepts from ecosystem services frameworks with conventional financial framing of forestry. Similar to the forestry frameworks previously discussed, FIF brings together various forestry models (e.g., growth models developed from permanent sample plots), spatial data, biophysical data, and economic data. In addition to conventional forest modelling, FIF also incorporates FES values, such as carbon sequestration, avoided sedimentation, and provision of habitats native species. Including conventional forestry economics allows forest planners, managers, and investors to understand financial implications. Incorporating ecosystem services beyond wood-based products allows the understanding of the added value of services within a conventional financial context. The framework is also spatially-based and calculations relate to specific locations.

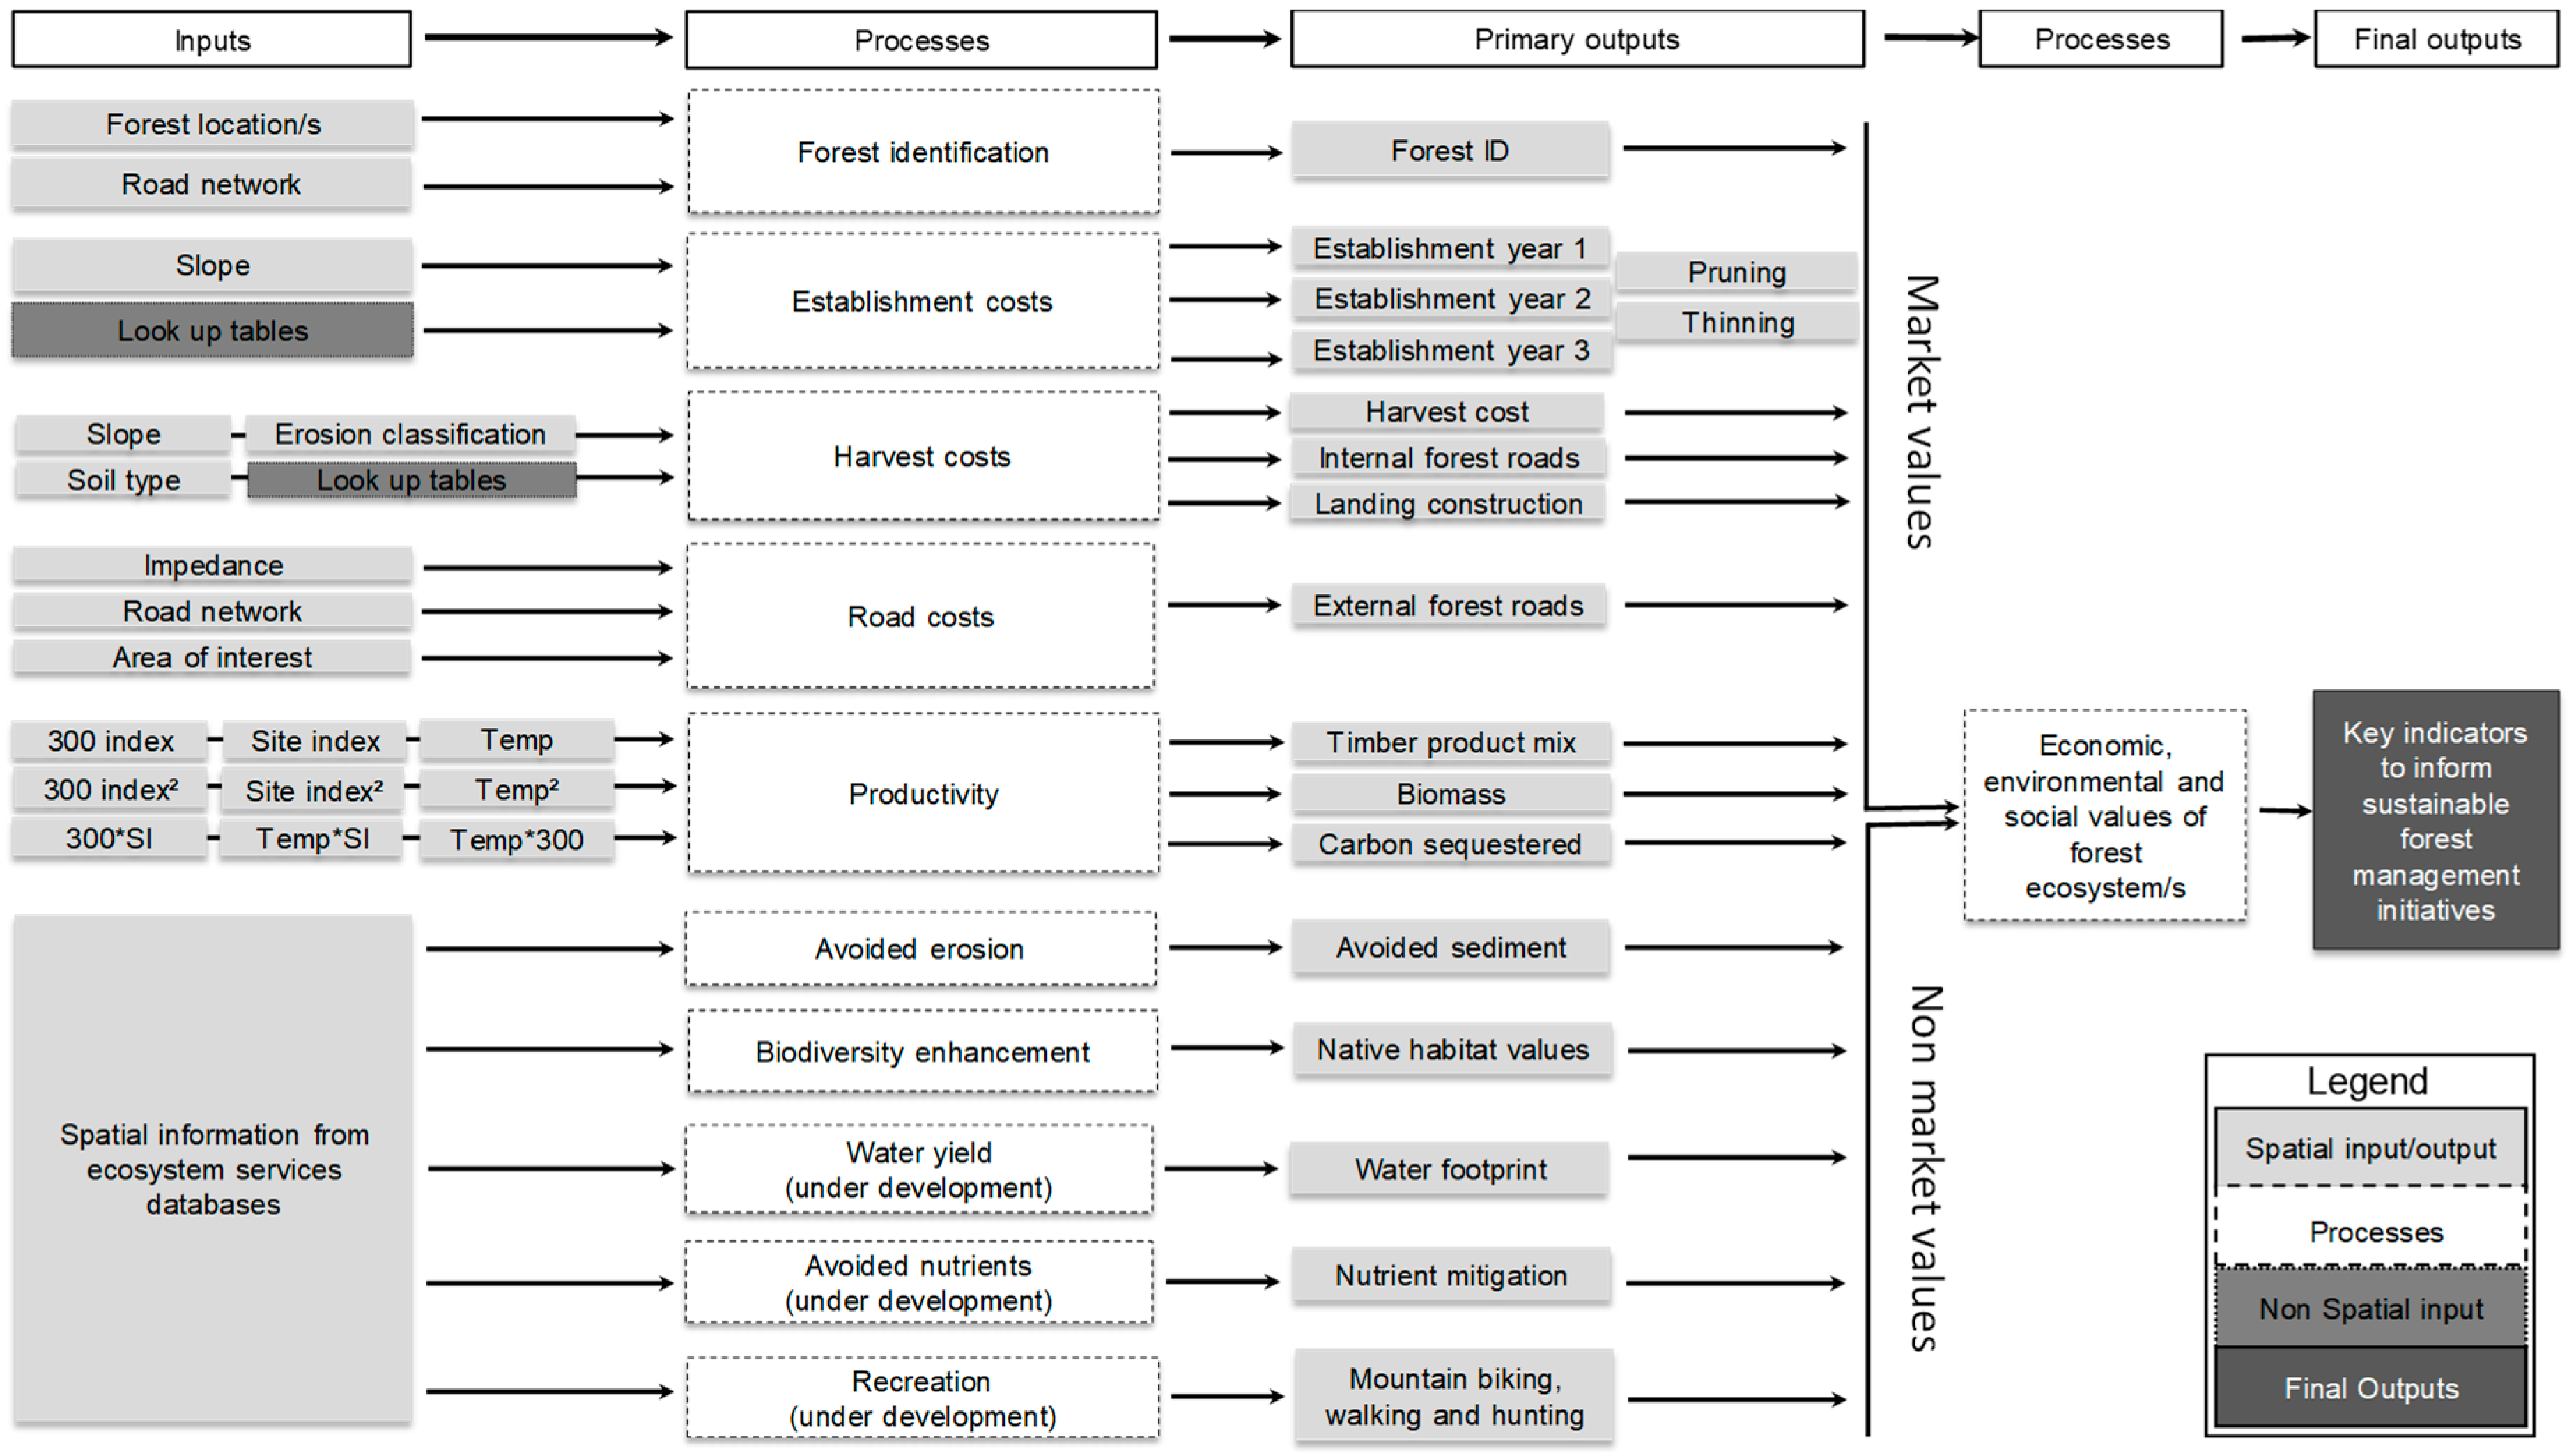
4. The Forest Investment Framework

FIF is a spatial economic tool designed to assess the financial viability of forests in New Zealand in combination with the non-market ecosystem services they provide. FIF enables the estimation of forest value, whether through market (cash) income from timber, non-wood products and carbon sequestration, or through non-market returns such as the values directly or indirectly placed on non-market ecosystem services. Adding non-market returns has become possible through investigations of the values of ecosystem services from proposed afforestation sites [27] as well as from existing planted and natural forests [24,38,82].
FIF is a decision making framework that can identify policy instruments and their impacts for improved land use management from trees [27]. FIF can model in detail New Zealand’s dominant plantation species, Pinus radiata (radiata pine), which accounts for 90% of the 1.7 million hectares of New Zealand planted forests [83]. For this species, meaningful results for strategic level planning objectives across different types of forestry regimes (e.g., pruned, unpruned, bioenergy, permanent forests) are available [84]. It also has options to assess other plantations of introduced species in New Zealand such as Pseudotsuga menziesii (Douglas-fir), Eucalyptus fastigata (eucalypt), and Sequoia sempervirens (coast redwood) as well as native Agathis australis (kauri) and Podocarpus totara (tōtara) species.
Regarding the financial modelling of forestry as a land use, the framework answers three key questions: (1) Can the tree species successfully grow on this piece of land; (2) if yes, how much log volume in different log grades can be harvested; and (3) would forestry be economically viable here given its location and distance from existing transportation infrastructure and potential markets (processors and ports)? This ensures conventional forestry finances are covered.
The returns from forestry are estimated by providing predictive surfaces for log volume (m3), tons of biomass (t), and carbon sequestration (tons of CO2 equivalent). This is done by assigning candidate areas with information from underlying spatial surfaces that describe the potential productivity, as well as factors that contribute to forest management costs such soil type, slope of the terrain, and distance to markets. This information is then used in the determination of total revenue and costs to calculate for the spatially explicit net present value of a forest rotation (or multiple rotations) for each pixel in a candidate area (Figure 1).
This framework contains spatial forest productivity surfaces generated from forest-growth models, such as the 300 Index [85] and Site Index [86] (Figure 1). FIF uses a spatially explicit growth model [87,88] to predict volume of different log grades across the landscape. This timber-yield surface enables the estimation of volume of logs (by log grades) that can be harvested. Revenues are calculated by multiplying specific log grades by their corresponding log prices. Log prices are based on the 12-quarter average prices reported by the New Zealand Ministry for Primary Industries [89]. An analyst can then evaluate whether a planted forest on a piece of land in New Zealand would successfully grow and if it grows, how much volume of wood (in different log grades) would be harvested at the end of the rotation. Any log grade harvested can be modelled to be sent to any location in New Zealand depending on the user’s needs or situation (e.g., nearest saw mill, preferred sea port).
Carbon sequestration is estimated from the same productivity surface used to determine timber productivity combined with the C-Change carbon model [89,90]. New Zealand has an emissions trading scheme that enables the trading of carbon sequestration credits [91]. To calculate for the revenue from sale of carbon credits, the quantity of carbon sequestered is multiplied by the reported carbon price in New Zealand, which can be accessed online at CommTrade [92]. The value from the sale of logs and carbon credits represent the two main revenue surfaces in FIF (Table 2). The formulae used in the construction of the cost and revenue surfaces are described in Harrison et al. [84].
The FIF generates production cost surfaces that are calculated based on reported and imputed costs (Table 2). Costs of production incurred (e.g., establishment, silviculture, and harvesting) are calculated based on average costs for New Zealand reported in databases (e.g., AgriHQ [93]). These cost data are spatially adjusted based on impedances derived from biophysical characteristics: rainfall, slope [94], erosion class, soil types [95], River Environments Classification (REC) [96], Land Use Capability (LUC) classes, Land Cover Databases (LCDB), and expert knowledge [84].
The cost of establishing a new plantation forest involves purchasing and planting the crop, and the control of weeds to allow maximum tree growth during the crop establishment period. Costs for FIF are estimated for labor, herbicide application, the purchase of tree stock, planting, and management of the crop during the establishment phase. Costs for silviculture practices are estimated using labor costs, which include the costs of chainsaws, fuel, protective clothing transport and overheads, and the time (minutes) taken to perform a certain task such as thinning and pruning. Task times are derived from relevant silvicultural time standards. A slope adjustment factor, based on how difficult it is to travel across a site, is used to modify establishment and silviculture costs within the framework.
Costs for landings and forest roads are calculated using landing and road density estimates. The density at which landings and roads occur within a forest are assigned to three slope classes (1) 0–10; (2) 10–20; and (3) >20-degree slope. Within FIF, spatial datasets have been developed and used to estimate landing cost classes representing easy, moderate, and hard soil types (for earthworks) and the above three slope classes. Soil class was developed by identifying the main soil occurring at the soil order level of the New Zealand Soil Classification from the Land Resource Inventory [95] digital data and assigning these soil types to an easy, moderate, or hard “difficulty of earthworks” using expert knowledge provided by forest industry road engineers and publications [84].
Harvesting costs are calculated using slope classes for the North and South Islands by assigning the corresponding AgriHQ harvesting value (cost to harvest per cubic meter). The productivity layer is then multiplied by the correct value to give the cost of harvest. The calculation of transport costs from the forest location to the destination (port, saw mill, processing plant) are undertaken on a distance basis. The cost to transport a ton of timber multiplied by distance in kilometers.
FIF can also be used to determine whether a new road is required to reach each forest location and estimate its cost of construction. FIF can be used to identify the least cost path to construct a road from the current road network to the forest. The impedance surface assigns cost associated with building a road across slope, erosion, and rainfall classes. The FIF tool also includes costs incurred when crossing a water way (e.g., river, stream). When modelling road construction, small streams incur a relatively low cost, compared to rivers and wetland areas that are given prohibitively large costs to ensure avoidance during cost path model calculations. Costs were assessed by running the model for known forests and using expert knowledge to adjust impedance values against reasonable real-world costs.
Data have been incorporated into FIF so that it can be used to account for opportunity costs by including the value of the land of interest [27] or, in other applications, the potential land rental values. The FIF tool also incorporates a Public: Private Benefits framework (PPBF) to determine the appropriate policy intervention for a given area. This component was developed from Pannell [97]. The basic principle of the PPBF is to determine the magnitudes of both private and public net benefits of alternative land uses compared to the current land use. The application of PPBF in New Zealand’s proposed afforestation sites where public benefit is represented by the quantified value of avoided erosion using FIF [27].
Avoided erosion benefits are quantified using the New Zealand Empirical Erosion Model [28] to estimate the reduction in sediments due to land stabilization from woody vegetation. The volume of sediment reduced is spread over a specific rotation period (e.g., 28 years) where it is assumed that full canopy cover provides maximum soil protection when land is changed from bare land (e.g., pasture) to forestry. It is also assumed that sedimentation from forestry may be heightened during the first three years of establishment, as well as during harvesting. The FIF avoided erosion component currently assumes that off-site avoided erosion takes the value of approximately $6.50/ton of sediment prevented from going into the waterways [27]. This value is composed of avoided flood damage and avoided water filtration costs and can be considered as a conservative estimate of the public benefit of avoided erosion [98].
All FIF processes described above are automated using Python programming language and ArcGIS python libraries [99]. The framework uses GIS capability for the calculations to construct spatial layers that represent realistic values as costs and revenues generated during a rotation (or several rotations) of the planted trees. The spatial layers use representative spatial surfaces at a 25 m x 25 m resolution, with different resolutions possible [84]. Given the spatial nature of the framework and the spatial data available, the framework can cover anywhere from a small catchment to the whole of New Zealand.

5. Applications of the Forest Investment Framework

FIF was used in 17 projects and case studies across New Zealand between 2010 and 2018 (Figure 2). The FIF tool has been primarily used in three areas: (1) afforestation feasibility of Māori land; (2) economic development analysis at the regional or national level; and (3) ecosystem services assessment (Table 3). Results from eight out of the 17 FIF case studies are publicly available and some of these results are reported here. Further projects for assessing the ecosystem services provided by planting native and/or exotic tree species in New Zealand using FIF are being planned at the time of writing this paper.

5.1. Afforestation Feasibility of Māori Land

Māori are the indigenous people of New Zealand and there has been increasing recognition in New Zealand of the economic potential and importance of Māori land over the last 40 years. The New Zealand Ministry for Primary Industries (MPI) has indicated that the economic development of New Zealand’s regions is inseparable from the economic development of Māori land. However, it has been reported that 80% of productive Māori land (955,000 hectares) is considered at or below industry-average performance [105]. Much of their land base is steep and unsuitable for land uses other than extensive sheep grazing and forestry. Quantitative and spatial modelling was used to determine areas of Māori land available for afforestation and the potential returns. The four projects across New Zealand all have planted forests as an integral part in providing environmental, social, and economic benefits to Māori. The four Māori collectives that own significant areas of land with potential for afforestation commissioned the authors to apply FIF to assess the value of timber, carbon sequestration and honey production (from future forests) to help design sustainable forestry initiatives (Table 3).
The Māori collective, Ngā Aho Rangahau o Maniapoto, commissioned the authors to assess the value of timber and carbon sequestration from planting Pinus radiata (28-year rotation) as well as from longer term rotation trees such as cypresses and the native totara and kauri [100]. The FIF assessment focused on an area of land located in the western part of the North Island that was within their traditional area of interest. It was determined that planting any of these four species for timber production would be profitable, with P. radiata providing positive net present values per hectare (Figure 3). Results also showed that carbon forests (i.e., permanent planting of trees for carbon sequestration) were not a viable option due to a very low carbon price (NZ $4 per tonne of carbon dioxide equivalent) at the time of the study. However, as carbon prices have increased to NZ $25 per tonne (May 2019), registering for carbon sequestration trading under the New Zealand Emissions Trading Scheme (ETS) has become viable. This FIF application demonstrated the usefulness of having a spatially explicit profitability information which could highlight priority areas for afforestation. The analysis provided the information to help identify which species would provide the highest return on investment. Results also provided insights on whether trees should be planted for timber and/or for carbon sequestration credits.

5.2. Regional and National Economic Development Analysis

Globally, the increase in intensive agricultural practices has led to high pollution rates in many streams and rivers; in particular sediment, nitrogen and phosphorus [106]. The New Zealand government has implemented the National Policy for Freshwater Management, which sets out tougher restrictions for the regulation of water quality than those restrictions previously set [107]. These new regulations could potentially mean that high polluting catchments may have to realize substantial land use change to comply. Government agencies (e.g., regional councils) who implement these new regulations and instigate possible land use change need to understand the implications of changing land use and the effect on a region’s economy. In this situation, FIF was used in seven case studies to provide a breakdown of costs, estimates of potential volume, and revenue from timber and carbon in proposed afforestation areas. Government agencies were also interested in sediment load reductions that could be achieved by converting some marginal pasture areas to forestry. The government’s interest for demonstrating forestry’s multiple benefits can be illustrated by case studies 5, 6, and 8 in Table 3, where three regional councils (Waikato, Bay of Plenty, and Southland) in collaboration with regional development researchers, commissioned the authors to assess the values of timber, carbon sequestration, and sediment reduction in prospective areas where afforestation can help mitigate nitrate leaching. The three regional councils and collaborating researchers have appreciated how FIF’s spatially explicit values helped in targeting which areas across the landscape to afforest or integrate forestry. Prior to using FIF, they relied on average profit per hectare of planted forests, which does not account for the variation in timber profits and ecosystem service values across the landscape. These government agencies also reported that FIF provided new economic and environmental measures to better compare forestry with other competing land uses such as pasture for dairy production as well as sheep and beef cattle production.

5.3. Ecosystem Service Assessment

New Zealand government agencies have the mandate to manage environmental issues and are becoming increasingly aware of non-market (e.g., avoided erosion, pollination, water quality provision) ecosystem benefits [108]. The New Zealand Bay of Plenty Regional Council commissioned the authors to assess the ecosystem services provided by the key land uses in the 17,512-hectare Ōhiwa catchment (Table 3, case study 12). The project aimed to identify the key ecosystem services provided by each of the existing land uses in the catchment and to quantify those values [38]. FIF was used to estimate the ecosystem service values provided by planted forests in terms of timber, avoided erosion and carbon sequestration. These values were combined with other ecosystem service values for forestry and other land uses derived from the literature. This enabled the comparison of the values for forestry and the other major land uses such as kiwi fruit, dairy cattle and dry stock (e.g., sheep and beef cattle) in the catchment (Figure 4). Those estimated values were used by the council as a discussion point for representing ecosystem service values in planning and land use policy. The ecosystem service assessment (ESA) in Ōhiwa was followed by six other ESA projects commissioned by government agencies and Wenita Forest Products Inc. (a private forest company). Government agencies and a forest company have used FIF outputs to support the formulation of new policies and development of sustainable forestry strategies [38]. Wenita have primarily used the FIF research to demonstrate the environmental (carbon sequestration, avoided erosion) (Figure 5) and social (recreational hunting) values of their forest estate (relative to timber), which helped renew their product certification under the Forest Stewardship Council (FSC) [24].

6. Discussion

The feature that differentiates FIF from the other FES frameworks in Table 1 is the financial viability component that uses long-term forest productivity surfaces combined with spatially explicit forest management costs including establishment, silviculture, roading, harvesting, and transport [27]. This combination helps provide accurate estimates of timber profits from a rotation or multiple rotations of Pinus radiata (New Zealand’s main planted forest species) across the landscape [82]. This feature is supplemented by three ecosystem service components (carbon sequestration, avoided erosion, and biodiversity conservation) that have gained increasing importance in sustainable forest management and land use policy. FIF has been is primarily used by New Zealand government agencies and indigenous Māori groups for their planning and decision making at specific sites of interest. It has also attracted increasing interest from the forest industry to demonstrate non-market ecosystem services values such as improved water quality, recreation, and habitats for threatened native species. As a result, FIF outputs has been used for renewing product certification and potentially for compliance with regulatory requirements (e.g., license to operate).
FIF, as a spatial economic framework for forestry, has filled a niche for those who are interested in the benefits from planting forests, as evidenced by New Zealand users. A feature of the applications of FIF is that groups using it are wider than just professional foresters. For example, there may be interest in planting trees but also concern about approaching professional foresters, forestry advisors, or forest management consultants, and the financial investment that their detailed assessments are likely to require; broader assessments as provided by FIF may be more accessible including the accessibility through alternate funding processes such as regional and national planning mechanisms. A land owner may still require a full forest planning and economic analysis—in other words, specialist knowledge, models and forecasts—however FIF allows such analysis to be targeted to areas likely to succeed under forests and provides approximations of non-timber ecosystem service values.
Some government agencies and Māori groups have commissioned the authors to run the FIF across areas of operations to get an understanding of FES values, mainly timber and carbon, and occasionally avoided sedimentation. Therefore, we classify this framework as an FES analytical tool for the government, civil society, and (increasingly) for the industry. This suggests that these major sectors in New Zealand have a common interest on understanding the full value of forests in policy and investment decisions. The ecosystem services framework, which underpins the assessment approach in FIF, provides a common language through which the three sectors can communicate on the governance of sustainable management of forests and other land uses.
FIF is the only forest specific framework in New Zealand that assesses forestry’s viability as well as non-market ecosystem services. The profitability of planted forests is significantly lower compared to other more intensive land uses such as dairy farming and horticulture but the value of the non-market ecosystem services they provide are usually higher than other land uses. This is illustrated in the stacked values of ecosystem services in the Ōhiwa catchment (Figure 4) where the average annualized profit per hectare from planted forests was significantly lower than dairy and horticulture. However, planted forests’ non-market ecosystem services values per hectare per year, such as avoided N leaching, recreation and waste treatment, are more than twice that of the private market benefit. This pattern also holds true in the case of the Wenita Forest Products estate where the combined value of carbon sequestration and avoided erosion exceeds the value of timber profits [24]. Moreover, the annual value of recreation in the highly visited Rotorua planted forest in New Zealand is more than twice the annual timber revenue [8]. These highlight the importance of demonstrating the broader value forests to the economy, environment, and society. Accounting for forests’ multiple functions would enable key stakeholders to have a holistic view of governing sustainable forest management across the landscape. In 2018, New Zealand dairy farms provided almost three times more export earnings than forestry (i.e., NZ $16.7B and NZ $6.4B, respectively) [109]. However, the non-market costs and benefits of these two land uses are usually overlooked due to the lack of information to account for those. The application of FIF, in combination with non-market valuation techniques, in the Ōhiwa catchment have filled this gap, enabling an apple-to-apple comparison of values between land uses.
At present, FIF is neither commercialized nor publicly available. It is currently being refined to include new ecosystem services under a five-year (2014 to 2019) research program where the team is developing spatial functions for the provision of recreation [8,110,111], water quality through nutrient modelling [112], and biodiversity conservation attributes relating to the provision of habitat for native flora and fauna [23,113]. The team is also developing a water flow function based on a forest water model. This will expand FIF’s coverage of ecosystem services.
In addition to developing new functions, FIF could also be combined with related frameworks in Table 1 (e.g., InVEST) to account for other non-market ecosystem services values such as pollination, water purification, water supply, and flood regulation. The annual and seasonal water yield models in InVEST could complement FIF in explaining the variation in water yield across land uses in a catchment or region. This would provide indications on whether planted forests would provide either a service or a disservice in particular areas or certain periods within a year.
Given that FIF is a spatially explicit framework, it allows the integration of related and relevant questions such as the value of natural capital, and the integration of demand- and supply-driven values for non-market FES. Recent developments in valuation approaches of natural capital that are compatible with the traditional forms of capital have opened the possibility of not only valuing the flow of FES but also the value of forest as a natural capital [114]. Furthermore, besides considering FES demand-based valuation approaches [115], FIF could also spatially represent the supply and the market structure of non-market ES following recent developments in this area such as Simulated Exchange Value [116].

7. Conclusions

FIF was developed to better account for the full value of planted forests in land use policy and to facilitate investments in sustainable forest management. The framework has been successfully applied to 17 case studies, with further FIF projects in the pipeline. The application has met various needs including Māori land development, regional economic assessments, and ecosystem services assessments; groups that benefited from FIF studies include regional and national government, the forest industry, indigenous Māori groups and fellow researchers. We therefore conclude that the scientific quantification of the economic, environmental and social values of ecosystems is valued by decision makers across different sectors. This enables decision makers to account for the multiple values of an ecosystem that are realized not only by the owners and/or managers but also by the general public.
As each FIF application is designed based on the needs of the client and the spatial results of which are fairly simple, the outputs from FIF have been useful for groups with different backgrounds. As quantifies multiple values, and it has been already used by multiple stakeholders that are concerned about existing and new forests, it can also be used to inform the formulation of multi-stakeholder programs that could promote socially just, ecologically sound and economically viable initiatives towards sustainable forest management. The continuous refinement and application of FIF in New Zealand, and potentially elsewhere, as well as integrating it with other frameworks, would lead to a more holistic assessment of sustainable management initiatives at the forest estate, catchment, national, and even international levels where the integration of forestry would help maintain and sustain the provision of ecosystem services to society.

Author Contributions

Conceptualization of the manuscript was undertaken by R.Y., D.P., B.H., D.H., T.P. and J.M.; Funding acquisition, R.Y. and T.P.; Investigation, R.Y.; Methodology, R.Y. and D.H.; Project administration, R.Y.; Writing—original draft, R.Y.

Funding

Funding for this research came from the “Growing Confidence in Forestry’s Future” research program (C04X1306), which is jointly funded by the New Zealand Ministry of Business Information and Employment (MBIE) and the Forest Growers Levy Trust.

Acknowledgments

The research benefited from an initial review provided by Steve J. Wakelin of Scion. We thank Les Dowling, Joel Gordon, and John Moore of Scion for their valuable suggestions and comments. We appreciate the editorial assistance provided by Ruth Falshaw and Michelle Harnett. We also thank the two anonymous reviewers for providing very helpful comments.

Conflicts of Interest

The authors declare no conflict of interest.

References and Notes

  1. Food and Agriculture Organization (FAO). Forest Products ANNUAL Market. Review 2013–2014: Geneva Timber and Forest Study Paper 36; Information Service United Nations Economic Commission for Europe and Food and Agriculture Organization of the United Nations: Geneva, Switzerland, 2014. [Google Scholar]
  2. Lindberg, K.; Furze, B.; Staff, M.; Black, R. Ecotourism and Other Services Derived from Forests in the Asia-Pacific Region: Outlook to 2010; FAO: Rome, Italy, 1997; p. 79. [Google Scholar]
  3. Carnus, J.M.; Parrotta, J.; Brockerhoff, E.; Arbez, M.; Jactel, H.; Kremer, A.; Lamb, D.; O’Hara, K.; Walters, B. Planted forests and biodiversity. J. For. 2006, 104, 65–77. [Google Scholar]
  4. Wibe, S. Non Wood Benefits in Forestry: A Survey of Valuation Studies; UN Economic Commission for Europe: New York, NY, USA, 1995. [Google Scholar]
  5. Kerr, S.; McDonald, H.; Rutherford, K. Nutrient Trading in Lake Rotorua: A Policy Prototype; Motu Economic and Public Policy Research: Wellington, New Zealand, 2012. [Google Scholar]
  6. Monge, J.; Parker, W.J.; Pizzirani, S. Identifying complementarities for the dairy and forestry industries in the central north island. N. Z. J. For. 2017, 61, 16–23. [Google Scholar]
  7. The Economics of Ecosystems and Biodiversity (TEEB). The Economics of Ecosystems and Biodiversity: Mainstreaming the Economics of Nature: A Synthesis of the Approachh, Conclusions and Recommendations of TEEB; UNEP: Nairobi, Kenya, 2010. [Google Scholar]
  8. Dhakal, B.; Yao, R.T.; Turner, J.A.; Barnard, T. Recreational users’ willingness to pay and preferences for changes in planted forest features. For. Policy Econ. 2012, 17, 34–44. [Google Scholar] [CrossRef]
  9. United Nations. System of Environmental-Economic Accounting 2012: Experimental Ecosystem Accounting; United Nations: New York, NY, USA, 2014. [Google Scholar]
  10. UK National Escorts Association (UKNEA). The UK National Ecosystem Assessment: Synthesis of the Key Findings; UNEP-WCMC: Cambridge, UK, 2011. [Google Scholar]
  11. Villa, F.; Ceroni, M.; Bagstad, K.; Johnson, G.; Krivov, S. Aries (Artificial Intelligence for Ecosystem Services): A New Tool for Ecosystem Services Assessment, Planning, and Valuation; Ecoinformatics Collaboratory, Gund Institute for Ecological Economics, University of Vermont: Burlington, USA, 2009. [Google Scholar]
  12. Sharp, R.; Tallis, H.T.; Ricketts, T.; Guerry, A.D.; Wood, S.A.; Chaplin-Kramer, R.; Nelson, E.; Ennaanay, D.; Wolny, S.; Olwero, N.; et al. Invest Tip User’s Guide. The Natural Capital Project; Stanford University: Stanford, CA, USA, 2014. [Google Scholar]
  13. McKenzie, E.; Rosenthal, A.; Bernhardt, J.; Girvetz, E.; Kovacs, K.; Olwero, N.; Toft, J.E. Developing Scenarios to Assess Ecosystem Service Tradeoffs: Guidance and Case Studies for Invest Users; World Wildlife Fund: Washington, DC, USA, 2012. [Google Scholar]
  14. Hawkins, C. The scenario planning and investment framework (spif) tool: Users guide ENSIS (a joint venture between CSIRO and Scion). 2006. [Google Scholar]
  15. Bagstad, K.J.; Semmens, D.J.; Waage, S.; Winthrop, R. A comparative assessment of decision-support tools for ecosystem services quantification and valuation. Ecosyst. Serv. 2013, 5, 27–39. [Google Scholar] [CrossRef]
  16. Peh, K.S.-H.; Balmford, A.; Bradbury, R.B.; Brown, C.; Butchart, S.H.; Hughes, F.M.; Stattersfield, A.; Thomas, D.H.; Walpole, M.; Bayliss, J.; et al. TESSA: A toolkit for rapid assessment of ecosystem services at sites of biodiversity conservation importance. Ecosyst. Serv. 2013, 5, 51–57. [Google Scholar] [CrossRef] [Green Version]
  17. Hart, G.; Rutledge, D.; Vare, M.; Huser, B. An Evaluation and Prioritisation of Ecosystem Services Models for Inclusion into the Waikato Integrated Scenario Explorer (Wise); Waikato Regional Council: Hamilton, ON, Canada, 2013. [Google Scholar]
  18. Millennium Ecosystem Assessment (MEA). Ecosystems and Human Well-Being: Biodiversity Synthesis (Millennium Ecosystem Assessment); World Resources Institute: Washington, DC, USA, 2005. [Google Scholar]
  19. Bauhus, J.; Pokorny, B.; Van der Meer, P.; Kanowski, P.J.; Kanninen, M. Ecosystem goods and services-the key for sustainable plantations. In Ecosystem Goods and Services from Plantation Forests; Earthscan: London, UK, 2010. [Google Scholar]
  20. Adams, T.; Turner, J.A. An investigation into the effects of an emissions trading scheme on forest management and land use in New Zealand. For. Policy Econ. 2012, 15, 78–90. [Google Scholar] [CrossRef]
  21. Turner, J.A.; West, G.; Dungey, H.; Wakelin, S.; MacLaren, P.; Adams, T.; Silcock, P. Managing New Zealand Planted Forests for Carbon: A Review of Selected Scenarios and Identification of Knowledge Gaps; Report to the Ministry of Agriculture and Forestry; Scion: Rotorua, New Zealand, 2008; 130p. [Google Scholar]
  22. Brockerhoff, E.G.; Jactel, H.; Parrotta, J.A.; Quine, C.P.; Sayer, J. Plantation forests and biodiversity: Oxymoron or opportunity? Biodivers. Conserv. 2008, 17, 925–951. [Google Scholar] [CrossRef]
  23. Yao, R.T.; Scarpa, R.; Turner, J.A.; Barnard, T.D.; Rose, J.M.; Palma, J.H.; Harrison, D.R. Valuing biodiversity enhancement in New Zealand’s planted forests: Socioeconomic and spatial determinants of willingness-to-pay. Ecol. Econ. 2014, 98, 90–101. [Google Scholar] [CrossRef]
  24. Yao, R.T.; Harrison, D.R.; Harnnett, M. The broader benefits provided by New Zealand’s planted forests. N. Z. J. For. 2017, 61, 7–15. [Google Scholar]
  25. Baillie, B.R.; Neary, D.G. Water quality in New Zealand’s planted forests: A review. N. Z. J. For. Sci. 2015, 45, 162. [Google Scholar] [CrossRef]
  26. Monge, J.J.; Daigneault, A.J.; Dowling, L.J.; Harrison, D.R.; Awatere, S.; Ausseil, A.-G. Implications of future climatic uncertainty on payments for forest ecosystem services: The case of the East Coast of New Zealand. Ecosyst. Serv. 2018, 33, 199–212. [Google Scholar] [CrossRef]
  27. Barry, L.E.; Yao, R.T.; Harrison, D.R.; Paragahawewa, U.H.; Pannell, D.J. Enhancing ecosystem services through afforestation: How policy can help. Land Use Policy 2014, 39, 135–145. [Google Scholar] [CrossRef]
  28. Dymond, J.R.; Betts, H.D.; Schierlitz, C.S. An erosion model for evaluating regional land-use scenarios. Environ. Model. Softw. 2010, 25, 289–298. [Google Scholar] [CrossRef]
  29. Willis, K.; Crabtree, B. Measuring health benefits of green space in economic terms. In Forests, Trees, and Human Health; Nilsson, K., Sangster, M., Gallis, C., Hartig, T., De Vries, S., Seeland, K., Schipperijn, J., Eds.; Springer: Berlin/Heidelberg, Germany, 2011; pp. 375–402. [Google Scholar]
  30. Park, B.J.; Tsunetsugu, Y.; Kasetani, T.; Kagawa, T.; Miyazaki, Y. The physiological effects of shinrin-yoku (taking in the forest atmosphere or forest bathing): Evidence from field experiments in 24 forests across japan. Environ. Health Prev. Med. 2010, 15, 18–26. [Google Scholar] [CrossRef] [PubMed]
  31. Abildtrup, J.; Garcia, S.; Stenger, A. The effect of forest land use on the cost of drinking water supply: A spatial econometric analysis. Ecol. Econ. 2013, 92, 126–136. [Google Scholar] [CrossRef] [Green Version]
  32. Vincent, J.R.; Ahmad, I.; Adnan, N.; Burwell, W.B.; Pattanayak, S.K.; Tan-Soo, J.-S.; Thomas, K. Valuing water purification by forests: An analysis of malaysian panel data. Environ. Resour. Econ. 2016, 64, 59–80. [Google Scholar] [CrossRef]
  33. Ninan, K.; Inoue, M. Valuing forest ecosystem services: Case study of a forest reserve in Japan. Ecosyst. Serv. 2013, 5, 78–87. [Google Scholar] [CrossRef]
  34. Pattanayak, S.K.; Kramer, R.A. Worth of watersheds: A producer surplus approach for valuing drought mitigation in Eastern Indonesia. Environ. Dev. Econ. 2001, 6, 123–146. [Google Scholar] [CrossRef]
  35. Tammi, I.; Mustajärvi, K.; Rasinmäki, J. Integrating spatial valuation of ecosystem services into regional planning and development. Ecosyst. Serv. 2017, 26, 329–344. [Google Scholar] [CrossRef] [Green Version]
  36. Belt, M.V.D.; Blake, D. Ecosystem services in New Zealand agro-ecosystems: A literature review. Ecosyst. Serv. 2014, 9, 115–132. [Google Scholar] [CrossRef]
  37. Yao, R.T.; Barry, L.E.; Wakelin, S.J.; Harrison, D.R.; Magnard, L.A.; Payn, T.W. Planted forests. In Ecosystem Services in New Zealand: Conditions and Trends; Dymond, J., Ed.; Manaaki Whenua Press: Palmerston North, New Zealand, 2013; pp. 62–78. [Google Scholar]
  38. Yao, R.T.; Velarde, S.J. Ecosystem Services in the Ōhiwa Catchment; Bay of Plenty Regional Council: Whakatane, New Zealand, 2014; p. 37.
  39. International Energy Agency (IEA). Co-Generation and Renewables: Solutions for a Low-Carbon Energy Future; International Energy Agency: Paris, France, 2011. [Google Scholar]
  40. Verkerk, P.; Mavsar, R.; Giergiczny, M.; Lindner, M.; Edwards, D.; Schelhaas, M.-J. Assessing impacts of intensified biomass production and biodiversity protection on ecosystem services provided by European forests. Ecosyst. Serv. 2014, 9, 155–165. [Google Scholar] [CrossRef]
  41. Grace, J.; Yao, R.T.; Garrett, L.; Heaphy, M.; Katu, G. Ngati rereahu–Scoping the Ginseng Potential in the Central North Island; New Zealand Forest Research Institute Ltd.: Rotorua, New Zealand, 2013. [Google Scholar]
  42. Yao, R.T.; Garrett, L.; Katu, G. Profitability Analysis for Wild Simulated Ginseng under Radiata Pine Forests; Scion: Torrance, CA, USA, 2013. [Google Scholar]
  43. McPherson, A.J. Mānuka—A viable alternative land use for New Zealand’s hill country. N. Z. For. 2016, 61, 11–19. [Google Scholar]
  44. Davie, T.; Fahey, B. Forestry and water yield—Current knowledge and futher work. N. Z. J. For. 2005, 49, 3–8. [Google Scholar]
  45. Dymond, J.R.; Ausseil, A.-G.; Ekanayake, J.; Kirschbaum, M.U.F. Tradeoffs between soil, water, and carbon—A national scale analysis from New Zealand. J. Environ. Manag. 2011, 95, 124–131. [Google Scholar] [CrossRef] [PubMed]
  46. Zhang, X.; Phillips, C.J.; Marden, M. A comparison of earthflow movement rates on forested and grassed slopes, raukumara peninsula, north island, New Zealand. Geomorphology 1993, 6, 175–187. [Google Scholar] [CrossRef]
  47. Marden, M.; Rowe, L.; Rowan, D. Slopewash erosion following plantation harvesting in pumice terrain and its contribution to stream sedimentation, pokairoa catchment, north island, New Zealand. J. Hydrol. (NZ) 2007, 46, 73–90. [Google Scholar]
  48. Master of Financial Economics (MfE). The Framework for a New Zealand Emissions Trading Scheme; MfE: Wellington, New Zealand, 2007.
  49. Department of Conservation (DOC). Guidance on Good Practice Biodiversity Offsetting in New Zealand; DOC: Wellington, New Zealand, 2014.
  50. Kerr, S.; Greenhalgh, S.; Simmons, G. The Taupo Nitrogen Market: The World’s Only Diffuse Source Trading Programme. Available online: http://motu.nz/assets/Documents/our-work/environment-and-resources/nutrient-trading-and-water-quality/Motu-Note-20-Taupo-Nitrogen-Market.pdf (accessed on 30 November 2018).
  51. Deconchat, M.; Brockerhoff, E.G.; Barbaro, L. Effects of surrounding landscape composition on the conservation value of native and exotic habitats for native forest birds. For. Ecol. Manag. 2009, 258, S196–S204. [Google Scholar] [CrossRef]
  52. Pawson, S.M.; Ecroyd, C.E.; Seaton, R.; Shaw, W.; Brockerhoff, E.G. New Zealand’s exotic plantation forests as habitats for threatened indigenous species. N. Z. J. Ecol. 2010, 34, 342–355. [Google Scholar]
  53. Willis, K.G.; Garrod, G.; Scarpa, R.; Powe, N.; Lovett, A.; Bateman, I.J.; Hanley, N.; Macmillan, D.C. The Social and Environmental Benefits of Forests in Great Britain; Forestry Commission: Edinburgh, UK, 2003.
  54. Annual Percentage Rate (APR). Recreational Use and Economic Impact of Whakarewarewa Forest (2009 Update); APR Consultants Ltd.: Rotorua, New Zealand, 2010. [Google Scholar]
  55. Scarpa, R.; Chilton, S.M.; Hutchinson, W.; Buongiorno, J. Valuing the recreational benefits from the creation of nature reserves in Irish forests. Ecol. Econ. 2000, 33, 237–250. [Google Scholar] [CrossRef] [Green Version]
  56. Christie, M.; Hanley, N.; Hynes, S. Valuing enhancements to forest recreation using choice experiment and contingent behaviour methods. J. For. Econ. 2007, 13, 75–102. [Google Scholar] [CrossRef]
  57. Termansen, M.; McClean, C.J.; Jensen, F.S. Modelling and mapping spatial heterogeneity in forest recreation services. Ecol. Econ. 2013, 92, 48–57. [Google Scholar] [CrossRef]
  58. Czajkowski, M.; Buszko-Briggs, M.; Hanley, N. Valuing changes in forest biodiversity. Ecol. Econ. 2009, 68, 2910–2917. [Google Scholar] [CrossRef] [Green Version]
  59. Koellner, T.; Sell, J.; Navarro, G.A. Why and how much are firms willing to invest in ecosystem services from tropical forests? A comparison of international and Costa Rican firms. Ecol. Econ. 2010, 69, 2127–2139. [Google Scholar] [CrossRef]
  60. Vesely, É. Green for green: The perceived value of a quantitative change in the urban tree estate of New Zealand. Ecol. Econ. 2007, 63, 605–615. [Google Scholar] [CrossRef]
  61. Wu, S.; Hou, Y.; Yuan, G. Valuation of forest ecosystem goods and services and forest natural capital of the beijing municipality, china. Unasylva 2010, 31, 28–36. [Google Scholar]
  62. Edwards, D.; Jay, M.; Jensen, F.S.; Lucas, B.; Marzano, M.; Montagné, C.; Peace, A.; Weiss, G. Public preferences for structural attributes of forests: Towards a pan-european perspective. For. Policy Econ. 2012, 19, 12–19. [Google Scholar] [CrossRef]
  63. Edwards, D.; Jensen, F.S.; Marzano, M.; Mason, B.; Pizzirani, S.; Schelhaas, M.-J. A theoretical framework to assess the impacts of forest management on the recreational value of European forests. Ecol. Indic. 2011, 11, 81–89. [Google Scholar] [CrossRef]
  64. Beef + Lamb New Zealand. Shelter: Maintaining the Welfare and Productivity of Sheep and Cattle on Drystock Farms. Available online: http://www.beeflambnz.com/Documents/Farm/Shelter.pdf (accessed on 30 November 2018).
  65. Scion. Forecaster User Manual; New Zealand Forest Research Institute Ltd.: Rotorua, New Zealand, 2012; p. 196.
  66. Maunder, C.; Shaw, W.; Pierce, R. Indigenous biodiversity and land use—What do exotic plantation forests contribute? N. Z. J. For. 2005, 49, 20–26. [Google Scholar]
  67. Beets, P.N.; Brandon, A.M.; Goulding, C.J.; Kimberley, M.O.; Paul, T.S.H.; Searles, N. The national inventory of carbon stock in New Zealand pre-1990 planted forest using lidar incomplete-transect approach. For. Ecol. Manag. 2012, 280, 187–197. [Google Scholar] [CrossRef]
  68. Garcia, O. Folpi, A Forest-Oriented Linear Programming Interpreter. In Proceedings IUFRO Symposium on Forest Management Planning and Managerial Economics; Nagumo, H., Ed.; University of Tokyo: Tokyo, Japan, 1984. [Google Scholar]
  69. Manley, B.R.; Threadgill, J.A. LP Used for Valuation and Planning of New Zealand Plantation Forests. Interfaces 1991, 21, 66–79. [Google Scholar] [CrossRef]
  70. MacLaren, J.P.; Wakelin, S.J. Forestry and Forest Products as A Carbon Sink in New Zealand; New Zealand Ministry of Forestry: Wellington, New Zealand, 1991.
  71. Hjortsoe, C.N.P.; Manley, B.; Tarp, P. Multiple Criteria Decision Making Using the Folpi Estate Modelling System; Royal Veterinary and Agricultural University: Frederiksberg, Denmark, 1999; p. 38. [Google Scholar]
  72. Conservation Management Institute. Inforest: Ecosystem Services Calculators. Available online: http://inforest.frec.vt.edu/ (accessed on 31 March 2019).
  73. Schelhaas, M.J.; Eggers, J.; Lindner, M.; Nabuurs, G.J.; Pussinen, A.; Paivinen, R.; Schuck, A.; Verkerk, P.J.; van der Werf, D.C.; Zudin, S. Model. Documentation for The European Forest Information Scenario Model (Efiscen 3.1.3); Wageningen UR: Wageningen, The Netherlands, 2007. [Google Scholar]
  74. Nabuurs, G.-J.; Schelhaas, M.-J.; Pussinen, A. Validation of the European Forest Information Scenario Model (EFISCEN) and a projection of Finnish forests. Silva Fenn. 2000, 34, 167–179. [Google Scholar] [CrossRef]
  75. Thürig, E.; Schelhaas, M.J. Evaluation of a large-scale forest scenario model in heterogenous forests: A case study of switzerland. Can. J. For. Res. 2006, 36, 671–683. [Google Scholar] [CrossRef]
  76. Sharp, R.; Tallis, H.T.; Ricketts, T.; Guerry, A.D.; Wood, S.A.; Chaplin-Kramer, R.; Nelson, E.; Ennaanay, D.; Wolny, S.; Olwero, N. Invest 3.6.0 User’s Guide. Available online: http://data.naturalcapitalproject.org/nightly-build/invest-users-guide/InVEST_3.6.0_Documentation.pdf (accessed on 31 March 2019).
  77. Villa, F.; Bagstad, K.J.; Voigt, B.; Johnson, G.W.; Portela, R.; Honzák, M.; Batker, D. A Methodology for Adaptable and Robust Ecosystem Services Assessment. PLoS ONE 2014, 9, e91001. [Google Scholar] [CrossRef] [PubMed]
  78. Martínez-López, J.; Bagstad, K.J.; Balbi, S.; Magrach, A.; Voigt, B.; Athanasiadis, I.; Pascual, M.; Willcock, S.; Villa, F. Towards globally customizable ecosystem service models. Sci. Total Environ. 2019, 650, 2325–2336. [Google Scholar] [CrossRef] [PubMed]
  79. West, G.G.; Moore, J.R.; Shula, R.G.; Harrington, J.J.; Snook, J.; Gordon, J.A.; Riordan, M.P. Forest Management Dss Development in New Zealand. In Implementation of Dss Tools into The Forestry Practice; Tucek, J., Smreček, R., Majlingova, A., Garcia-Gonzalo, J., Eds.; Technical University of Zvolen: Zvolen, Slovakia, 2013; pp. 153–163. [Google Scholar]
  80. Palmer, D.J.; Höck, B.K.; Payn, T.W.; Lowe, D.J.; Watt, M.S.; Kimberley, M.O. Development of models to predict Pinus radiata productivity throughout New Zealand. Can. J. For. Res. 2010, 40, 488–499. [Google Scholar]
  81. Verkerk, P.J.; Schelhaas, M.J.; Immonen, V.; Hengeveld, G.; Kiljunen, J.; Lindner, M.; Nabuurs, G.J.; Suominen, T.; Zudin, S. Manual for The European Forest Information Scenario Model (Efiscen 4.1); European Forest Institute: Joensuu, Finland, 2016; p. 49. [Google Scholar]
  82. Yao, R.T.; Harrison, D.R.; Velarde, S.J.; Barry, L.E. Validation and enhancement of a spatial economic tool for assessing ecosystem services provided by planted forests. For. Policy Econ. 2016, 72, 122–131. [Google Scholar] [CrossRef]
  83. Ministry for Primary Industries. National Exotic Forest Description as at 1 April 2018; Ministry for Primary Industries: Wellington, New Zealand, 2018.
  84. Harrison, D.; Barry, L.; Palmer, D.; Kimberley, M.O.; Turner, J.A.; Hock, B.; Hall, P. Developing a Forest Investment Finder for New Zealand; Scion: Torrance, CA, USA, 2012. [Google Scholar]
  85. Kimberley, M.; West, G.; Dean, M.; Knowles, L. The 300 index—A volume productivity index for radiata pine. N. Z. J. For. 2005, 50, 13–18. [Google Scholar]
  86. Hunter, I.R.; Gibson, A.R. Predicting pinus radiata site index from environmental variables. N. Z. J. For. Sci. 1984, 14, 53–64. [Google Scholar]
  87. Watt, M.S.; Palmer, D.J.; Höck, B.K. Spatial description of potential areas suitable for afforestation within New Zealand and quantification of their productivity under pinus radiata. N. Z. J. For. Sci. 2011, 41, 115–129. [Google Scholar]
  88. Palmer, D.J.; Watt, M.S.; Hock, B.K.; Lowe, D.J.; Payn, T.W. A Dynamic Framework for Spatial Modelling Pinus Radiata Soil-Water Balance (Swatbal) across New Zealand; Scion Bulletin: Rotorua, New Zealand, 2009; p. 52. [Google Scholar]
  89. Beets, P.N.; Kimberley, M.O. Improvements Contained in The Forest Carbon Predictor, version 3; New Zealand Forest Research Institute Limited (Trading as Scion): Rotorua, New Zealand, 2011.
  90. Beets, P.N.; Robertson, K.; Ford-Robertson, J.B.; Gordon, J.; Maclaren, J.P. Description and validation of c-change: A model for simulating carbon content in managed pinus radiata stands. N. Z. J. For. Sci. 1999, 29, 409–427. [Google Scholar]
  91. Ministry for Primary Industries (MPI). A Guide to Look-Up Tables for Forestry in the Emissions Trading Scheme; Ministry for Primary Industries: Wellington, New Zealand, 2015.
  92. CommTrade. Omf Commtrade Carbon. Available online: https://commtrade.co.nz/ (accessed on 31 March 2019).
  93. AgriHQ. Log Price Report. Available online: https://agrihq.co.nz/assets/Sample-reports/AgriHQ-Log-price-report-April-2017.pdf (accessed on 31 March 2019).
  94. A free, fully assessed 15-m dem for New Zealand. Available online: https://www.researchgate.net/publication/284801082_A_free_fully_assessed_15-m_DEM_for_New_Zealand (accessed on 18 June 2019).
  95. Leathwick, J.; Morgan, F.; Wilson, G.; Rutledge, D.; McLeod, M.; Johnston, K. Land Environments of New Zealand: A Technical Guide; Ministry for the Environment: Wellington, New Zealand; Manaaki Whenua Landcare Research: Hamilton, New Zealand, 2002.
  96. Snelder, T.; Briggs, B.; Weatherhead, M. New Zealand River Environment Classification User Guide; Ministry for the Environment/NIWA: Wellington, New Zealand, 2010.
  97. Pannell, D.J. Technology change as a policy response to promote changes in land management for environmental benefits. Agric. Econ. 2009, 40, 95–102. [Google Scholar] [CrossRef]
  98. Porou, T.; Barnard, T.; Fitzgerald, G.; Moore, D.; Barry, L.; Garrett, L.; Harrison, D. Benchmarking, Scope Assessment, & Critical Evaluation-Social, Cultural, & Economic Aspects of Erosion for Ngāti Porou & A Desired State for the Waiapu Catchment; Ministry of Agriculture and Forestry: Wellington, New Zealand, 2012.
  99. Zandbergen, P.A. Python Scripting for Arcgis; Esri Press: Redlands, CA, USA, 2014. [Google Scholar]
  100. Hock, B.; Heaphy, M.; Harrison, D.; Payn, T. Ngā Aho Rangahau o Maniapoto Forest Opportunities; New Zealand Forest Research Institute (Trading as Scion): Rotorua, New Zealand, 2014; p. 27.
  101. Warmenhoven, T.; Barnard, T.; Pohatu, P.; Garrett, L.; Porou, T.; Fitzgerald, G.; Harrison, D.; Barry, L.E.; Ruru, W. Climate Change and Community Resilience in The Waiapu Catchment; Ministry for primary Industries: Wellington, New Zealand, 2014.
  102. Hock, B.K.; Harrison, D.R.; Yao, R.T. Predicting Harvesting and Deforestation of Radiata Pine Forest Blocks Using National Spatial Datasets; Scion: Torrance, CA, USA, 2016. [Google Scholar]
  103. Garrett, L.; Heaphy, M.; Te Kani, K.; Yao, R.; Steward, G.; Stovold, T. Waikura Valley Land Restoration Project. Available online: https://www.scionresearch.com/__data/assets/pdf_file/0007/61459/Waikura_Valley_info_sheet.pdf (accessed on 30 November 2018).
  104. Yao, R.; Hock, B.; Harrison, D.; Hall, P.; Baillie, B.; Evanson, T. Analysis of Setback Options and Harvesting Implications for Forestry in The Marlborough Sounds; Scion: Torrance, CA, USA, 2017; p. 52. [Google Scholar]
  105. Harmsworth, G.; Tahi, M.; Insley, C.K. Climate Change Business Opportunities for Māori Land and Māori Organisations; Ministry for Primary Industries: Wellington, New Zealand, 2012.
  106. Smith, A.P.; Western, A.W.; Hannah, M.C. Linking water quality trends with land use intensification in dairy farming catchments. J. Hydrol. 2013, 476, 1–12. [Google Scholar] [CrossRef]
  107. Ministry for the Environment. National Policy Statement for Freshwater Management 2014; New Zealand Government: Wellington, New Zealand, 2014; p. 34.
  108. Rutledge, D.T.; Dymond, J.; Greenhalgh, S.; Ausseil, A.G.; Sinclair, R.; Herzig, A.; Morgan, F.; Andrew, R.; Collins, A. Mapping, modelling and managing ecosystems services in New Zealand. In Proceedings of the 2010 International Congress on Environmental Modelling and Software Modelling for Environment’s Sake (Fifth Biennial Meeting), Ottawa, ON, Canada, 5–8 July 2010. [Google Scholar]
  109. Ministry for Primary Industries. Situation and Outlook for Primary Industries (March 2019); Ministry for Primary Industries Economic Intelligence Unit: Wellington, New Zealand, 2019; p. 23.
  110. Sen, A.; Harwood, A.R.; Bateman, I.J.; Munday, P.; Crowe, A.; Brander, L.; Raychaudhuri, J.; Lovett, A.A.; Foden, J.; Provins, A. Economic assessment of the recreational value of ecosystems: Methodological development and national and local application. Environ. Resour. Econ. 2014, 57, 233–249. [Google Scholar] [CrossRef]
  111. Baerenklau, K.A.; González-Cabán, A.; Paez, C.; Chávez, E. Spatial allocation of forest recreation value. J. For. Econ. 2010, 16, 113–126. [Google Scholar] [CrossRef]
  112. Smaill, S.J.; Clinton, P.W.; Höck, B.K. A nutrient balance model (nubalm) to predict biomass and nitrogen pools in pinus radiata forests. For. Ecol. Manag. 2011, 262, 270–277. [Google Scholar] [CrossRef]
  113. Yao, R.T.; Scarpa, R.; Harrison, D.; Burns, R. Does the economic benefit of biodiversity enhancement exceed the cost of conservation in planted forests? In Proceedings of the New Zealand Agricultural and Resource Economics Society (NZARES) Conference, Rotorua, New Zealand, 19–20 October 2017. [Google Scholar]
  114. Fenichel, E.P.; Abbott, J.K.; Bayham, J.; Boone, W.; Haacker, E.M.K.; Pfeiffer, L. Measuring the value of groundwater and other forms of natural capital. Proc. Natl. Acad. Sci. USA 2016, 113, 2382–2387. [Google Scholar] [CrossRef] [PubMed] [Green Version]
  115. Yao, R.; Scarpa, R.; Rose, J.M.; Turner, J. Experimental design criteria and their behavioural efficiency: An evaluation in the field. Environ. Resour. Econ. 2015, 62, 433–455. [Google Scholar] [CrossRef]
  116. Caparrós, A.; Oviedo, J.L.; Álvarez, A.; Campos, P. Simulated exchange values and ecosystem accounting: Theory and application to free access recreation. Ecol. Econ. 2017, 139, 140–149. [Google Scholar] [CrossRef]
Figure 1. Diagram of FIF showing spatial data inputs, processes and outputs (Adapted from Yao et al. [82]).
Sustainability 11 03477 g001
Figure 2. Map of New Zealand showing the location of the 17 FIF case studies conducted to date. ‘(2x)’ indicates that two FIF assessments were completed on the same site.
Sustainability 11 03477 g002
Figure 3. Map showing the spatially explicit timber profitability (in NZ $ per hectare) from a 28-year rotation of Pinus radiata based on combining spatially explicit costs and revenues using the standard discount rate of 8%. (Source: Hock et al. [100]).
Sustainability 11 03477 g003
Figure 4. Stacking of the value of services provided by major productive ecosystems in Ōhiwa catchment, Bay of Plenty Region, New Zealand.
Sustainability 11 03477 g004
Figure 5. Spatially explicit indices of timber, carbon sequestration and avoided erosion in the Wenita Forest Products forest estate (Source: Yao et al. [24]).
Sustainability 11 03477 g005
Table 1. Key properties of selected spatial economic frameworks for planted forests and landscapes with forests.
FrameworkDeveloperFunctionFocusOutputsEcosystem Services AnalysedScaleReference
Forecaster Scion Research, New ZealandForest planning, productivity prediction, profitability analysis, wood quality, nutrient demand, and supplyPlanted forestsMultiple forestry outputs including yield tables per log grade, financial metrics, wood quality Timber volume by log grade, understorey cropping and carbon sequestration Forest plot level West et al. 2013 [79], Watt et al. 2010 [80]
Forest-Oriented Linear Programming Interpreter (FOLPI)Integral, New Zealand (originally developed by Scion) Optimizes what-if scenarios for forest and land use planning Planted forests, other land usesForest product quantities flows and stocks of resources Timber volume, non-timber products, carbon stock, habitat, nutrient leaching, water yield, erosionLandscape/forest estate, regionGarcia 1984 [68]
InFORESTVirginia Tech; Virginia Dept of Forestry, USAFor environmental credit calculation, no economic valuation componentLandscapeEnvironmental credit calculatorAir quality, biodiversity, C sequestration, nutrient and sediment runoffState level, only for Virginia StateConservation Management Institute 2014 [72]
Scenario Planning and Investment Framework (SPIF)CSIRO, AustraliaGuide investment in revegetation schemes at regional and farm scales Plantation forests and other forms of vegetationSuitable areas, costsTimber, C, salinity, water yield, sediment load, biodiversity, slope and terrainFarm, catchment, regionHawkins 2006 [14]
European Forest Information SCENario (EFISCEN)European Forest Institute & Wageningen University, The NetherlandsForest resource projection modelForestsMarket & non-market valuesRoundwood production, residue, stump biomass, C, habitats, recreation, wind and fire riskLarge scale areas from provincial to European levelVerkerk et al. 2016 [81]; Schelhaas et al. 2007 [73]
ARtificial Intelligence for Ecosystem Services (ARIES)Basque Centre for Climate Change, Spain and US Geological Survey, USAA spectrum of simple to complex ES models accessible to a broad range of usersLandscapes, waterways and marine environmentsMarket & non-market valuesCarbon storage, Flood regulation, Outdoor recreation, Pollination, Sediment regulationCatchment, country, globalMartinez-Lopez et al. 2019 [78]; Villa et al. 2014 [11]
Integrated Valuation of Ecosystem Services and Tradeoffs (InVEST) Universities of Stanford and Minnesota, WWF, The Nature ConservancyA family of modeling tools that map, measure and value the goods and services from nature LandscapeMarket & non-market valuesC, water yield for hydropower, water purification, erosion control, pollination, timber, non-timber productsCatchment, regional, nationalSharp et al. 2018 [76]
Forest Investment Framework (FIF)Scion Research, New ZealandForest investment, Estimating ES market & non-market valuesPlanted forests and landscapeMarket & non-market valuesTimber, C-sequestration, avoided sedimentation of waterways Catchment, regional, nationalThis paper
Table 2. List of data used to create the financial spatial functions in FIF.
CostsRevenue
Establishment Carbon credits
Silviculture Timber
External access road construction
Internal landing cost
Internal forest road construction
Harvesting
Transport of timber
Forest management a
ETS compliance a
a These costs were assumed to be a constant value per hectare and were included after the spatial modelling. Adapted from Barry et al. [27].
Table 3. Commissioned FIF studies in New Zealand.
IDClient or ClientsType of Commissioned ReportYearLocationEcosystems Services EstimatedReport/Paper Title
Afforestation feasibility of Māori land1Wright Partners Ltd.Confidential2014Northland regionTimber, HoneyTe Taitokerau report - Building the business case for economic resilience in Northland: A new forest industry.
2Te Puni KōkiriConfidential 2014Northland, Bay of Plenty, Waikato, WanganuiTimber, CarbonMāori land afforestation feasibility study: Phase one
3Ngā Aho Rangahau o ManiapotoPublicly available [100]2014Waitomo, Otorohanga, parts of Ruapehu, New Plymouth, WaipaTimber, CarbonNgā Aho Rangahau o Maniapoto Forest opportunities
4Ngāti Porou, Ministry for Primary Industries, Gisborne Regional CouncilPublicly available [101]2014GisborneCarbonClimate change and community resilience in the Waipu catchment
Regional and National Economics5Bay of Plenty Regional CouncilConfidential 2015Rotorua Catchment, BOP RegionTimber, Carbon, SedimentLake Rotorua Catchment Forestry Profit Analysis
6Ministry for Primary Industries, Waikato Regional CouncilConfidential 2014aWaikato RegionTimber, Carbon, SedimentWaikato forest investment modelling
7Waikato Regional CouncilConfidential 2014bWaikato Region’s marginal land Timber, Carbon Waikato farm forest investment modelling
8Environment SouthlandConfidential2015Southland Timber, Carbon, SedimentThe Southland Economic Project
9Ministry for Primary IndustriesPublicly available [102]2016aNew ZealandTimber and CarbonDeforestation intensions
10Ministry for Primary IndustriesConfidential2016bNew ZealandTimber and CarbonAfforestation of NZ’s productive areas
11Ngāti Porou Forests Ltd.Confidential2017GisborneTimber, mānuka oil, and honeyProfitability of Pinus radiata and mānuka
Ecosystem Service Assessment12Bay of Plenty Regional CouncilPublicly available [38]2014Ōhiwa Catchment, BOP RegionTimber, Carbon, Avoided erosionEcosystem services in the Ōhiwa catchment
13MBIE, Forest Levy and ScionPublicly available [82]2015Selected planted forests across NZTimber, carbon, and sedimentFIF validation and enhancement
14Wenita Forest Products Ltd.Publicly available [24]2016OtagoTimber, Carbon, Sediment, huntingEcosystem Services in the Wenita Forest Products estate
15Whangaparoa 2L Trust, Ministry for Primary IndustriesPublicly available [103]2017Waikura Valley, GisborneTimber, carbon, avoided erosion, habitats for native speciesWaikura Valley land restoration project
16Horizons Regional CouncilConfidential2017Manawatu-Whanganui regionTimber, carbon, avoided erosion Forest Options in the Manawatū–Whanganui Region
17Marlborough District Council, Ministry for Business Innovation and EmploymentPublicly available [104]2017The Marlborough SoundsTimber, Carbon, Avoided erosionEvaluation of forest management options in The Marlborough Sounds
Note: References are provided only for publicly accessible reports and papers.

