Article

Feasibility of Using Calcined Water Treatment Sludge in Rendering Mortars: A Technical and Sustainable Approach

by
Jairo José de Oliveira Andrade
1,*,
Edna Possan
2,
Matheus Chiaradia Wenzel
3 and
Sérgio Roberto da Silva
4
1
Graduation Program in Materials Engineering and Technology, Pontifical Catholic University of Rio Grande do Sul (PGETEMA/PUCRS), Porto Alegre 90610-900, Brazil
2
Engineering Department, Federal University of Latin American Integration (UNILA), Foz do Iguaçu 85866-000, Brazil
3
Pontifical Catholic University of Rio Grande do Sul (PUCRS), Porto Alegre 90610-900, Brazil
4
Civil Engineer, Graduation Program in Materials Engineering and Technology, Pontifical Catholic University of Rio Grande do Sul (PGETEMA/PUCRS), Porto Alegre 90610-900, Brazil
*
Author to whom correspondence should be addressed.
Sustainability 2019, 11(13), 3576; https://0-doi-org.brum.beds.ac.uk/10.3390/su11133576
Submission received: 27 May 2019 / Revised: 17 June 2019 / Accepted: 25 June 2019 / Published: 28 June 2019
(This article belongs to the Collection Trends in Municipal Solid Waste Management)

Abstract

:
Many current industrial processes, such as water treatment, produce large amounts of waste. The water treatment sludge (WTS) must be properly disposed of and/or used as raw material for application in other sectors, such as the construction industry. The rendering mortar production can be an environmentally friendly alternative to recycle the WTS, this being the object of this research. In this way, mortars were produced with 2.5%, 5%, 7.5%, and 10% calcined WTS to replace natural sand. The water absorption, compressive strength, bond strength, and flexural strength properties were evaluated. A natural carbonation was carried out for the determination of CO2 uptake due to carbonation. The results showed that the incorporation of calcined WTS has an influence on all the properties evaluated. Considering 50 years of service life, the CO2 uptake potential for mortar with 10% calcined sludge WTP is 111 kg CO2/t. In the sustainability approach, it was observed that CO2 uptake due to carbonation is higher in mortars with the addition of WTS, and could be an environmentally friendly alternative that compensates emissions from the cementitious materials production.

1. Introduction

Nowadays is observed the increase of worldwide generation of sludge from the water purification process for human use, which includes a large and complex process—flocculation, filtration, and coagulation—in water treatment plants. The water treatment sludge (WTS) is the result of a water treatment process that occurs in water treatment plants (WTPs). In the water treatment, the poly-aluminum chloride or iron salts are added to the removal of impurities and suspended solids [1]. This destabilizes the colloidal particles of the raw water in solution and suspension, forming small flakes, which, after being sediment in decanters and filtered, generate the WTS [2]. This process is an important component of water treatment and sustained for longer [1]. As a result, where large volumes are generated during this process, 100,000 t/year of WTS are generated by a conventional WTP [3]. One of the processes of treatment of this waste is mono-incineration. These processes produce the sewage sludge ash, which also needs to be adequately disposed of in the end. It is estimated that around 1.7 million tons of this waste are produced worldwide each year, with a trend to increase in the future [4].
Chemicals added in the water treatment interfere with the waste characteristics, which, being rich in aluminum or iron, can pollute the environment [5]. Owing to the presence of pathogens and heavy metals [6], sludge from WTPs can pose risks to human health and have an impact on water bodies, being that its correct destination or recycling is quite important. In Brazil, the WTS is classified as solid waste [7], and should be correctly destined, by national legislation. Therefore, water treatment companies have been seeking environmental solutions for processing the waste generated. Some uses of WTS in civil engineering as a building material have been presented in the literature, which can be applied as a raw material in cement [8] and ceramic products [9], bricks [10], development of bio-soils for use in landfills [11] and artificial aggregates [12].
Regarding the use of waste, the cement industry has three alternatives of interest: use of waste as alternative fuels; use of waste as a raw material in clinker production; and use of waste in cement production, in clinker replacement [4].
Considering the application of WTS in concrete production, Yague et al. [13] and Ramirez et al. [2] do not recommend the use of wet WTS in the production of structural concrete. Due to its physical–chemical characteristics, this waste does not present good performance when applied in nature in cement-based materials. Ramirez et al. [2] observed that the substitution of 5% of the natural sand as wet sludge reduces the concrete compressive strength by approximately 50%. Buselatto et al. [14] investigated the use of WTS in sand replacement in concretes with different w/c ratios. The physical–mechanical properties of concretes decrease with the incorporation of WTS, but the WTS must be used, considering a performance desired for concrete in a general way (strength and permeability goals). On the other hand, Sales and Souza [5] observed that the incorporation of wet WTS compromises the safety of structural concrete. Rodriguez et al. [15] observed that mortars mixed with 10 to 30% of atomized sludge resulted in lower mechanical strength than the reference. Based on the results obtained in mortar production, Zamora et al. [16] report that the WTS has the potential for employment as a raw material to the production of building materials and can be used as a sand substitute or alternative cementitious material. According to the authors, the use of up to 75% WTS can improve the mortar’s mechanical strength, as compared to the reference. Ramirez et al. [2] recommended that eco-efficiency studies should be carried out to verify the feasibility of using this waste, in particular, studies with calcined sludge.
As a consequence, this study also evaluates the use of WTS and its potential for CO2 uptake in the carbonation process. According to Cuéllar-Franca and Azapagic [17], carbonation, also called “mineral sequestration,” may be considered as a CO2 storage and utilization option, because of its CO2 uptake in the chemical reaction of this gas, especially with calcium and magnesium oxides to the presence of water with carbonates precipitation. In this process, CO2 is captured in the chemical reaction. In cement-based materials, the carbonation also occurs because of the presence of portlandite in the cementitious matrix. Pade and Guimaraes [18] and Kaliyavaradhan and Ling [19] reported that these materials can capture CO2 during the life cycle. Andrade and Sanjuan [20] reported that the key to the correct estimation of CO2 capture is in the consideration of the relation between the surface/volume of the element. According to Possan et al [21], CO2 uptake is related to the surface area exposed to CO2. Therefore, the higher the element surfaces concerning the volume, the greater the CO2 uptake.
However, there are few investigations of the use of calcined WTS as a fine aggregate in mortars production. Also, no works have been found related to the assessment of CO2 uptake for mortars with WTS, which is very important considering the environmental point of view. In this way, the main purpose of the present study is to investigate the influence of WTS replacement on the properties of interest in engineering under the synergistic point of view.

2. Materials and Methods

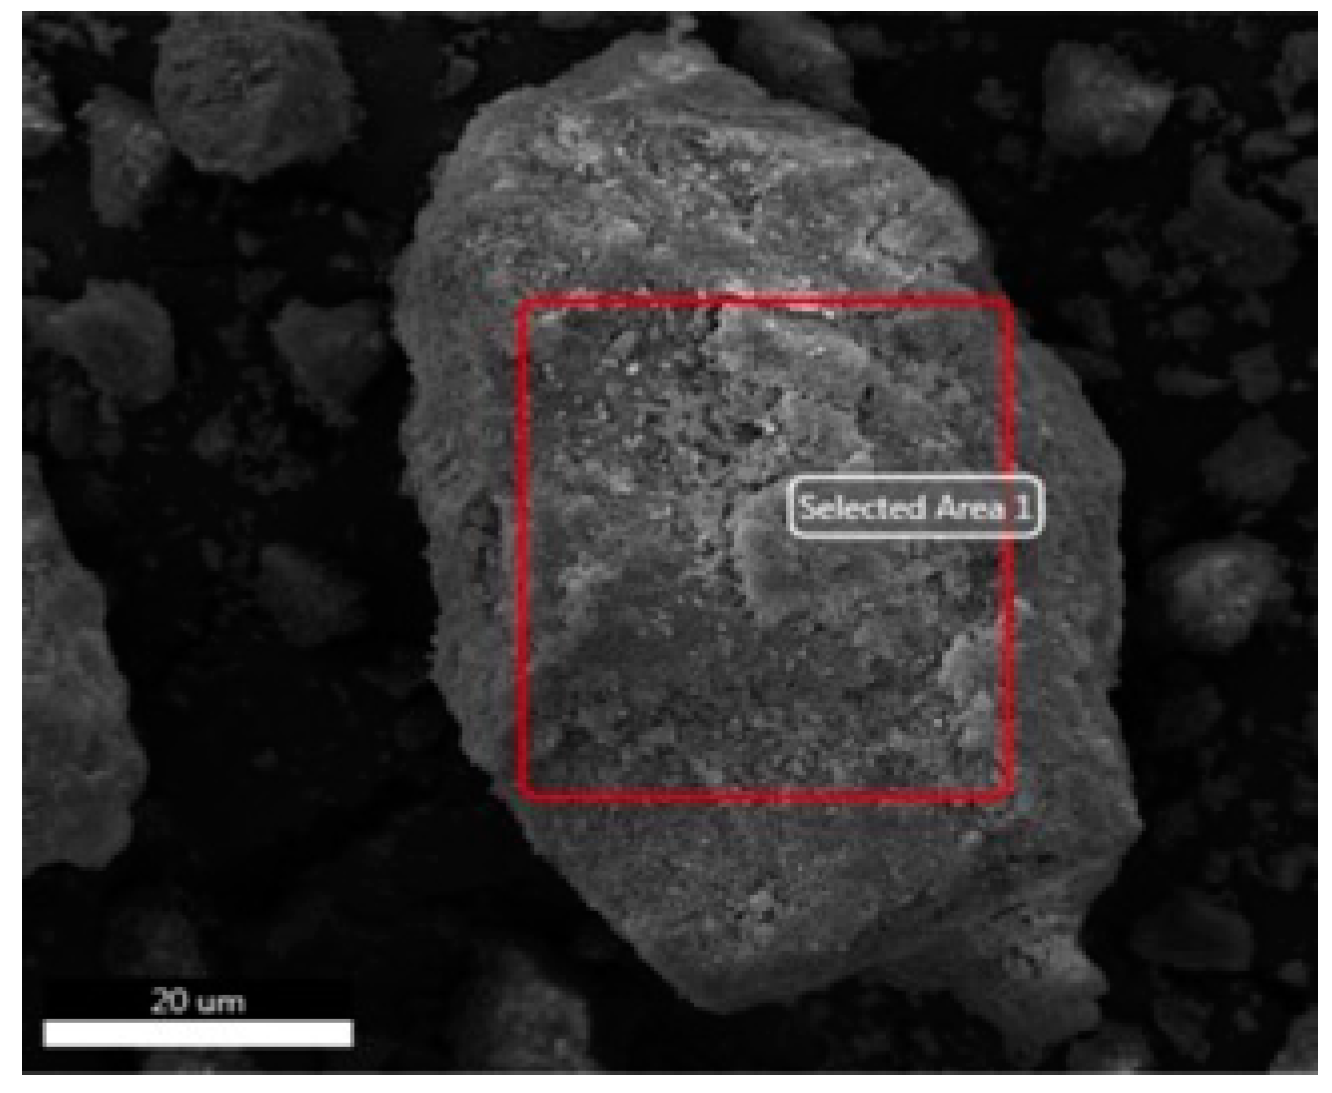
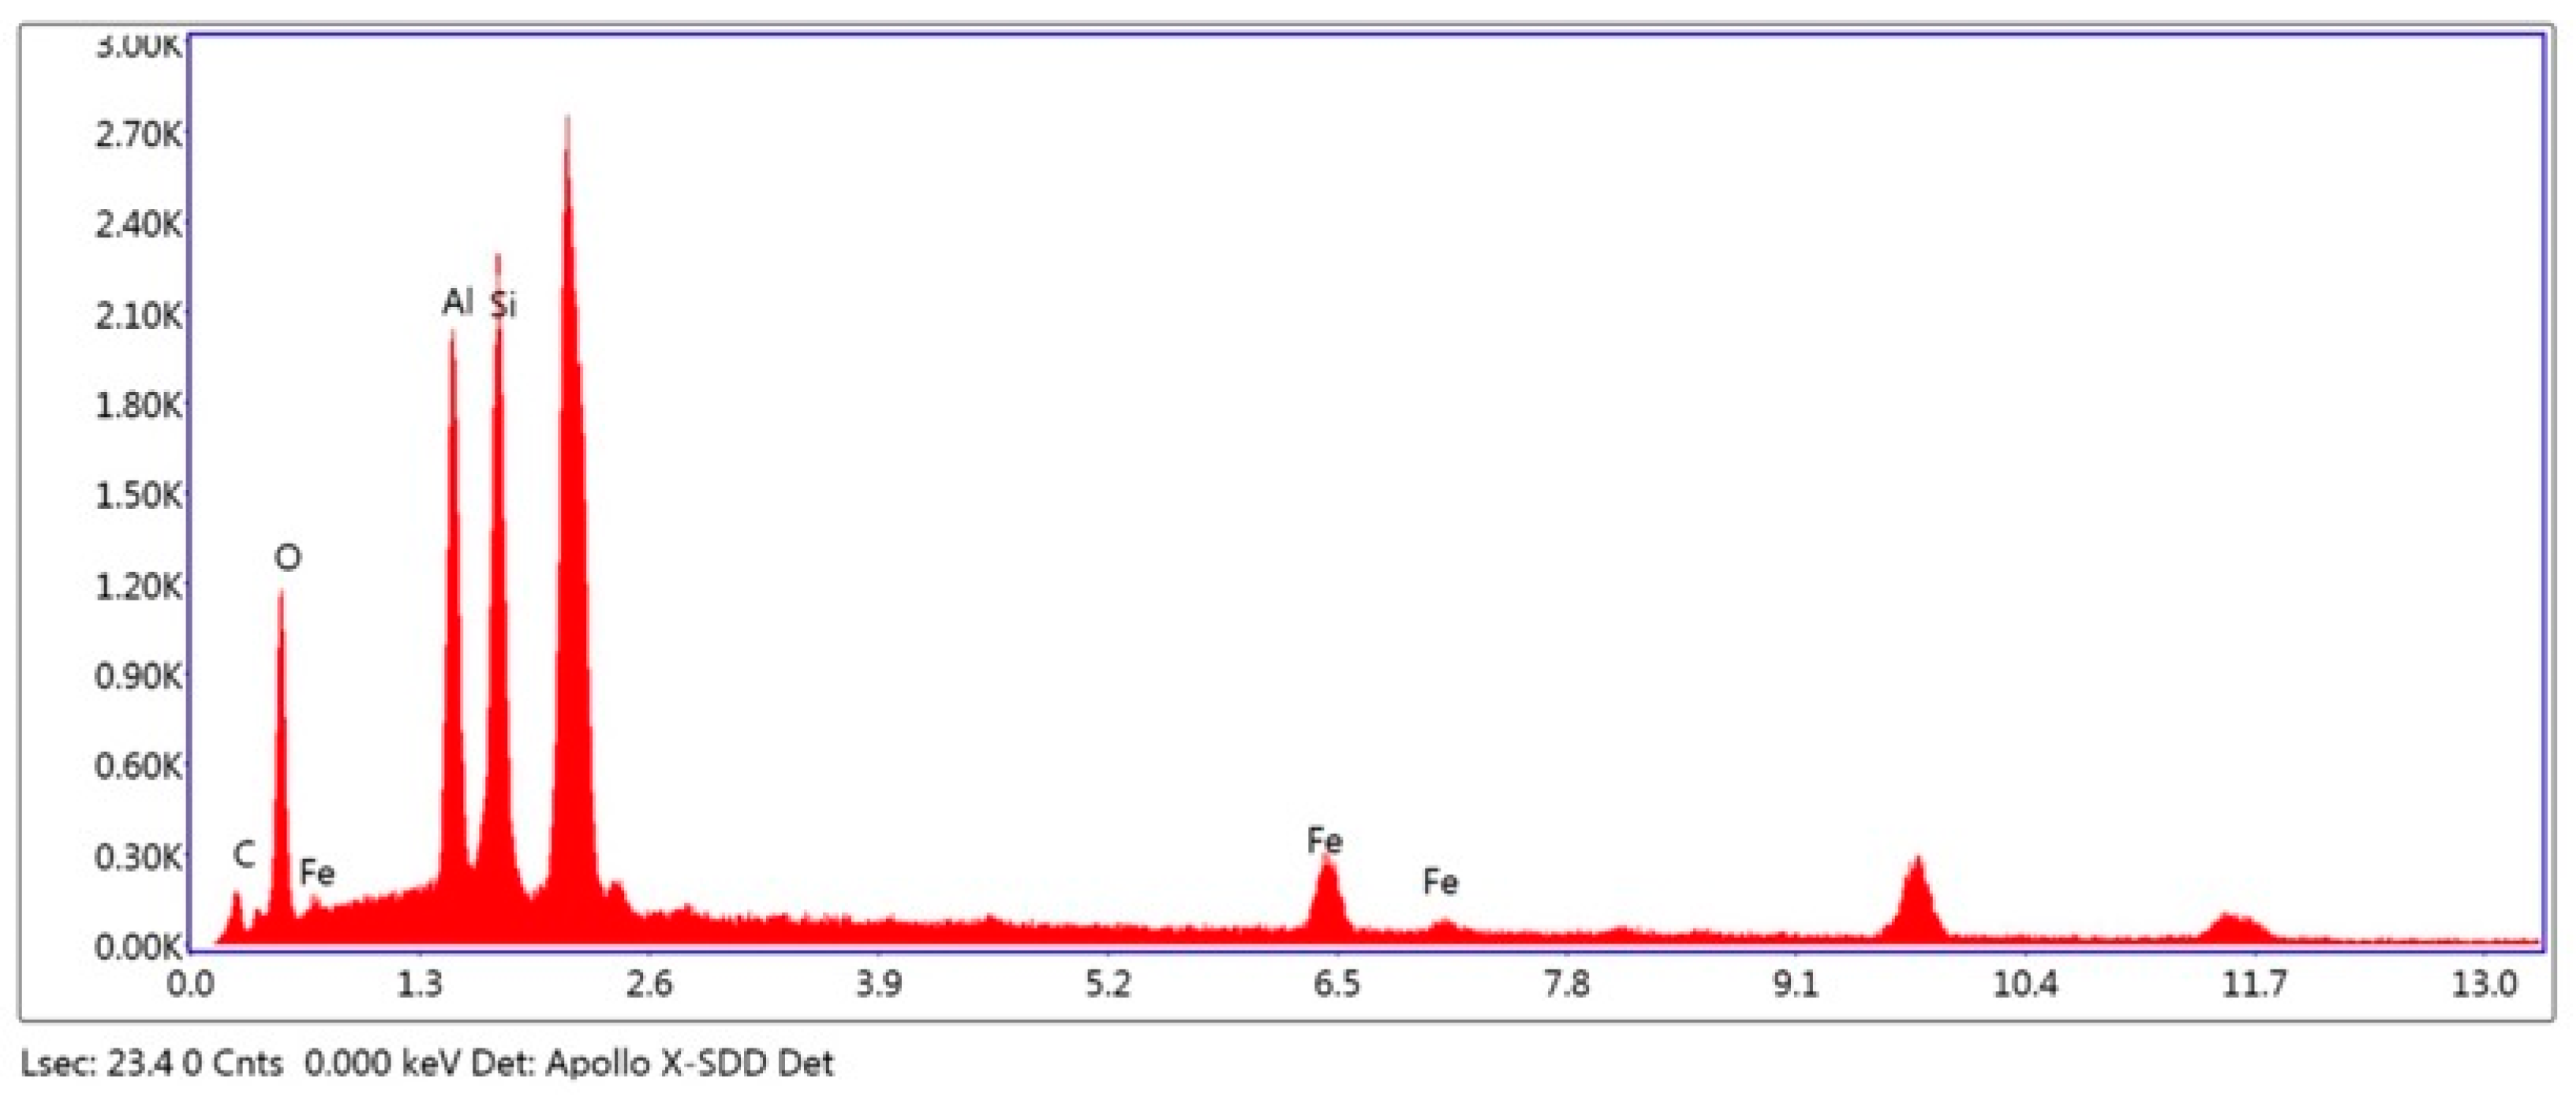
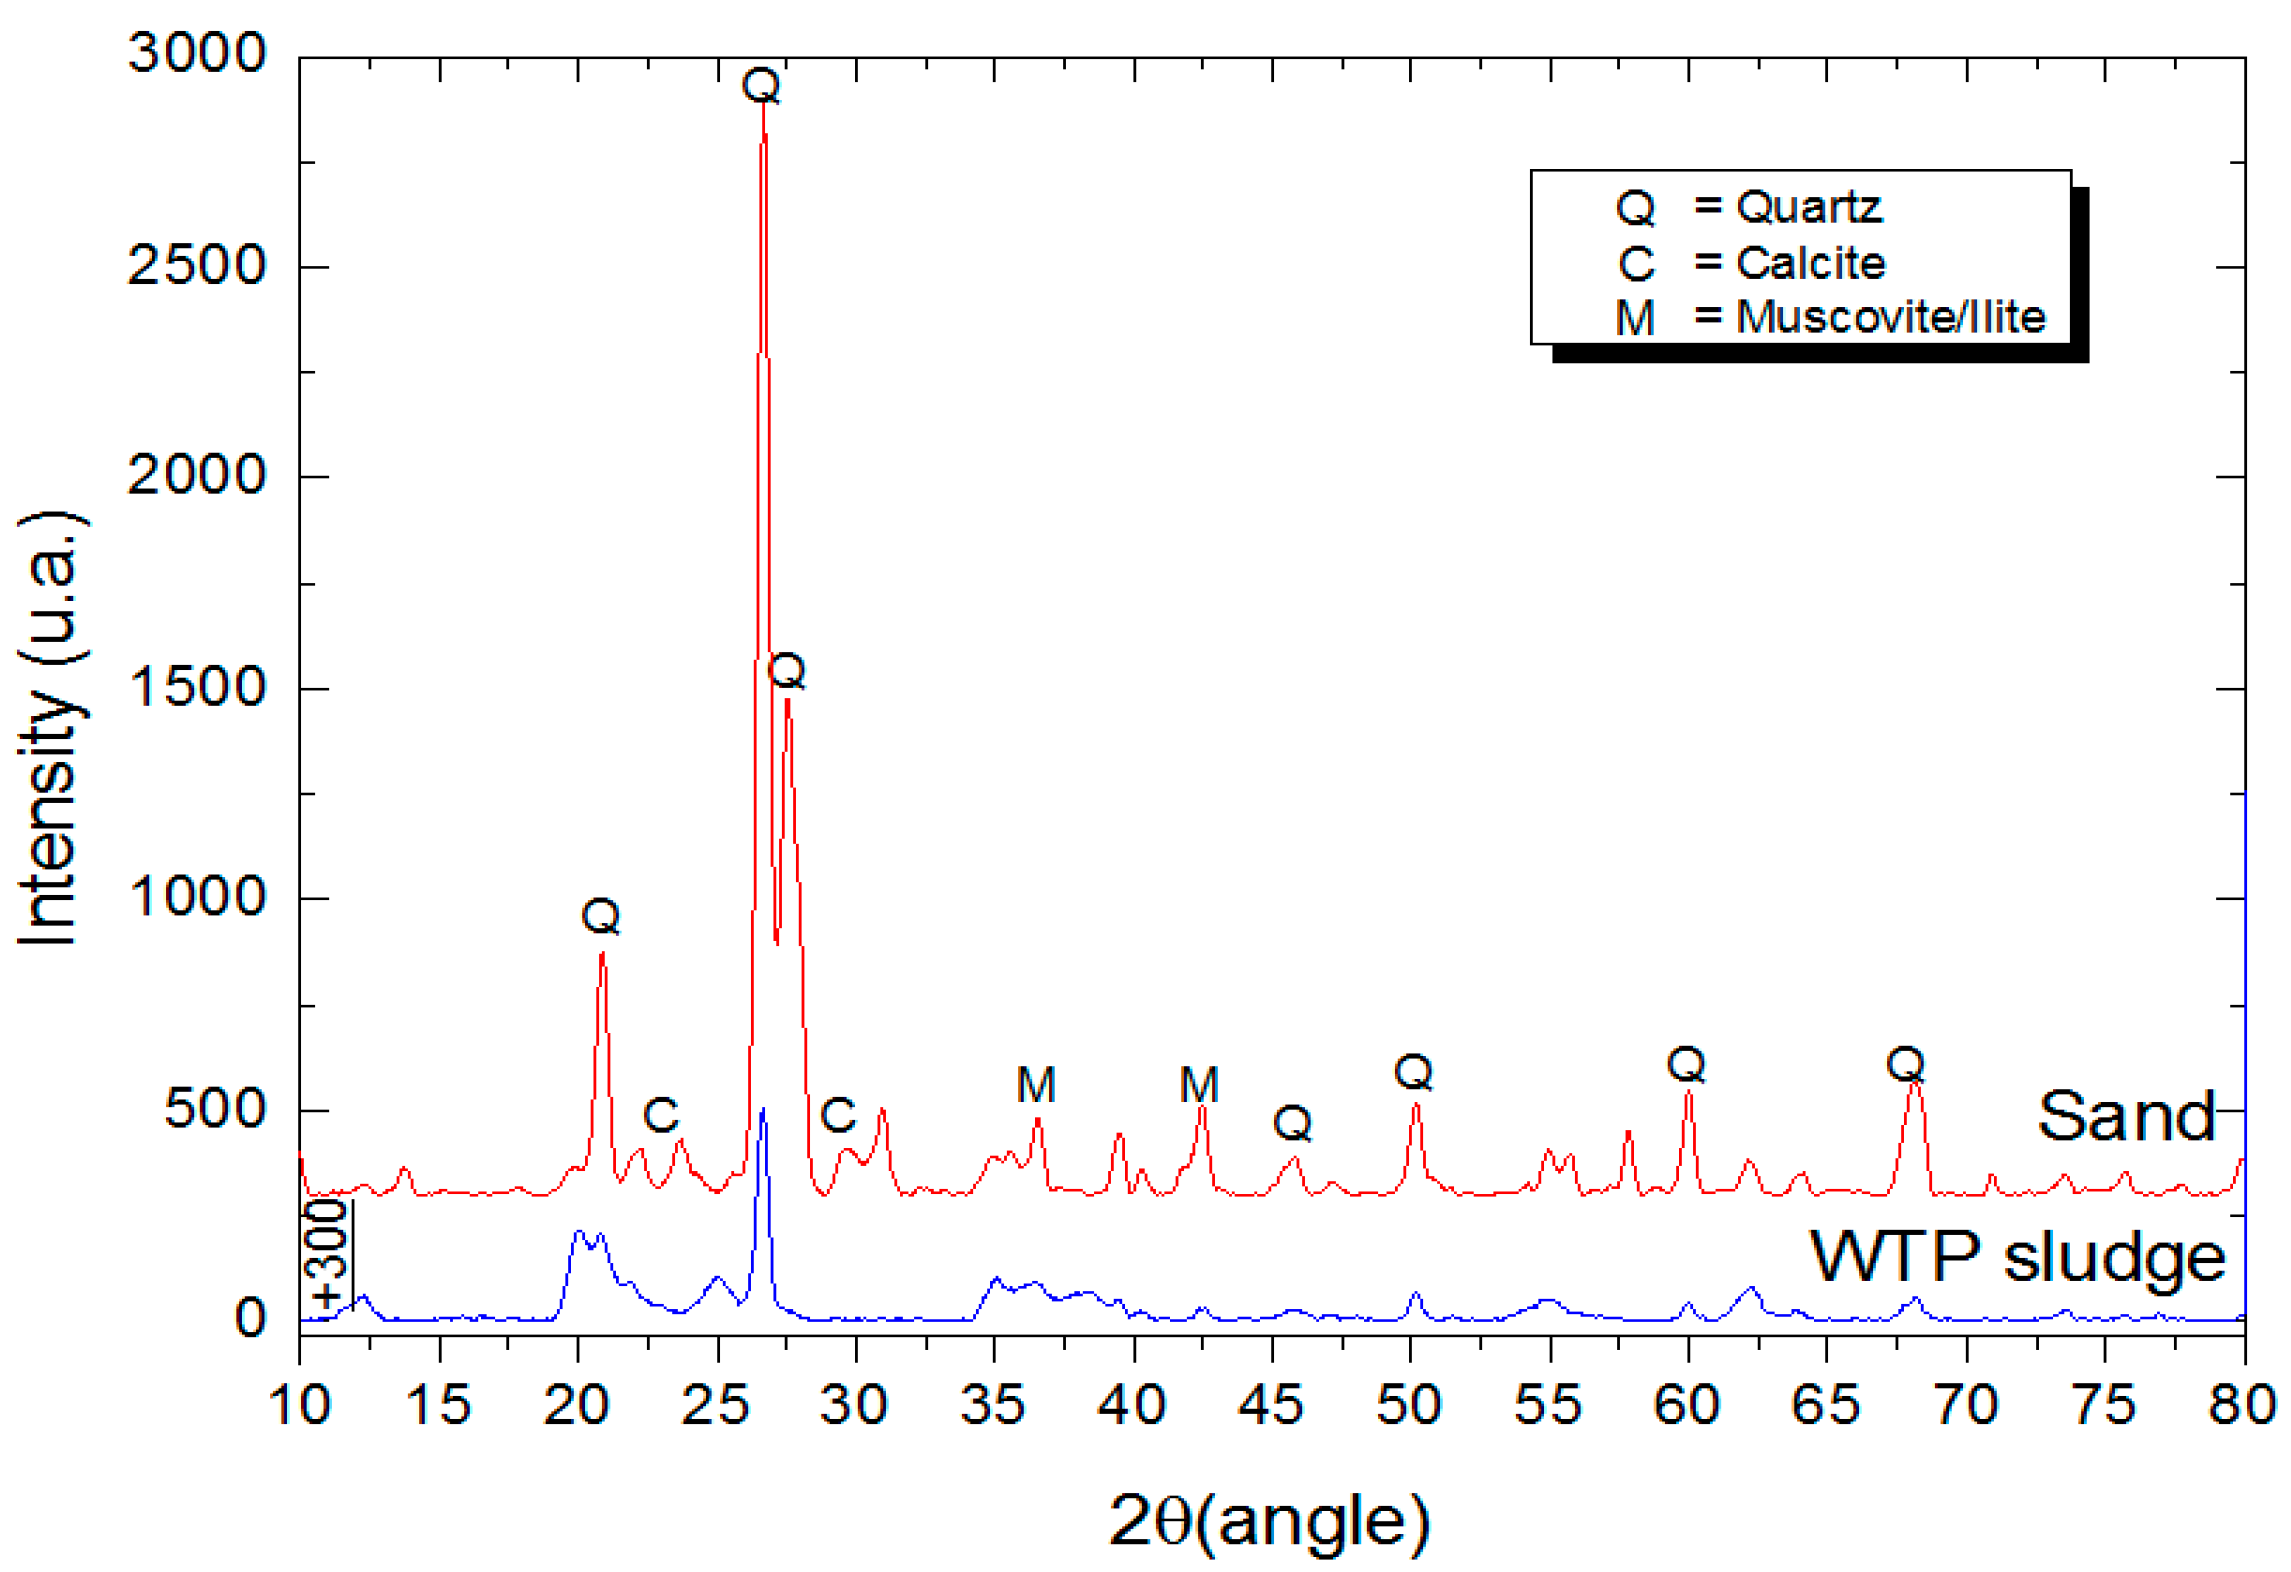
2.1. Materials Characterization

A Brazilian early-age strength cement (equivalent at ASTM C 150 III) was used as a binder, whose density was 3.07 g/cm3, presented 51.3 MPa for compressive strength at 28 days, and a specific surface equal at 1423 g/cm2. The WTS was collected from a water treatment plant (WTP) located in Rio Grande do Sul state, Brazil. The WTP presents the process of coagulation, flocculation, sedimentation, decantation, filtration, and densification, being considered as a conventional water treatment plant, which generates approximately 2940 m3/month of sludge. River siliceous sand and the WTS were used as the aggregate in mortar manufacturing (Table 1).
The WTS collected was dried at 110 ± 5°C for 24 h to remove the water and was milled and passed through a sieve (4.8 mm). After, the WTS was calcined for 1 h at T = 600 °C to eliminate the organic compounds. Figure 1 and Figure 2 show the morphology of WTS and the X-ray spectrometer (EDS) results with the scanning electron microscope (SEM) images. At the analyzed point, we have peaks of Al, Si, Fe, and O, whereas the C peak is related to the carbon film used in sample metallization.
The presence of muscovite (KAl2(AlSi3O10)(FeOH)2), quartz (SiO2), and calcite (CaCO3) can be observed in diffractogram of the aggregates used (Figure 3). Similar results were found by Bashar et al. [22], with the presence of sand and clay in samples and the use of aluminium as coagulant. Hwang et al. [23] observed peaks of quartz and feldspar in WTS from a water treatment plant of Taipei, Taiwan.
The physical–chemical characteristics of WTS are showed in Table 2, and the chemical composition of the WTS and cement are listed in Table 3.
The chemical composition of natural and calcined WTS was close to those found in other investigations [13,24], and we highlight that the highest amount of SiO2 is found in the calcined WTP and the Al2O3 comes from coagulant used in the decantation process. The loss of ignition (LOI) is mainly related to the high amount of volatile matter, and when the sludge is calcined, the LOI is reduced to 18.2%. Donatello and Cheeseman [4] related that the chemical elements in incinerated sewage sludge are silicon, aluminum, iron, calcium, and phosphorus; whitlockite (Ca3(PO4)2), quartz (SiO2), hematite (Fe2O3) being the crystalline forms of these elements.

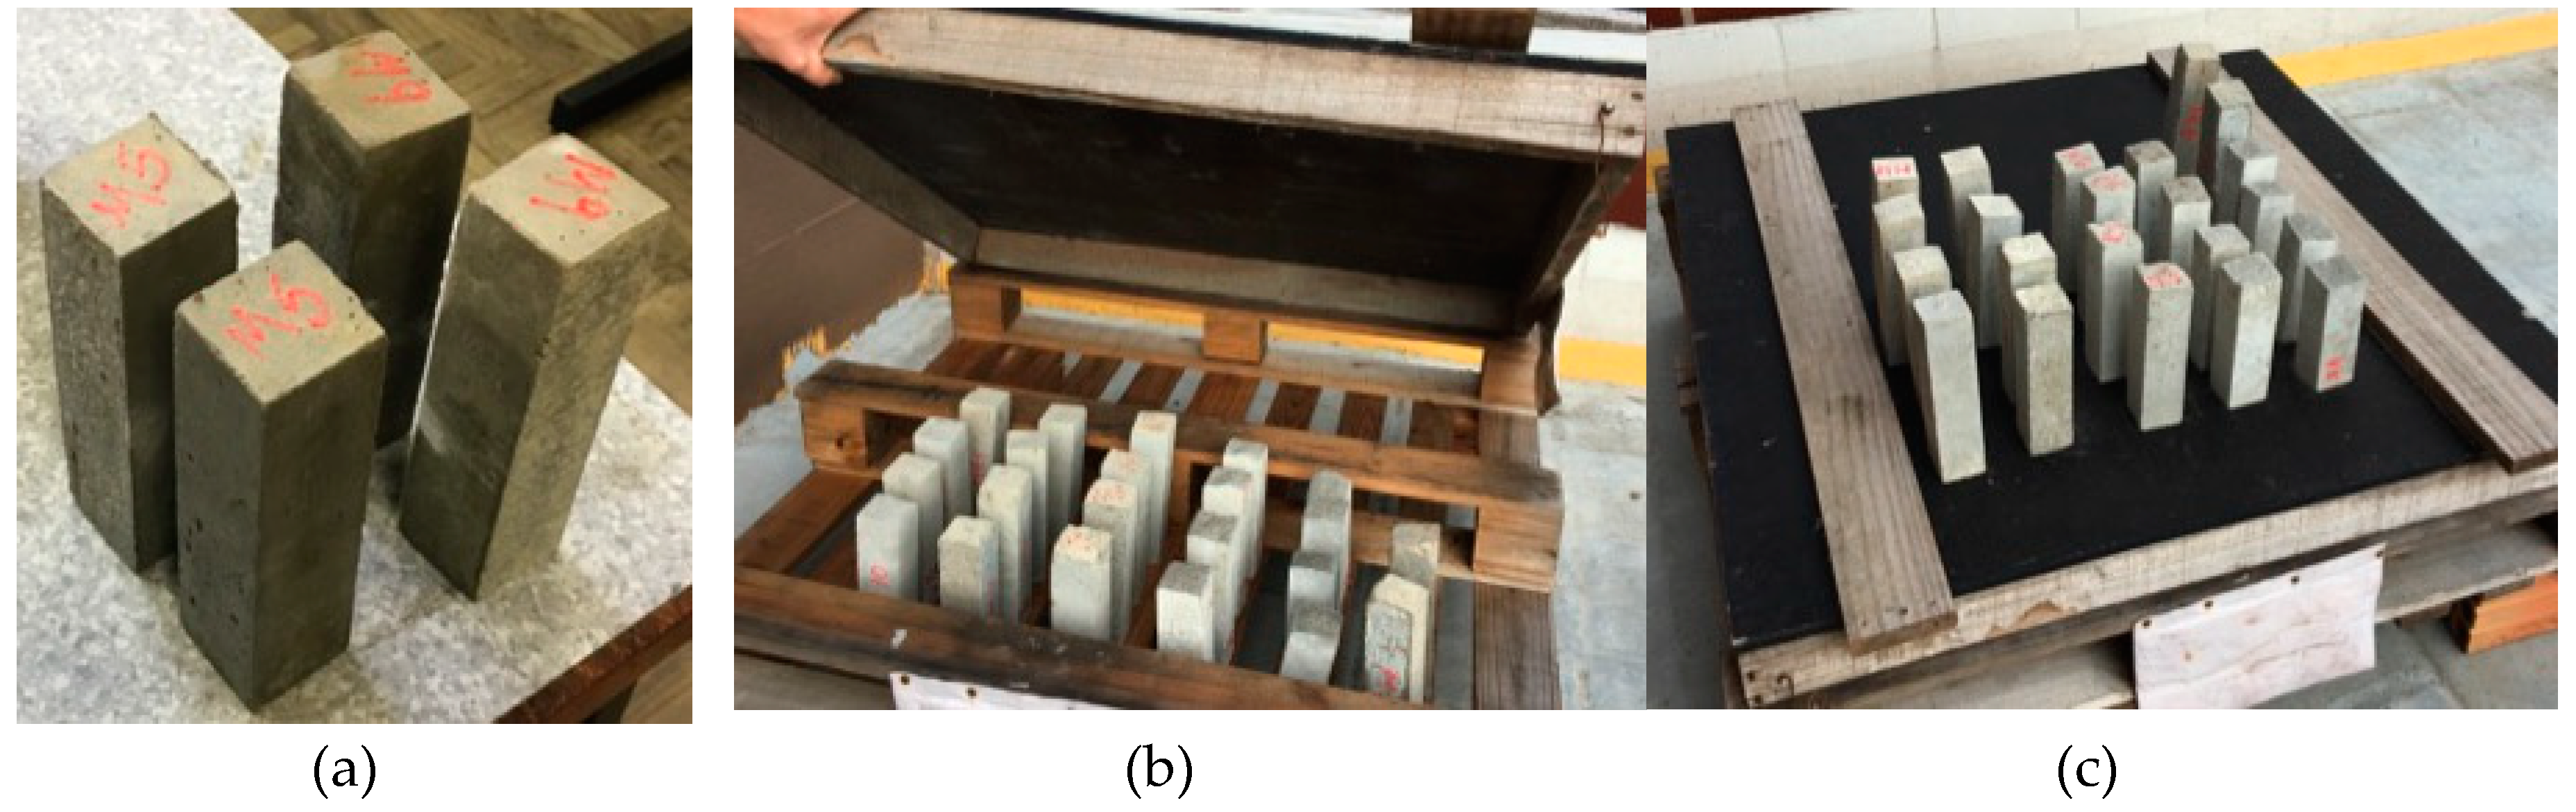
2.2. Production of Mortars and Physical–Mechanical Investigations

Consistency index was maintained in a range of 260 ± 20 mm in agreement with Brazilian standard NBR 13276 [25], similar to ASTM C1329/C1329M [26], for all mortars produced. Table 4 presents the mortars produced, where the sand was replaced by calcined WTS in four replacement levels—2.5% (WTS2.5), 5% (WTS5), 7.5% (WTS7.5) and 10% (WTS10)—in weight. As the WTS presented material with a high proportion of finer particles (lower than 0.075 mm) and was used in dry condition, this lead to an increase of w/c ratio in mixes containing the highest levels of WTS. Due to the difference between specific gravity of WTS and natural aggregate, volume compensation was used, as presented in Equation (1):
M WTS = M NA × γ WTS γ NA
where MWTS is the mass of the WTS (kg), MNA is the mass of the NA (kg), γWTS is the specific mass of the WTS (kg/dm3), γNA is the specific mass of natural aggregate (kg/dm3).
The mortars were storage in a laboratory for the first 24 h and they were then cured by water immersion until the ages were determined for appraisal of physical and mechanical properties and carbonation. The water absorption by immersion and bulk density tests were conducted at 28 days in three prismatic samples of 40 × 40 × 160 mm, in accordance with Brazilian standard NBR 9779 [27]. A flexural and compressive strength test was conducted in three prismatic samples (40 × 40 × 160 mm) at 7, 28, and 91 days, as suggested by Brazilian regulation NBR 13279 [28]. The bond strength was determined according to NBR 13528 [29] in five samples (50 mm diameter, 10 mm thick) at 28 days.

2.3. Natural Carbonation

After curing for 28 days, two prismatic samples (40 × 40 × 160 mm) of each mortar produced were exposed to the different environments (laboratory, external unprotected from rain, and external protected from rain). The carbonation depth on each sample was measured in a cracked surface, and the average value from three measures was determinate after 30, 60, 90, and 120 days of exposure in the environment (Figure 4).
The measurements follow the procedure described in RILEM CPC—18 [30]. An acid-base indicator (1% phenolphthalein, 70% ethyl alcohol and 30% water) was used to distinguish the regions of the sample with different pH. Using a caliper, four measurements of carbonated depth were taken for each sample slice, taking as reference the center point of each face. The average depth of carbonation of two samples was used in analyses.

2.3.1. CO2 Uptake

Cementitious materials, such as concrete and mortar, can uptake CO2 due to the natural carbonation process, in a reverse process to that of cement production [18,31,32]. Equation (2) adapted from BRE Global [33] was used to estimate this potential:
CO 2 u p = e c   × CaO * × % C a O c × Q c e m × % C cem × M
where:
  • CO2up = amount of CO2 uptake (kg/m2)
  • ec = carbonation depth (m)
  • CaO = calcium oxide contained in cement (%)
  • %CaOc = CaO content that is totally carbonated, i.e., is converted into CaCO3
  • Qcem = cement content in 1 m3 (kg)
  • %Ccem = Clinker amount (%)
  • M = CO2/CaO molar ratio.
Through Equation (2), the carbonation depths (ec) are obtained over time. The cement (Qcem) used was based on the material content percentages used in mortars proportioning (Table 4). Where the values of 65% and 75% for CaO and CaOc [34] were adopted, it was assumed that the amount of clinker contained in the cement (%Ccem) is 95%, considering the high-early age strength Portland cement and M for the CO2/CaO ratio were equal at 0.786.
As the CO2 uptake potential is dependent on the exposed surface area, in this study, the relation between “surface exposed/volume of the element” was considered, according to Andrade and Sanjuan [20]. In this case, the results are presented in kg CO2/m2 rendering mortar.
The errors associated with CO2 uptake are related to the inputs used in the calculation equation (Equation (2)), especially to the content of clinker contained in the cement. Thus, the average clinker content in the cement used (95%) was considered in the analyses.

2.3.2. CO2 Balance

Equation (3) was used to conduct the CO2 balance during the life cycle, where BCO2 is the CO2 balance, Emor is the amount of CO2 emitted in mortar production, and Ccap is the amount of CO2 uptake by the mortar.
B C O 2 = E m o r C c a p   ( kg . CO 2 )
The estimated amount of CO2 emissions from cement production emissions from the clinker and aggregates manufacture as the transportation should be considered. For this purpose, Equation (4) was used to estimate CO2 emissions due to cement production (Ecim) based on methodology of the Intergovernmental Panel on Climate Change (IPCC [35]) and the Cement Sustainability Initiative (CSI [36]), in which emissions due to energy use (Eene), material calcination (Edesc), and transportation during cement production (Etrans) are considered:
E c i m = E e n e + E d e s c + E t r a n s   ( kg . CO 2 / t )
For estimation of Eene, Edesc, and Etrans, the methodology presented by Lima [37] was used. As shown in Table 5, the energy data is from the Brazilian National Energy Balance [38].
To estimate emissions from aggregate production, we used indicators found in the literature, using 5.81 kg CO2/t for natural sand. For the estimation of emissions by transportation, the value proposed by Lima [37] for transporting the concrete (8.4 kg CO2/t) was adopted. The emissions related to the calcination of the WTS were not considered. Emissions associated with mortars production (Emor) can be estimated using Equation (5):
E m o r = E c i m + E a g r + E t r a n s m o r   ( kg . CO 2 / t )
where Ecim is CO2 emissions (in kg CO2/g) regarding cement production, Eagr is CO2 emissions (in kg CO2/g) regarding aggregate production, and Etrans-mor is the CO2 emissions (in kg CO2/g) for mortar transportation.

2.4. Statistical Analysis and Modeling

A statistical investigation using the analysis of variance was performed for all models developed. The F-test obtained in analysis results determined if there were any significant differences between the properties investigated, where a confidence level of 95% was used in all analyses. Besides, a nonlinear estimation was made using the experimental data to represent the behavior of investigated properties of mortars with WTS, whose goodness of fit for each model was verified through an analysis of variance (ANOVA).

3. Results and Discussions

3.1. Porosity, Bulk Density, and Water Absorption

Figure 5 shows the effect of WTS aggregate incorporation in physical properties of mortars at 28 days. The results obtained for the physical properties of WTS mortars are quite similar to those found in other previous investigations carried out without using other waste types in concrete [39,40] and mortars [41], in which there is a difference between bulk density and water absorption between the aggregates.
It can be observed in Figure 5 that the increase of porosity and water absorption are directly related to the apparent specific gravity and the w/c ratio of mortars. The calcination process produces a material with higher inner voids, presented consequently as a lower specific gravity than sand [42], as can be seen in Table 2, leading to the decrease of this property with the increase of WTS content. According to Cremades et al. [43], after burning samples in higher temperatures—between 550 °C and 800 °C—the carbonates release the CO2 during the calcination process, leading to a considerable weight loss. So, with the increase of replacement level, the amount of CO2 released is significant, decreasing the apparent specific gravity.
Also, the calcined sludge increased the water demand to obtain the mortars’ target workability, contributing to the lower density and higher porosity. Superplasticizer and air incorporator can aid in obtaining workability.

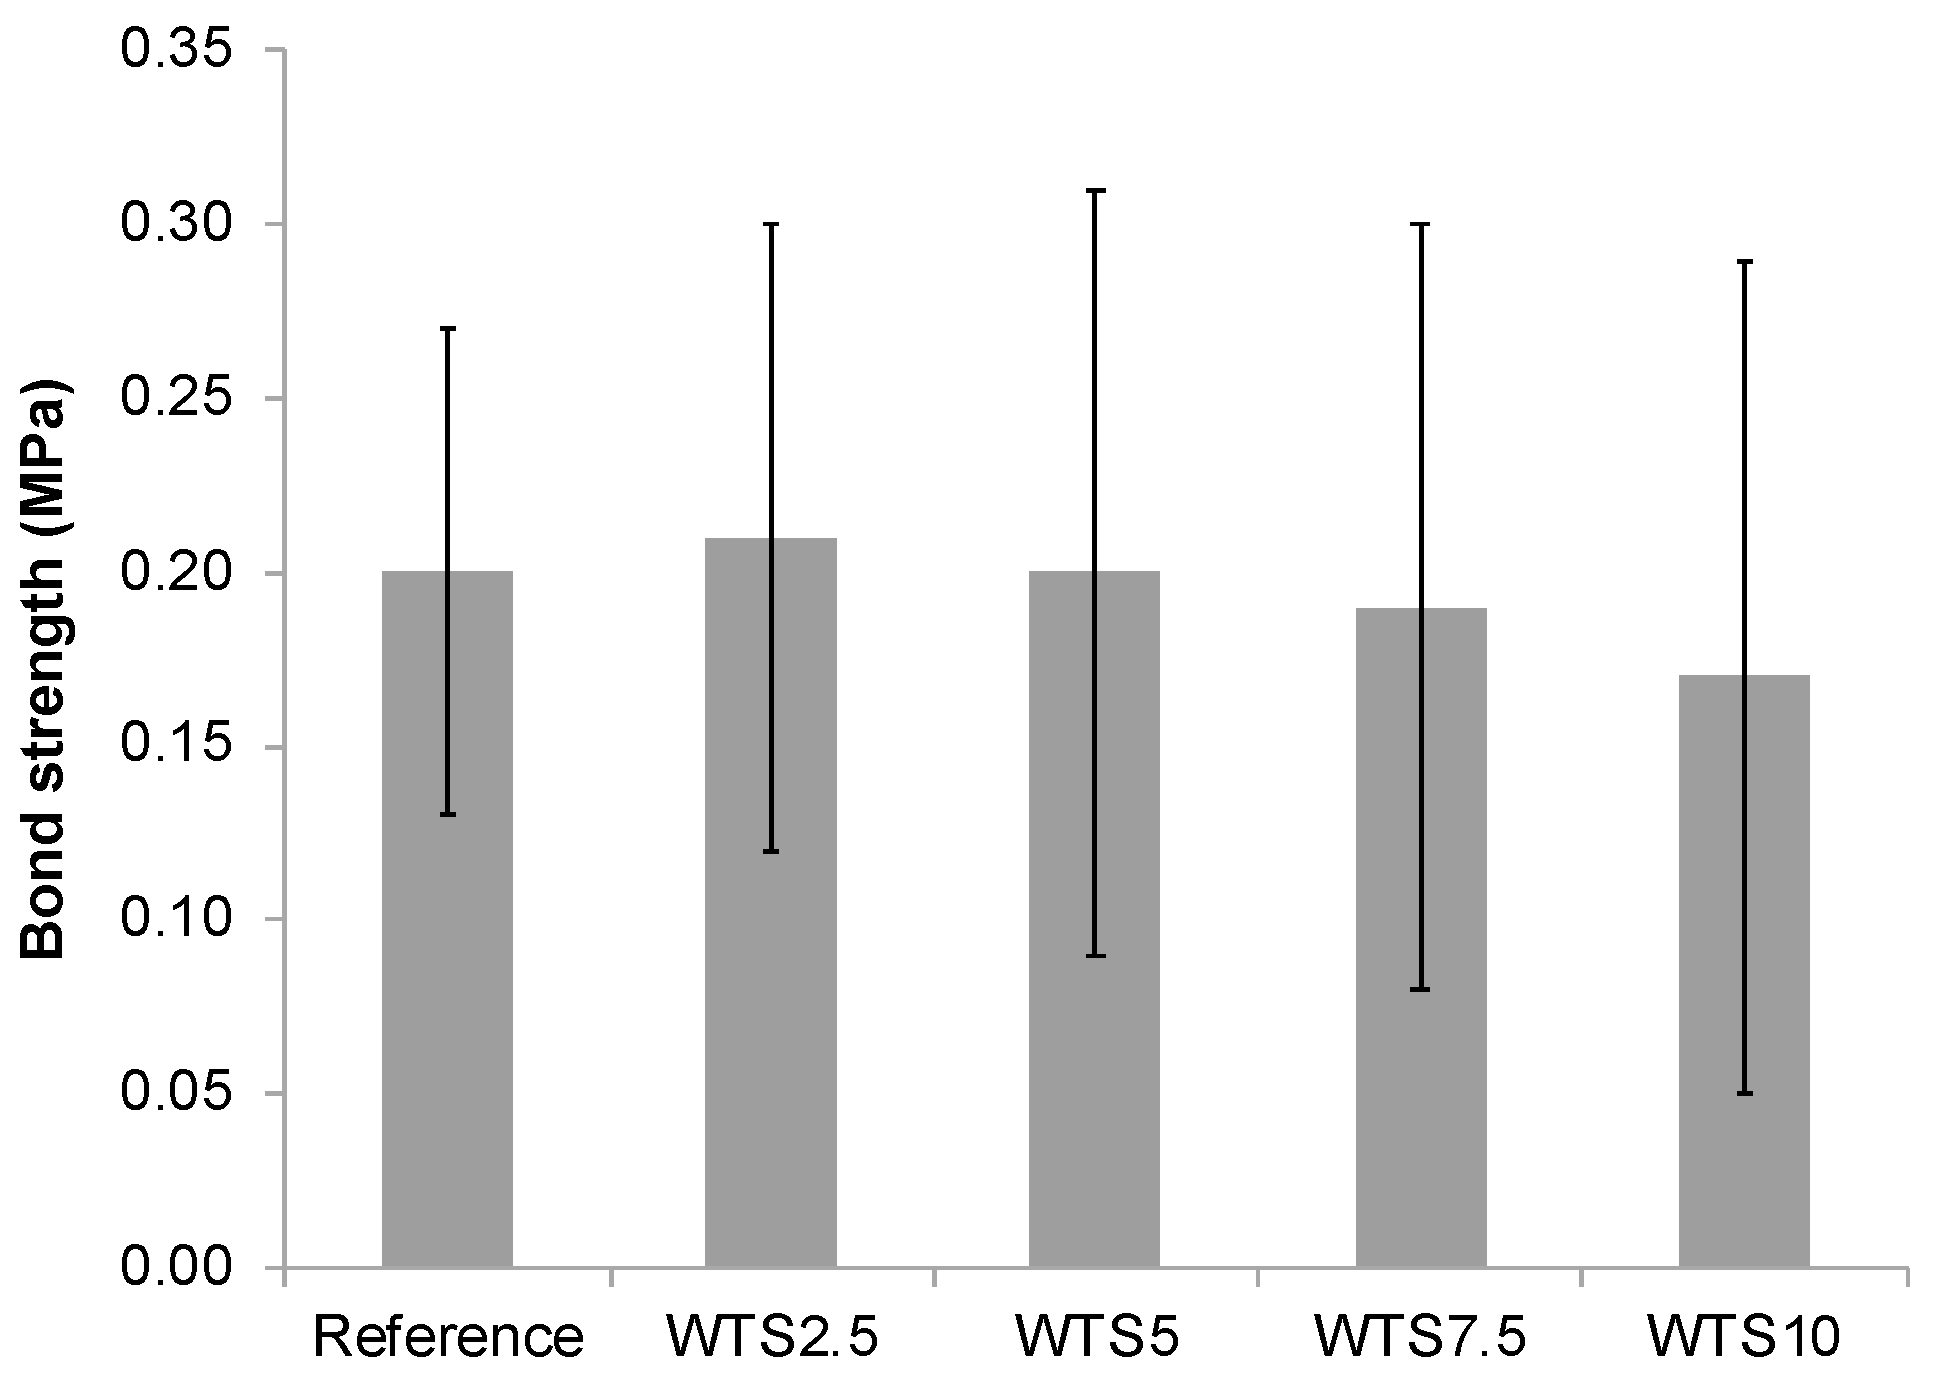
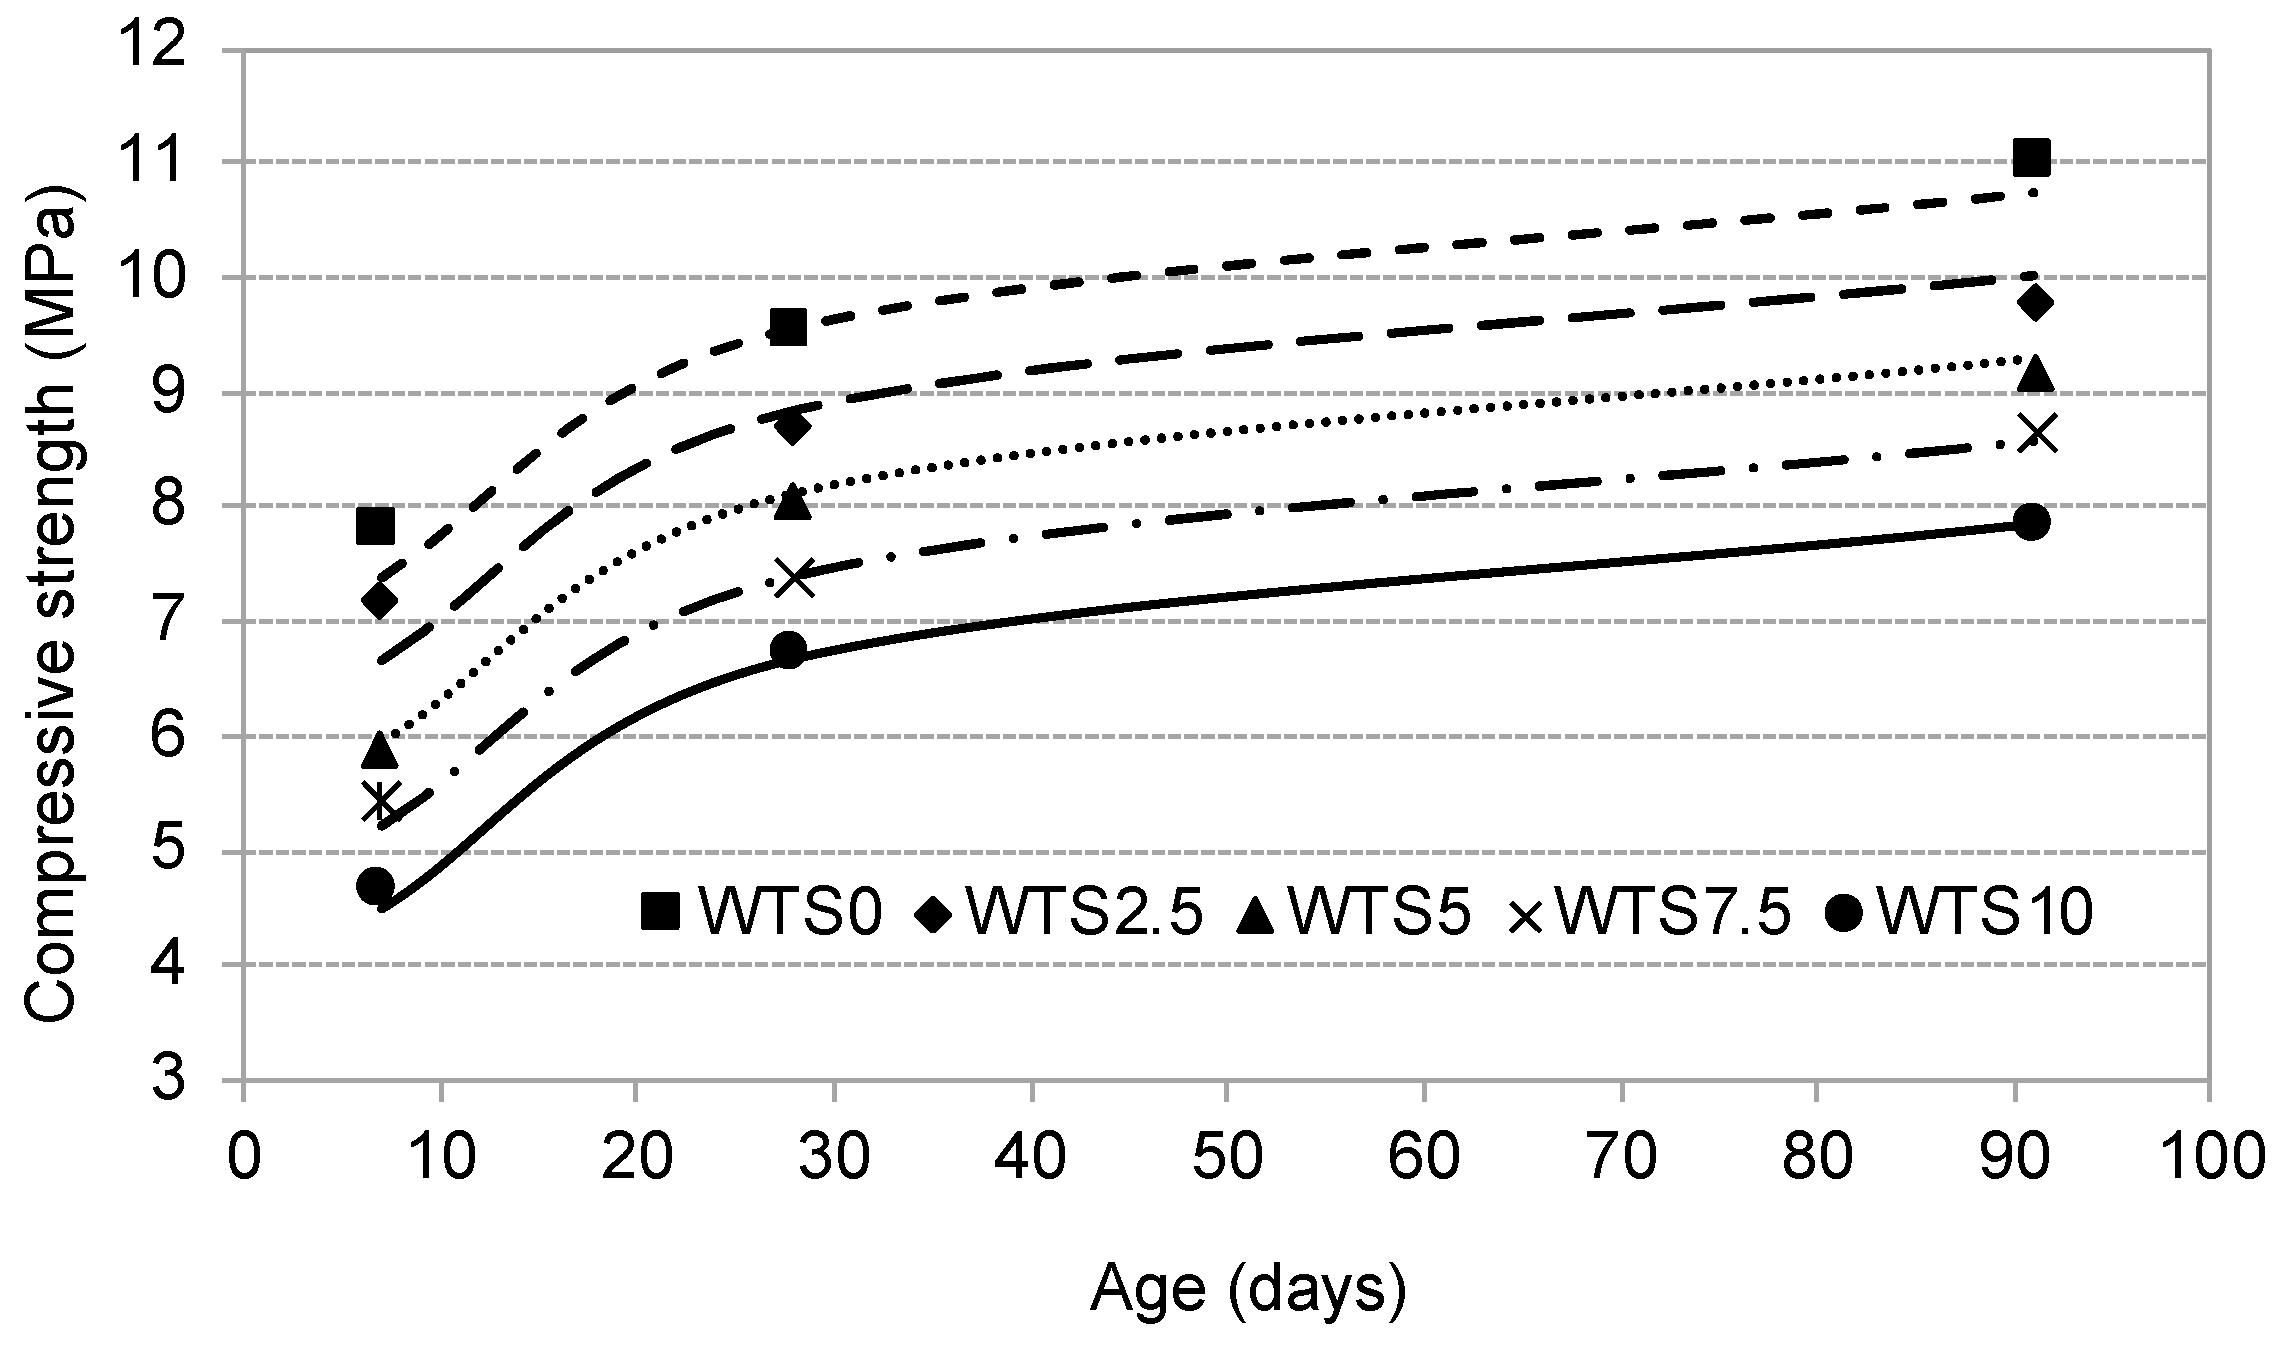
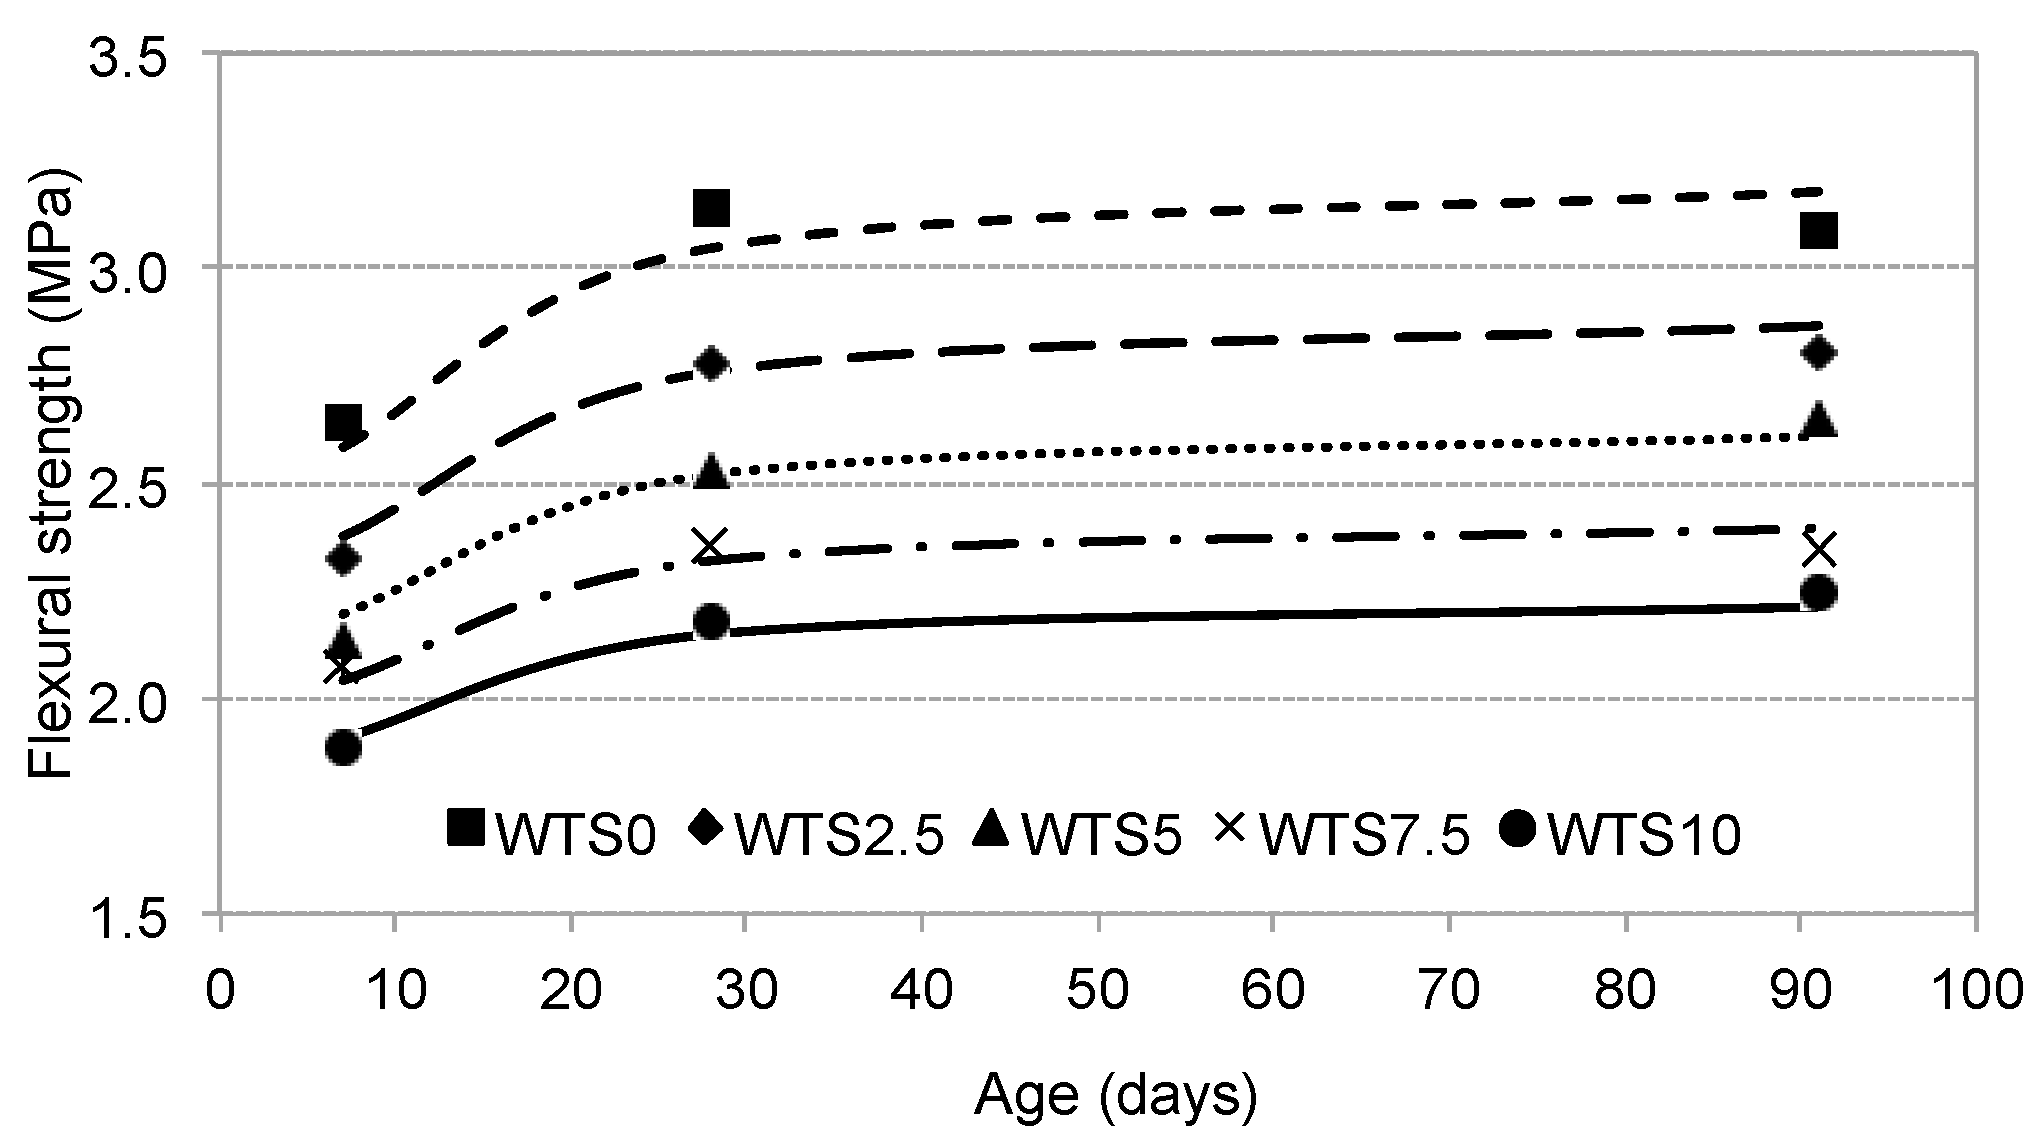
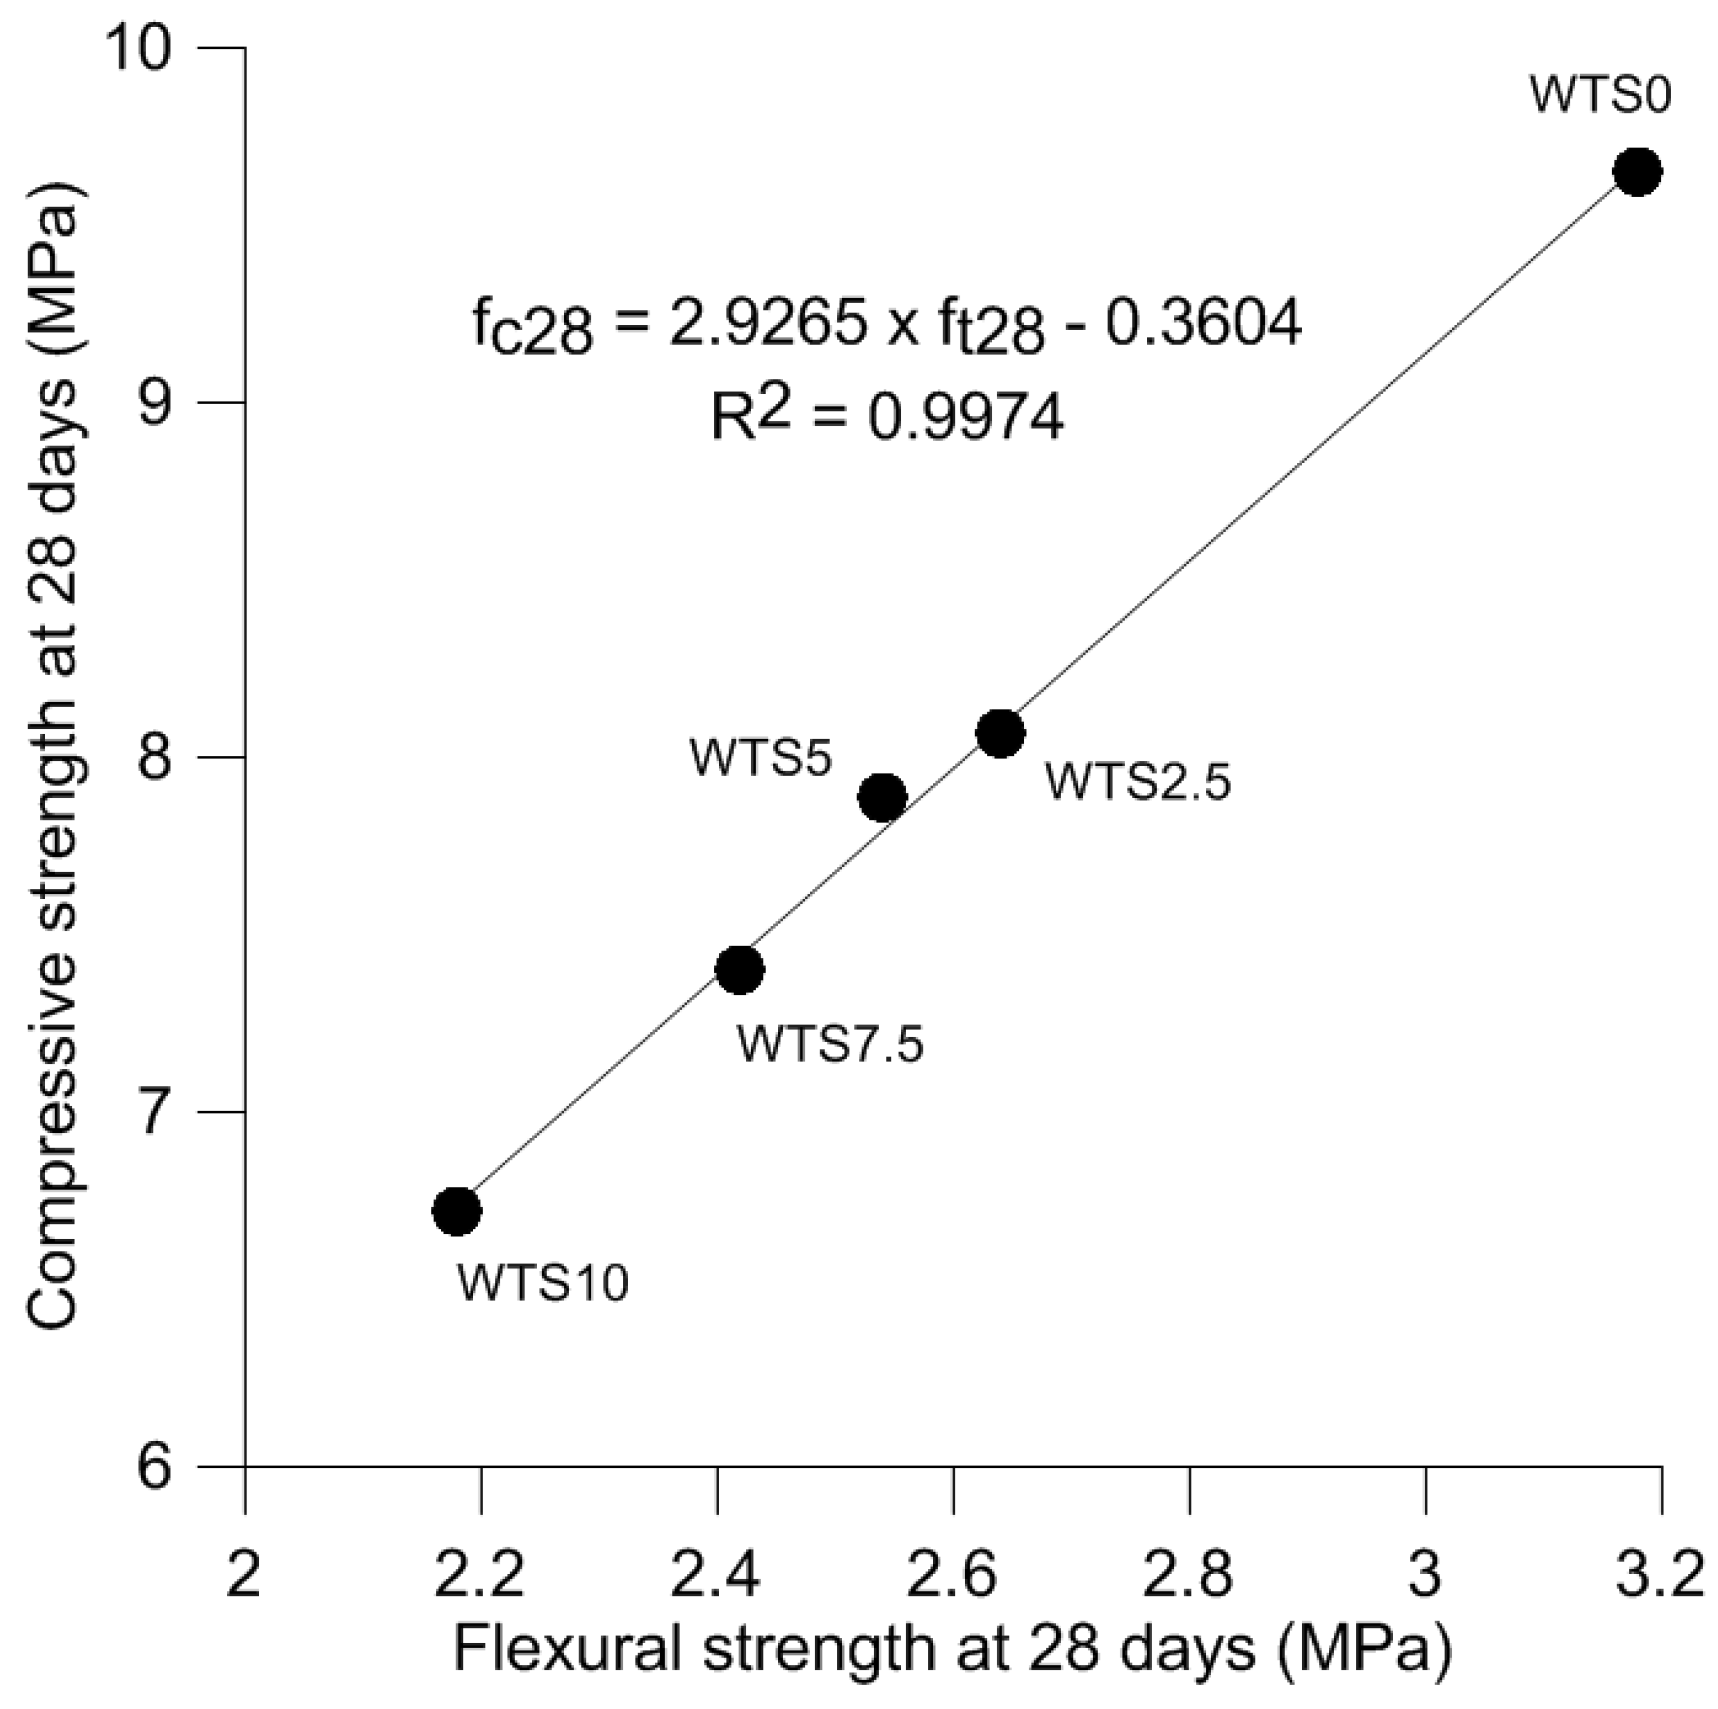
3.2. Mechanical Properties

The results regarding the bond strength can be observed in Figure 6, presenting the mean and standard deviation values for five measurements for each mortar type. It is observed that, with the increase of WTS content in mortars, the bond strength presents a slight increase in standard deviation. According to Brazilian regulations [29], the minimum bonding strength required for indoor conditions is equal to 0.2 MPa at 28 days. The best results were observed in mortars with 2.5% of WTS, which obtained the highest bond strength values.
Similar behavior was observed when comparing the results of mortars with WTS aggregate with mortars with the replacement of sand by construction and demolition waste (CDW) [35]. The paste penetrations into void aggregates results in many microstructural anchors, along with the adequate size distribution of the WTS particles, increasing the bond strength for mortars with some replacement levels.
Despite the satisfactory results found for bond strength of mortars with 2.5% and 5% of WTS, it was verified that there was a significant variability in the results. This occurs due to a few reasons, such as the type of pullout equipment, depth of the core drilling, load rate, heterogeneity of substrate and type of adhesive used [44]. Flores-Colen et al. [45] found variation coefficients between 32% and 104% from in situ measurements, close to the results obtained by Ramos et al. [44] (between 40 and 100%). Besides, some researchers showed that the decrease in average bond strength could be related to some parameters, like the nature of the substrate, mineral constituents of the WTS, and placement procedures, among others [32,46,47].
The influence of WTS content in compressive strength (fc) behavior in time is shown in Figure 7, whose mortars with WTS were smaller than the reference ones.
The presence of calcined WTS as a replacement for natural sand increases the w/c ratio (Figure 8) owing to the higher water absorption of WTS compared with NA, as the WTS was used in dry condition. The increased water demand may have contributed to reducing the compressive strength.
The results obtained from the regression model related to the flexural strength are presented in Figure 9. It can be observed that the WTS replacement is more evident for the higher w/c ratio.
In mortars with WTS, a decrease of flexural strength, whose behavior was similar to compressive strength results (Figure 6), was observed. In a general way, the use of solid wastes tends to minimize all the mechanical properties of composites, mainly due to their high absorption and porosity. In this particular case, higher w/c ratios for higher WTS concentrations may have had a significant impact on the mechanical strength, since the higher the content of sludge used, the greater the demand for water for the same mixture workability (see Table 4). Besides, during the calcination process, the carbonate decomposition leads to an increase in a large volume of pores. At this point, an observation must be made: in concretes or mortars where WTS is used in cement replacement, the results were very satisfactory, with an increase in resistances mainly due to the pozzolanic characteristics and fineness obtained in the calcination and milling processes. However, for WTS used as fine aggregate, these effects are negligible, and the properties are governed by their physical–mechanical properties.
Figure 10 presents the relationship between the mechanical properties of mortars and the replacement of natural sand by WTS.
For compressive strength, the decrease is more pronounced in the early days, mainly due to the effect of the continuous hydration process in the matrix. Note that there is a difference of slope between 28 and 91 days straight lines, in the function of the WTS replacement level. This fact may be associated with a small reactivity potential of the calcined sludge. Further studies should be conducted to verifying this reactive capability. However, considering the flexural strength, it is possible to verify that all mortars presented a behavior quite similar at 28 and 91 days for all WTS amounts investigated. The relationship between the compressive and flexural strength of mortars at 28 days shows good linear agreement (Figure 11), and the flexural strength of mortars with WTS corresponds to 32% of the compressive strength value.

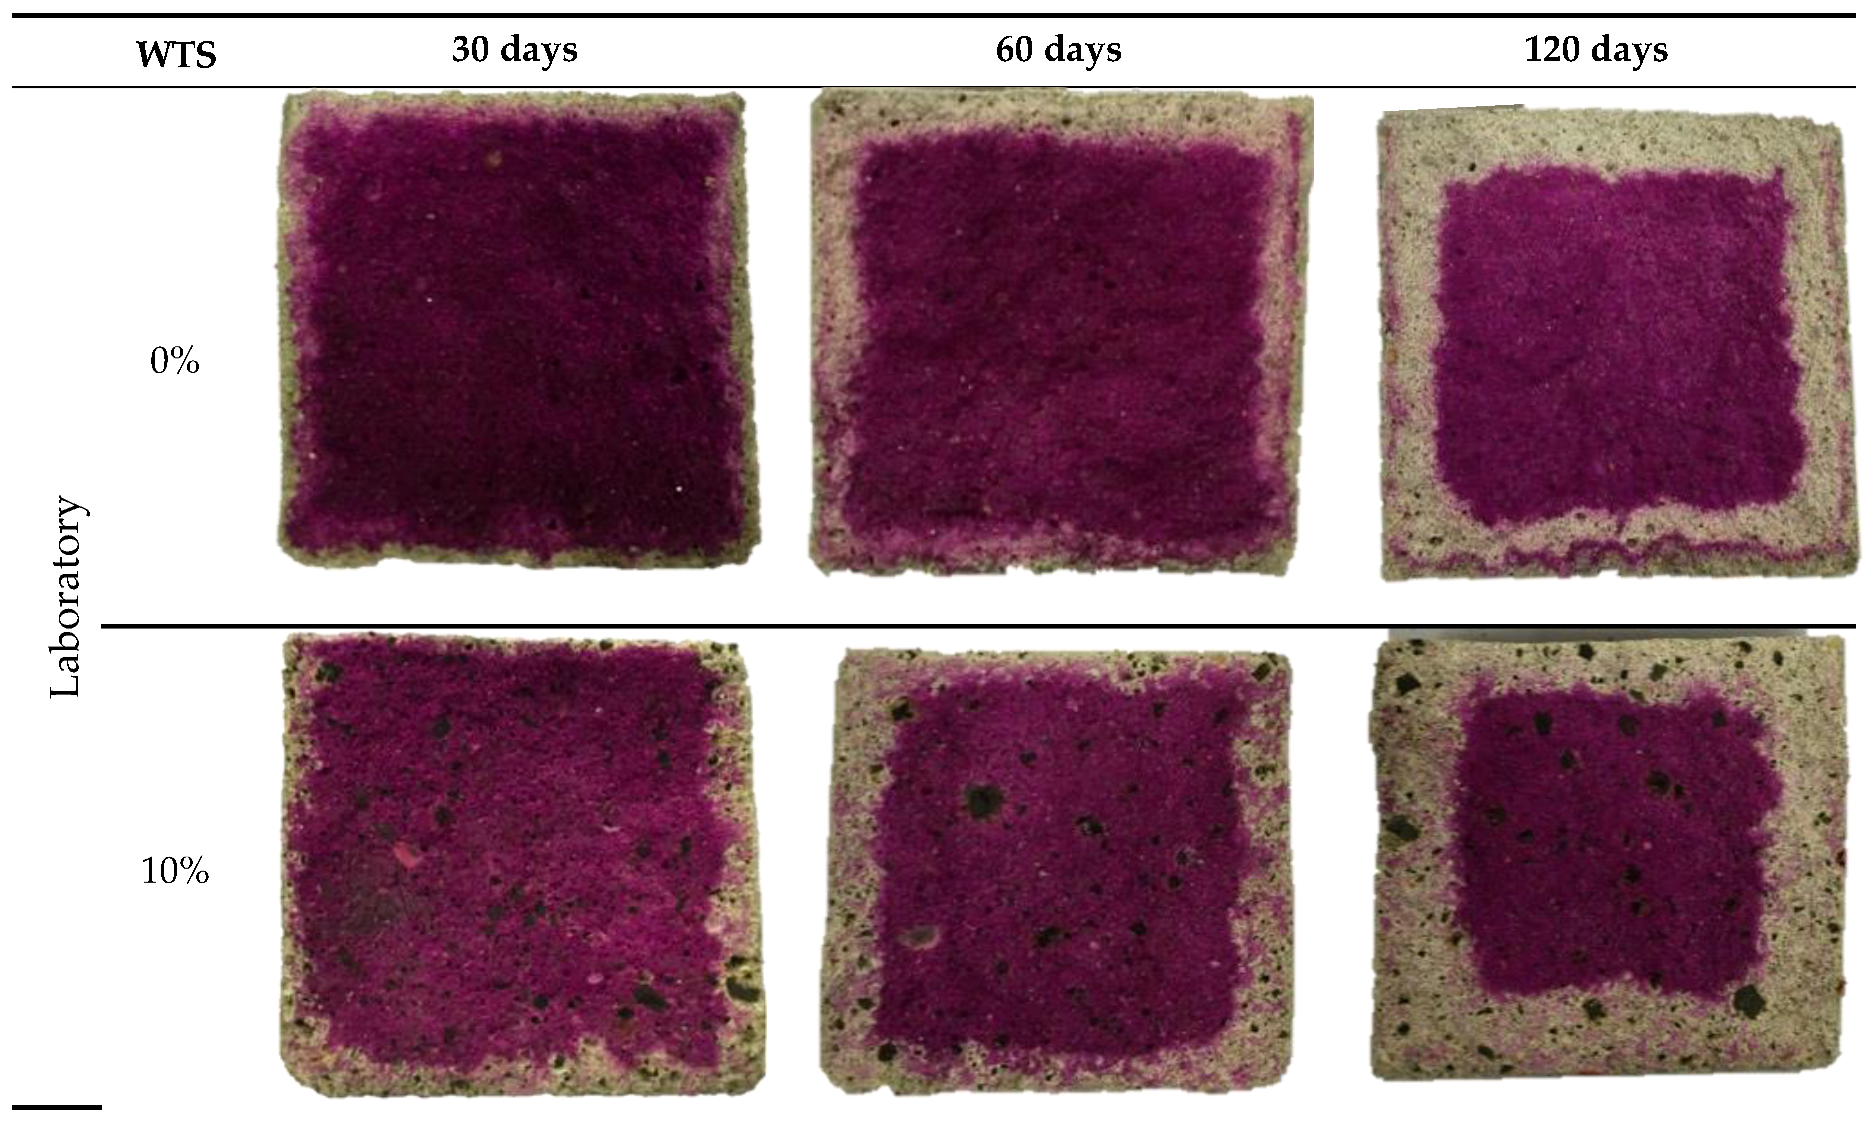
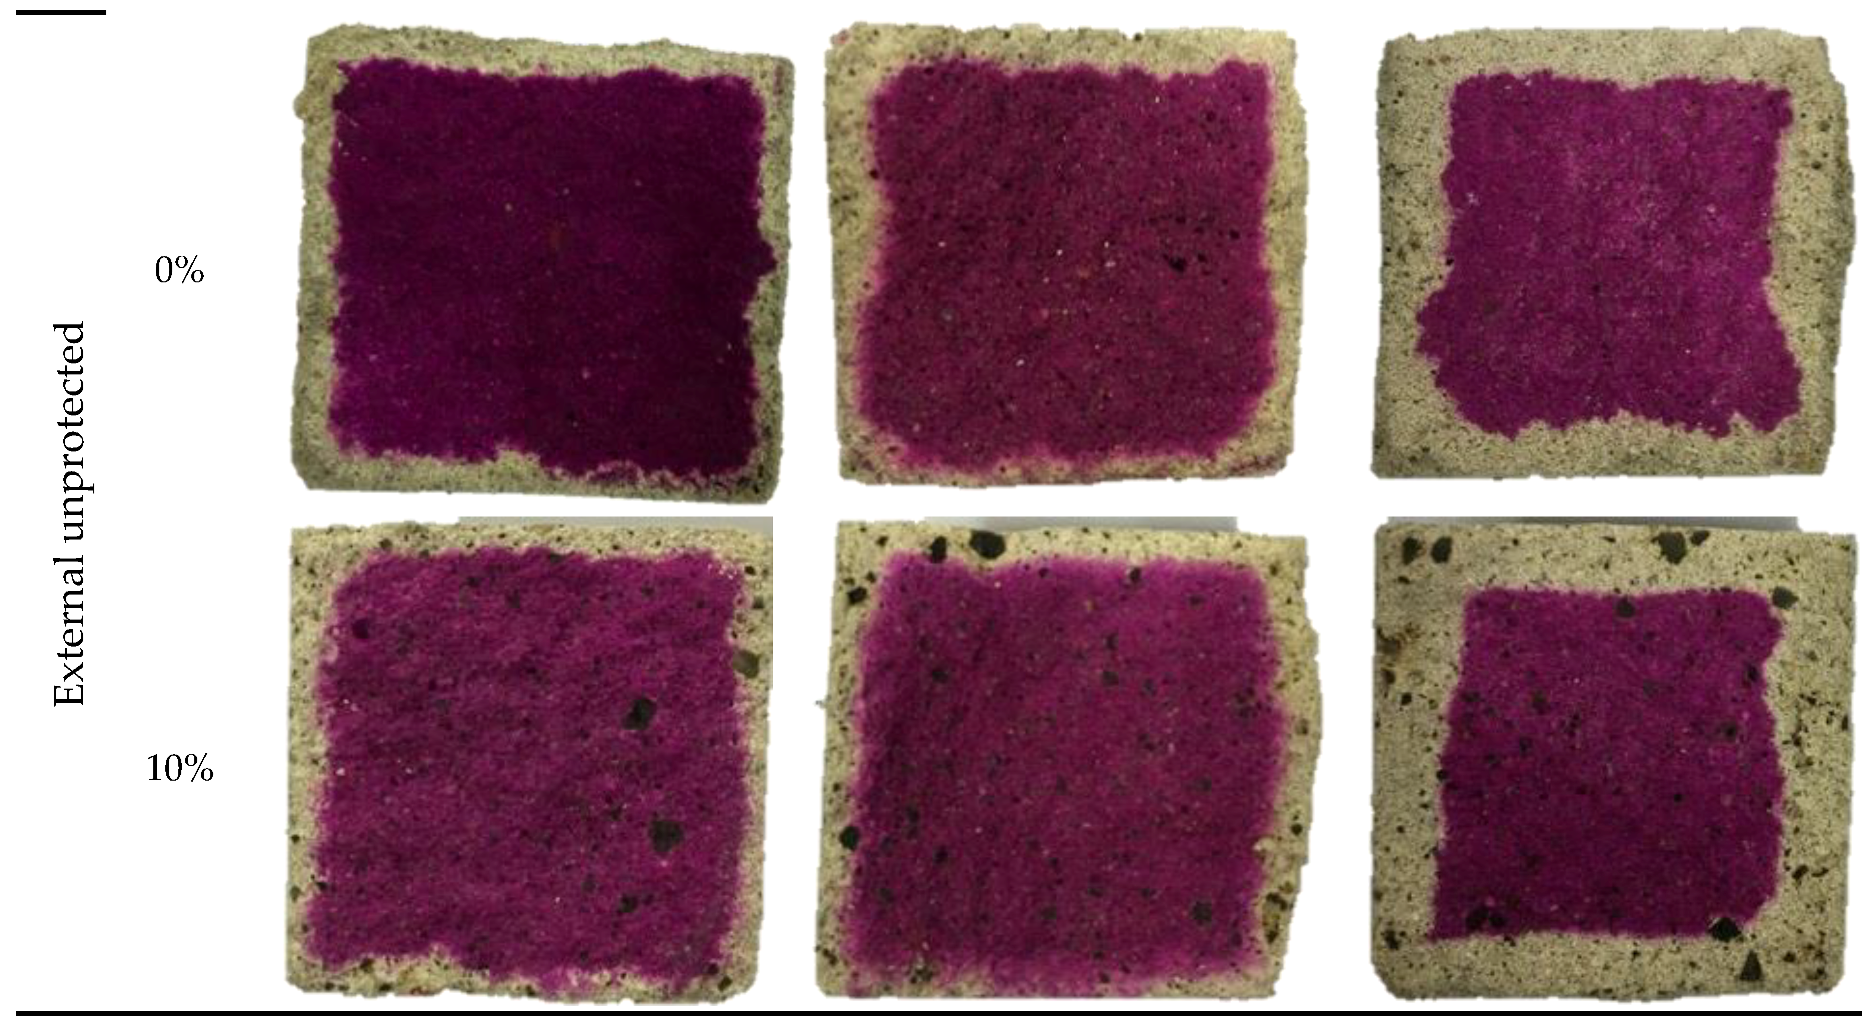
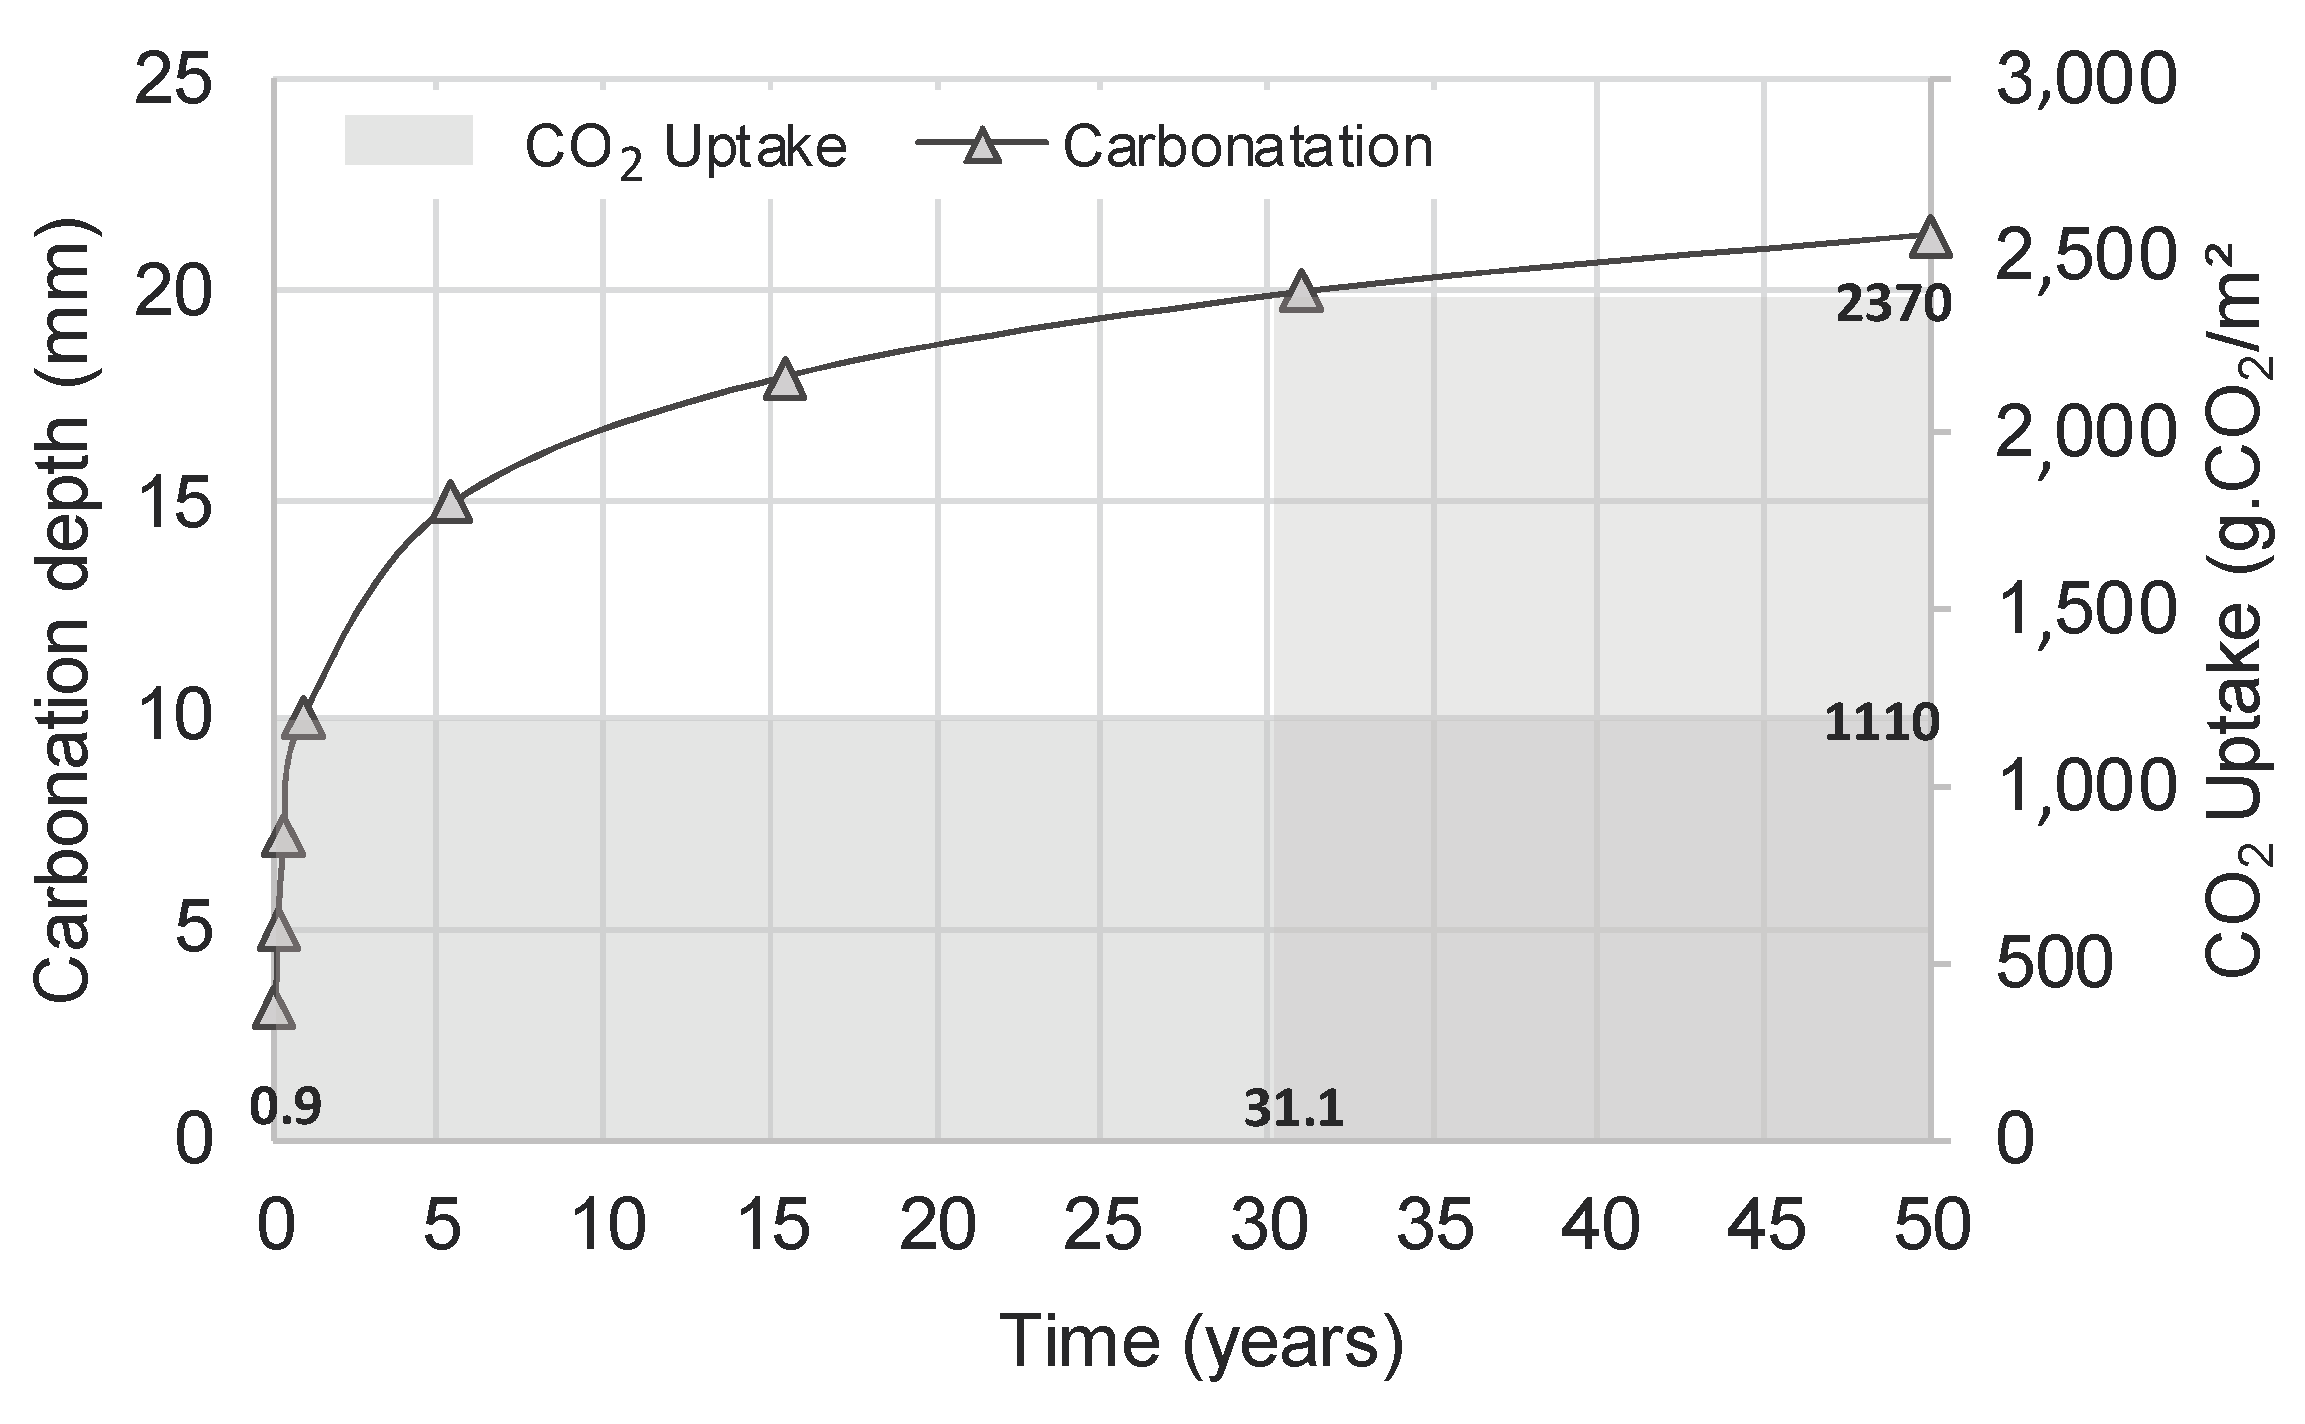
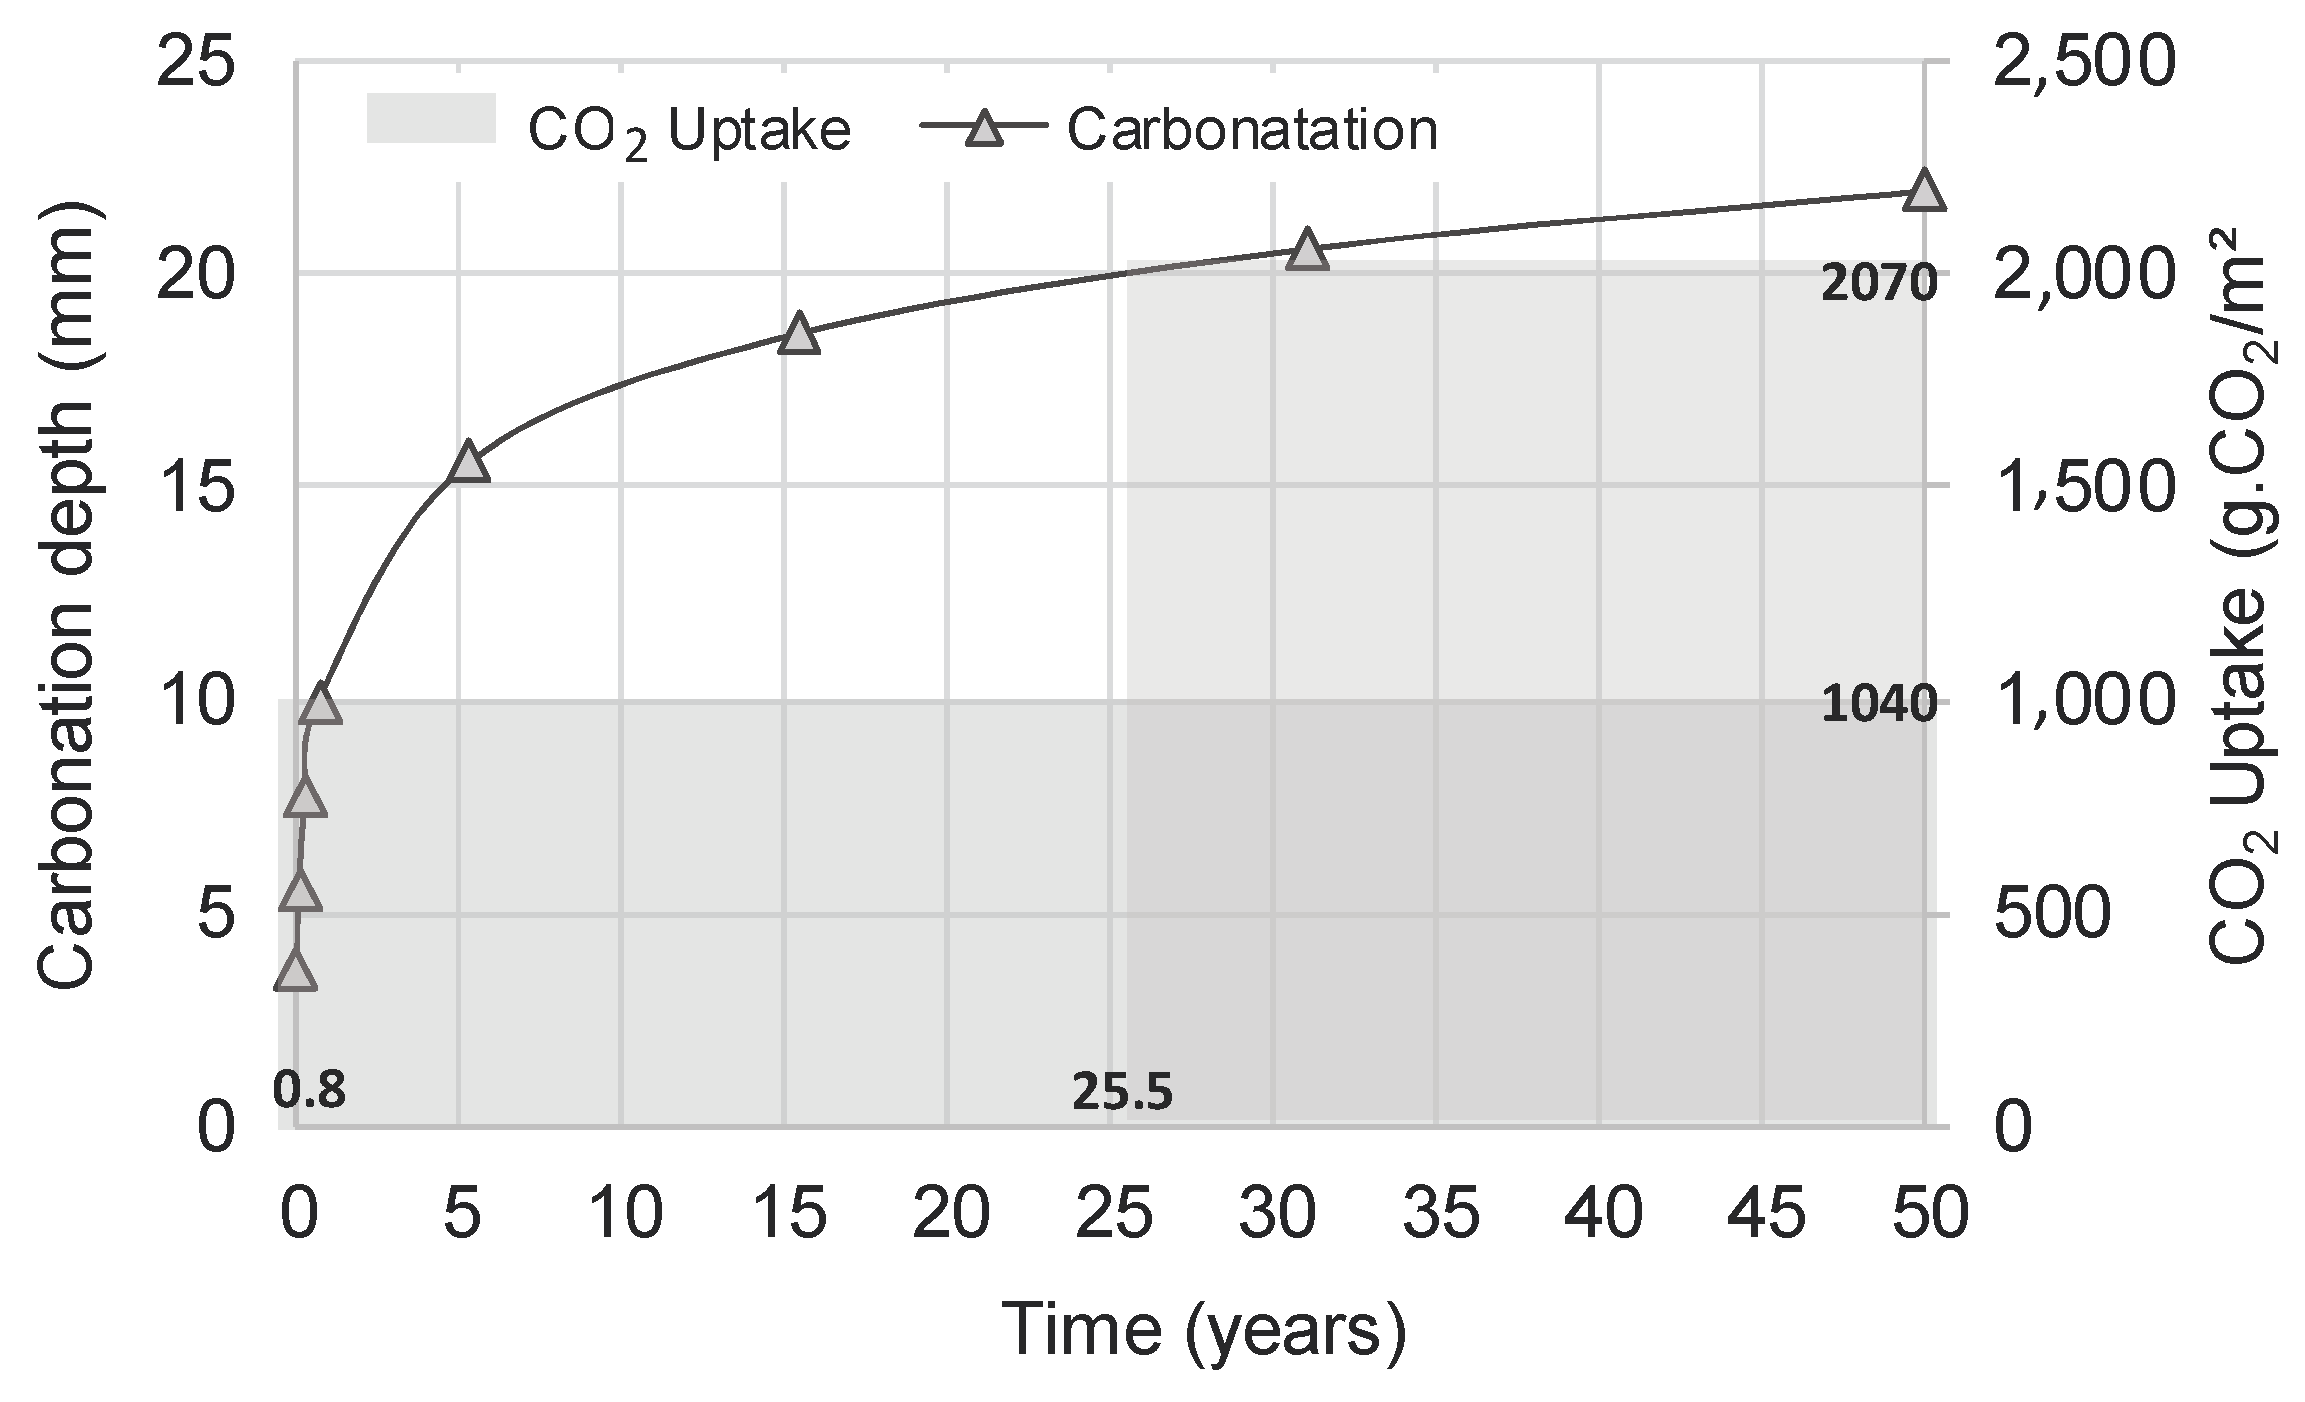
3.3. Natural Carbonation

The evaluation of carbonation depth presents an influence of all factors investigated (WTS content, age, and exposure condition), as presented in Figure 12. The carbonation depth increases in proportion to the replacement ratio (Figure 13) for all exposure environments, where each point represents a mean carbonation depth considering three individual values for a sample at different ages, as explained in Section 2.3. It can be shown that mortars with 10% of WTS present a carbonation depth 14% higher than the reference mortar, which can be related mainly to the synergic effect of the highest w/c ratios for mortars with WTS and the porosity of WTS itself.
The samples exposed in laboratory presented carbonation depths higher than mortars inserted in natural environment protected from rain. The smallest carbonation was verified in mortars exposed to rain. The same result was observed by Leemann et al. [48] and Andrade et al. [32]. In laboratory (indoor conditions), the amount of CO2 normally is higher than the environment. Besides, the amount of water present in capillary voids remains approximately constant in time, differently than in outdoor exposure conditions, where both humidity and CO2 content vary significantly, affecting the internal moisture conditions that influence the carbonation process. For a real structure, Possan et al. [21] analyzed the internal moisture effect on the carbonation concrete, where the carbonation depth increases with the decrease of internal condition moisture, whose highest amount of carbonation was found in concrete with internal moisture around 75%.

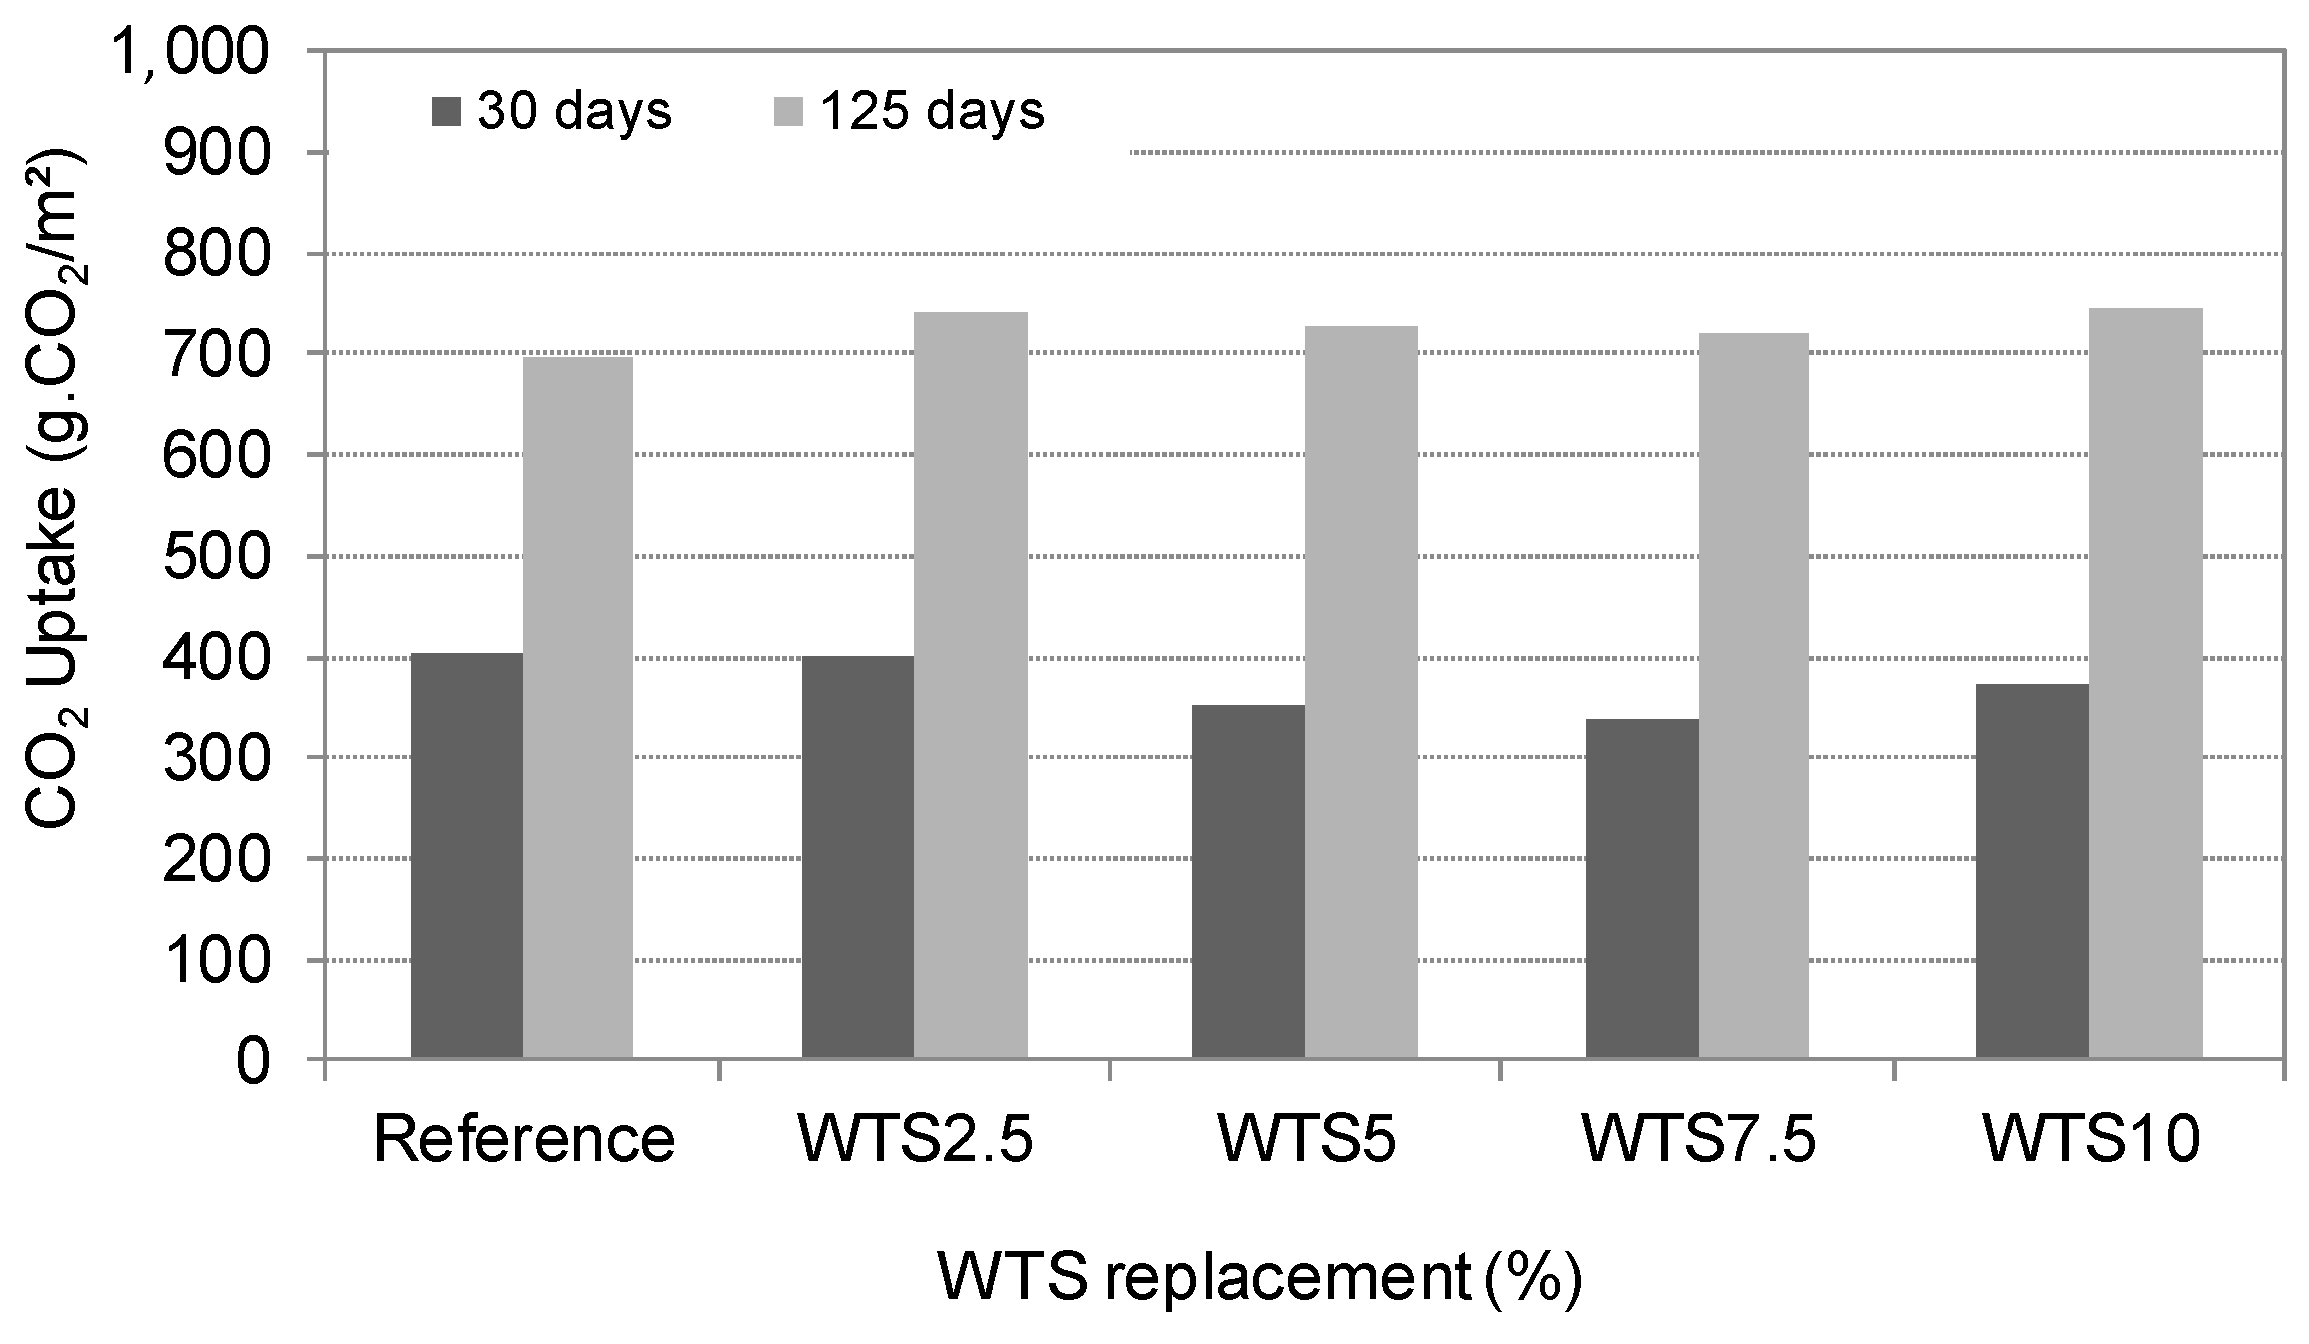
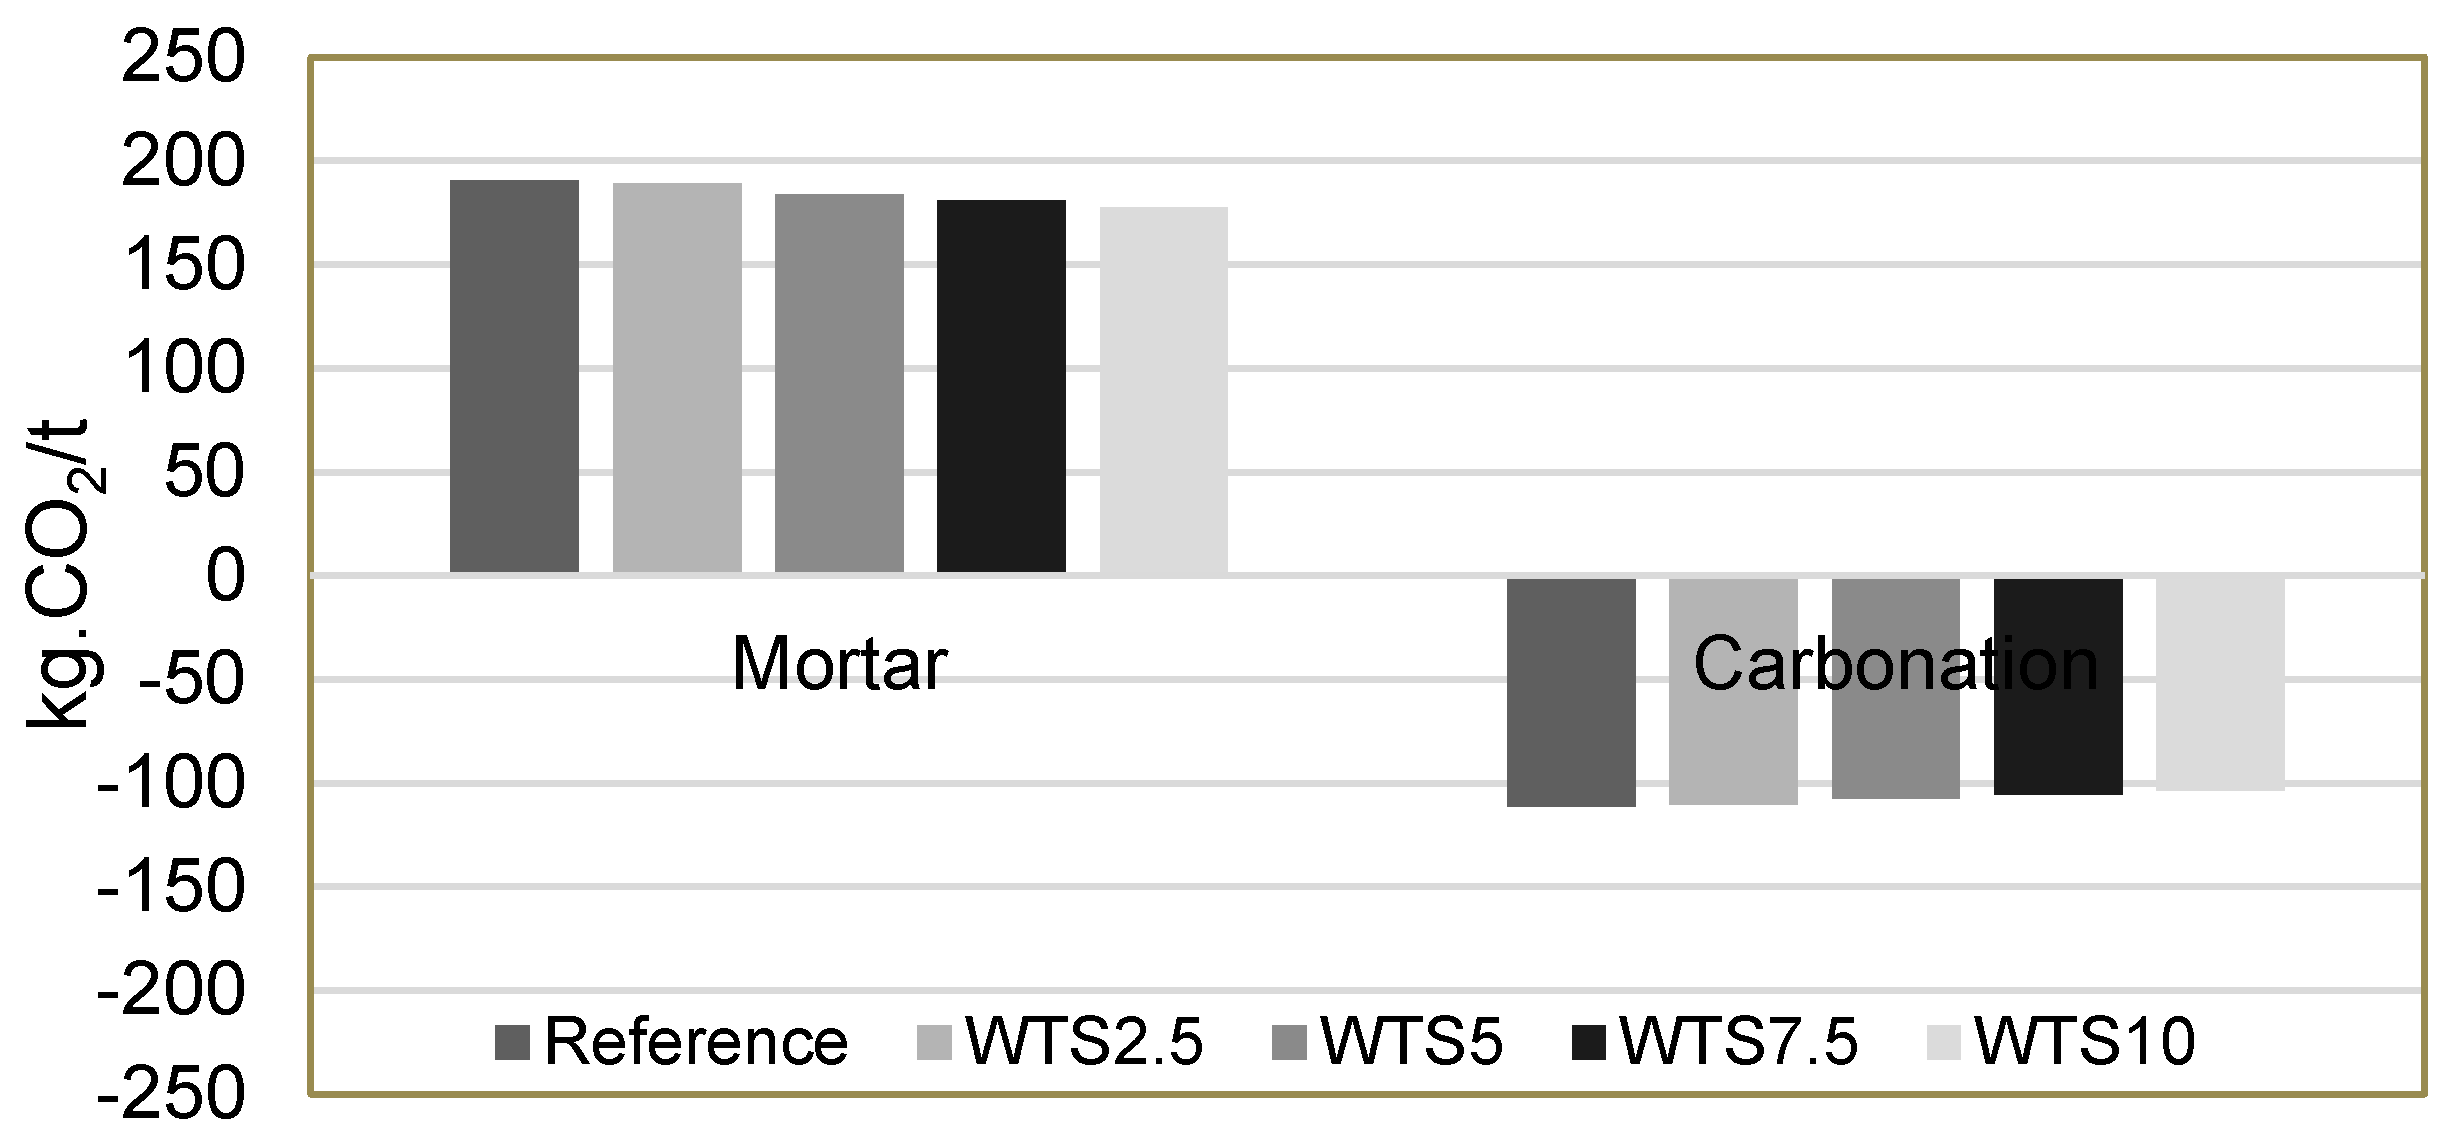
3.4. CO2 Uptake due to Mortar Carbonation

The CO2 uptake due to the mortar carbonation is presented in Figure 14 and Figure 15. The increment in the WTS increases the CO2 uptake for both exposure environments (external unprotected from rain environment and in the laboratory). Taking into account the depth of carbonation measured experimentally (item 3.3), after 125 days of CO2 exposure in laboratory conditions, the reference mortar absorbed 0.74 kg CO2/m2 and mortar with 10% WTS absorbed 0.88 kg CO2/m2. The average error was 0.109 to 0.117 g CO2/m2, considering the maximum and minimum content of clinker in the cement used.
The result was expected, as the exposure environment affects the diffusion of CO2 into the mortar and, consequently, the advance of the carbonation front in cementitious materials in general, as reported by Ekolu [49]. Possan et al. [21] also confirmed the influence of moisture content in the exposure environment on concrete carbonation. In a field study, the authors verified that, for moisture contents above 80%, the carbonation rate is drastically reduced, being null for humidity above 90%.
According to the Brazilian standard NBR 13749 [50], indoor and outdoor coatings may take thicknesses of 5–10 and 15–20 mm. Based on this, the limit of the standard for coating thickness is observed, and it is noted in Figure 16 that during the service life (50 years), the coating is fully carbonated (20 mm), and can capture more than 2300 g CO2/m2. Coating thicknesses of the order of 10 mm may be fully carbonated before 1 year of CO2 exposure, and can take up to 1110 g CO2/m2, and the thicknesses of the order of 20 mm require approximately 31 years to be completely carbonated. For mortars with 10% of WTS (Figure 17), which have a higher rate of carbonation and consumption of cement somewhat smaller than the reference, it is observed that the carbonation depth for thicknesses of 10 and 20 mm is reached after 0.8 years and 25.1 years, and CO2 uptake is also lower. Equation (11) was used to estimate carbonation over time. For both cases, the coating protection effect is not considered.
It can be observed that the CO2 uptake is influenced by the type and amount of cement of the mortars, as this depends on the CaO content available in the cement matrix. Considering the emission data for the Brazilian cement used (which has 95% clinker), note that most of the emissions (91%) come from cement manufacturing (Figure 18). Based on the materials used, it is observed (Figure 19) that, during the service life, the mortars studied can capture from 104 to 111 g CO2/kg, with the mortars with WTS having the smaller uptake. However, as the mortars produced with WTS have lower cement consumption in production, in the CO2 balance analysis (Equation (3)), these mortars have a performance equal to the reference mortar, which can capture approximately 60% of the emissions associated with their production.
Xi et al. [31] reported that, during service life, mortars can absorb 97.9% of the initial CO2 emissions. Furcas et al. [51] indicate that mortars can absorb up to 26.4 g CO2/kg. Previous research carried out by Andrade et al. [32] verified that the highest potential of CO2 uptake for mortars with several levels of natural aggregate was by CDW, which can capture the equivalent to 60 kg CO2/m3, depending on the chemical composition. The different results observed in the studies mentioned above are due to different aspects, as many factors have an influence on both carbonation and CO2 uptake estimates due to mortar carbonation over time.
The consumption and cement chemical composition, mix proportion, and exposure environment, among other factors, influence the carbonation of mortars. The CO2 uptake estimates are influenced by the methodologies used in each study, as there is no standardized procedure for its determination. Xuan et al. [52] and Kaliyavaradhan and Ling [19] highlight that particle size of recycled aggregate influence CO2 uptake and carbonation rate, whose carbonation rate was smaller for the highest particle size aggregates [19].
The establishment of methodologies to study emissions and CO2 uptake of cementitious materials, especially for mortars, is required to confirm its use as a compensatory measure in inventory emissions.

3.5. Modeling

Based on the experimental data, models were developed for compressive strength (fc in MPa), flexural strength (ffl in MPa), absorption by immersion (A in %), porosity (P in %), bulk density (D, in kg/dm3) and carbonation depth (ec in mm), as presented in Equations (6) to (11).
f c = 10 0.2890 × WTS 18.3643 × 1 A g e + 0.001 × W T S × A g e R 2   =   0.885
f f l = 1 ( 0.3086 + 0.0137 × W T S + 0.5648 × 1 A g e ) R 2   =   0.91
A = 1 ( 0.069373 0.001928 × W T S ) R 2   =   0.896
P = 25.10112 + 0.85816 × WTS R 2   =   0.954
D = 1 ( 0.305749 + 0.013243 × W T S 0.5 ) 0.5 R 2   =   0.859
e c = 7.3312 + 1.38426 × 1 e n v i r o n m e n t + 0.06045 × W T S + 2.85297 × ln ( A g e ) R 2   =   0.823
where WTS = WTS content (%) and Age = age of the mortar (days).
It must be observed that the R2 values are acceptable, explaining at least 82% of the variability for the properties analyzed. It should be pointed out that the carbonation model presents a R2 value that is very representative, considering mainly all environmental and microstructural scenarios analyzed. Table 6 presents the ANOVA of models developed, showing that all present statistical significance.

4. Conclusions

The main purpose of this investigation was to verify the effect of WTS on the physical–mechanical properties and carbonation depth of rendering mortars considering a holistic point of view, whose important conclusions are presented below:
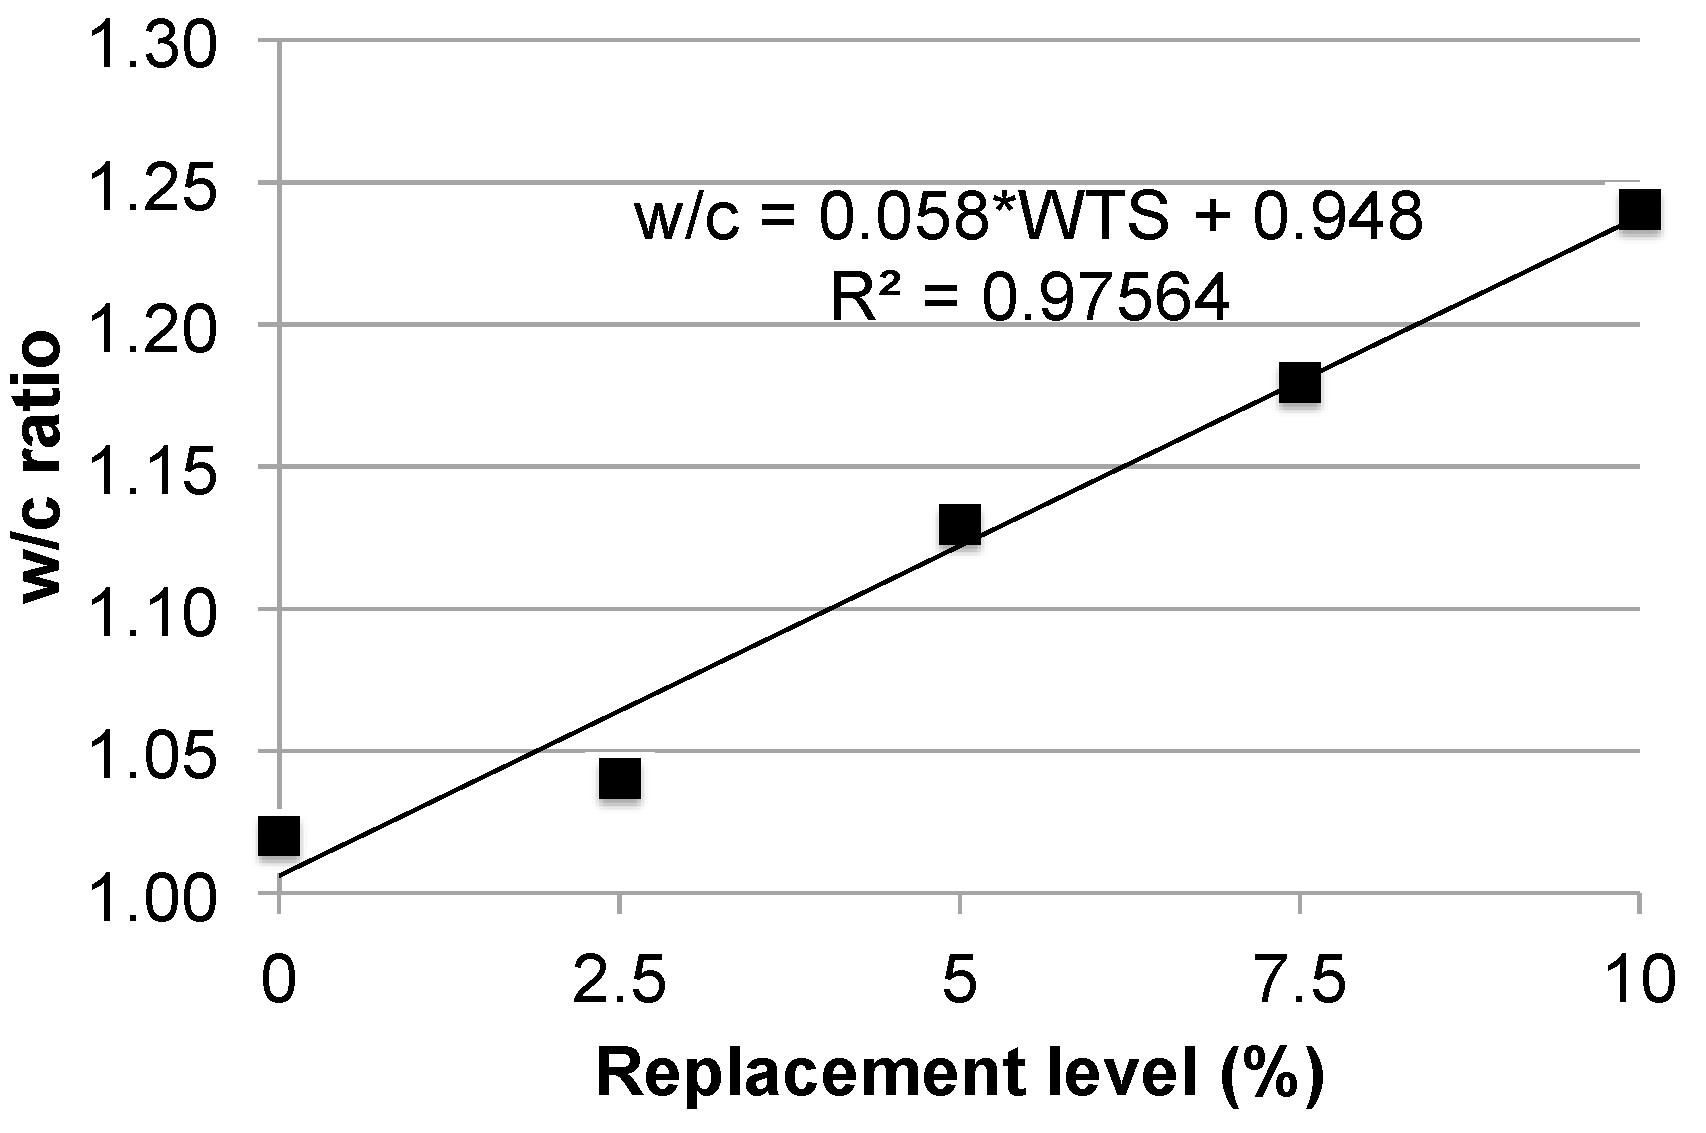
  • The higher the w/c ratio, it leads to a decrease in bulk density and increase of water absorption.
  • The presence of WTS decreases slightly all-mechanical properties, related to reference mortars. Considering the bond strength, it was found that mortars with 2.5% and 5% of WTS presented mean values similar to the Brazilian standards.
  • The increase of WTS replacement presents a significant influence in CO2 ingress, where the WTS may be a nucleation point for the carbonation process. The carbonation process in mortars is advantageous due to CaCO3 precipitation in pore voids, being advantageous in a sustainability point of view.
  • Mortars with WTS have a lower potency of CO2 uptake; however, owing to the lower cement consumption, the performance in the emissions balance is the same as the reference. Mortars with and without WTS can capture approximately 60% of the CO2 emissions associated with their production owing to carbonation over time, capturing up to 111 kg CO2/t during their service life.
  • Further studies should be conducted to propose methodologies for estimating mortar emissions and CO2 uptake to confirm their use as a compensatory measure in building inventory emissions to improve sustainability indicators.
  • The use of calcined WTS as a replacement for Portland cement may also be an alternative to its recycling.

Author Contributions

Conceptualization, J.J.d.O.A.; E.P.; Methodology, J.J.d.O.A., M.C.W. and E.P.; Investigation, J.J.O.A, M.C.W. and S.R.d.S.; Writing-Original Draft Preparation, J.J.O.A, E.P., M.C.W. and S.R.d.S.; Writing-Review & Editing, J.J.O.A and E.P.; Supervision, J.J.d.O.A. end E.P.; Project Administration, J.J.d.O.A.

Funding

The financial support provided by the Research Foundation of the State of Rio Grande do Sul (FAPERGS) and Brazilian National Council of Technological and Scientific Development (CNPq—457309/2014–8) was important for the success of the investigation.

Acknowledgments

The authors would like to thank L. Alexandre from CORSAN. Special thanks to undergraduate students G. Rocha, D. Buselatto, R. Pavoux (from ENISE), and E. Cruz, D. Rodeghiero (from PUCRS), and J. Webber (from UFRGS).

Conflicts of Interest

The authors declare no conflict of interest. The funders had no role in the design of the study; in the collection, analyses, or interpretation of data; in the writing of the manuscript, or in the decision to publish the results.

References

  1. Ahmad, T.; Ahmad, K.; Alam, M. Sludge quantification at water treatment plant and its management scenario. Environ. Monit. Assess. 2017, 189, 453. [Google Scholar] [CrossRef] [PubMed]
  2. Ramirez, K.G.; Possan, E.; Dezen, B.G.; Colombo, M. Potential uses of waste sludge in concrete production. Manag. Environ. Qual. 2017, 28, 155–161. [Google Scholar] [CrossRef]
  3. Ahmad, T.; Ahmad, K.; Alam, M. Characterization of water treatment plant’s sludge and its safe disposal options. Proc. Environ. Sci. 2016, 35, 950–955. [Google Scholar] [CrossRef]
  4. Donatello, S.; Cheeseman, C.R. Recycling and recovery routes for incinerated sewage sludge ash (ISSA): A review. Waste Manag. 2013, 33, 2328–2340. [Google Scholar] [CrossRef] [PubMed]
  5. Sales, A.; Souza, F.R. Concretes and mortars recycled with water treatment sludge and construction and demolition rubble. Constr. Build. Mater. 2009, 23, 2362–2370. [Google Scholar] [CrossRef]
  6. Gastaldini, A.L.G.; Hengen, M.F.; Gastaldini, M.C.C.; Amaral, F.D.D.; Antolini, M.B.; Coletto, T. The use of water treatment plant sludge ash as a mineral addition. Constr. Build. Mater. 2015, 94, 513–520. [Google Scholar] [CrossRef]
  7. ABNT. Resíduos Sólidos—Classificação; Associação Brasileira de Normas Técnicas: Rio de Janeiro, RJ, Brazil, 2004; Volume: NBR 10004, p. 71. [Google Scholar]
  8. Yen, C.-L.; Tseng, D.-H.; Lin, T.-T. Characterization of eco-cement paste produced from waste sludges. Chemosphere 2011, 84, 220–226. [Google Scholar] [CrossRef]
  9. Merino, I.; Arévalo, L.F.; Romero, F. Characterization and possible uses of ashes from wastewater treatment plants. Waste Manag. 2005, 25, 1046–1054. [Google Scholar] [CrossRef]
  10. Martínez-García, C.; Eliche-Quesada, D.; Pérez-Villarejo, L.; Iglesias-Godino, F.J.; Corpas-Iglesias, F.A. Sludge valorization from wastewater treatment plant to its application on the ceramic industry. J. Environ. Manag. 2012, 95, S343–S348. [Google Scholar] [CrossRef]
  11. Caniani, D.; Masi, S.; Mancini, I.M.; Trulli, E. Innovative reuse of drinking water sludge in geo-environmental applications. Waste Manag. 2013, 33, 1461–1468. [Google Scholar] [CrossRef]
  12. Huang, C.-H.; Wang, S.-Y. Application of water treatment sludge in the manufacturing of lightweight aggregate. Construct. Build. Mater. 2013, 43, 174–183. [Google Scholar] [CrossRef]
  13. Yagüe, A.; Valls, S.; Vázquez, E.; Albareda, F. Durability of concrete with addition of dry sludge from waste water treatment plants. Cem. Concr. Res. 2005, 35, 1064–1073. [Google Scholar] [CrossRef]
  14. Buselatto, D.M.; Wenzel, M.C.; Rocha, G.H.; Webber, J.; Silva, S.R.; Andrade, J.J.O. Use of water treatment sludge (WTS) as fine aggregate in concretes: evaluation of physical-mechanical properties. Matéria 2019, 24. paper e-12270 (In portuguese) [Google Scholar] [CrossRef]
  15. Rodríguez, N.H.; Ramírez, S.M.; Varela, M.T.B.; Guillem, M.; Puig, J.; Larrotcha, E.; Flores, J. Re-use of drinking water treatment plant (DWTP) sludge: Characterization and technological behaviour of cement mortars with atomized sludge additions. Cem. Concr. Res. 2010, 40, 778–786. [Google Scholar] [CrossRef]
  16. Zamora, R.M.R.; Alfaro, O.C.; Cabirol, N.; Ayala, F.E.; Moreno, A.D. Valorization of drinking water treatment sludges as raw materials to produce concrete and mortar. Am. J. Environ. Sci. 2008, 4, 223–228. [Google Scholar] [CrossRef]
  17. Cuéllar-Franca, R.M.; Azapagic, A. Carbon capture, storage and utilisation technologies: A critical analysis and comparison of their life cycle environmental impacts. J. CO2 Util. 2015, 9, 82–102. [Google Scholar] [CrossRef]
  18. Pade, C.; Guimaraes, M. The CO2 uptake of concrete in a 100 year perspective. Cem. Concr. Res. 2007, 37, 1348–1356. [Google Scholar] [CrossRef]
  19. Kaliyavaradhan, S.K.; Ling, T.-C. Potential of CO2 sequestration through construction and demolition (C&D) waste—An overview. J. CO2 Util. 2017, 20, 234–242. [Google Scholar] [CrossRef]
  20. Andrade, C.; Sanjuán, Á.M. Updating carbon storage capacity of spanish cements. Sustainability 2018, 10, 4806. [Google Scholar] [CrossRef]
  21. Possan, E.; Thomaz, W.A.; Aleandri, G.A.; Felix, E.F.; dos Santos, A.C.P. CO2 uptake potential due to concrete carbonation: A case study. Case Stud. Construct. Mater. 2017, 6, 147–161. [Google Scholar] [CrossRef]
  22. Bashar, N.A.M.; Zubir, Z.H.; Ayob, A.; Alias, S. Water treatment sludge as an alternative liner for landfill site: FTIR and XRD analysis. In AIP Conference Proceedings; AIP Publishing: Melville, NY, USA, 2016. [Google Scholar]
  23. Hwang, C.-L.; Chiang, C.-H.; Huynh, T.-P.; Vo, D.-H.; Jhang, B.-J.; Ngo, S.-H. Properties of alkali-activated controlled low-strength material produced with waste water treatment sludge, fly ash, and slag. Construct. Build. Mater. 2017, 135, 459–471. [Google Scholar] [CrossRef]
  24. Ramirez, K.G.; Possan, E.; Bittencourt, P.R.S.; Colombo, M.; Carneiro, C. Physico-chemical characterization of centrifuged sludge from Tamanduá water treatment plant (Foz do Iguaçu, PR). Revista Matéria 2018, 23. Paper e-12187. [Google Scholar] [CrossRef]
  25. ABNT. Argamassa Para Assentamento e Revestimento de Paredes e Tetos—Preparo da Mistura e Determinação do Índice de Consistência; Associação Brasileira de Normas Técnicas: Rio de Janeiro, RJ, Brazil, 2016; Volume: NBR 13276, p. 3p. [Google Scholar]
  26. ASTM. Standard Specification for Mortar Cement; ASTM C1329/C1329M; American Society for Testing and Materials: West Conshohocken, PA, USA, 2016. [Google Scholar]
  27. ABNT. Argamassa e Concreto Endurecidos—Determinação da Absorção de Água por capilaridade; NBR 9779; Associação Brasileira de Normas Técnicas: Rio de Janeiro, RJ, Brazil, 2012; p. 2. [Google Scholar]
  28. ABNT. Argamassa Para Assentamento e Revestimento de Paredes e Tetos—Determinação da Resistência à Tração na Flexão e à Compressão; NBR 13279; Associação Brasileira de Normas Técnicas: Rio de Janeiro, RJ, Brazil, 2005; p. 9. [Google Scholar]
  29. ABNT. Revestimento de Paredes e Tetos de Argamassas Inorgânicas—Determinação da Resistência de Aderência à Tração; NBR 13528; Associação Brasileira de Normas Técnicas: Rio de Janeiro, RJ, Brazil, 2010; p. 11. [Google Scholar]
  30. RILEM. CPC-18 Measurement of hardened concrete carbonation depth. In Materials and Structures; Springer: Paris, France, 1988; pp. 453–455. [Google Scholar]
  31. Xi, F.; Davis, S.J.; Ciais, P.; Crawford-Brown, D.; Guan, D.; Pade, C.; Shi, T.; Syddall, M.; Lv, J.; Ji, L.; et al. Substantial global carbon uptake by cement carbonation. Nat. Geosci. 2016, 9, 880. [Google Scholar] [CrossRef]
  32. Andrade, J.J.O.; Possan, E.; Squiavon, J.Z.; Ortolan, T.L.P. Evaluation of mechanical properties and carbonation of mortars produced with construction and demolition waste. Construct. Build. Mater. 2018, 161, 70–83. [Google Scholar] [CrossRef]
  33. BRE Global Ltd. Product Category Rules for Type III Environmental Product Declaration of Construction Products; EN15804:2012+A1:2013. PN514; BRE Global Ltd.: St Albans, UK, 2014. [Google Scholar]
  34. Pommer, K.; Pade, C. Guidelines Uptake of Carbon Dioxide in the Life Cycle Inventory of Concrete; Danish Technological Institute: Taastrup, Denmark, 2006. [Google Scholar]
  35. IPCC. Guidelines for National Greenhouse Gas. Inventories; Intergovernmental Panel on Climate Change: Geneva, Switzerland, 2006. [Google Scholar]
  36. CSI. CO2 and Energy Accounting and Reporting Standard for the Cement Industry; World Business Council for Sustainable Development: Geneva, Switzerland, 2011. [Google Scholar]
  37. Lima, J.A.R. Avaliação das Consequências da Produção de Concreto no Brasil para as Mudanças Climáticas. Ph.D. Thesis, Universidade de São Paulo, São Paulo, SP, Brazil, January 2010. [Google Scholar]
  38. EPE. Balanço Energético Nacional 2017: Ano Base 2016; Empresa de Pesquisa Energética: Rio de Janeiro, RJ, Brazil, 2017. [Google Scholar]
  39. Lovato, P.S.; Possan, E.; Molin, D.C.C.D.; Masuero, Â.B.; Ribeiro, J.L.D. Modeling of mechanical properties and durability of recycled aggregate concretes. Construct. Build. Mater. 2012, 26, 437–447. [Google Scholar] [CrossRef]
  40. Silva, S.R.; Andrade, J.J.O. Investigation of mechanical properties and carbonation of concretes with construction and demolition waste and fly ash. Construct. Build. Mater. 2017, 153, 704–715. [Google Scholar] [CrossRef]
  41. Andrade, J.J.O.; Wenzel, M.C.; Rocha, G.H.; Silva, S.R. Performance of rendering mortars containing sludge from water treatment plants as fine recycled aggregate. J. Clean. Product. 2018, 192, 159–168. [Google Scholar] [CrossRef]
  42. Valls, S.; Yagüe, A.; Vázquez, E.; Mariscal, C. Physical and mechanical properties of concrete with added dry sludge from a sewage treatment plant. Cem. Concr. Res. 2004, 34, 2203–2208. [Google Scholar] [CrossRef]
  43. Cremades, L.V.; Cusidó, J.A.; Arteaga, F. Recycling of sludge from drinking water treatment as ceramic material for the manufacture of tiles. J. Clean. Product. 2018, 201, 1071–1080. [Google Scholar] [CrossRef]
  44. Ramos, N.M.M.; Simões, M.L.; Delgado, J.M.P.Q.; de Freitas, V.P. Reliability of the pull-off test for in situ evaluation of adhesion strength. Construct. Build. Mater. 2012, 31, 86–93. [Google Scholar] [CrossRef]
  45. Flores-Colen, I.; de Brito, J.; Branco, F. In situ adherence evaluation of coating materials. Exp. Tech. 2009, 33, 51–60. [Google Scholar] [CrossRef]
  46. Stolz, C.M.; Masuero, Â.B.; Pagnussat, D.T.; Kirchheim, A.P. Influence of substrate texture on the tensile and shear bond strength of rendering mortars. Construct. Build. Mater. 2016, 128, 298–307. [Google Scholar] [CrossRef]
  47. Neno, C.; Brito, J.; Veiga, R. Using fine recycled concrete aggregate for mortar production. Adv. Mater. Res. 2014, 17, 168–177. [Google Scholar] [CrossRef]
  48. Leemann, A.; Nygaard, P.; Kaufmann, J.; Loser, R. Relation between carbonation resistance, mix design and exposure of mortar and concrete. Cem. Concr. Compos. 2015, 62, 33–43. [Google Scholar] [CrossRef]
  49. Ekolu, S.O. A review on effects of curing, sheltering, and CO2 concentration upon natural carbonation of concrete. Construct. Build. Mater. 2016, 127, 306–320. [Google Scholar] [CrossRef]
  50. ABNT. Revestimento de Paredes e Tetos de Argamassas Inorgânicas—Especificação; NBR 13749; Associação Brasileira de Normas Técnicas: Rio de Janeiro, RJ, Brazil, 2013; p. 8. [Google Scholar]
  51. Furcas, C.; Balletto, G.; Naitza, S.; Mazzella, A. Evaluation of CO2 uptake under mild accelerated carbonation conditions in cement-based and lime-based mortars. Adv. Mater. Res. 2014, 980, 57–61. [Google Scholar] [CrossRef]
  52. Xuan, D.; Zhan, B.; Poon, C.S. Development of a new generation of eco-friendly concrete blocks by accelerated mineral carbonation. J. Clean. Product. 2016, 133, 1235–1241. [Google Scholar] [CrossRef]
Figure 1. SEM image of particle morphology of WTS (magnification: 1500×).
Sustainability 11 03576 g001
Figure 2. X-ray spectrometer (EDS) results with the SEM related to area shown in Figure 1.
Sustainability 11 03576 g002
Figure 3. X-ray diffraction (XRD) of aggregates.
Sustainability 11 03576 g003
Figure 4. Samples exposed in laboratory (a) and external protected (b) and unprotected (c) from rain.
Sustainability 11 03576 g004
Figure 5. Physical properties of the mortars investigated.
Sustainability 11 03576 g005
Figure 6. Bond strength for mortars at 28 days.
Sustainability 11 03576 g006
Figure 7. Behavior of compressive strength in mortars with calcined WTS.
Sustainability 11 03576 g007
Figure 8. w/c ratio versus calcined WTS content.
Sustainability 11 03576 g008
Figure 9. Flexural strength for mortars.
Sustainability 11 03576 g009
Figure 10. Effect of WTS in mechanical properties (fc = compressive strength; ft = splitting strength) for mortars at 28 and 91 days.
Sustainability 11 03576 g010
Figure 11. Relationship between mechanical properties for mortars at 28 days.
Sustainability 11 03576 g011
Figure 12. Carbonation evolution profile in mortars with WTS.
Sustainability 11 03576 g012aSustainability 11 03576 g012b
Figure 13. Carbonation depth versus time exposure for reference mortars and WTS10 under (a) external protected, (b) external unprotected, and (c) laboratory conditions.
Sustainability 11 03576 g013
Figure 14. CO2 uptake of mortars due to carbonation in the laboratory environment.
Sustainability 11 03576 g014
Figure 15. CO2 uptake of mortars due to carbonation in the external unprotected from rain environment.
Sustainability 11 03576 g015
Figure 16. Carbonation and CO2 uptake during the service life for reference mortars.
Sustainability 11 03576 g016
Figure 17. Carbonation and CO2 uptake during the service life for WTS10 mortars.
Sustainability 11 03576 g017
Figure 18. CO2 emissions and carbonation of rendering mortars with and without sludge waste.
Sustainability 11 03576 g018
Figure 19. Emissions balance considering the CO2 uptake due to mortar carbonation.
Sustainability 11 03576 g019
Table 1. Properties of fine aggregates used.
AggregateMaximum Size (mm)Fineness ModulusSpecific Gravity (kg/dm3)Bulk Density (kg/dm3)Water Absorption—24 h (%)
Water treatment sludge (WTS) aggregate2.382.482.160.735.65
Sand1.181.902.611.500.85
Table 2. Physical–chemical characteristics of water treatment sludge before calcination.
ParameterResultUnit
Volatile matter43.5%
Total suspended solids<2%
pH5.13
Density0.858g/cm3
As0.006mg/L
Al102mg/L
Ba0.202mg/L
Cd<0.0006mg/L
F0.101mg/L
Hg0.0022mg/L
Ag<0.002mg/L
Cu<0.006mg/L
Zn0.039mg/L
Pb<0.004mg/L
Total Cr0.066mg/L
Table 3. X-ray fluorescence for WTS and cement.
MaterialSiO2Al2O3Fe2O3CaOMgOK2OTiO2SO3Na2OMnOLOI
(%)(%)(%)(%)(%)(%)(%)(%)(%)(%)(%)
WTS—in nature28.421.511.30.50.30.30.71.00.1<0.135.32
WTS—calcined40.528.59.50.30.40.41.00.70.10.118.23
Cement15.43.33.765.33.01.30.24.20.10.12.84
LOI, loss on ignition; WTS, water treatment sludge.
Table 4. Mortar mixture proportions used to produce 1 m3 of mortar.
MixtureProportioning
(Binder:NA:WTS)
NA WTS Aggregates (kg/m3)Cement (kg/m3)Consistency
Index (mm)
w/c
NAWTS
Reference1:5:0100015350307.02621.02
WTS2.51:4.875:0.12597.52.51456.237.3298.72601.04
WTS51:4.75:0.259551380.372.6290.62701.13
WTS7.51:4.625:0.37592.57.51308.9106.13283.02861.18
WTS101:4.5:0.5090101226.3136.2272.52691.24
NA—Natural Aggregate, in %; WTS—water treatment sludge, in %, C—binder consumption; w/c—water/cement ratio.
Table 5. CO2 emissions per ton of cement (in kg) [38].
Emissions/Year20072008200920102011201220132014
Energy use253.0246.0224.0210.0214.4210.3206.3206.1
Calcination372.0368.0363.0358.0364.8361.1361.1361.1
Transportation33.033.031.031.030.730.330.330.3
Total658.0647.0618.0598.0610.0602.0598.0597.0
Table 6. ANOVA for the models developed (confidence level: 95%).
ResponseSourceSum of SquaresDegree of FreedomMean SquareF Testp-Value
fcModel3810.9124.0952.7293015.9960.000000
Residual19.26961.00.430
Total3830.18565.0
fflModel209.6003.069.8665390.6500.000000
Residual0.401831.00.013
Total210.0034.0
AModel4374.5992.02187.2994024.2850.000000
Residual7.06613.00.544
Error
Total4381.66515.0
PModel13096.372.06548.18512994.320.000000
Residual6.5513.00.504
Total13102.9215.0
DModel4534.2012.022.6710177783.830.000000
Residual0.0037913.00.00029
Total45.3458015.0
ecModel14053.164.03513.2897740.1290.000000
Residual221.05487.00.454
Total14274.21491.0

