Article

Revealing Urban Morphology and Outdoor Comfort through Genetic Algorithm-Driven Urban Block Design in Dry and Hot Regions of China

1
School of Architecture, Southeast University, Nanjing 210018, China
2
China Overseas Property, Zhengzhou 450000, China
3
Lawrence Berkeley National Laboratory, Building Technology and Urban Systems Division, Berkeley, CA 94720, USA
*
Authors to whom correspondence should be addressed.
Sustainability 2019, 11(13), 3683; https://0-doi-org.brum.beds.ac.uk/10.3390/su11133683
Submission received: 16 June 2019 / Revised: 2 July 2019 / Accepted: 2 July 2019 / Published: 4 July 2019
(This article belongs to the Collection Sustainable Built Environment)

Abstract

:
In areas with a dry and hot climate, factors such as strong solar radiation, high temperature, low humidity, dazzling light, and dust storms can tremendously reduce people’s thermal comfort. Therefore, researchers are paying more attention to outdoor thermal comfort in urban environments as part of urban design. This study proposed an automatic workflow to optimize urban spatial forms with the aim of improvement of outdoor thermal comfort conditions, characterized by the universal thermal climate index (UTCI). A city with a dry and hot climate—Kashgar, China—is further selected as an actual case study of an urban block and Rhino & Grasshopper is the platform used to conduct simulation and optimization process with the genetic algorithm. Results showed that in summer, the proposed method can reduce the averaged UTCI from 31.17 to 27.43 °C, a decrease of about 3.74 °C, and reduce mean radiation temperature (MRT) from 43.94 to 41.29 °C, a decrease of about 2.65 °C.

1. Introduction

Urban climate is determined by a city’s spatial structure, block texture, building form, open space layout, and so on [1]. Urban climate influences building cooling and heating loads, and outdoor thermal comfort, then influences the building performance [2], and it is therefore one of the most significant factors considered in urban design [3]. Sustainable urban design plays an important role in the improvement of the urban climate, pointing to the need for more climate-responsive environments [4]. Along with the rapid development of the global economy and the unprecedentedly rapid process of urbanization, the scale of cities has been expanding continuously, which has had direct impacts on urban morphology. In particular, urban morphology can influence the urban climate with different morphological parameters and exhibit more intense heat islands [5,6,7] and lower permeability of urban air ventilation [8,9]. Therefore, urban morphology in the design phase has become an important ecological factor in high-density and high-intensity urban development, gradually becoming the focus of architects and planners [10,11]. Local decision makers and researchers are also focusing on implementing engineering methods to optimize the thermal performance of urban blocks [12,13].
Based on terrestrial characteristics, researchers conducted a lot of basic research on cities and their climatic environments. On one hand, urban climate research with field observation has developed rapidly. Researchers have studied sunlight [14,15], energy performance [16,17], thermal comfort [18], ventilation [19,20], and so on. Koichi conducted on-the-spot measurement to the outdoor thermal environment of commercial blocks in Osaka, Japan, and obtained the result that subjective thermal sensation of occupants was consistent with the physico-thermal environment [21]. Nielsen studied climatic characteristics in dry and hot areas and warm and wet areas, and analyzed the relationship between the thermal comfort, the building environment, and the external environment [22]. Chatzidimitriou and Yannas studied the microclimate of an urban square and a courtyard in summer conditions with measured data and assessed the effects of geometry, materials, soil humidity, and so on. [23]. Bueno et al. proposed a computationally fast model to predict the urban heat island (UHI) effect with data from an operational weather station outside the city [24]. Chun and Guldmann applied sensors to monitor the impact of greening on the UHI through land surface temperatures and evaluated the impact in the seasonal variations and mitigation [25]. Malings studied the UHI with probabilistic urban temperature modeling in New York City and Pittsburgh, USA [26]. Oliveti generalized the influence mechanism of thermal radiation under different conditions by conducting field measurements of thermal radiation movement to the ground and sky [27]. Peeters built an urban climate model using remote sensors of urban features and applied a GIS-based method for constructing 3D urban morphology [28]. The on-site measurement studies can facilitate the urban climate analysis, however, such research often involves significant amounts of manpower, materials, and cost, and it is difficult to obtain continuously distributed meteorological grid data.
On the other hand, computer-based numerical simulation has some advantages and useful applications. Xu et al. analyzed design parameters for an urban courtyard for climate optimization through simulations with software such as Parabolic Hyperbolic Or Elliptic Numerical Integration Code Series (PHOENICS), computational fluid dynamics (CFD), and Energyplus, determining how outdoor environment influence the indoor environment in different designs [29]. Wong et al. used CFD to simulate the impacts of the change of the geometric scale of urban streets and building complexes on the UHI effect [30]. Yang et al. conducted simulative analysis to the impacts of height–width (H/W) ratio, orientation, and other form elements of the canyons of urban blocks on their microclimatic environments by simulations, showing that a H/W of 3 can be considered a threshold with respect to outdoor thermal comfort [31]. Mayer et al. researched numerical simulation and actual measurements of the outdoor thermal environment and found that simulation models can be validated from real environmental conditions to enable a reality-oriented model initialization [32]. Ng studied the impacts of the scale relationship among buildings and different skylines on urban ventilation and air quality in high-density cities by using a sunshine-based physical model and CFD technology [33]. Bajsanski applied the Ladybug plug-in of the Grasshopper in Rhino software to study the impacts of urban planning on the heat environment in Novi Sad, resulting in the largest universal thermal climate index (UTCI) decreases being noted at 10, 17 and 18 UTCI on hot summer days at 11 UTCI on cold winter days. This research also pointed out that the building height and density increases in the future street design will modify the thermal environment. [34]. Taleb et al. applied a genetic algorithm in Rhino to generate a building form cluster that adapts to a dry and hot climate, covering environmental factors such as solar radiation, urban ventilation, building form, and orientation to achieve the best sustainable urban form [35]. Hu et al. studied the potential of urban form design in reducing the heat-island effect with Grasshopper and genetic algorithms, and the results of this study show that it is possible to mitigate UHI by manipulating urban form based on sky view factor (SVF) [36]. Also, a GIS extension model was applied to simulate the UHI to calculate the UHI intensity based on urban geometry [37]. Perini et al. simulated urban outdoor thermal comfort by coupling EVNI-Met and TRNSYS using Grasshopper, which investigated the potentialities of both ENVI-met and TRNSYS for the calculation of urban features (urban form, vegetation, canyon proportion, etc.), which affect urban microclimate [38]. Milošević et al. also developed a procedure for changing tree locations to improve outdoor thermal comfort in street parking lots and address the importance of the location of trees, as well as the crown shapes [39].
Parameterized design has been widely applied, and the design has gradually evolved into the automatic optimization of urban forms based on the platform of computer optimization algorithms. Granadeiro et al. used parameterized language on the Matlab platform to generate a series of building forms and obtained through analysis the annual energy consumption levels of different building forms in connection with EnergyPlus simulation [40]. At the stage of conceptual design, Caruso et al. optimized building forms with the aim of minimizing the receipt of solar radiation by using the calculus of variations of mathematical theory [41]. Xu et al. estimated the impact of open space on the urban micro-climate and validated the open space design strategies through performance-based optimization, however, which need further consideration of the impact of building form, street orientation, and so on [3]. Contreras et al. used a genetic algorithm to conduct random variation and combination with building façade, roof, window type, glass type and shade coefficient as genes, to achieve the lowest building energy consumption [42].
When studying the correlation between the layout of building space and microclimate on the block scale, land use with the same scale is usually used by summarizing, abstracting, and simplifying the universal model of building combinations in the land use unit. Then, the basic building types are divided to display their geometric characteristics. The classification of basic building types has been the focus of many urban climatology-related studies. For example, Steelners et al. [43] condensed six typical types on the basis of existing research by Martin Center researchers on land use and built forms; copied and developed a variety of urban spatial layouts to simulate wind speed and solar radiation, respectively; and preliminarily revealed the different microclimatic characteristics and laws presented by urban blocks composed of different basic building types. Studying dry and hot areas, Ratti et al. [44] investigated the urban texture of downtown Marrakesh and analyzed and summarized three basic building types—courtyard, micro-pavilion and pavilion—to study the impacts of these basic building types on the microclimatic environment at the block level. Okeil further compared the distribution of sunlight on the surface of strip-type, courtyard-type, and residential solar bulk (RSB) blocks and demonstrated the superiority of RSB in improving solar energy efficiency [45]. In winter, the projection of this basic building type falls entirely on the surrounding open space, with no self-shading occurring. In summer, the prevailing wind exactly passes through the block, which is conducive to alleviating the summer heat island effect and achieving the optimization of the building energy consumption level throughout the year.
Above all, research on urban morphology and climate has gradually focused on computer-aided automatic optimization from the urban scale to the block scale considering the thermal comfort of humans. However, little research has been done on the relationship between urban forms and microclimates in the block scale under a dry and hot climate. Insufficient strategic research and automatic optimization have been carried out on the spatial layouts of urban blocks based on the comfort demands of humans in dry and hot areas, especially in western China. Western China is urbanizing rapidly, and studies on the sustainable design of cities and buildings based on climatic adaptability have aroused more and more attention. The climatic conditions in dry and hot areas are relatively different from those in other areas, and so it is necessary to explore strategies and methods that can effectively alleviate the environmental pressure, improve the livable quality of cities and adapt to local climatic characteristics. Therefore, this study selects the urban block dimension in Kashgar, China in a dry and hot region, and investigates performance-driven urban morphology optimization for urban climate with a simulation tool. This study would like to evaluate the design of building form, height, and street orientation for better outdoor thermal comfort in the ideal case and the actual urban block case.

2. Methodology

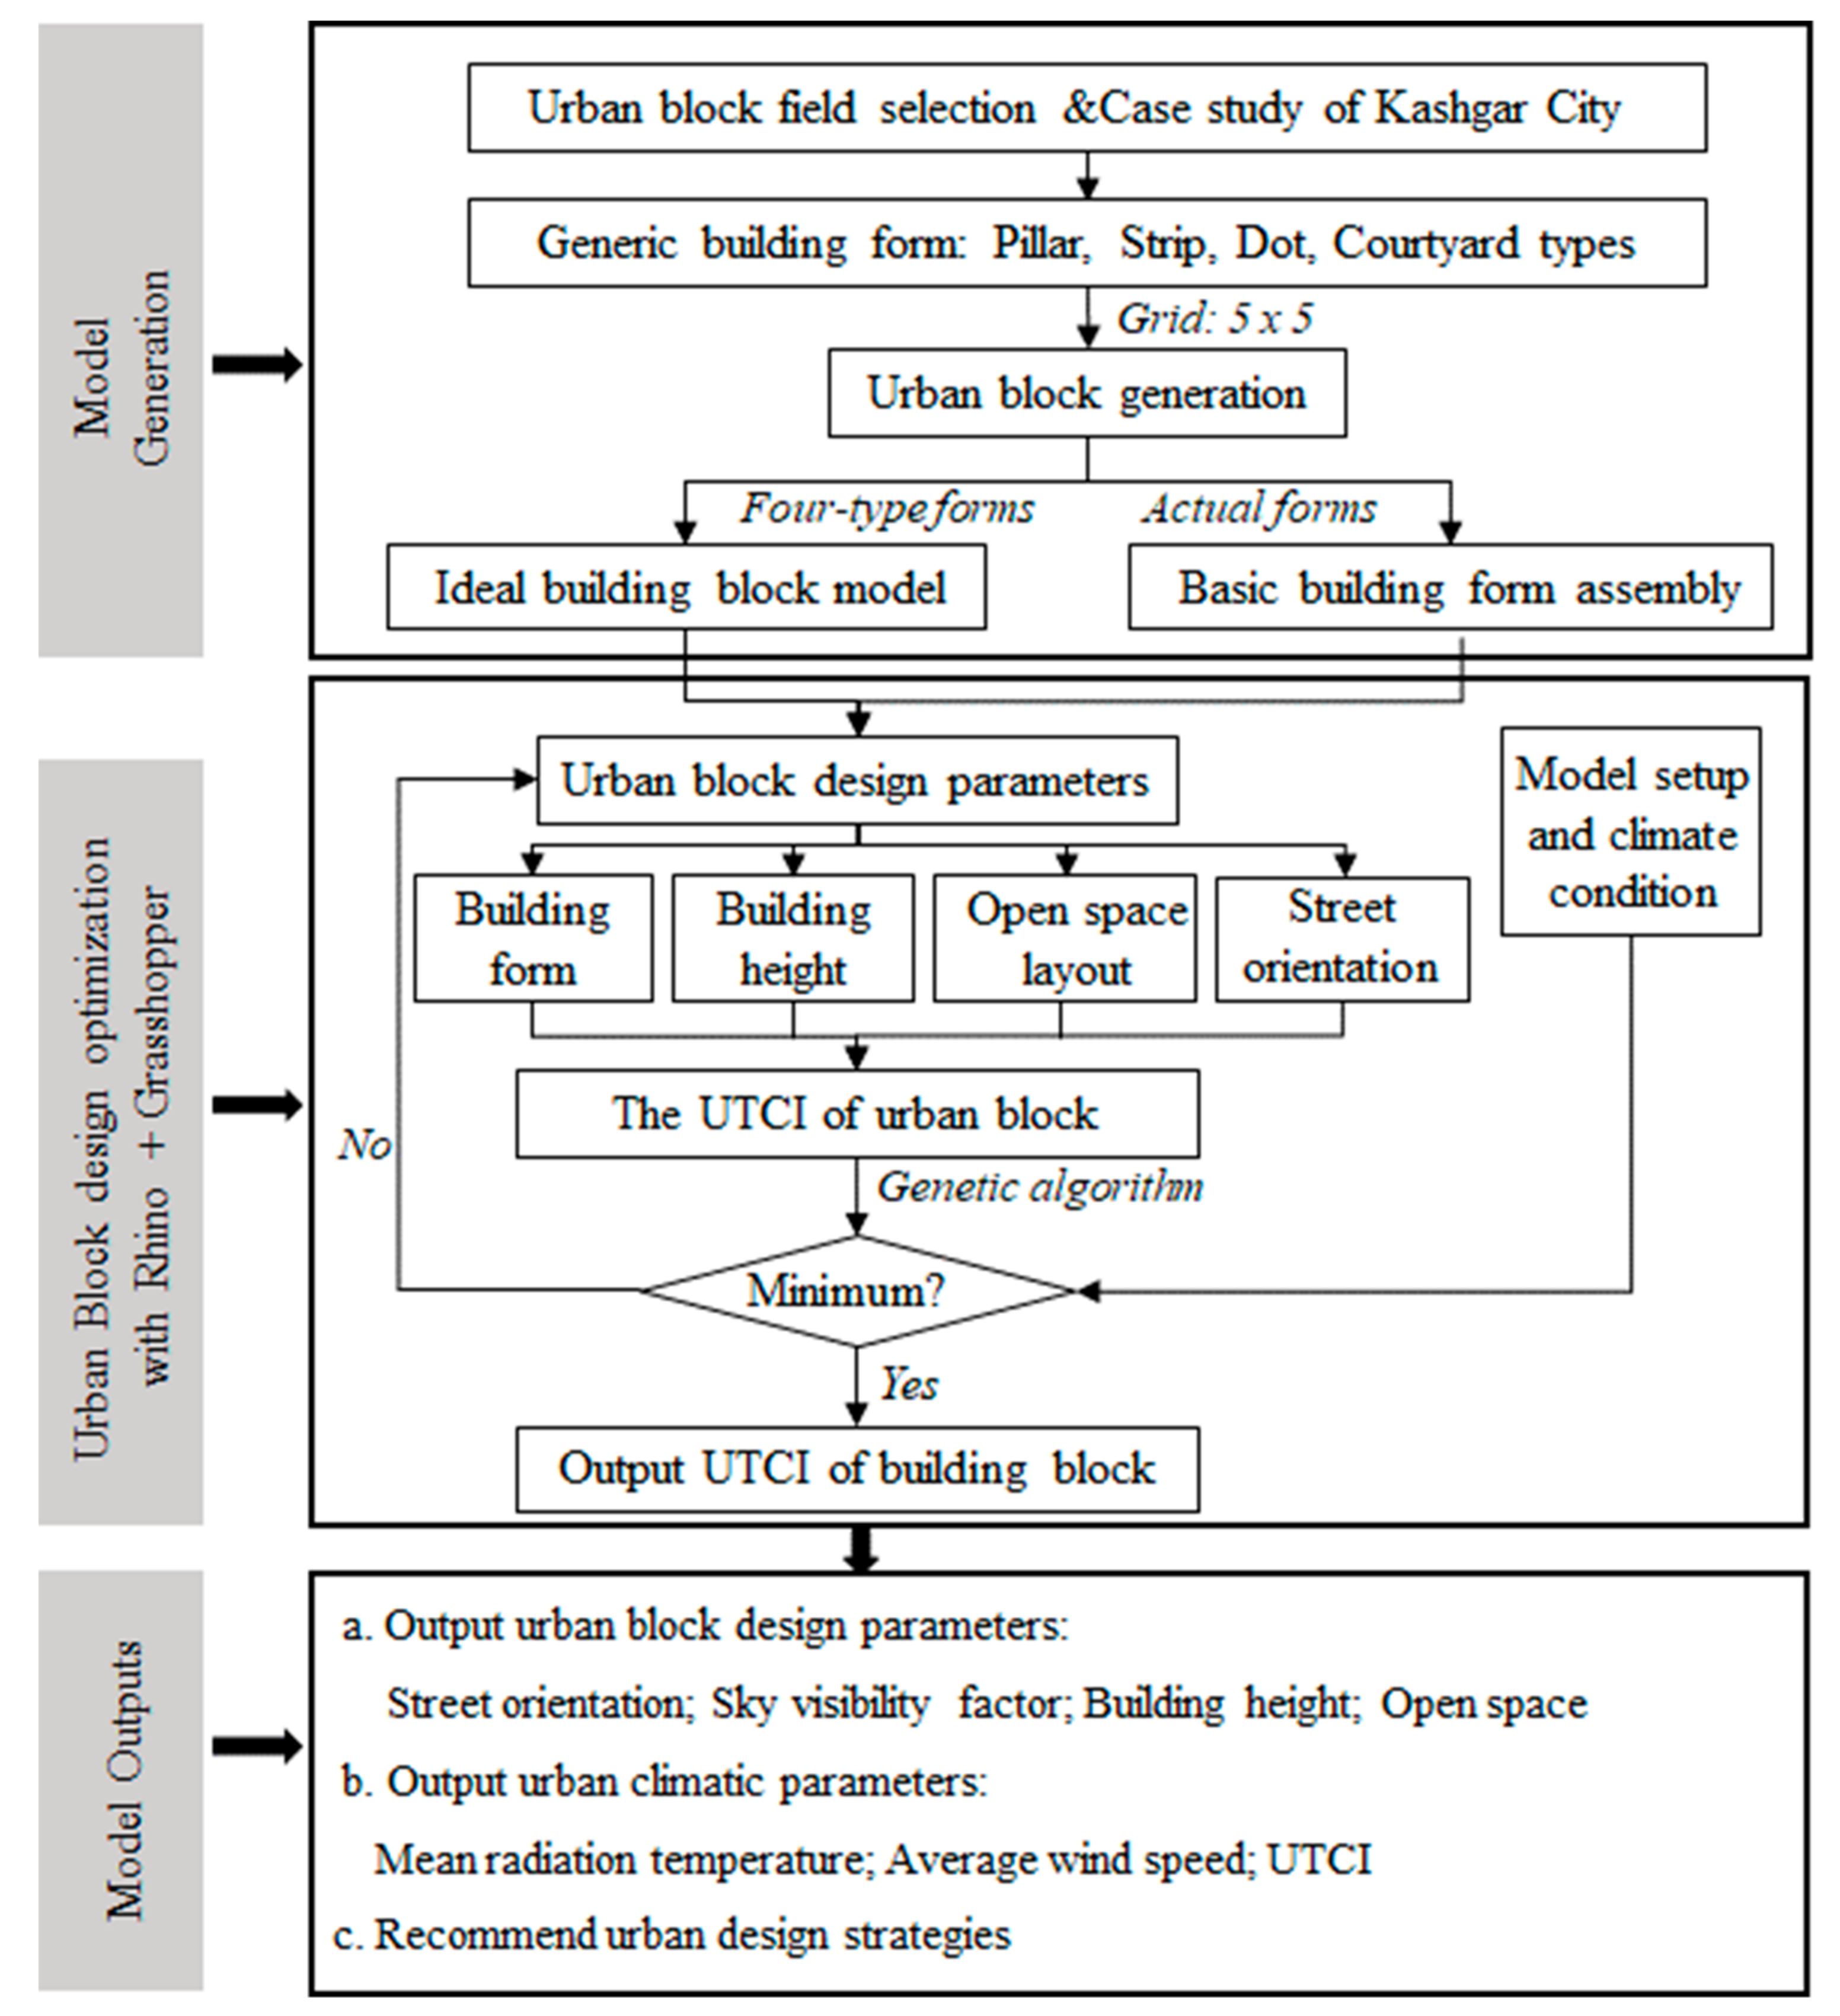
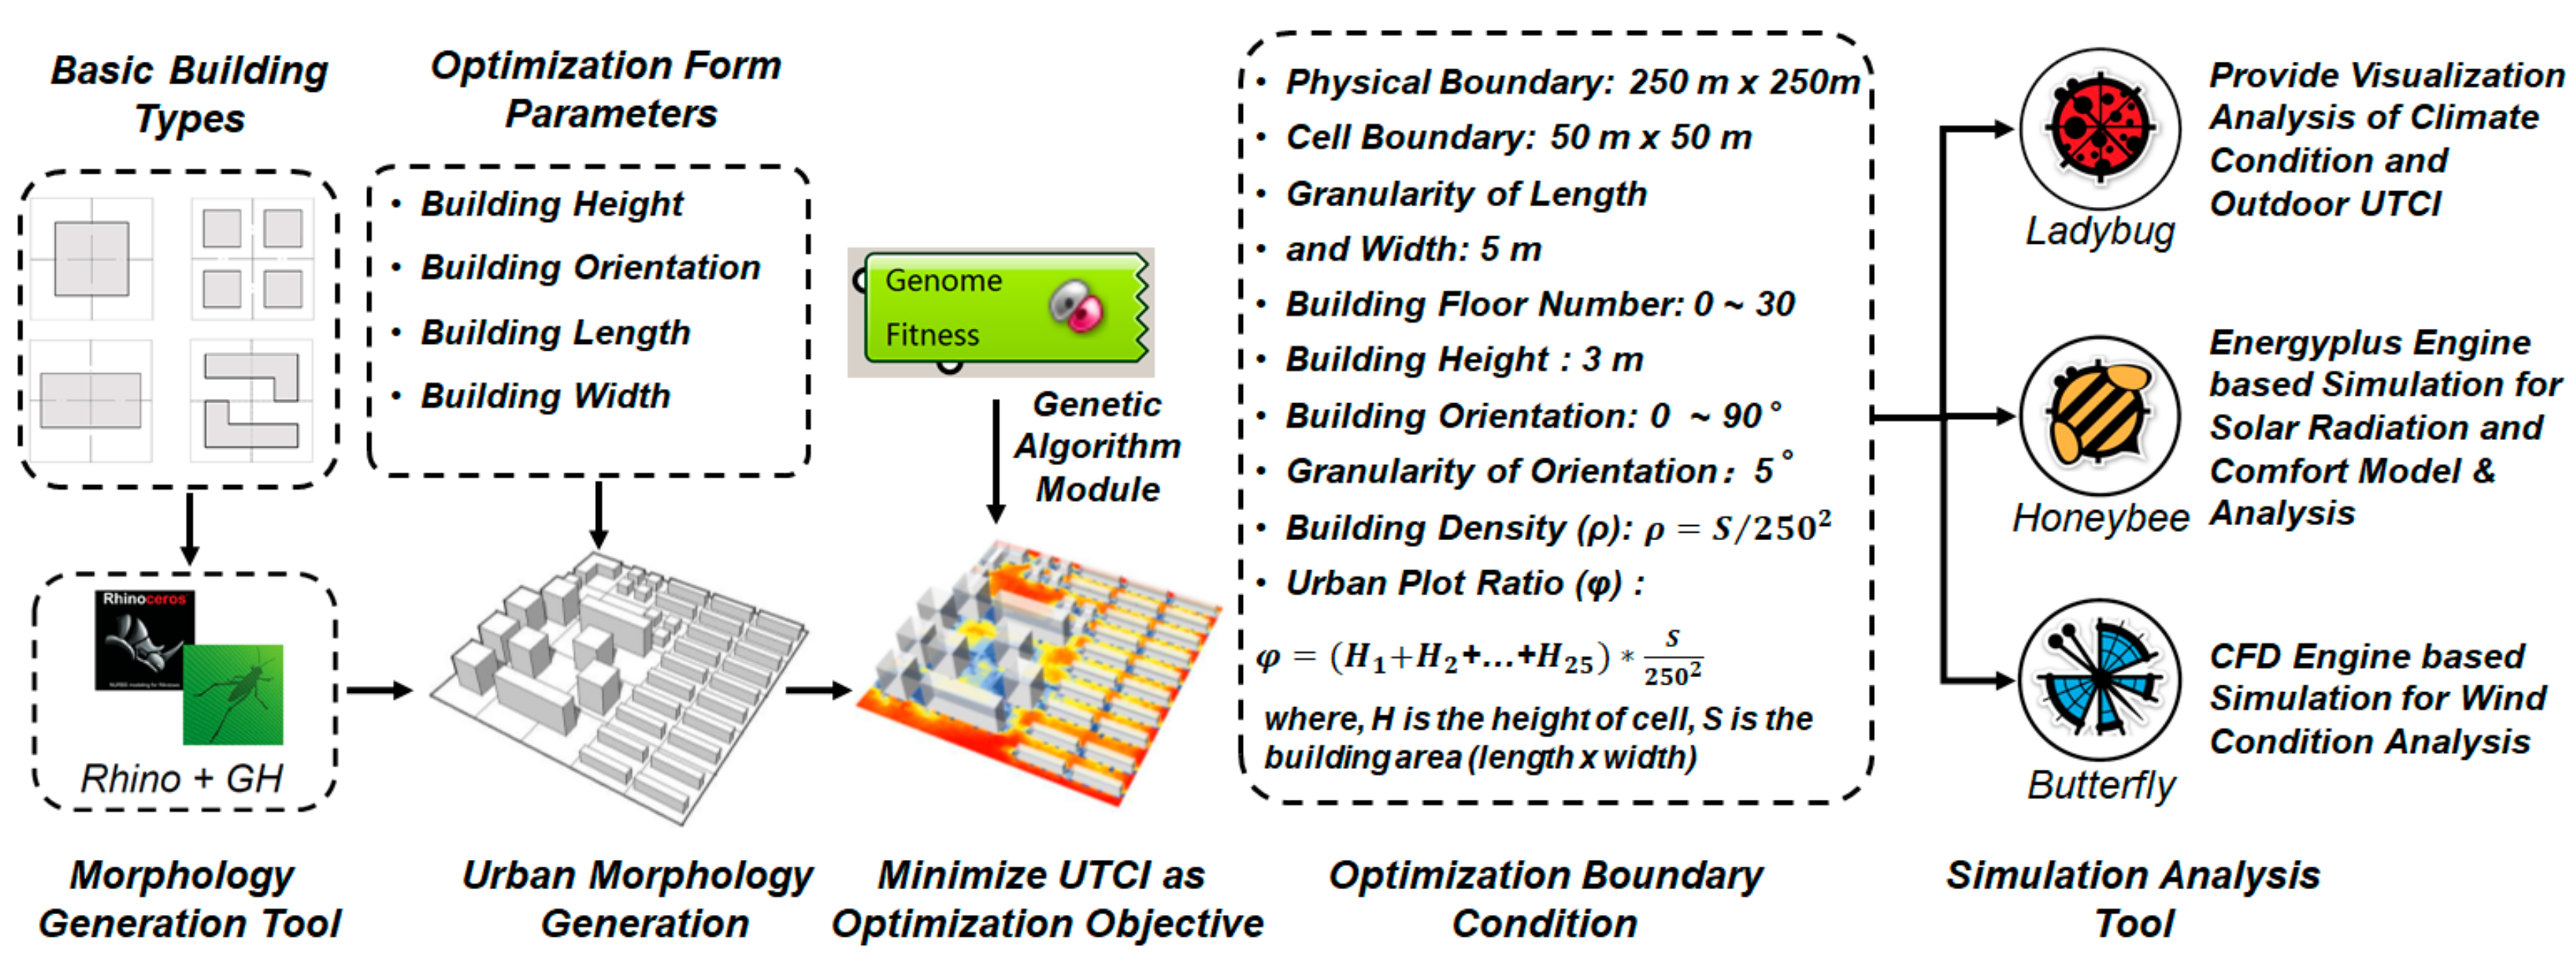
2.1. Overview of This Study

Figure 1 shows the overview of this study, which consists of three phases. In the first phase, this study generates the urban block model and this study selected two models—ideal urban block model and actual urban block model. Also, this phase discusses the four generic building forms that generate the two models. The ideal model is applied for investigating optimization performance during urban block design, while the actual case model is used for validating the optimization performance in prefixed urban forms. The second phase proposed three parameters, building form, height, and open space layout, to optimize the urban block model with the aim of minimizing outdoor thermal comfort index, which is represented as UTCI. Additionally, this phase includes the model setup, climate condition, and the details of case study. In the last phase, this study outputs the simulation results and recommends the corresponding urban design strategies.

2.2. Urban Block

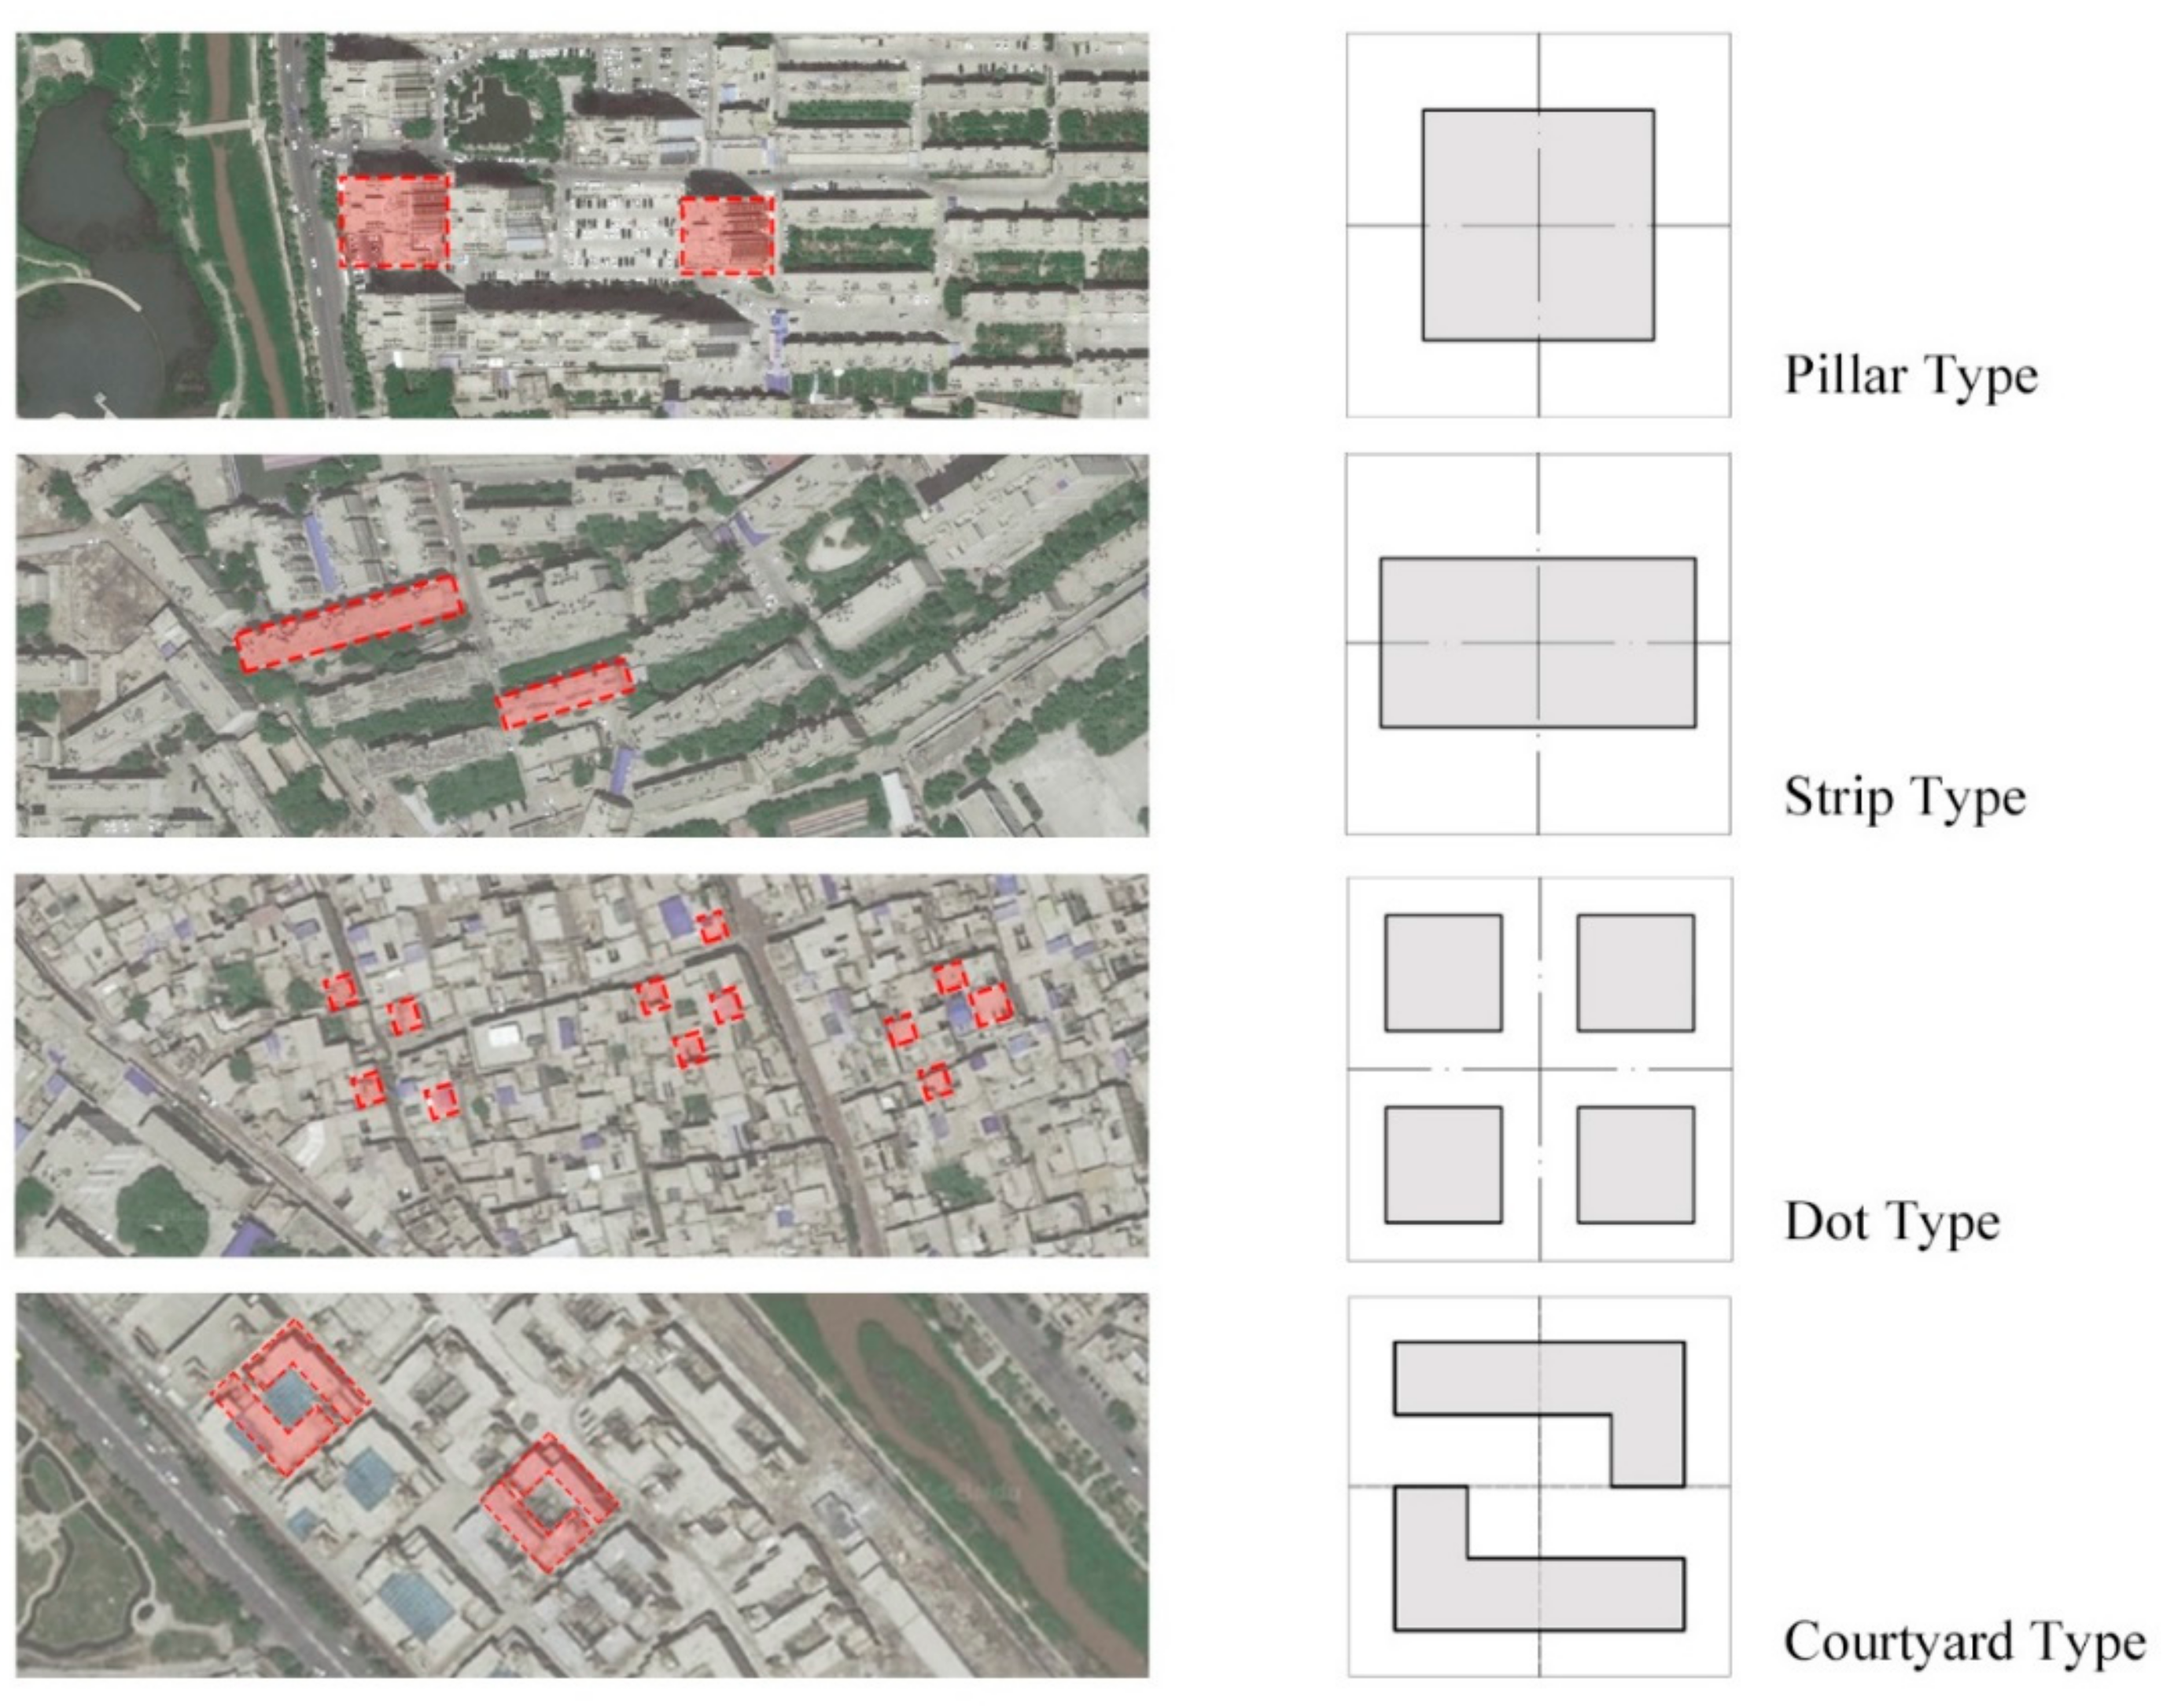
2.2.1. Generic Building Form

Through review, this study adopted the following common building types, pillar type, strip type, dot-type (micro-pavilion), and courtyard type. The fragmentation degrees of these four basic building types are different (fragmentation degree refers to evenly dividing a basic unit into smaller sizes but maintaining the same building density and building height of the basic type.) The paper sets the fragmentation degree of the basic type as pillar 1-mass, strip 1-mass, dot 4-mass, and courtyard 2-mass, then builds the layouts of grid-shaped urban blocks based on these basic building types, which are shown in Figure 2.

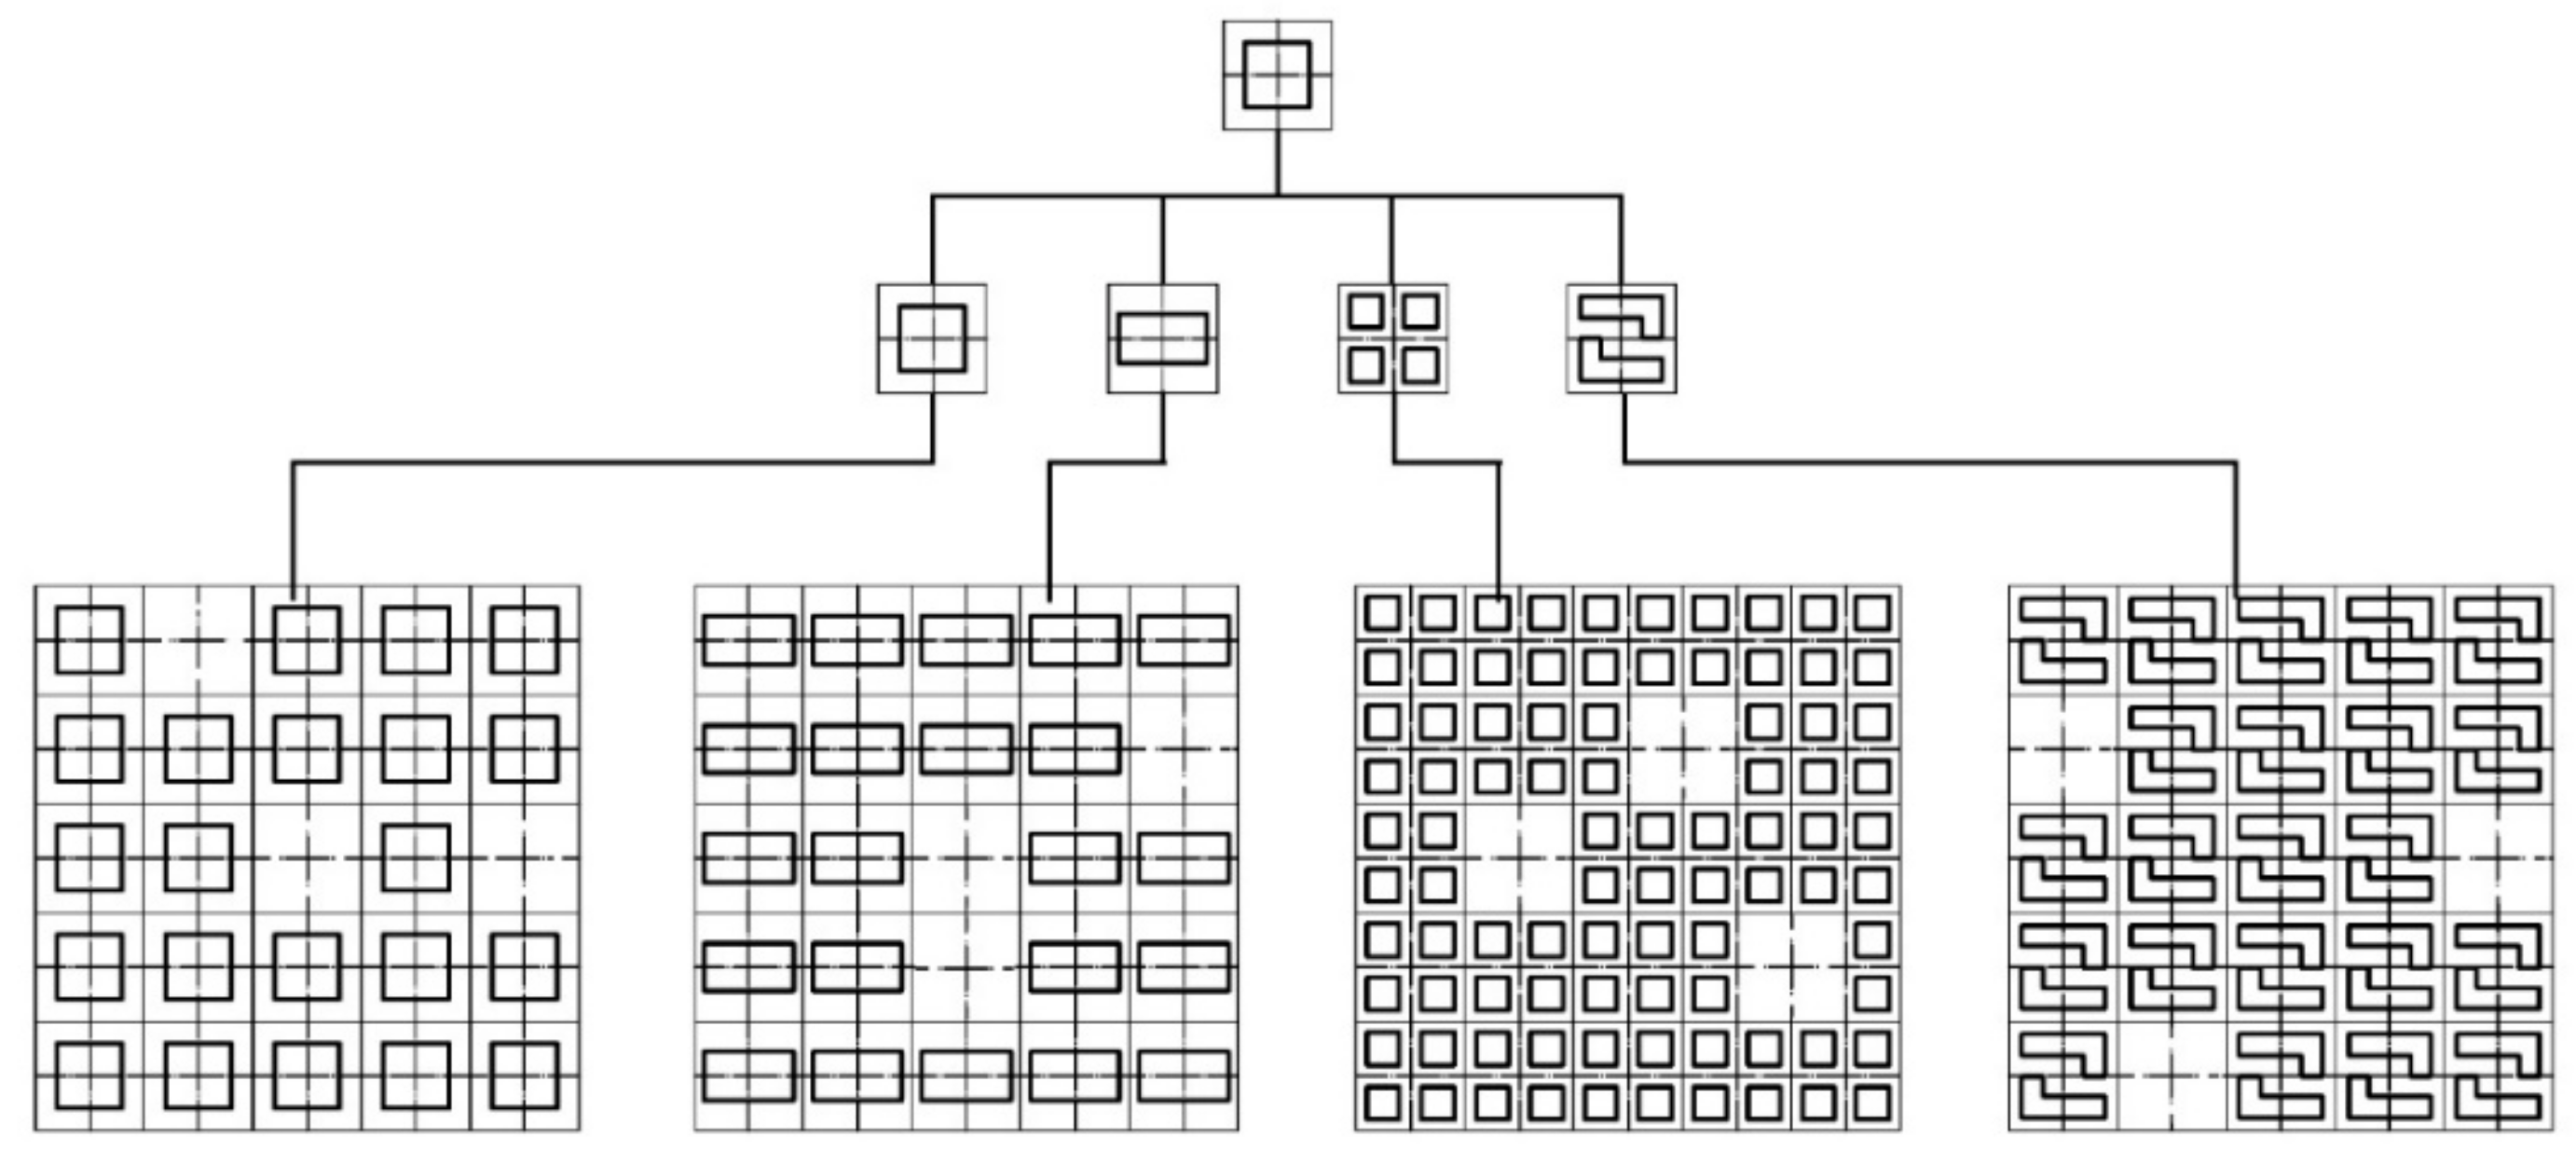
2.2.2. Ideal Block Generation

Regarding the forms of urban blocks, we first hypothesize that urban block bases are composed of unit grids of the same size. Each unit grid generates a basic building unit, which is showed in Figure 3. Therefore, the building complexes is generated by the basic building types. This study builds the regular block layouts of grids by controlling the height of the basic building types of the grid when height equals zero, the building block becomes open space. Then, this study conducts comfort simulation studies on the block layouts.
Regarding automatic optimization of block layouts under the fixed plot ratio and building density, this study selects pillar, strip, dot, and courtyard block types to generate the ideal model. Then, this study respectively analyzes the difference, street orientation, building height, and the distribution of open spaces among the four selected types of block buildings.

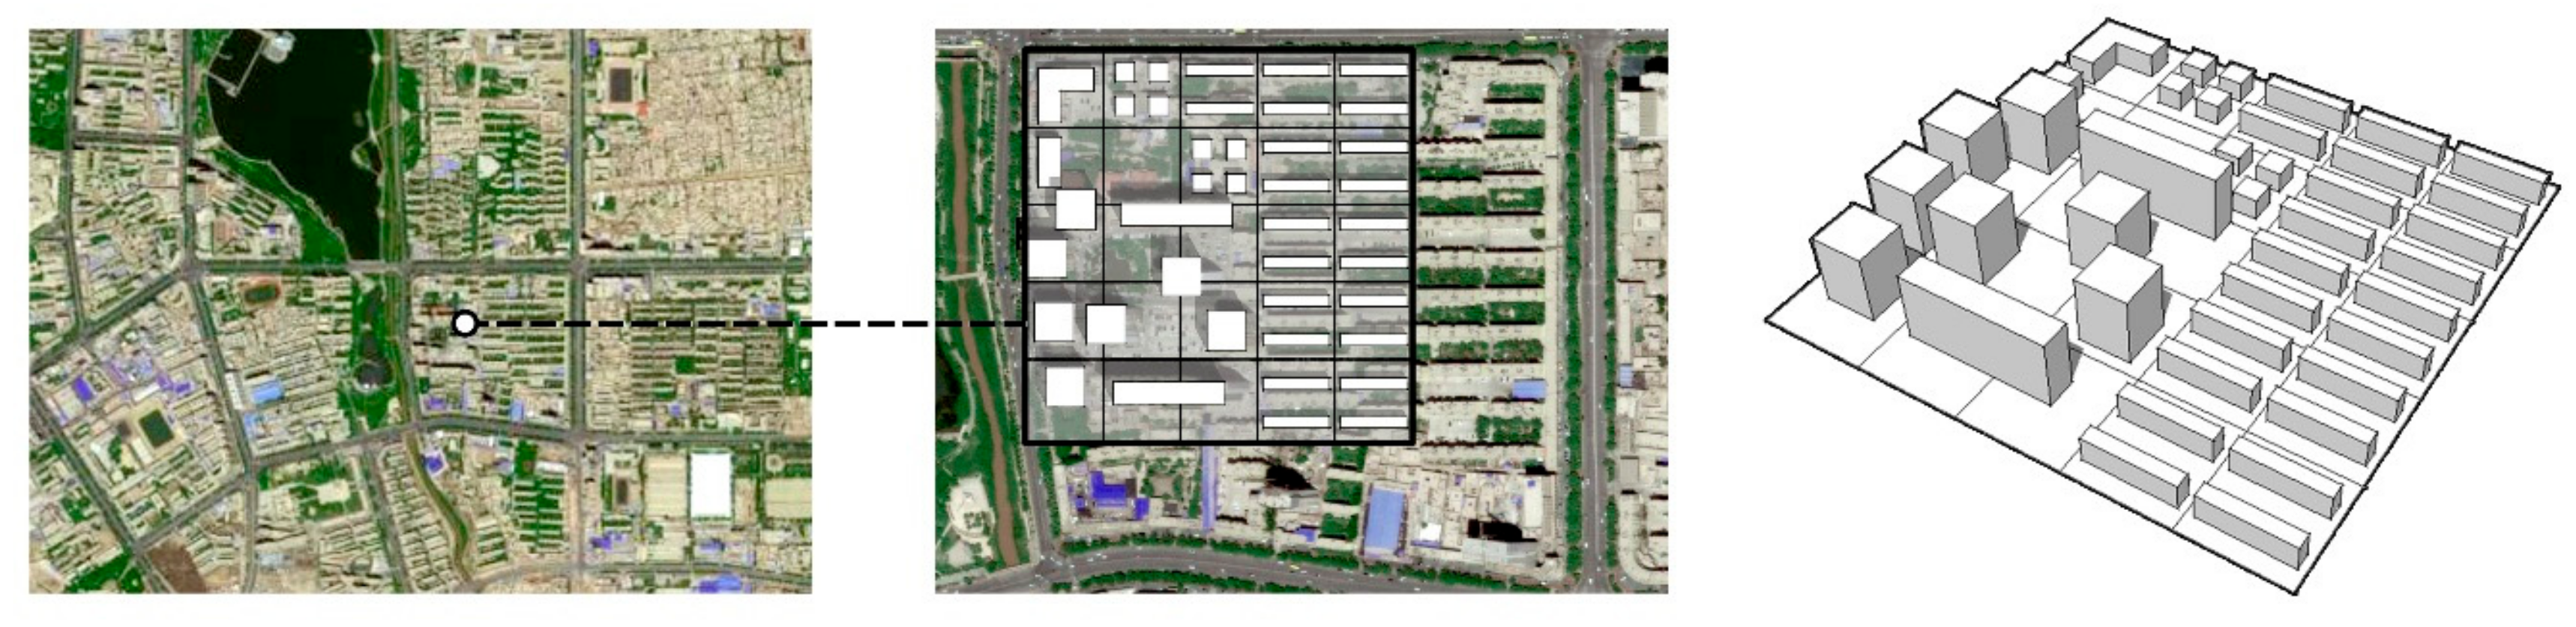
2.2.3. Actual Urban Block

After analysis of ideal blocks, this study selected actual urban blocks case in downtown Kashgar, China for the layout optimization basis shown in Figure 4. The east longitude is about 73°20′~79°57′ and the northern latitude is about 35°20′~40°18′. Located to the east of South Lake Park in downtown of Kashgar, this base covers an area of 12.25 ha, with a plot ratio of 1.8 and a building density of 0.24. To the west and northwest of the base is South Lake and East Lake, respectively, and to the north and east of the lake are residential quarters. There are six dot-type blocks of 16-floor buildings, two plate-type blocks of 16-floor buildings, and several strip-type 6-floor residential buildings in the selected case. On the northwestern street corner of the base there is an “L”-shaped 6-floor hotel, with its own courtyard. Since the micro-climatic environments in the real block are subject to such factors as the surrounding topography and landforms, surrounding building layouts, and building shape, size and orientation, considering all of these factors would make the simulation experiment extremely complicated, and a huge amount of simulative calculation would involve a lot of manpower, materials, and time. Therefore, this study divided the base into 5 × 5 regular grids, the size of each basic unit being 70 m × 70 m, and selected relatively regular building masses, without giving any consideration to the landscape in this base.

2.3. Urban Climate Optimization

2.3.1. Simulation Tool for Optimization Platform

This study focuses on a computer-aided optimization process based on the Rhino & Grasshopper platform with the help of parameterized design plugs-in such as Ladybug, Butterfly, Galapagos and OpenFOAM. In this study, a parameterized urban block is generalized with four basic building types using Rhinoceros software and then Grasshopper embedded in Rhinoceros is applied to link the urban block to the analysis software tools. Built in the Grasshopper platform, the ladybug plug-in can provide visualization analysis of weather condition and outdoor comfort, e.g., UTCI, for the selected area. With the Energyplus engine, honeybee plug-in can provide the solar radiation simulation, such as solar energy absorption and mean radiation temperature, and Butterfly, based on CFD Engine, is used to run simulation analysis.

2.3.2. Genetic Algorithm for Optimization Process

The genetic algorithm is selected for the optimization. Genetic algorithm has been applied in many single- or multi-objective studies, e.g., for building design to saving energy [46], or district-level urban energy design [47]. UTCI for micro-climate simulation is conducted with automatic optimization of spatial layouts and the building forms of the blocks to determine the best block layout. Along with this process, the Galapagos module, producing optimization process with a genetic algorithm, is applied to minimize UTCI as the optimization objective with optimization form parameters, which are building height, orientation, length, and width as the genes. Through the control of basic conditions (genes), the algorithm searches for an ideal scope of feasible solutions and searches for the trend of the impact of gene combination on the result by re-combining genes, eventually determining the best solution. During this iterative process, the design solution is optimized. The optimization process proposed in this study is illustrated in Figure 1. For output of urban block optimization, this study will present the results of street orientation, SVF, building height, and open space layout, respectively in terms of urban block design parameters, mean radiation temperature (MRT), average wind speed, and UTCI, respectively in terms of urban block climatic parameters. For settings for the genetic algorithm, max. stagnant is 50, population is 30, initial boost is 5, maintain is 5%, and inbreeding is 75% in the genetic algorithm module.

2.3.3. Model Setup and Weather Conditions

By analyzing, abstracting, and condensing the block textures and building forms of this base, we eventually select three basic building types with different fragmentation degrees: the dot basic-type (4-mass) of 1–5 floors, the strip basic-type (2-mass) of 6–10 floors, and the pillar basic-type (1-mass) of more than 10 floors. The ideal research base has 5 × 5 grids (250 m × 250 m), thereby, cell boundary is 50 m × 50 m. By conducting random mixed distribution of the three basic types, we explored the impacts of different combination modes on the average outdoor thermal comfort of the human body in the block. The optimization boundary condition is shown in Figure 5. In this study, for the form parameter, building height was set as 3 m for each floor while the floor range was from 1 to 30. The granularity of length and width for each building was 5 m while those two parameters should be smaller than 50 m (basic size of cell). For the building orientation, it could vary from 0 to 90° with a granularity of 5°. The final boundary is that the urban building density and plot ratio are fixed for the ideal model as 0.32 and 3.
In the actual urban blocks, building units do not necessarily belong to a single building type, but usually mix several basic building types. Therefore, when the plot ratio (1.8) and building density (0.24) are the same as those of the original base, this study selects three basic building types with different fragmentation degrees in the block—pillar (1-mass), strip (2-mass), and dot (4-mass)—accomplish a mixed layout of the basic building types. During optimization, this study changes the basic building types of each unit, the number of floors of each single building, the location of the open space, etc. This study also optimizes the average outdoor thermal comfort of the selected block and analyze the variation trend of such form indices as building height (H), basic building type, and location of open space, as well as such micro-climatic indices as mean radiation temperature and average wind speed of the block along with the improvement of the average thermal comfort value of the base. This study sets up the meteorological background in the dry and hot area, with the case of Kashgar and focuses on the thermal comfort of Kashgar in July, the hottest month in a year, and the details are showed in Table 1. This study uses the average meteorological data in the hottest hours of 10:00–16:00 on a standard day in July in Kashgar obtained from the website EPWmap (http://www.ladybug.tools/epwmap/).

2.3.4. Comfort Index

It is insufficient to describe an urban microclimatic environment with a single parameter. We need to evaluate it based on the thermal comfort of humans using a comprehensive index. With regard to thermal comfort for urban block, common indices include the Predicted Mean Vote (PMV) [48], the Physiological Equivalent Temperature (PET) [49], and the UTCI [34]. The UTCI is acknowledged as a comprehensive index, that measures the outdoor thermal comfort of humans by considering the effects of such factors as air temperature (Ta, ℃), radiation temperature (Tmrt, K), relative humidity (RH, %) and wind speed (m/s) [50]. UTCI includes 10 levels, as shown in Table 2, where the level of 9–26 ℃ is the standard range of comfortable temperatures. However, in the hottest days in hot and dry region, the outdoor UTCI is usually within 26-38℃ or even higher.

3. Results

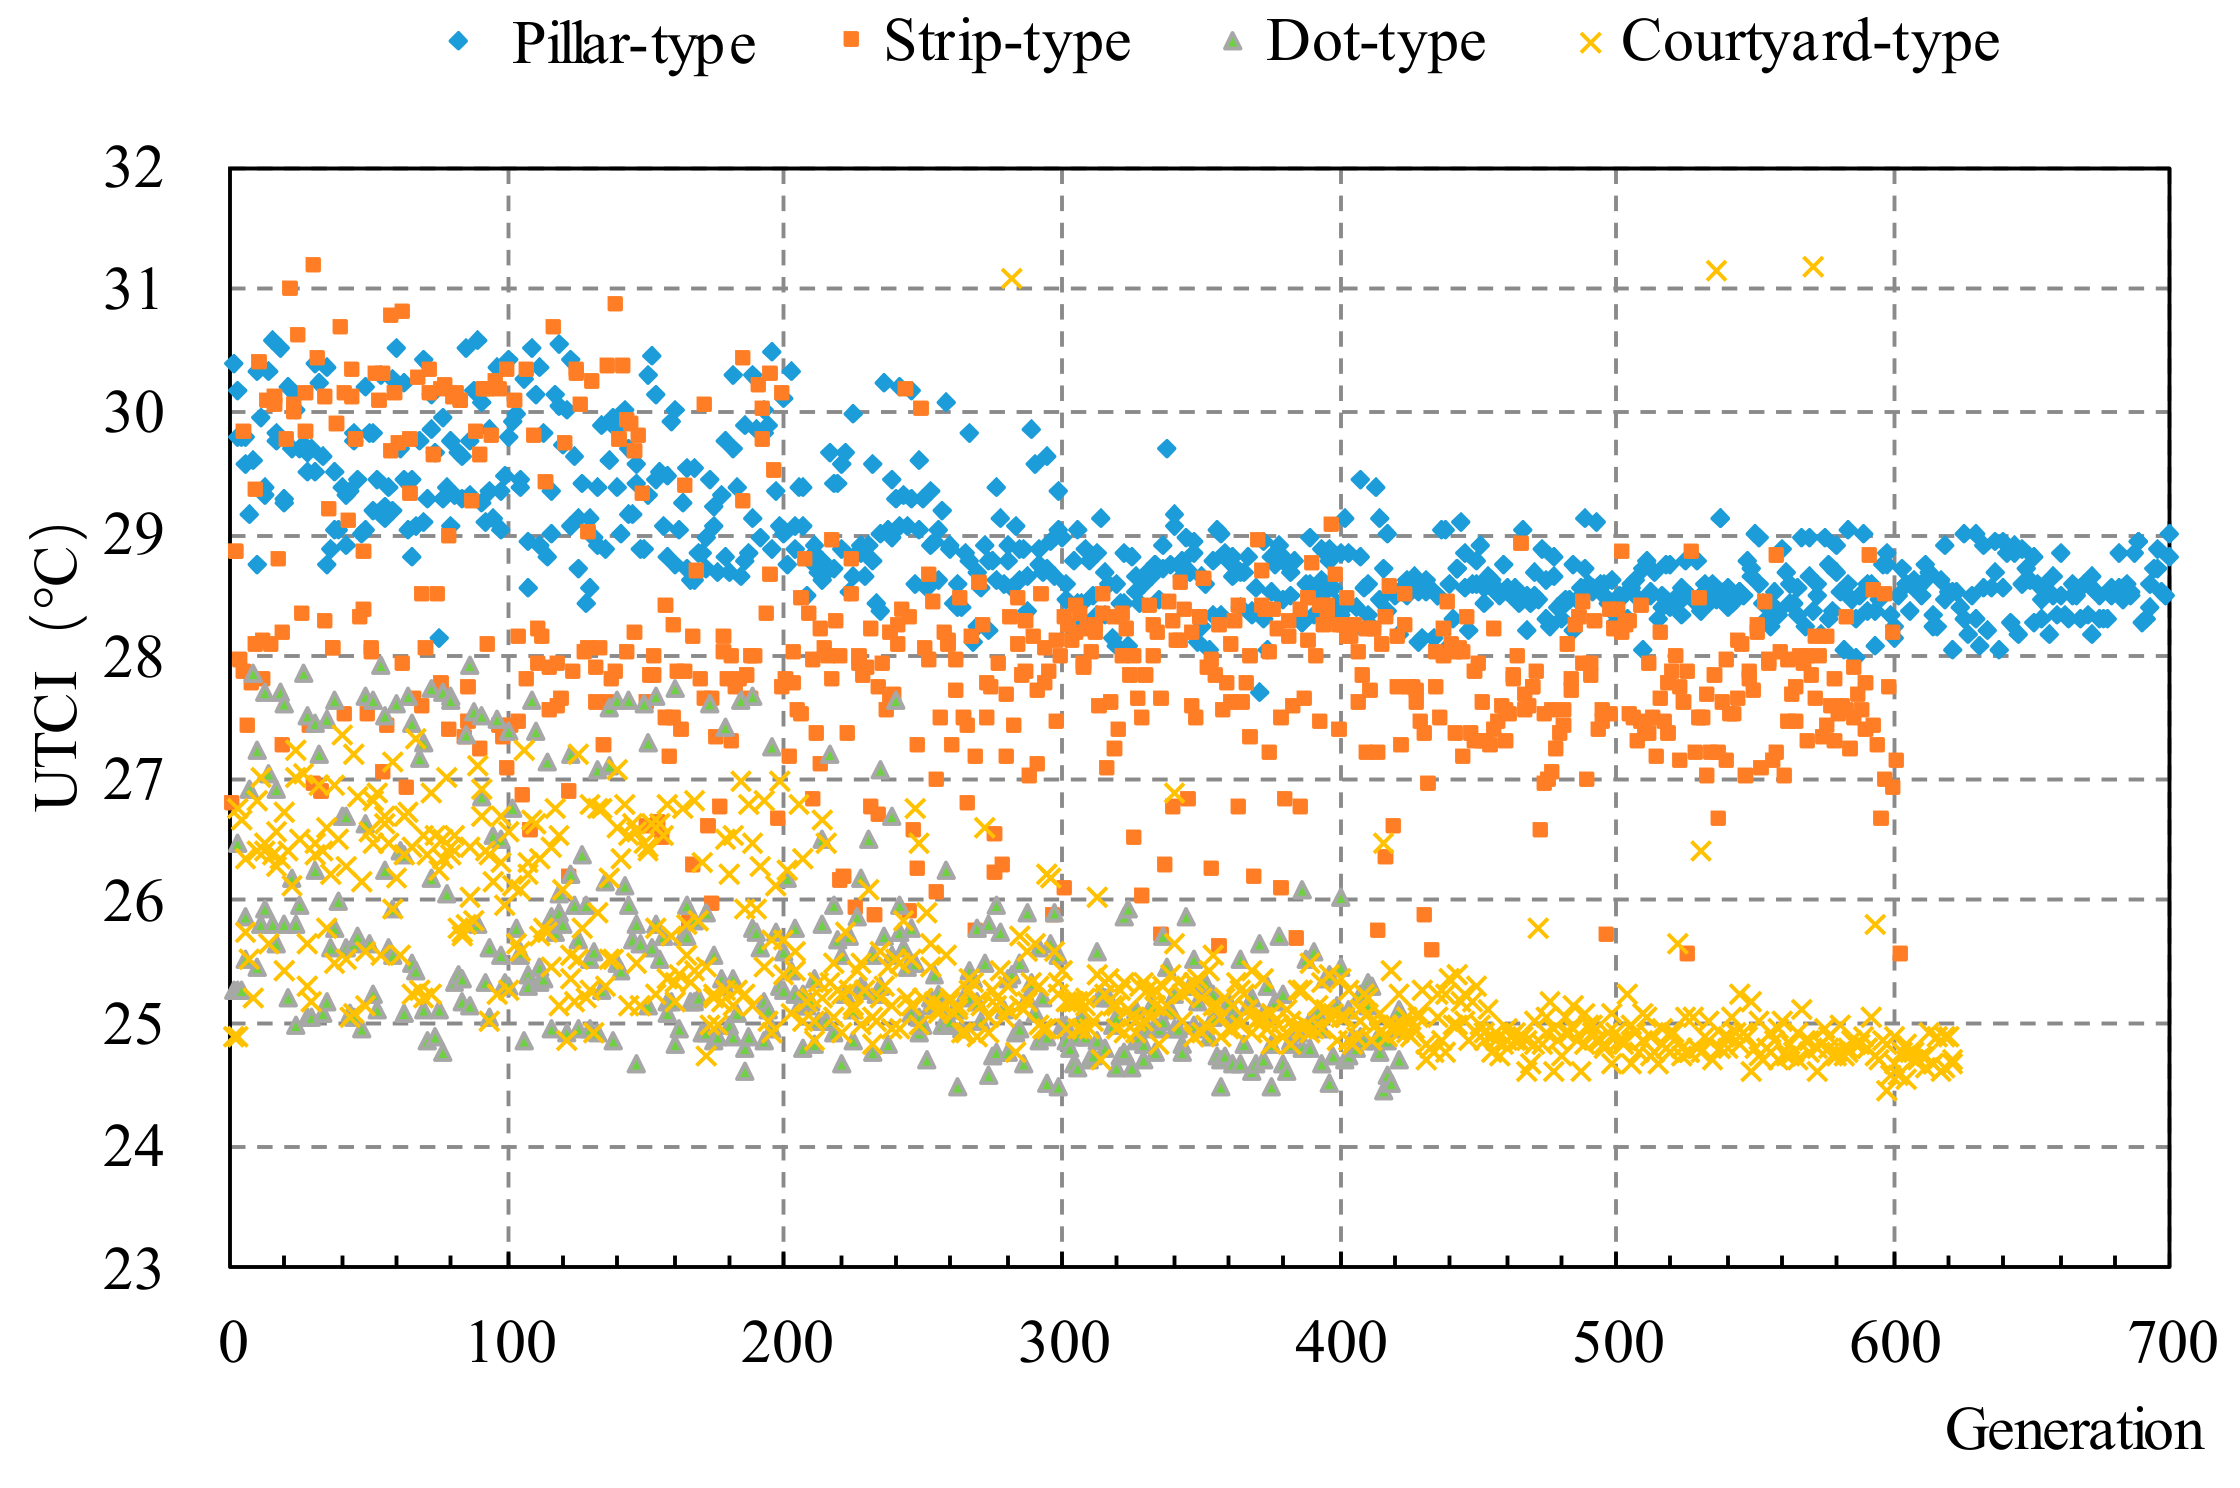
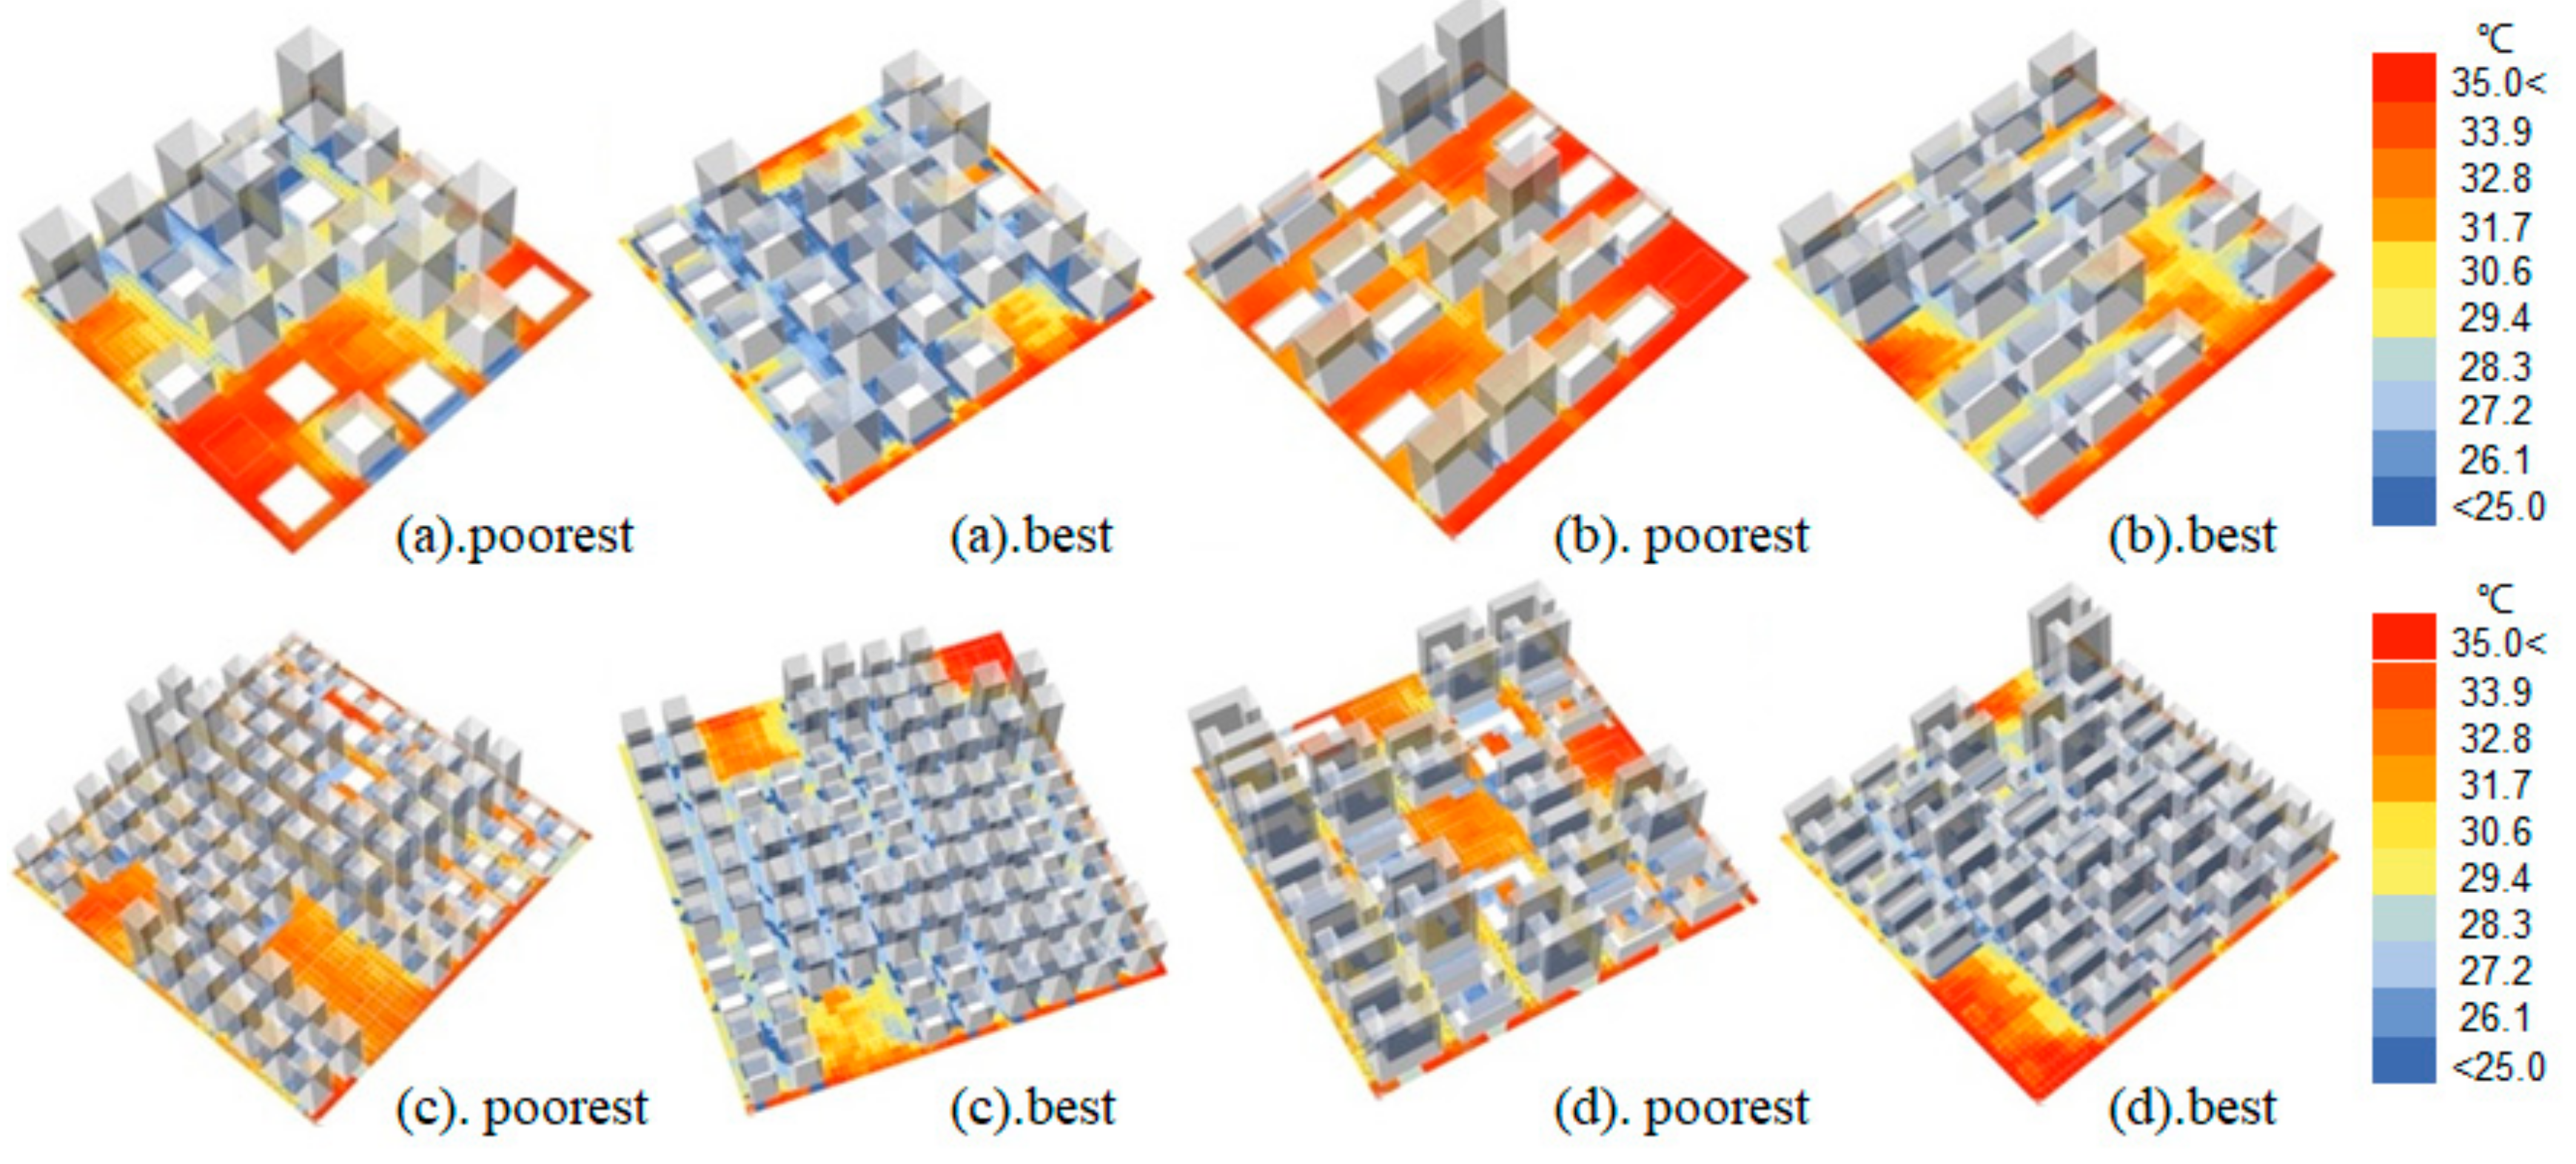
3.1. Outdoor Thermal Comfort Analysis of the Ideal Model

This study obtains the variation trend of the average UTCI of pillar, strip, dot, and courtyard-type blocks in Figure 6 and presents the poorest and best building block design with the four block types in Figure 7. As can be inferred from Figure 6, the average thermal comfort values of the four block types fluctuate up and down but show an overall declining trend, which indicates that the optimization result of block layouts is remarkable. The ranking of the average thermal comfort values from the largest to the smallest is shown in Figure 6: the variation range of the average UTCI of the pillar-type block is 28.01–30.45 °C; the variation range of the average UTCI of the strip-type block is 25.59–31.45 °C; the variation range of the average UTCI of the dot-type block is 24.4–27.97 °C; and the variation range of the average UTCI of the courtyard-type block is 24.47–27.38 °C. As can be graphically determined from Figure 6, the outdoor average UTCI of the pillar-type and strip-type blocks are higher than those of the dot-type and courtyard-type blocks.
According to Figure 1, this study would like to output the urban block design parameter to figure out indicators of those parameters when the UTCI achieve the optimal solution, including street orientation, SVF, building height distribution, open space layout, respectively for urban block design parameters, and mean radiation temperature, average wind speed, and UTCI, respectively for urban climatic parameters.

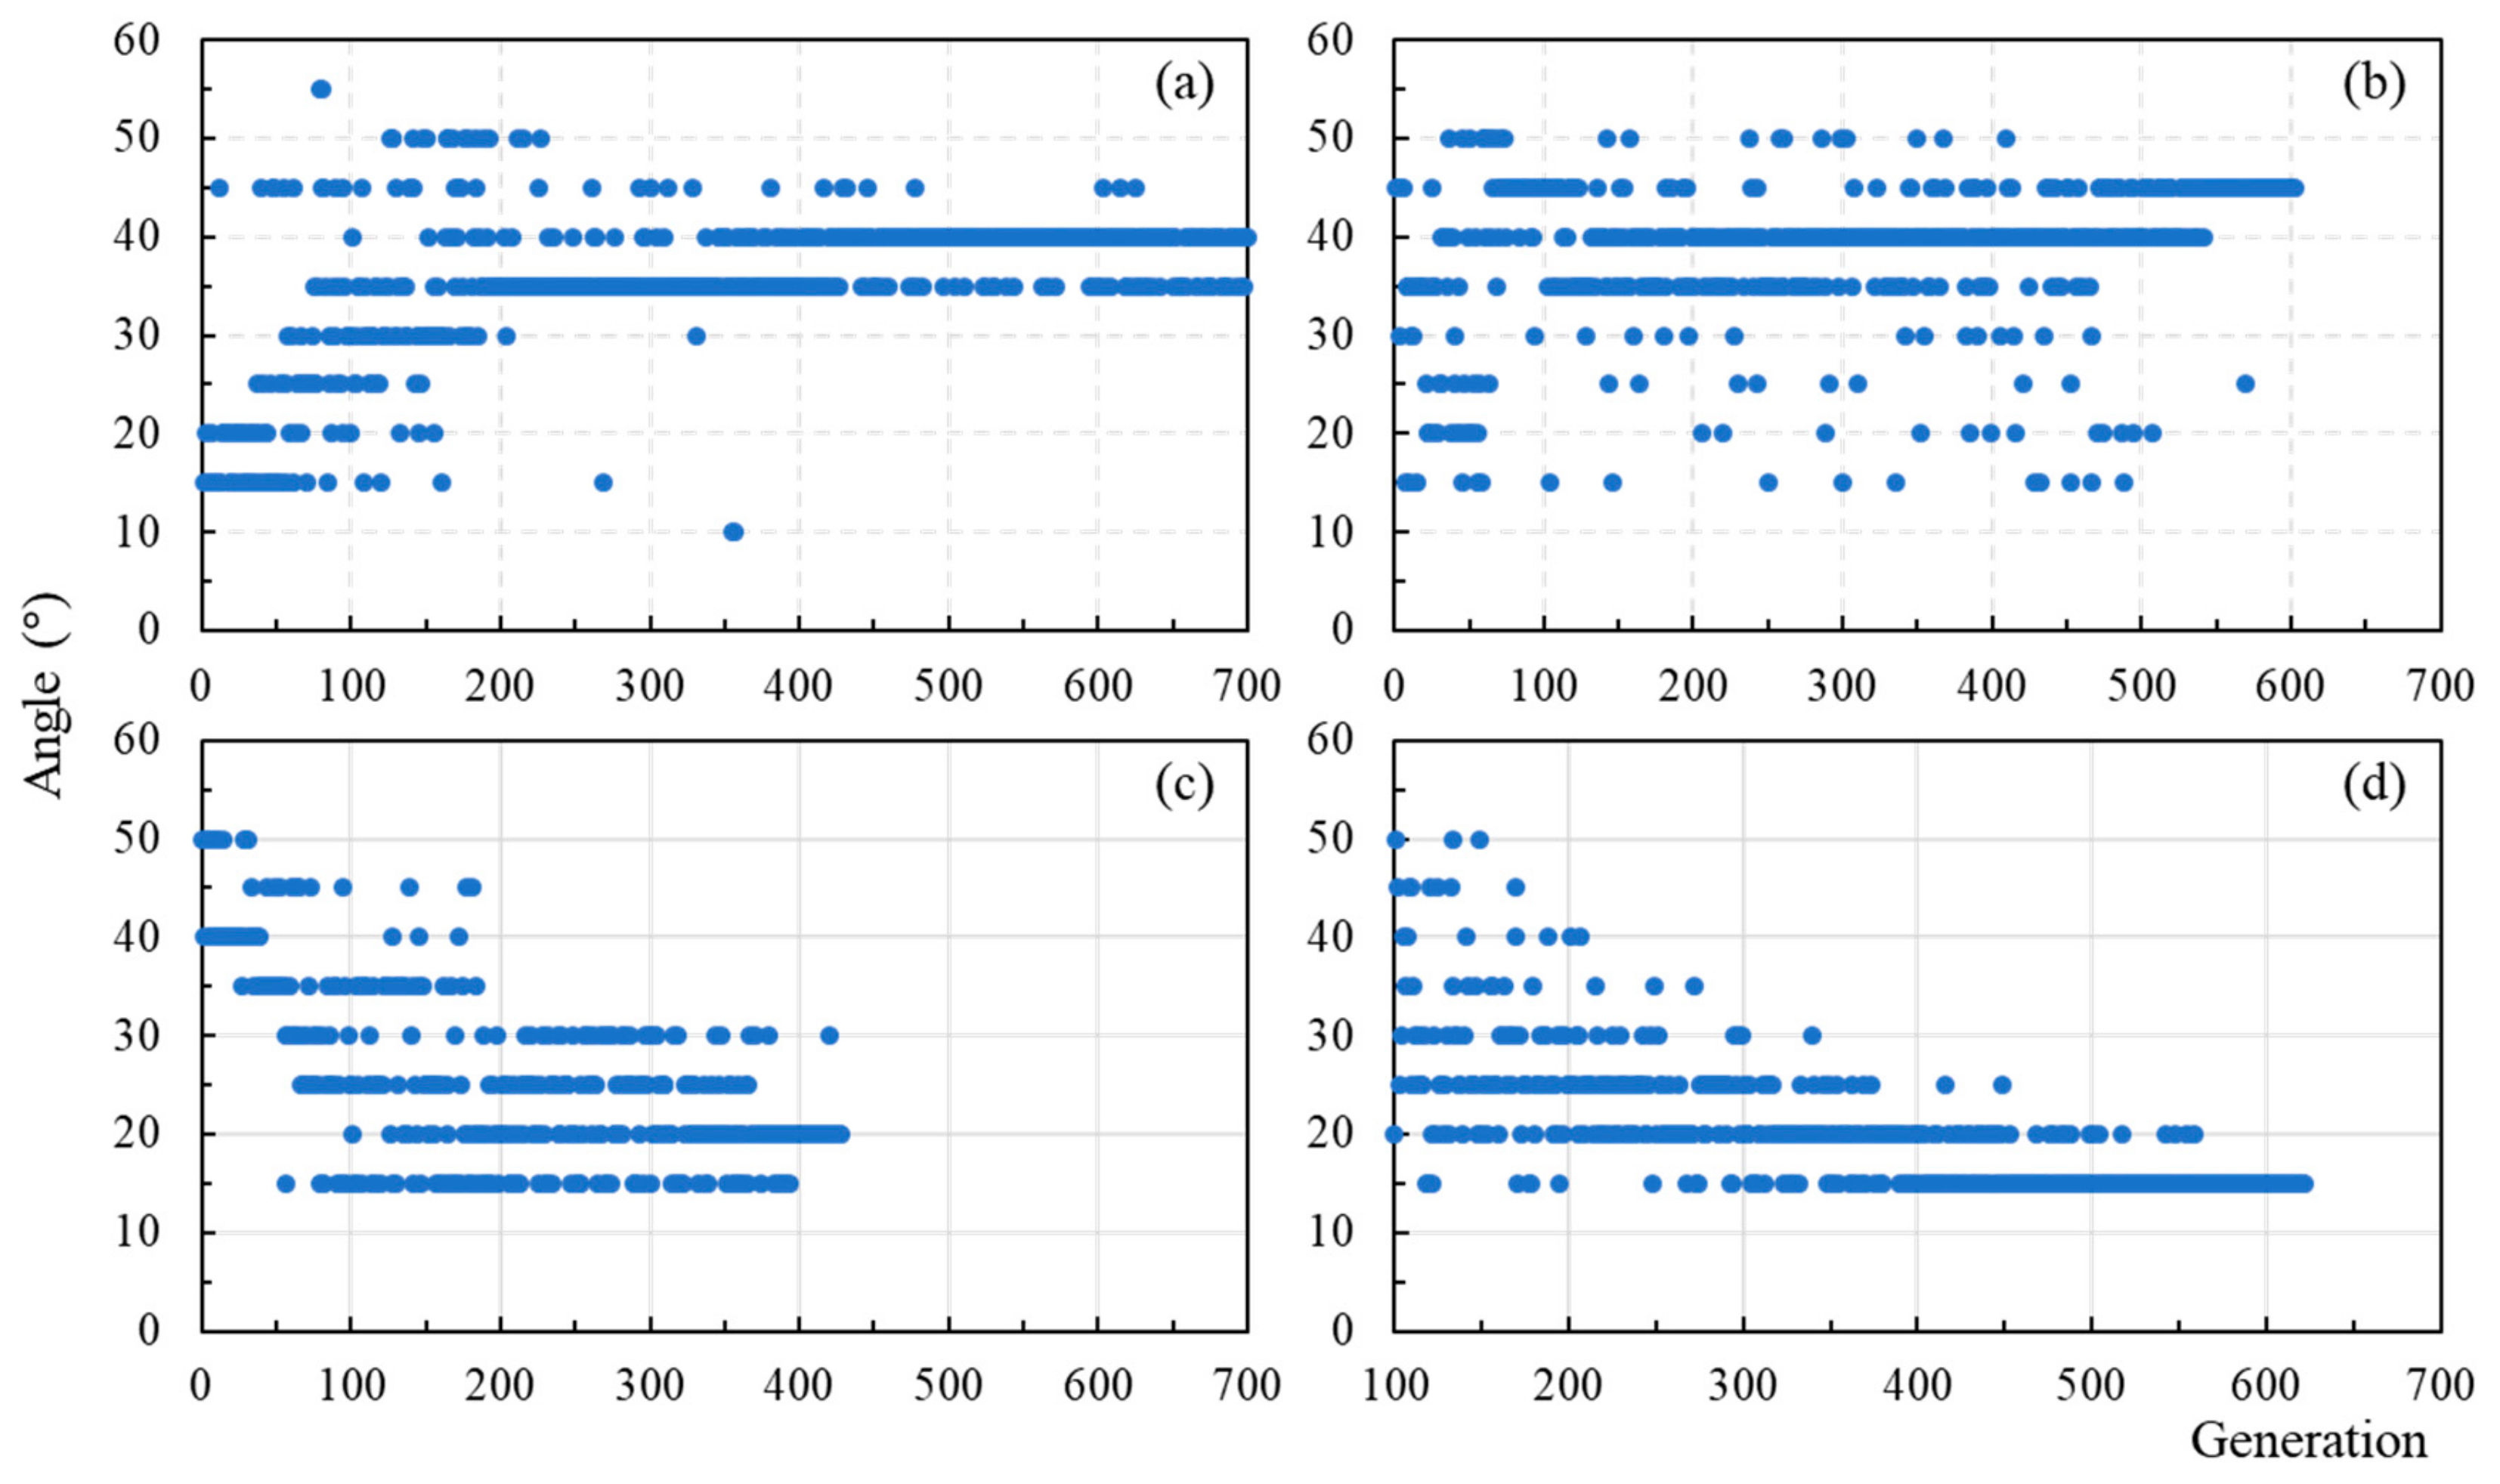
3.1.1. Results of Urban Block Design Parameters

a. Street Orientation

For street orientation, a range from 0 to 90° and a granularity of 5° was set for the optimization. As shown in Figure 8, along with the increase of thermal, the angles of the four block types have also approached the values within a certain scope: the angle variation scope of the pillar-type block finally lies between 35°and 40°; the angle variation scope of the strip-type block finally lies around 45°; the angle variation scope of the dot-type block finally lies around 20°; the angle variation scope of the courtyard-type block finally lies around 15°. Different basic block types correspond to the different best angles, but their scopes all lie between 15° and 45°, which partially overlaps the best angle range of 25°–50°.

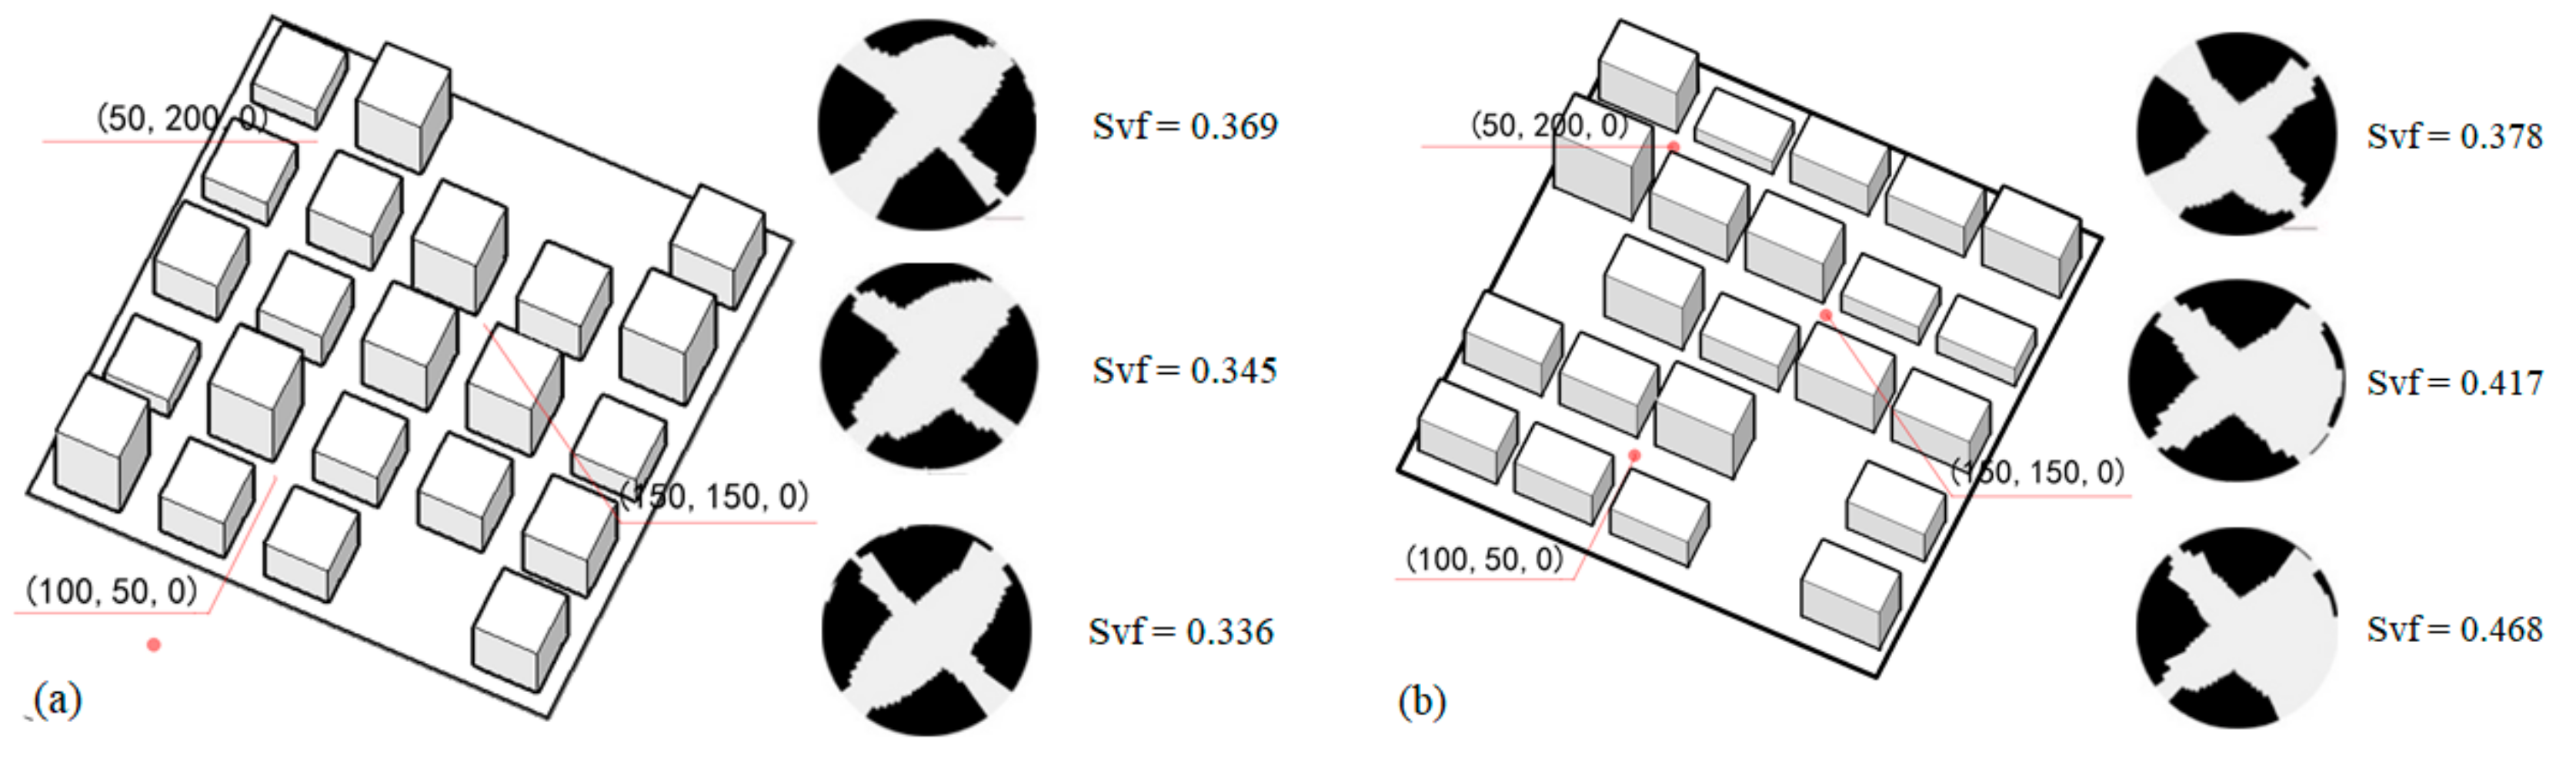
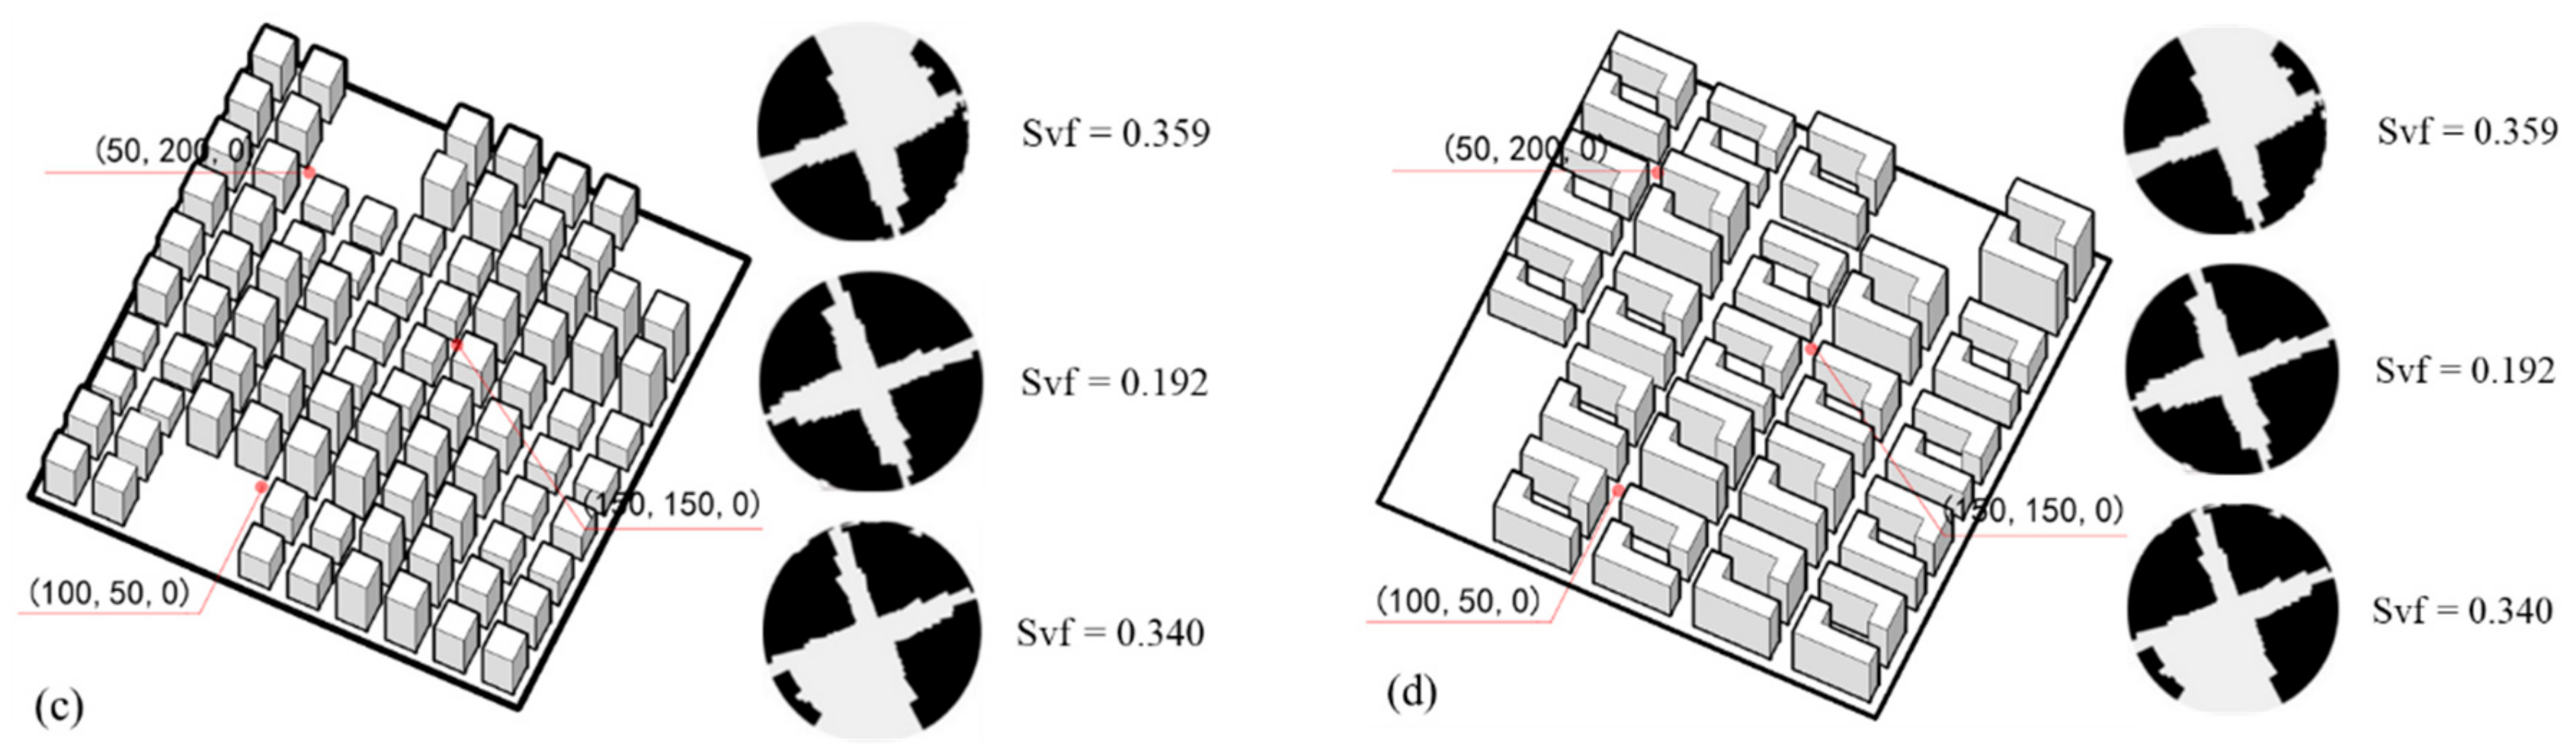
b. Sky Visibility Coefficient
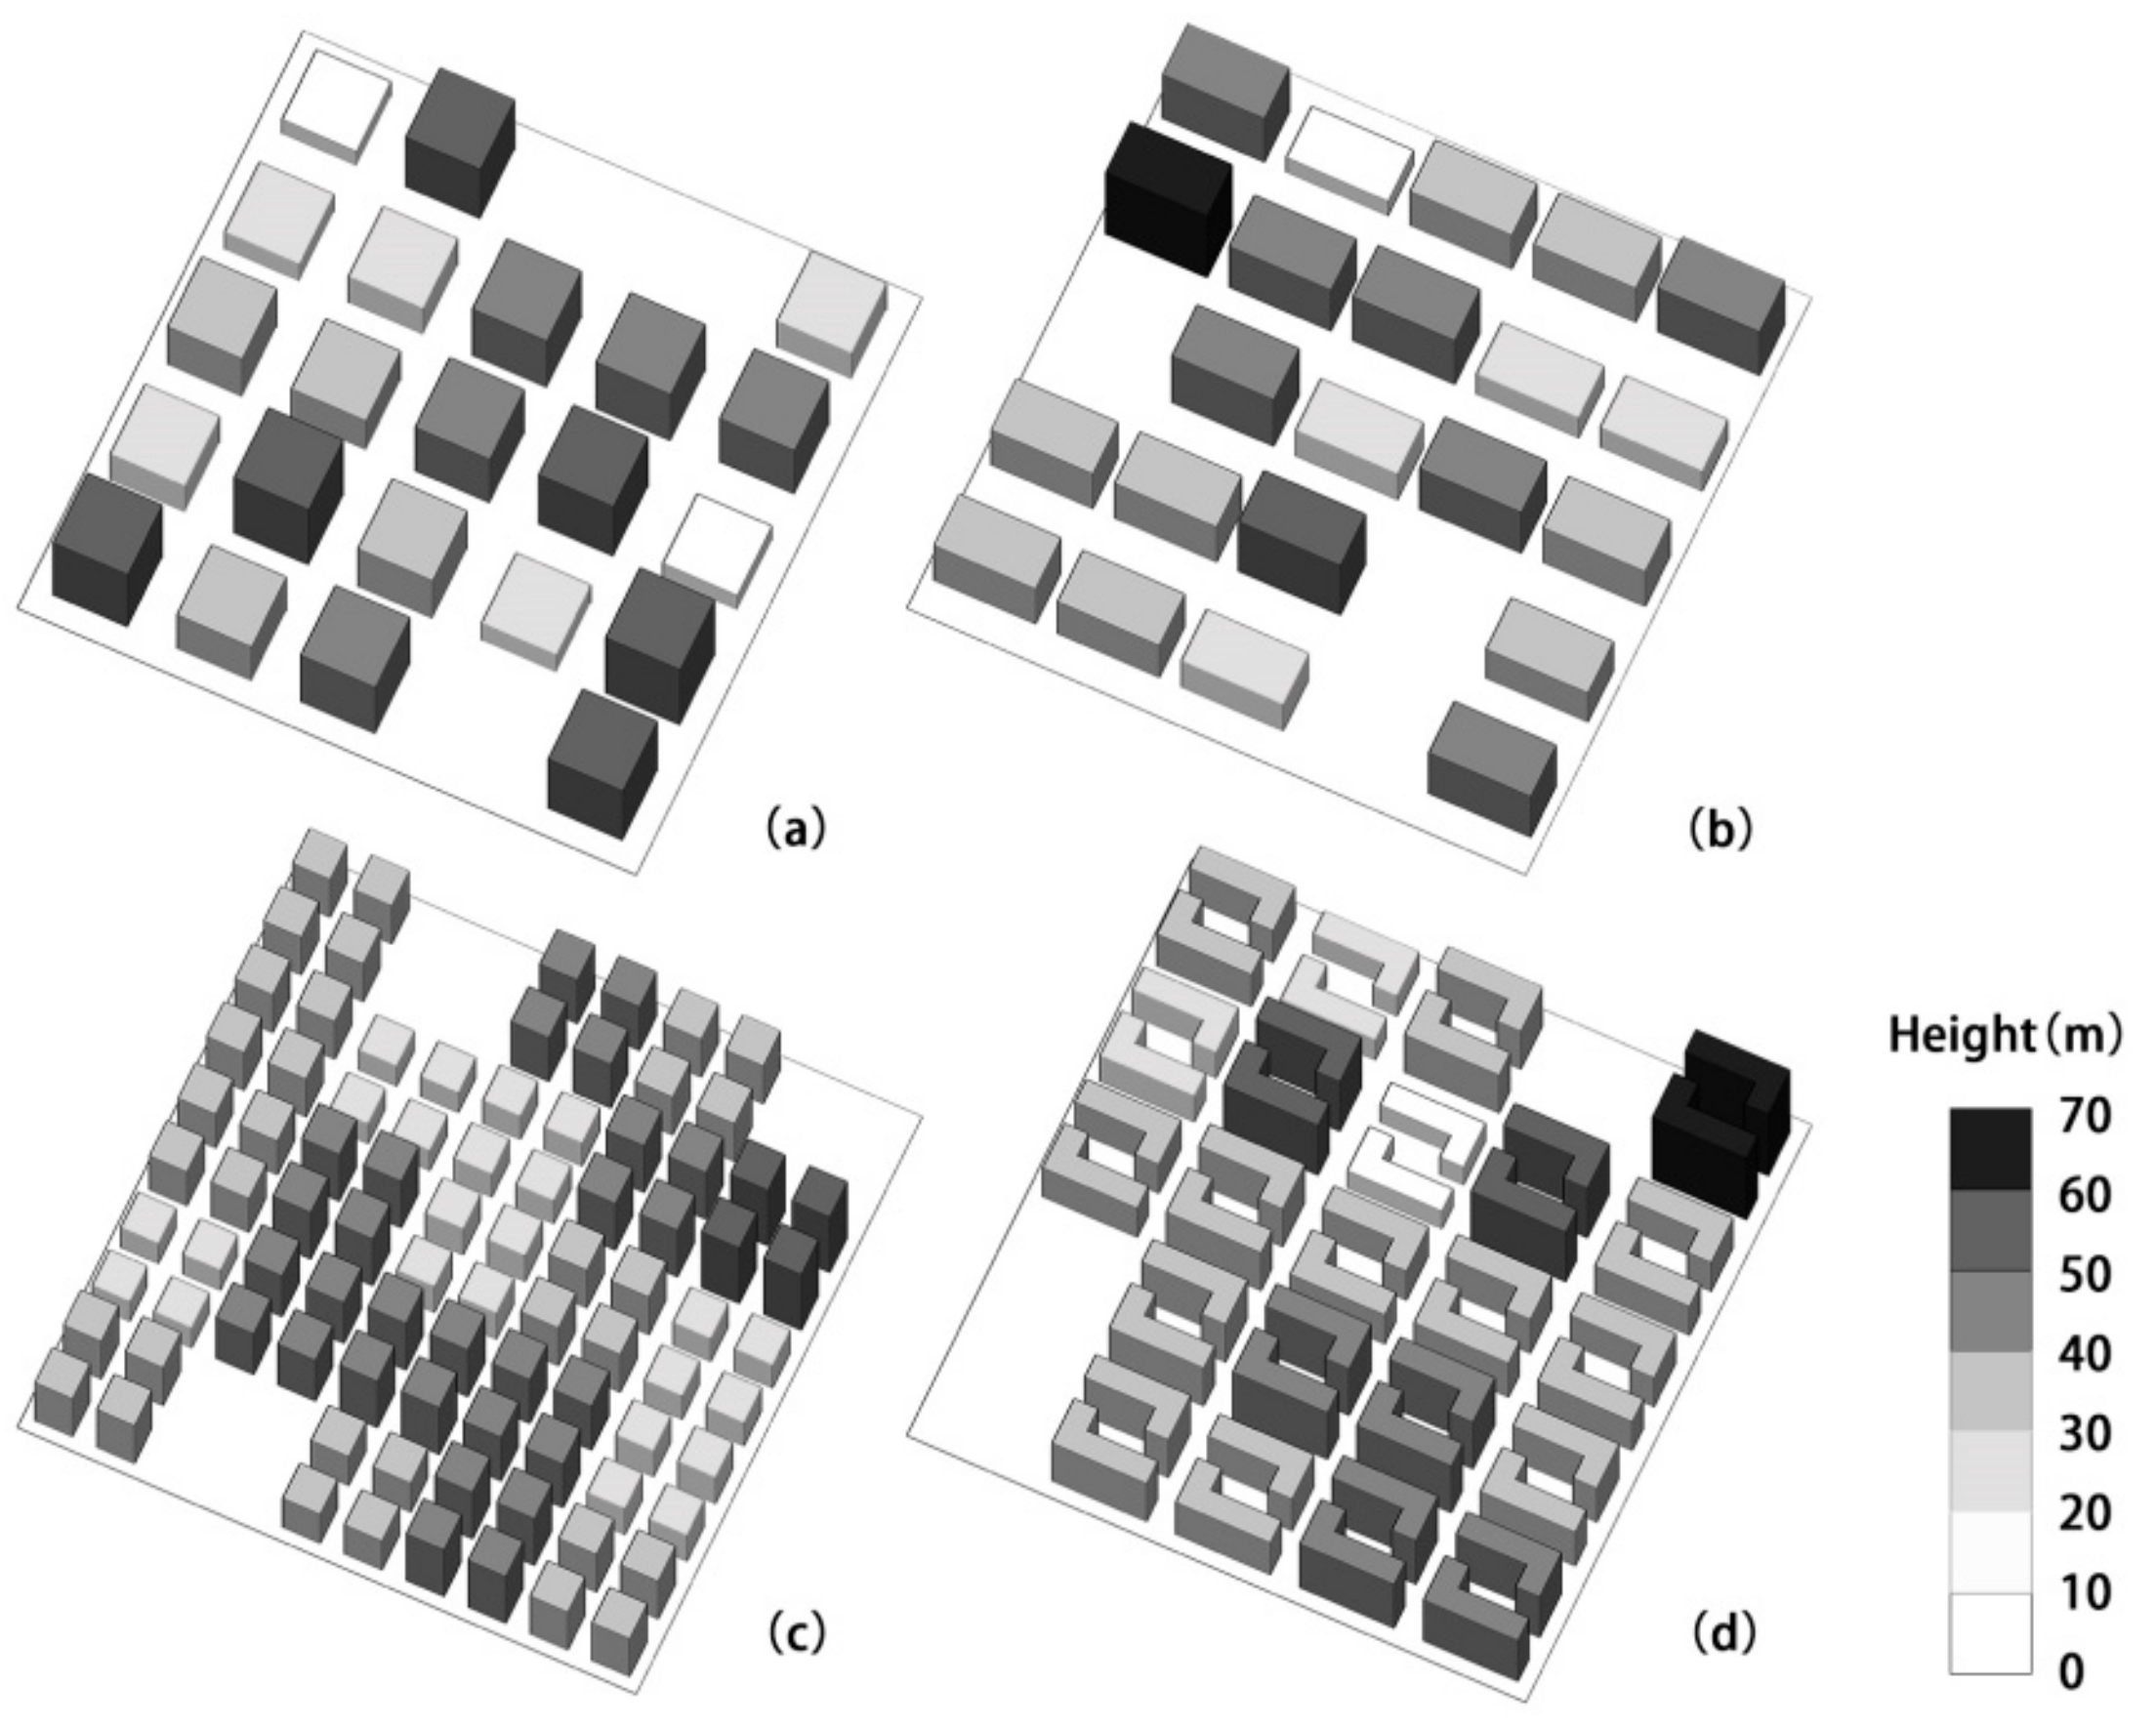
Figure 9 selects the best layouts of the four block types and analyzes the SVF of the random three dots evenly distributed in the site, with their coordinates being (50, 200), (150, 150), and (100, 50) for the SVF results pillar-type, strip-type, courtyard-type, and dot-type, respectively. SVF is one of the important parameters that represents the spatial structure forms of blocks. Usually, cities in dry and hot areas present a highly-dense and narrow structure form of street space, just like the dot-type block. This form tremendously reduces the visible field of sky. The decline of the SVF value can lessen the solar radiation received by streets, thus affecting the comfort of blocks.

c. Building Height

Along with the increase of the outdoor thermal comfort, the height change of various buildings in the four blocks is shown in Figure 10. Building height varies between 0–100 m and finally becomes stable mainly between 15 m and 60 m, equivalent to the height of 5–20 stories. From Figure 10, we can infer, in the best layout of the four block types, that various basic units have equivalent heights, and there is no single building with a height of less than 15 m, which can prevent the excessive sunshine of the surrounding ground from affecting the MRT of blocks. In addition, in the best layout, the high and low degree of dislocation of buildings is smaller, and such building distribution gives the blocks a gentle and even contour line, so that an inwardly-closed form structure of block space can emerge, conducive to preventing sandstorms from reaching the deep inside of the blocks. On the other hand, high buildings are usually close to open space, which benefits the shading from high buildings on open space to reduce the MRT of open space.

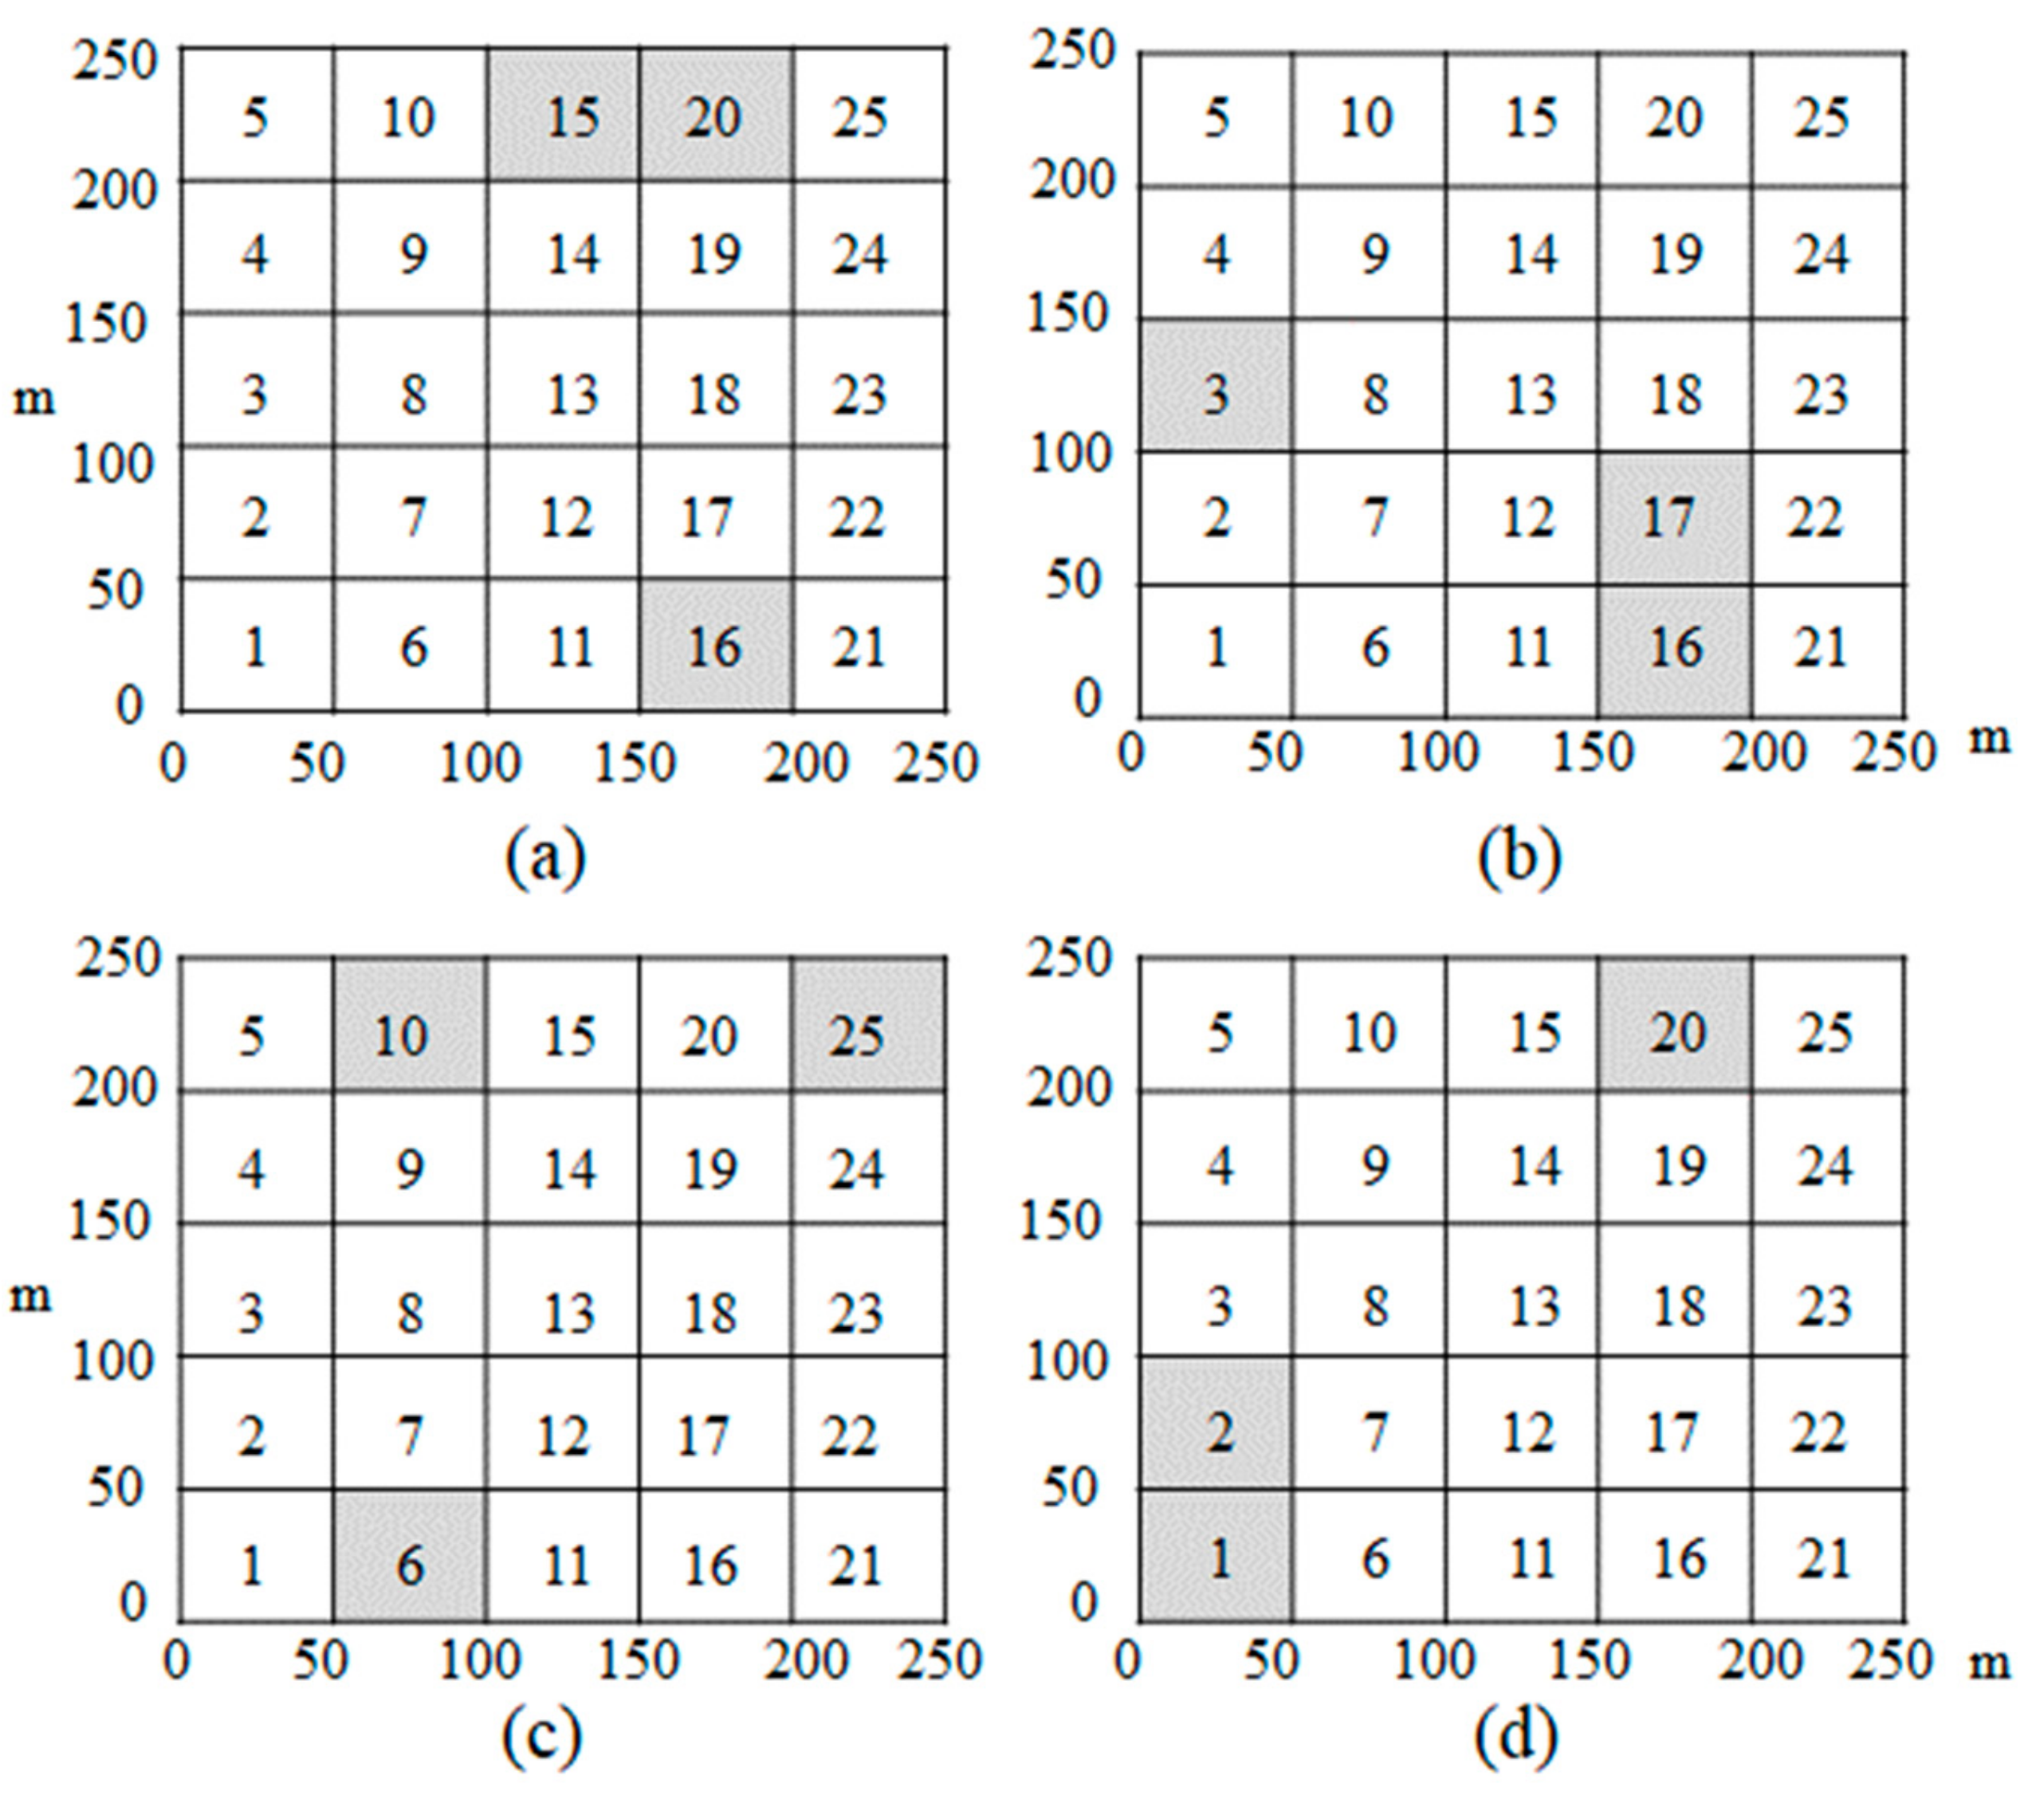
d. Open Space Layout

The grid of the research base is 5m×5 m and by naming grid space in the order from 1 to 25, we can obtain the open space distribution of the four block types as shown in Figure 11. Along with the optimization of outdoor thermal comfort, the open spaces of different blocks finally lie at different locations. The open spaces of the pillar-type block are mainly distributed in the north, south, and middle of the land parcel, and also the pillar-type shares the biggest area of open space. The open spaces of the strip-type block are mainly distributed in the west and middle of the base. The open spaces of the dot-type block are mainly distributed in the south and in the north. The open spaces of the courtyard-type block are mainly distributed in the north, and the west-south. In addition, in the better building layouts, there are generally higher buildings around the open spaces for screening, thus bringing shade to the open spaces.

3.1.2. Results of Climatic Indices

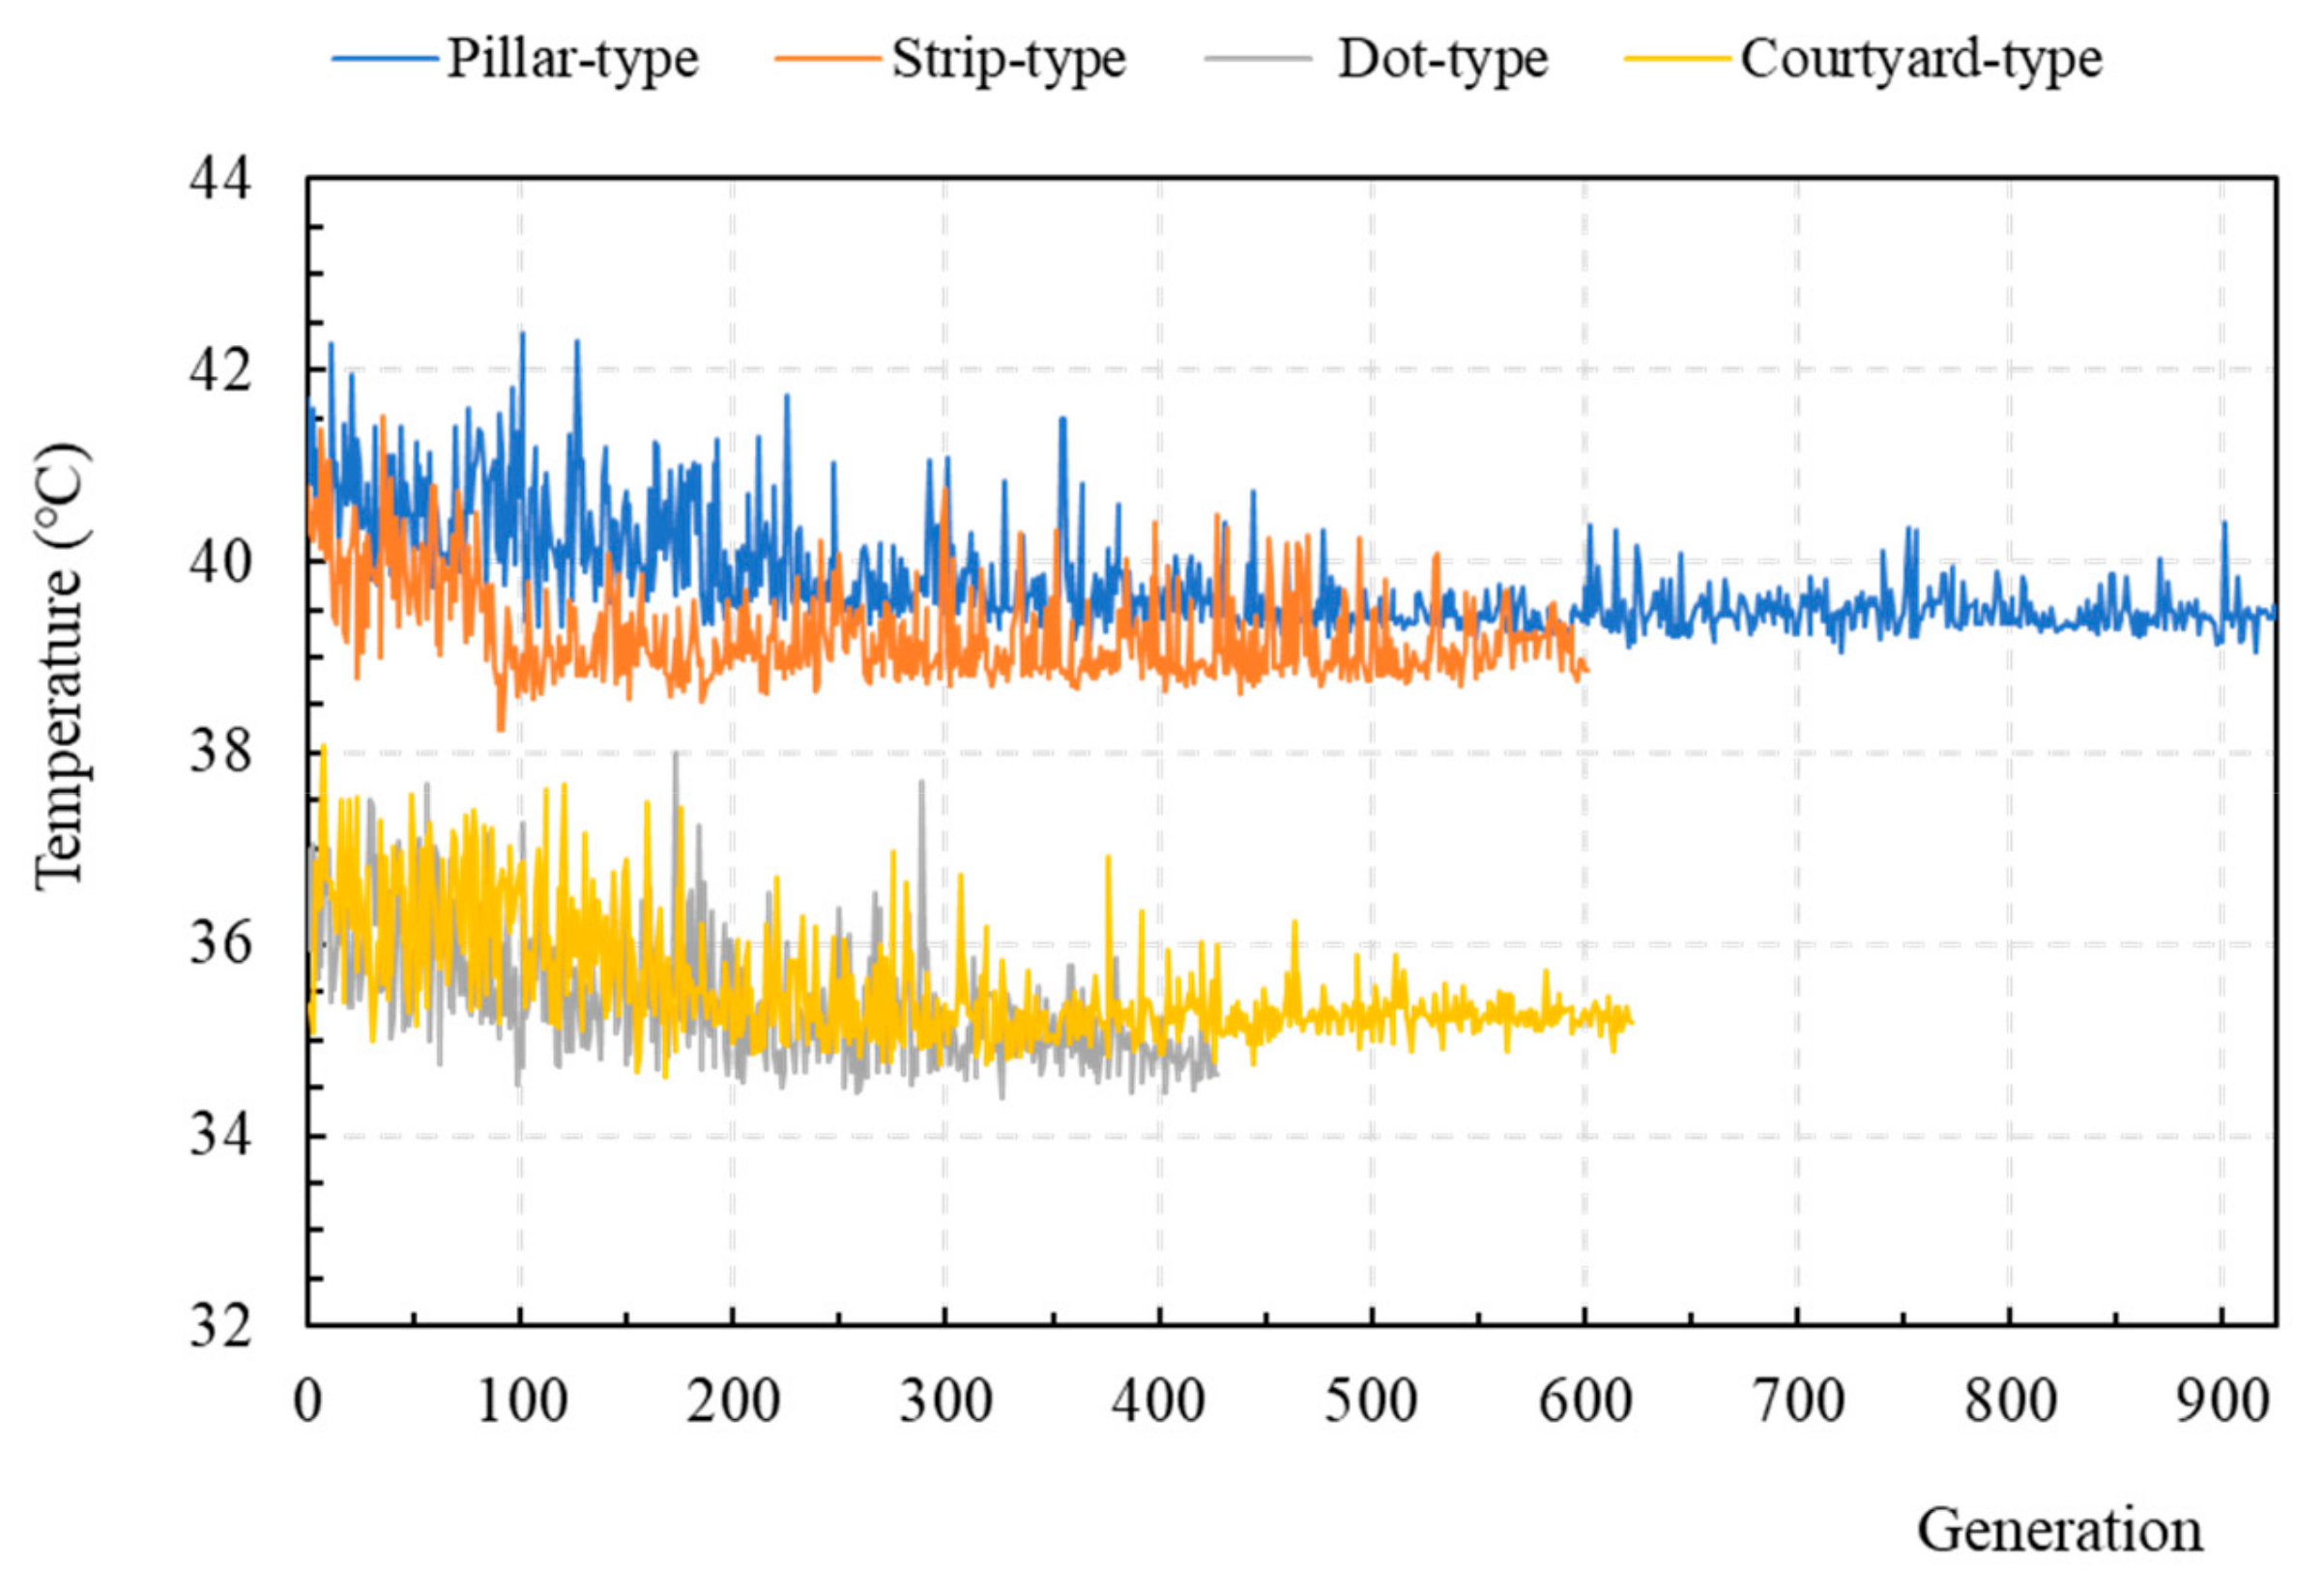
a. Mean Radiation Temperature

Solar thermal radiation is one of the important factors that affects the outdoor UTCI. Along with the optimization of thermal comfort, the average solar thermal radiation temperature values of the four block types all show a declining trend. Therein, as shown in Figure 12, the blue line denotes the variation trend of the MRT of the pillar-type block, declining from 41 to 39.5 °C, while the orange line for the strip-type block, declining from 40 to 38.8 °C, the grey line for the dot-type block, declining from 36 to 35 °C, and the yellow line for the courtyard-type block, declining from 36.5 to 35.2 °C. As the plot ratios and building densities of blocks are fixed, the solar radiation received by the grounds of the dot-type and enclosure-type blocks is far smaller than that received by the grounds of the pillar-type and strip-type blocks. The average radiation temperature of the dot-type and enclosure-type blocks is 4–5 °C smaller than that of the pillar-type and strip-type blocks.

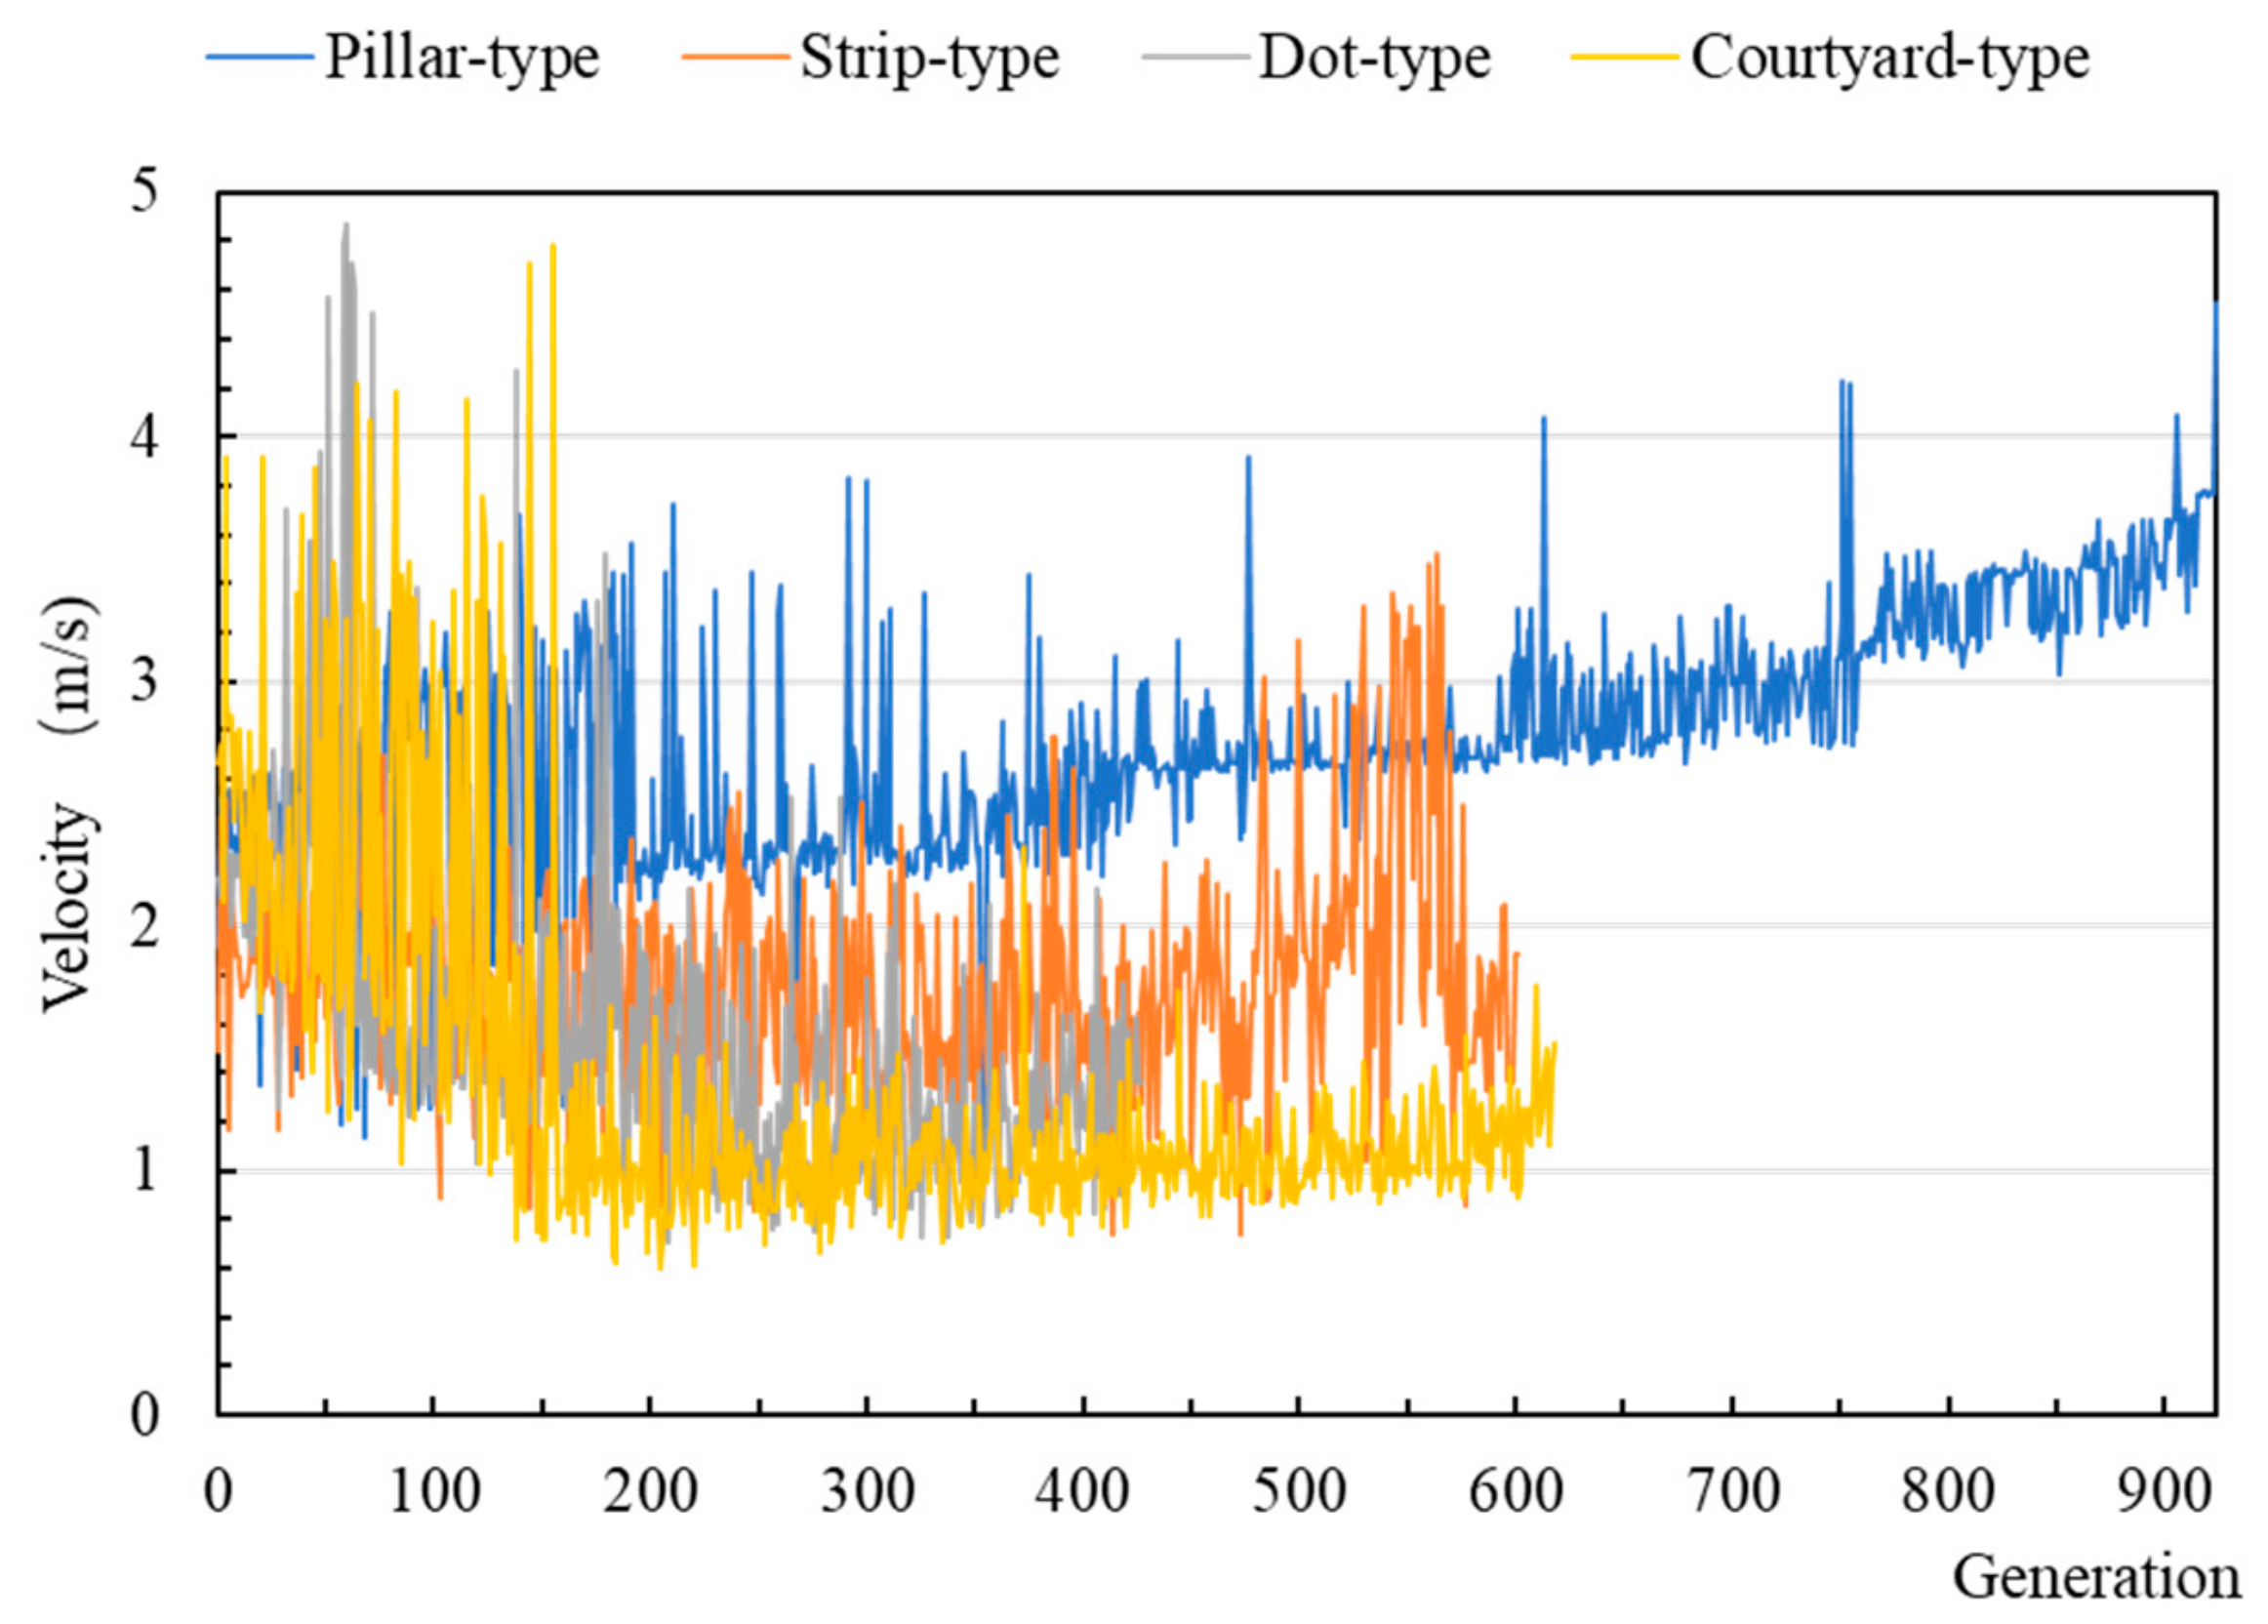
b. Average Wind Speed

Just as shown in Figure 13, the blue line denotes the average wind speed variation of the pillar-type block, with the wind speed fluctuating sharply at the beginning, and finally remaining stable at 3m/s. The orange line denotes the average wind speed variation of the strip-type block, with the wind speed starting at 1.75 m/s and finally fluctuating between 1.5 m/s and 3 m/s. The grey line denotes the average wind speed variation of the dot-type block, with the wind speed fluctuating sharply at the beginning, starting at 1.5 m/s and finally fluctuating around 1.25 m/s. The yellow line denotes the average wind speed variation of the courtyard-type block, with the wind speed fluctuating sharply at the beginning, starting at 2.5 m/s and finally fluctuating around 1.25 m/s. Along with the optimization of thermal comfort, the rising trend of the average wind speed of the pillar-type and the strip-type block is more obvious, while the wind speed of the dot-type and courtyard-type block is higher at the beginning and declines after that. This can be attributed to the fact that the height of the buildings in the northwest of the block is lower at a stage with a poor comfort, thus bringing a lot of wind to the base; the building height remains stable at a certain value along with the progress of optimization, and the average wind speed of the base declines accordingly. There is an obvious difference among the average wind speeds of different block types.
Table 3 concludes the optimization results for four basic block types. Specifically, regarding solar radiation, the pillar-type block has the biggest ground solar radiation and has the widest open street; the dot-type block and the courtyard-type block have the smallest ground solar radiation. The block layout of those types always occurs in desert areas with a dry and hot climate. With regard to wind speed, the pillar-type block has the most effective mode of ventilated building combination and has satisfactory ventilation effects at different angles of street orientation. The strip-type block parallel with the wind direction has a higher wind speed, but the strip-type block which has a certain angle with the wind direction can resist part of the wind speed. The closed courtyard-type block and the dense dot-type block have the lowest space wind-speed.

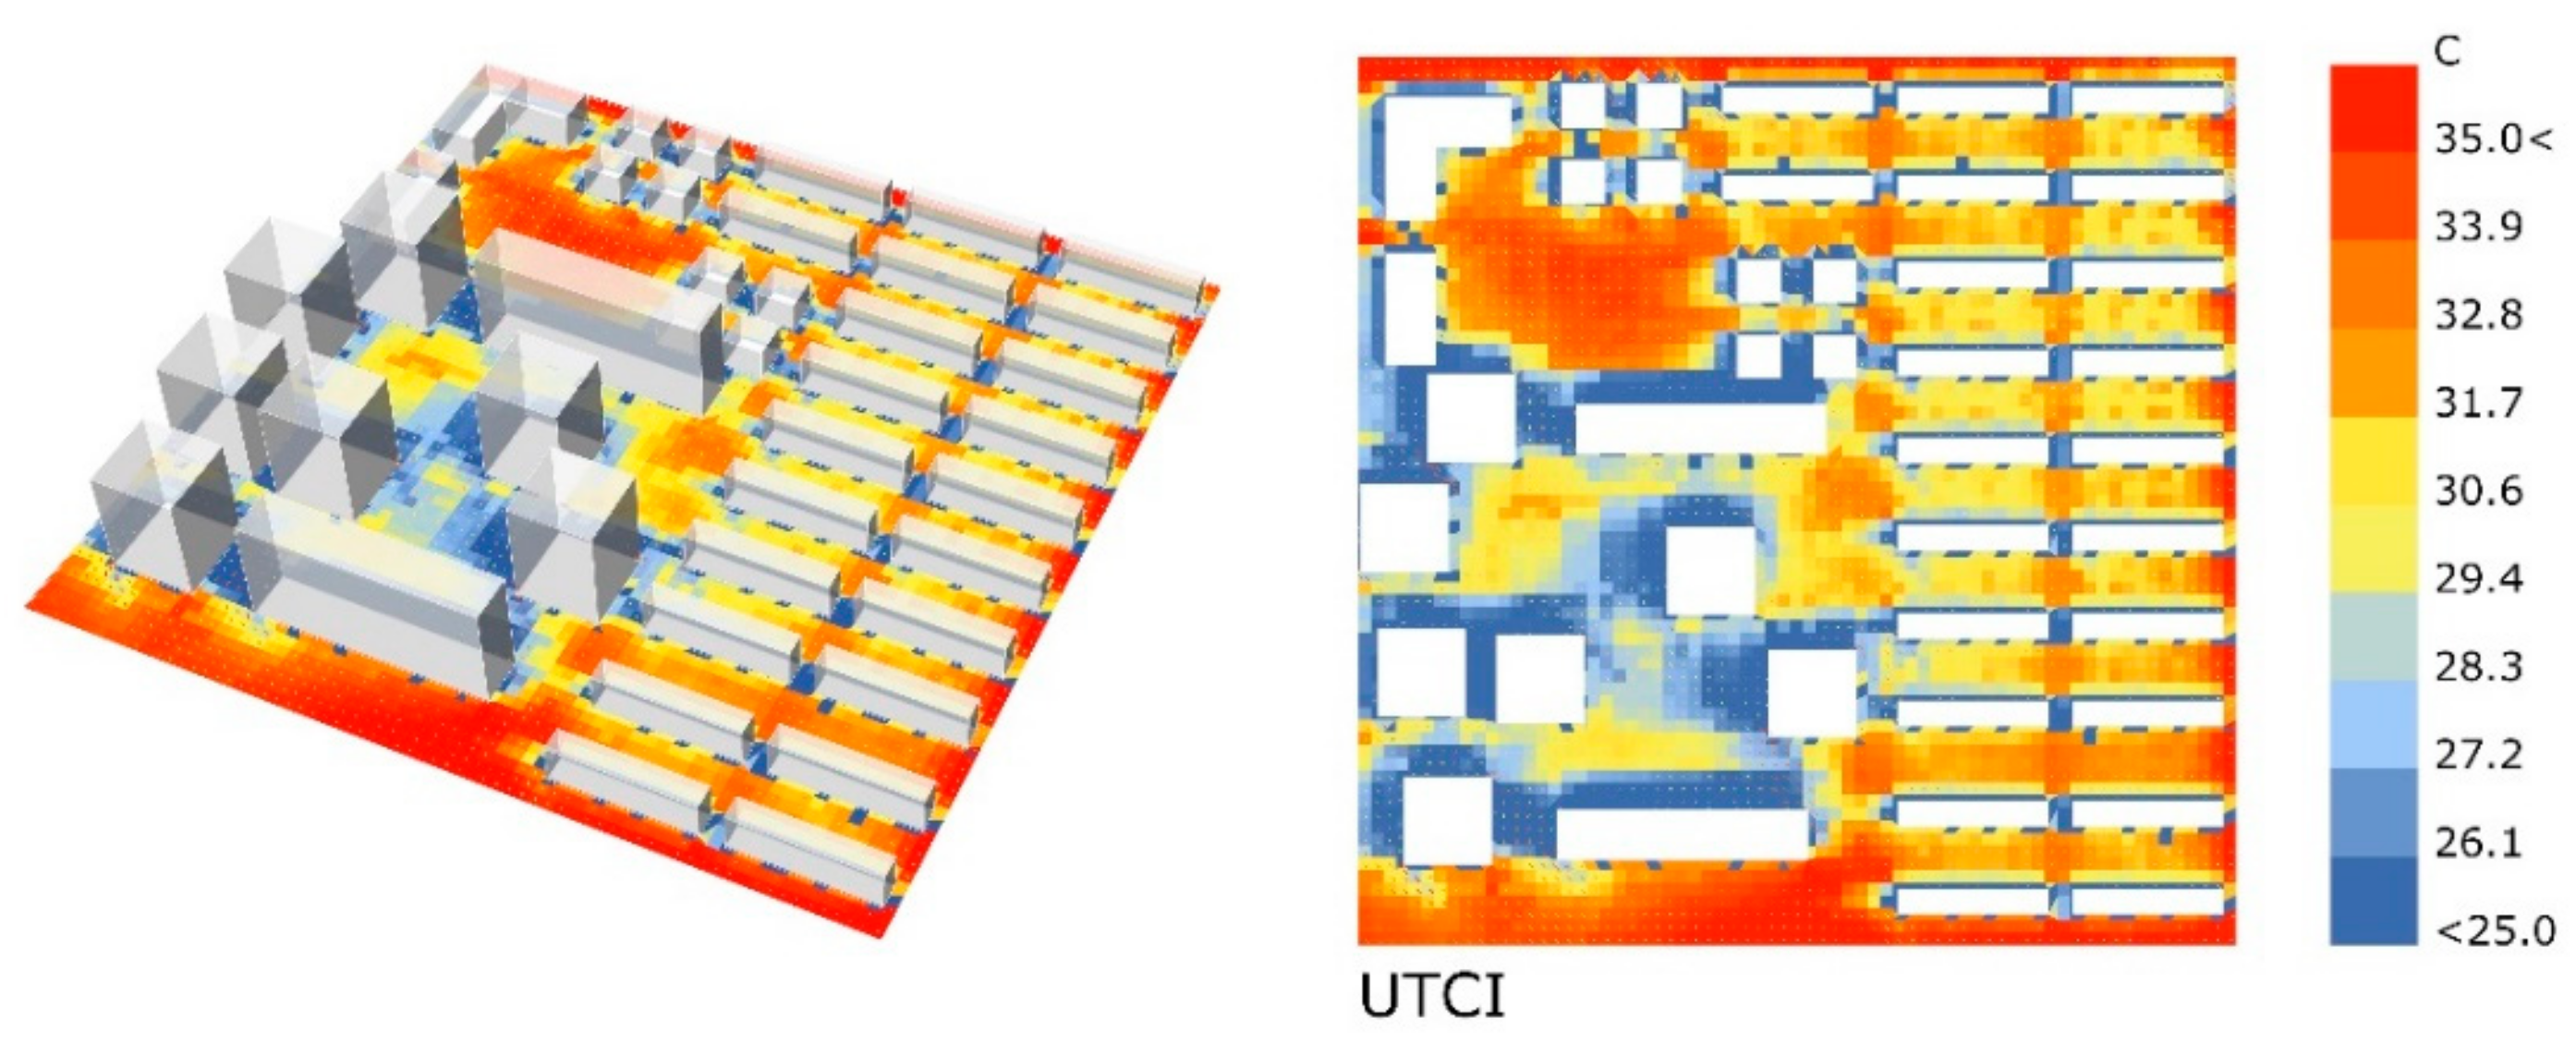
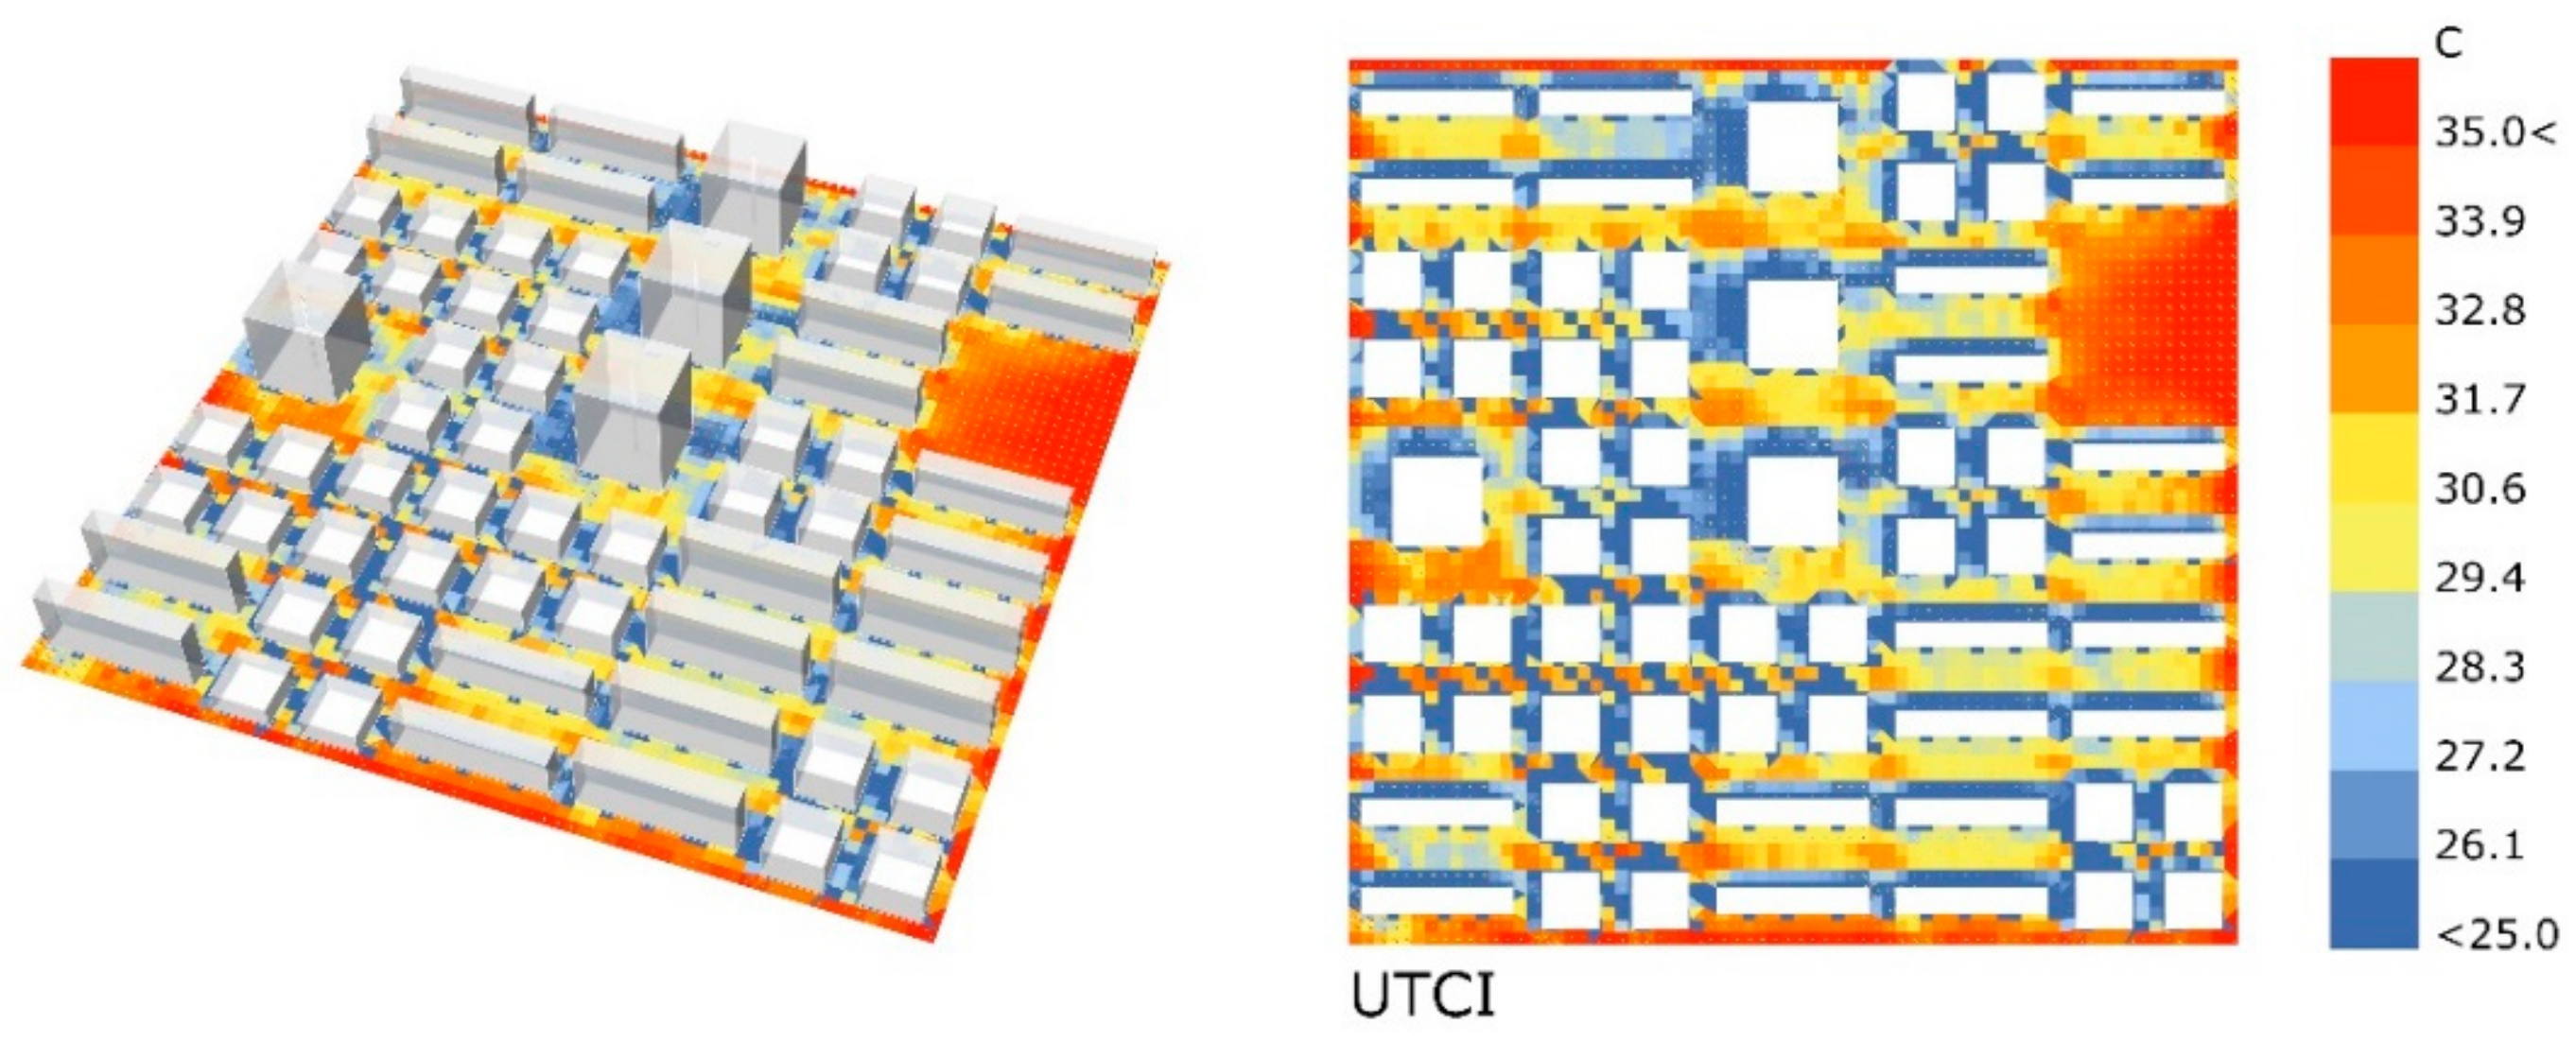
3.2. Results of Actual Urban Block

For an actual urban block, the plot ratio and the building density are set as 1.8 and 0.24, respectively. The best optimized UTCI is 27.43 °C and in the arrangement of the best results, the number of basic building type are 4 for the pillar type, 10 for the strip type, and 10 for the dot type. Those buildings with 1–5 floors are the dot, those with 6–10 floors are the strip, and those with more than 10 floors are the pillar. The location distribution of open spaces is mainly subject to solar radiation and wind. Since the simulation period of the research is set as from 10:00 am to 16:00 pm, when located in the east of the land parcel, open spaces can be sheltered by more buildings in the west and are not subject to too much sunshine in the afternoon, and the location of open spaces in the north can quicken the air flow inside the base, so more open spaces are distributed in the northeast.
The simulation of the actual block optimization shows that, regarding the urban design of the areas with a dry and hot climate, if the plot ratio and building density are fixed, by changing the number and location distribution of various basic building types in the block through optimization, we can obtain a better layout, thus affecting the formation of urban microclimate and outdoor comfort. Figure 14 shows the UTCI results for the original layout and optimized layout, and Table 4 shows the results for UTCI, MRT, and average wind speed of the original layout and optimized layout. We can see that the optimization can reduce the UTCI from 31.17 to 27.43 °C, decreasing by about 3.74 °C, and can reduce MRT from 43.94 to 41.29 °C, decreasing by about 2.65 °C, although the average wind velocity in summer decreases slightly by about 0.07 m/s. The results show that the optimization method can achieve better thermal comfort of the urban block.

4. Discussion

4.1. Implications

From dry and hot areas, this study has established a set of methods of urban automatic generation, optimization, and evaluation with the outdoor comfort as the optimization objective, thereby exploring a new method of urban design. During the optimization, the genetic algorithm can evolve steadily under specific constraints and thereby provide more pertinent and optimal layout schemes, which refers to real urban design situation that should adapt to optimal comfort as well as be confined to resources. In this study, the urban block area, building density, and plot ratio are fixed. Compared with the original block, the increase of the dot basic type can optimize the microclimatic environment of the block. Using the spatial structure form of highly-dense, compact, and narrow streets is an effective method to improve urban climate comfort in dry and hot areas. With regard to the urban design based on climatic adaptability in dry and hot areas, the basic building types with a higher degree of fragmentation should be designed as much as possible. According to the wind environment, the rise of wind speed has different impacts on outdoor thermal comfort. If there are lakes, woods, and other surface textures with the property of reducing the temperature and increasing the humidity at the upper draught, we suggest that the pillar-type block conductive to all-round wind guidance and the strip-type block parallel with the wind direction should be selected, and the wind from the upper direction should be used to reduce the temperature, increase the air humidity of the block, and optimize outdoor thermal comfort. Regarding some blocks with sandstorms, although a higher wind speed can carry away some heat of streets, it will bring more sandstorm trouble to the city. Therefore, we suggest that the dot-type and enclosure-type blocks should be adopted to reduce the wind speed and alleviate the impact of sand dust on outdoor comfort.
This study can be carried out before the specific work of urban design begins. As the preliminary evaluation of effective urban morphology and climatic characteristics, it can help designers intuitively understand the microclimatic characteristics of different urban forms and provide intuitive guidance for their subsequent design process based on climatic adaptability. This study can provide the simple geometric rules of global significance based on climatic adaptability, which makes the urban design of block scale more logical: from a design process relying solely on design guidelines to a completely rational design process evaluating and improving the design scheme with qualitative and quantitative methods. Those rules can avoid the repetition of the process of simulation and modification caused by the lack of scientific guidance in urban design, to help designers to study and screen schemes, and significantly improve the efficiency of urban design.

4.2. Limitations

Also, this study yields some limitations, firstly, regarding the basic building types, the objective of this study is to extract the simplified urban form types, indices and regular modes of building combination layout in the actual block. Due to the diversity of real urban forms, this study fails to cover all the urban form types on the block scale in dry and hot areas, as well as all the variation ranges of the form indices. Secondly, regarding the urban scale, this study focuses on the issue of the block forms impacting on such climate factors to change the outdoor thermal comfort of the human body, which is a simplified method to study urban forms on the block scale. The scale of single buildings, the urban scale within a larger scope, and the impacts of such landscape aspects as vegetation, water, and pavement on the comfort have not been taken into account in the study. Thirdly, for climate elements, this study focuses on the scale of urban microclimate but does not involve the climate within a larger scope. Also, because the dry and hot climatic conditions in the study are based on the meteorological data in July (the hottest month) in Kashgar, the study focused on the relatively extreme seasonal climatic conditions and did not give any consideration to winter and transitional seasons in dry and hot areas. Finally, the genetic algorithm was used as the optimization algorithm in this study, and the judgment standard was the outdoor thermal comfort of the human body (UTCI) as a single assessment standard, however, on one hand, more optimization algorithms should be adopted, e.g., a heuristic algorithm, Q-learning and so on, to solve more complex and feasible issues as well as improve the efficiency of optimization. On the other hand, more indices should be introduced in the future works, e.g., the PET as well as the indoor comfort of human body and the responded energy consumption of the buildings, which have not been considered.

5. Conclusions

Based on the study of urban morphology and urban climate elements, this study attempts to explore a design method for the automatic generation and optimization of blocks based on the outdoor thermal comfort, and then puts forward the urban design strategy and method based on climate adaptability in dry and hot areas. Optimization can reduce the UTCI from 31.17 to 27.43 °C, decreasing by about 3.74 °C and reduce MRT from 43.94 to 41.29 °C, decreasing by about 2.65 °C, although the average wind velocity in summer decrease slightly about 0.07 m/s. The results show that the optimization method can achieve better thermal comfort for an urban block. This study can further improve the efficiency of urban design and block layout design in dry and hot areas. For future studies, additional factors that have an impact on the urban layout in dry and hot areas can be added to the system for consideration and adjustment, such as the green space. Further with the advancement and affordability of powerful urban computing and simulation tools, optimization methods have become tools that are adopted by researchers and practitioners to improve urban planning and design.

Author Contributions

Conceptualization, methodology, formal analysis and writing—original draft: X.X., C.Y.; Simulation, data analysis, and visualization: X.X., C.Y., Q.L.; Writing—discussion of the original draft: X.X., C.Y., Q.L.; Writing—revision & editing: X.X., W.W., and N.X.; Supervision: T.H.

Funding

The work described in this study was sponsored by the projects of the National Natural Science Foundation of China (NSFC#51678127), the National Scientific and Technological Support during the 12th Five-Year Plan Period (No.: 2013BAJ10B13), and Beijing Advanced Innovation Center for Future Urban Design (UDC# 016010100). Any opinions, findings, conclusions, or recommendations expressed in this study are those of the authors and do not necessarily reflect the views of the National Scientific and Technological Support committee and NSFC. This work was also supported by the Assistant Secretary for Energy Efficiency and Renewable Energy, the U.S. Department of Energy under Contract No. DE-AC02-05CH11231.

Conflicts of Interest

The authors declare no conflict of interest.

References

  1. Nouri, A.S.; Costa, J.P. Addressing thermophysiological thresholds and psychological aspects during hot and dry mediterranean summers through public space design: The case of Rossio. Build. Environ. 2017, 118, 67–90. [Google Scholar] [CrossRef]
  2. Crawley, D.B. Estimating the impacts of climate change and urbanization on building performance. J. Build. Perform. Simul. 2008, 1, 91–115. [Google Scholar] [CrossRef]
  3. Xu, X.; Wu, Y.; Wang, W.; Hong, T.; Xu, N. Performance-driven optimization of urban open space configuration in the cold-winter and hot-summer region of China. Build. Simul. 2019, 1–14. [Google Scholar] [CrossRef]
  4. Jhaldiyal, A.; Gupta, K.; Gupta, P.K.; Thakur, P.; Kumar, P. Urban Morphology Extractor: A spatial tool for characterizing urban morphology. Urban Clim. 2018, 24, 237–246. [Google Scholar] [CrossRef]
  5. Wang, Y.; Berardi, U.; Akbari, H. Comparing the effects of urban heat island mitigation strategies for Toronto, Canada. Energy Build. 2016, 114, 2–19. [Google Scholar] [CrossRef]
  6. Wen, C.Y.; Juan, Y.H.; Yang, A.S. Enhancement of city breathability with half open spaces in ideal urban street canyons. Build. Environ. 2017, 112, 322–336. [Google Scholar] [CrossRef]
  7. Debbage, N.; Shepherd, J.M. The urban heat island effect and city contiguity. Comput. Environ. Urban Syst. 2015, 54, 181–194. [Google Scholar] [CrossRef]
  8. Chen, L.; Ng, E.; An, X.; Ren, C.; Lee, M.; Wang, U.; He, Z. Sky view factor analysis of street canyons and its implications for daytime intra-urban air temperature differentials in high-rise, high-density urban areas of Hong Kong: A GIS-based simulation approach. Int. J. Climatol. 2012, 32, 121–136. [Google Scholar] [CrossRef]
  9. Ren, C.; Ng, E.Y.; Katzschner, L. Urban climatic map studies: A review. Int. J. Climatol. 2011, 31, 2213–2233. [Google Scholar] [CrossRef]
  10. Adelia, A.S.; Yuan, C.; Liu, L.; Shan, R.Q. Effects of urban morphology on anthropogenic heat dispersion in tropical high-density residential areas. Energy Build. 2019, 186, 368–383. [Google Scholar] [CrossRef]
  11. He, B.J.; Ding, L.; Prasad, D. Enhancing urban ventilation performance through the development of precinct ventilation zones: A case study based on the Greater Sydney, Australia. Sustain. Cities Soc. 2019, 47, 101472. [Google Scholar] [CrossRef]
  12. Touchaei, A.G.; Wang, Y. Characterizing urban heat island in Montreal (Canada)—Effect of urban morphology. Sustain. Cities Soc. 2015, 19, 395–402. [Google Scholar] [CrossRef]
  13. Azhdari, A.; Soltani, A.; Alidadi, M. Urban morphology and landscape structure effect on land surface temperature: Evidence from Shiraz, a semi-arid city. Sustain. Cities Soc. 2018, 41, 853–864. [Google Scholar] [CrossRef]
  14. Fichera, A.; Inturri, G.; La, P.; Palermo, V. A model for mapping the energy consumption of buildings transport and outdoor lighting of neighbourhoods. Cities 2016, 55, 49–60. [Google Scholar] [CrossRef]
  15. Chi, D.A.; Moreno, D.; Esquivias, P.M.; Navarro, J. Optimization method for perforated solar screen design to improve daylighting using orthogonal arrays and climate-based daylight modelling. J. Build. Perform. Simul. 2017, 10, 144–160. [Google Scholar] [CrossRef]
  16. Oh, M.; Kim, Y. Energy for Sustainable Development Identifying urban geometric types as energy performance patterns. Energy Sustain. Dev. 2019, 48, 115–129. [Google Scholar] [CrossRef]
  17. Sarralde, J.J.; Quinn, D.J.; Wiesmann, D.; Steemers, K. Solar energy and urban morphology: Scenarios for increasing the renewable energy potential of neighbourhoods in London. Renew. Energy 2015, 73, 10–17. [Google Scholar] [CrossRef] [Green Version]
  18. Jusuf, S.K.; Tan, C.L.; Ignatius, M.; Wong, N.H.; Tan, E.; Tong, S. Impact of urban morphology on microclimate and thermal comfort in northern China. Sol. Energy 2017, 155, 212–223. [Google Scholar] [CrossRef]
  19. Lau, G.E.; Ngan, K. Analysing urban ventilation in building arrays with the age spectrum and mean age of pollutants. Build. Environ. 2018, 131, 288–305. [Google Scholar] [CrossRef]
  20. Luo, Y.; He, J.; Ni, Y. Analysis of urban ventilation potential using rule-based modeling. Comput. Environ. Urban Syst. 2017, 66, 13–22. [Google Scholar] [CrossRef]
  21. Nagara, K.; Shimoda, Y.; Mizuno, M. Evaluation of the thermal environment in an outdoor pedestrian space. Atmos. Environ. 1996, 30, 497–505. [Google Scholar] [CrossRef]
  22. Koch-Nielsen, H. Stay Cool: A Design Guide for the Built Environment in Hot Climates; Routledge: London, UK, 2015. [Google Scholar]
  23. Chatzidimitriou, A.; Yannas, S. Microclimate design for open spaces: Ranking urban design effects on pedestrian thermal comfort in summer. Sustain. Cities Soc. 2016, 26, 27–47. [Google Scholar] [CrossRef]
  24. Bueno, B.; Norford, L.; Hidalgo, J.; Pigeon, G. The urban weather generator. J. Build. Perform. Simul. 2013, 6, 269–281. [Google Scholar] [CrossRef]
  25. Chun, B.; Guldmann, J. Impact of Greening on the Urban Heat Island: Seasonal. Comput. Environ. Urban Syst. Online 2018, 71, 1–31. [Google Scholar] [CrossRef]
  26. Malings, C.; Pozzi, M.; Klima, K.; Mario, B.; Bou-Zeid, E.; Ramamurthy, P. Surface heat assessment for developed environments: Probabilistic urban temperature modeling. Comput. Environ. Urban Syst. 2017, 66, 53–64. [Google Scholar] [CrossRef]
  27. Oliveti, G.; Arcuri, N.; Ruffolo, S. Experimental investigation on thermal radiation exchange of horizontal outdoor surfaces. Build. Environ. 2003, 38, 83–89. [Google Scholar] [CrossRef]
  28. Peeters, A. A GIS-based method for modeling urban-climate parameters using automated recognition of shadows cast by buildings. Comput. Environ. Urban Syst. 2016, 59, 107–115. [Google Scholar] [CrossRef]
  29. Xu, X.; Luo, F.; Wang, W.; Hong, T.; Fu, X.; Xu, X.; Luo, F.; Wang, W.; Hong, T.; Fu, X. Performance-Based Evaluation of Courtyard Design in China’s Cold-Winter Hot-Summer Climate Regions. Sustainability 2018, 10, 3950. [Google Scholar] [CrossRef]
  30. Wong, N.; Song, J.; Istiadji, A.D. A study of the effectiveness of mechanical ventilation systems of a hawker center in Singapore using CFD simulations. Build. Environ. 2006, 41, 726–733. [Google Scholar] [CrossRef]
  31. Yang, W.; Wong, N.H.; Li, C.-Q. Effect of Street Design on Outdoor Thermal Comfort in an Urban Street in Singapore. J. Urban Plan. Dev. 2016, 142, 05015003. [Google Scholar] [CrossRef]
  32. Mayer, H.; Holst, J.; Dostal, P.; Imbery, F.; Schindler, D. Human thermal comfort in summer within an urban street canyon in Central Europe. Meteorol. Zeitschrift. 2008, 17, 241–250. [Google Scholar] [CrossRef]
  33. Ng, E. Policies and technical guidelines for urban planning of high-density cities—Air ventilation assessment (AVA) of Hong Kong. Build. Environ. 2009, 44, 1478–1488. [Google Scholar] [CrossRef]
  34. Bajšanski, I.V.; Milošević, D.D.; Savić, S.M. Evaluation and improvement of outdoor thermal comfort in urban areas on extreme temperature days: Applications of automatic algorithms. Build. Environ. 2015, 94, 632–643. [Google Scholar] [CrossRef]
  35. Taleb, H.; Musleh, M.A. Applying urban parametric design optimisation processes to a hot climate: Case study of the UAE. Sustain. Cities Soc. 2015, 14, 236–253. [Google Scholar] [CrossRef]
  36. Hu, Y.; White, M.; Ding, W. An Urban Form Experiment on Urban Heat Island Effect in High Density Area. Procedia Eng. 2016, 169, 166–174. [Google Scholar] [CrossRef]
  37. Lindholm, G.; Meerow, S.; Newell, J.P.; Abunnasr, Y.F.; Nakata-osaki, C.M.; Cristina, L.; Souza, L.; Souto, D. THIS—Tool for Heat Island Simulation: A GIS extension model to calculate urban heat island intensity based on urban geometry. Landsc. Urban Plan. 2017, 159, 62–75. [Google Scholar] [CrossRef]
  38. Perini, K.; Chokhachian, A.; Dong, S.; Auer, T. Modeling and simulating urban outdoor comfort: Coupling ENVI-Met and TRNSYS by grasshopper. Energy Build. 2017, 152, 373–384. [Google Scholar] [CrossRef]
  39. Milošević, D.D.; Bajšanski, I.V.; Savić, S.M. Influence of changing trees locations on thermal comfort on street parking lot and footways. Urban For. Urban Green. 2017, 23, 113–124. [Google Scholar] [CrossRef]
  40. Granadeiro, V.; Duarte, J.P.; Correia, J.R.; Leal, V.M.S. Building envelope shape design in early stages of the design process: Integrating architectural design systems and energy simulation. Autom. Constr. 2013, 32, 196–209. [Google Scholar] [CrossRef]
  41. Caruso, G.; Fantozzi, F.; Leccese, F. Optimal theoretical building form to minimize direct solar irradiation. Sol. Energy 2013, 97, 128–137. [Google Scholar] [CrossRef]
  42. Contreras, R.F.; Moyano, J.; Rico, F. Genetic algorithm-based approach for optimizing the energy rating on existing buildings. Build. Serv. Eng. Res. Technol. 2016, 37, 664–681. [Google Scholar] [CrossRef] [Green Version]
  43. Steemers, K.; Baker, N.; Crowther, D.; Dubiel, J.; Nikolopoulou, M.-H.; Ratti, C. City texture and microclimate. Urban Des. Stud. 1997, 3, 25–49. [Google Scholar]
  44. Ratti, C.; Raydan, D.; Steemers, K. Building form and environmental performance: Archetypes, analysis and an arid climate. Energy Build. 2003, 35, 49–59. [Google Scholar] [CrossRef]
  45. Okeil, A. A holistic approach to energy efficient building forms. Energy Build. 2010, 42, 1437–1444. [Google Scholar] [CrossRef]
  46. Lin, Y.H.; Tsai, K.T.; Lin, M.D.; Yang, M.D. Design optimization of office building envelope configurations for energy conservation. Appl. Energy 2016, 171, 336–346. [Google Scholar] [CrossRef]
  47. Yang, D.M.; Chen, Y.P.; Lin, Y.H.; Ho, Y.F.; Lin, J. Multiobjective optimization using nondominated sorting genetic alforithm-II for allocation of energy conservation and renewable energy facilities in a campus. Energy Build. 2016, 122, 120–130. [Google Scholar] [CrossRef]
  48. Fang, Z.; Feng, X.; Lin, Z. Investigation of PMV Model for Evaluation of the Outdoor Thermal Comfort. Procedia Eng. 2017, 205, 2457–2462. [Google Scholar] [CrossRef]
  49. Taleghani, M.; Kleerekoper, L.; Tenpierik, M.; van den Dobbelsteen, A. Outdoor thermal comfort within five different urban forms in the Netherlands. Build. Environ. 2015, 83, 65–78. [Google Scholar] [CrossRef]
  50. Błazejczyk, K.; Jendritzky, G.; Bröde, P.; Fiala, D.; Havenith, G.; Epstein, Y.; Psikuta, A.; Kampmann, B. An Introduction to the Universal Thermal Climate Index (UTCI). Geogr. Pol. 2013, 86, 5–10. [Google Scholar] [CrossRef]
Figure 1. The overview of urban morphology optimization in this study.
Sustainability 11 03683 g001
Figure 2. Four basic building forms applied in this study.
Sustainability 11 03683 g002
Figure 3. Example assemblies of four basic forms for the ideal model.
Sustainability 11 03683 g003
Figure 4. Illustration of the actual urban blocks model.
Sustainability 11 03683 g004
Figure 5. The optimization process, objective, boundary, and analysis in the software platform.
Sustainability 11 03683 g005
Figure 6. Comparison of the variation of four basic block types in outdoor average thermal comfort (UTCI) in July.
Sustainability 11 03683 g006
Figure 7. The poorest and best building block design with the four block types: (a) pillar-type, (b) strip-type, (c) dot-type, (d) courtyard-type.
Sustainability 11 03683 g007
Figure 8. Angle variation of the four block types: (a) pillar-type, (b) strip-type, (c) dot-type, (d) courtyard-type.
Sustainability 11 03683 g008
Figure 9. SVF of the best layouts of the 4 block types: (a) pillar-type, avg. SVF = 0.415; (b) strip-type, avg. SVF = 0.392; (c) dot-type, avg. SVF = 0.249; (d) courtyard-type, avg. SVF = 0.278.
Sustainability 11 03683 g009aSustainability 11 03683 g009b
Figure 10. Building height distribution of the four block types: (a) pillar-type, (b) strip-type, (c) dot-type, (d) courtyard-type.
Sustainability 11 03683 g010
Figure 11. Open space (grey area) location distribution of the four block types: (a) pillar-type, (b) strip-type, (c) dot-type, (d) courtyard-type.
Sustainability 11 03683 g011
Figure 12. Variation trend of the MRT of the four block types.
Sustainability 11 03683 g012
Figure 13. Variation trend of the average wind speed of the four block types.
Sustainability 11 03683 g013
Figure 14. Validation case study simulation results of UTCI for the original layout (above) and the optimized layout (below).
Sustainability 11 03683 g014aSustainability 11 03683 g014b
Table 1. Meteorological data of open spaces from 10:00 to 16:00 in July in Kashgar.
ParameterSetting
Leading wind directionNorthwest
Average wind speed at the 1.5 m benchmark height (m/s)3.4
Average temperature (°C)29.9
Average humidity (%)30.3
MRT (°C)56.0
Table 2. Stress classification of the outdoor thermal environment following the UTCI ranges [50].
The Range of UTCI (°C)Stress Classification
>46Extreme heat stress
+38 to +46Very strong heat stress
+32 to +38Strong heat stress
+26 to +32Moderate heat stress
+9 to +26No thermal stress
0 to +9Slight cold stress
−13 to 0Moderate cold stress
−27 to −13Strong cold stress
−40 to −27Very strong cold stress
< −40Extreme cold stress
Table 3. Best performance of the four block types.
TypeFragmentation DegreeAvg. UTCIAvg. Radiation TemperatureAvg. Wind SpeedAvg. SVF
Pillar type1-mass28.01 °C39.42 °C2.77 m/s0.415
Strip type1-mass25.59 °C38.87 °C1.89 m/s0.392
Dot type4-mass24.40 °C34.64 °C1.36 m/s0.249
Courtyard type2-mass24.47 °C35.18 °C1.02 m/s0.278
Table 4. Comparative results of original layout and optimized layout.
ParameterOriginal LayoutOptimized Layout
Plot ratio1.81.8
Building density0.240.24
UTCI (°C)31.1727.43
MRT (°C)43.9441.29
Average wind speed (m/s)2.041.97

