Risk Assessment and Pressure Response Analysis of the Water Footprint of Agriculture and Livestock: A Case Study of the Beijing–Tianjin–Hebei Region in China

Abstract
:1. Introduction
2. Materials and Methods
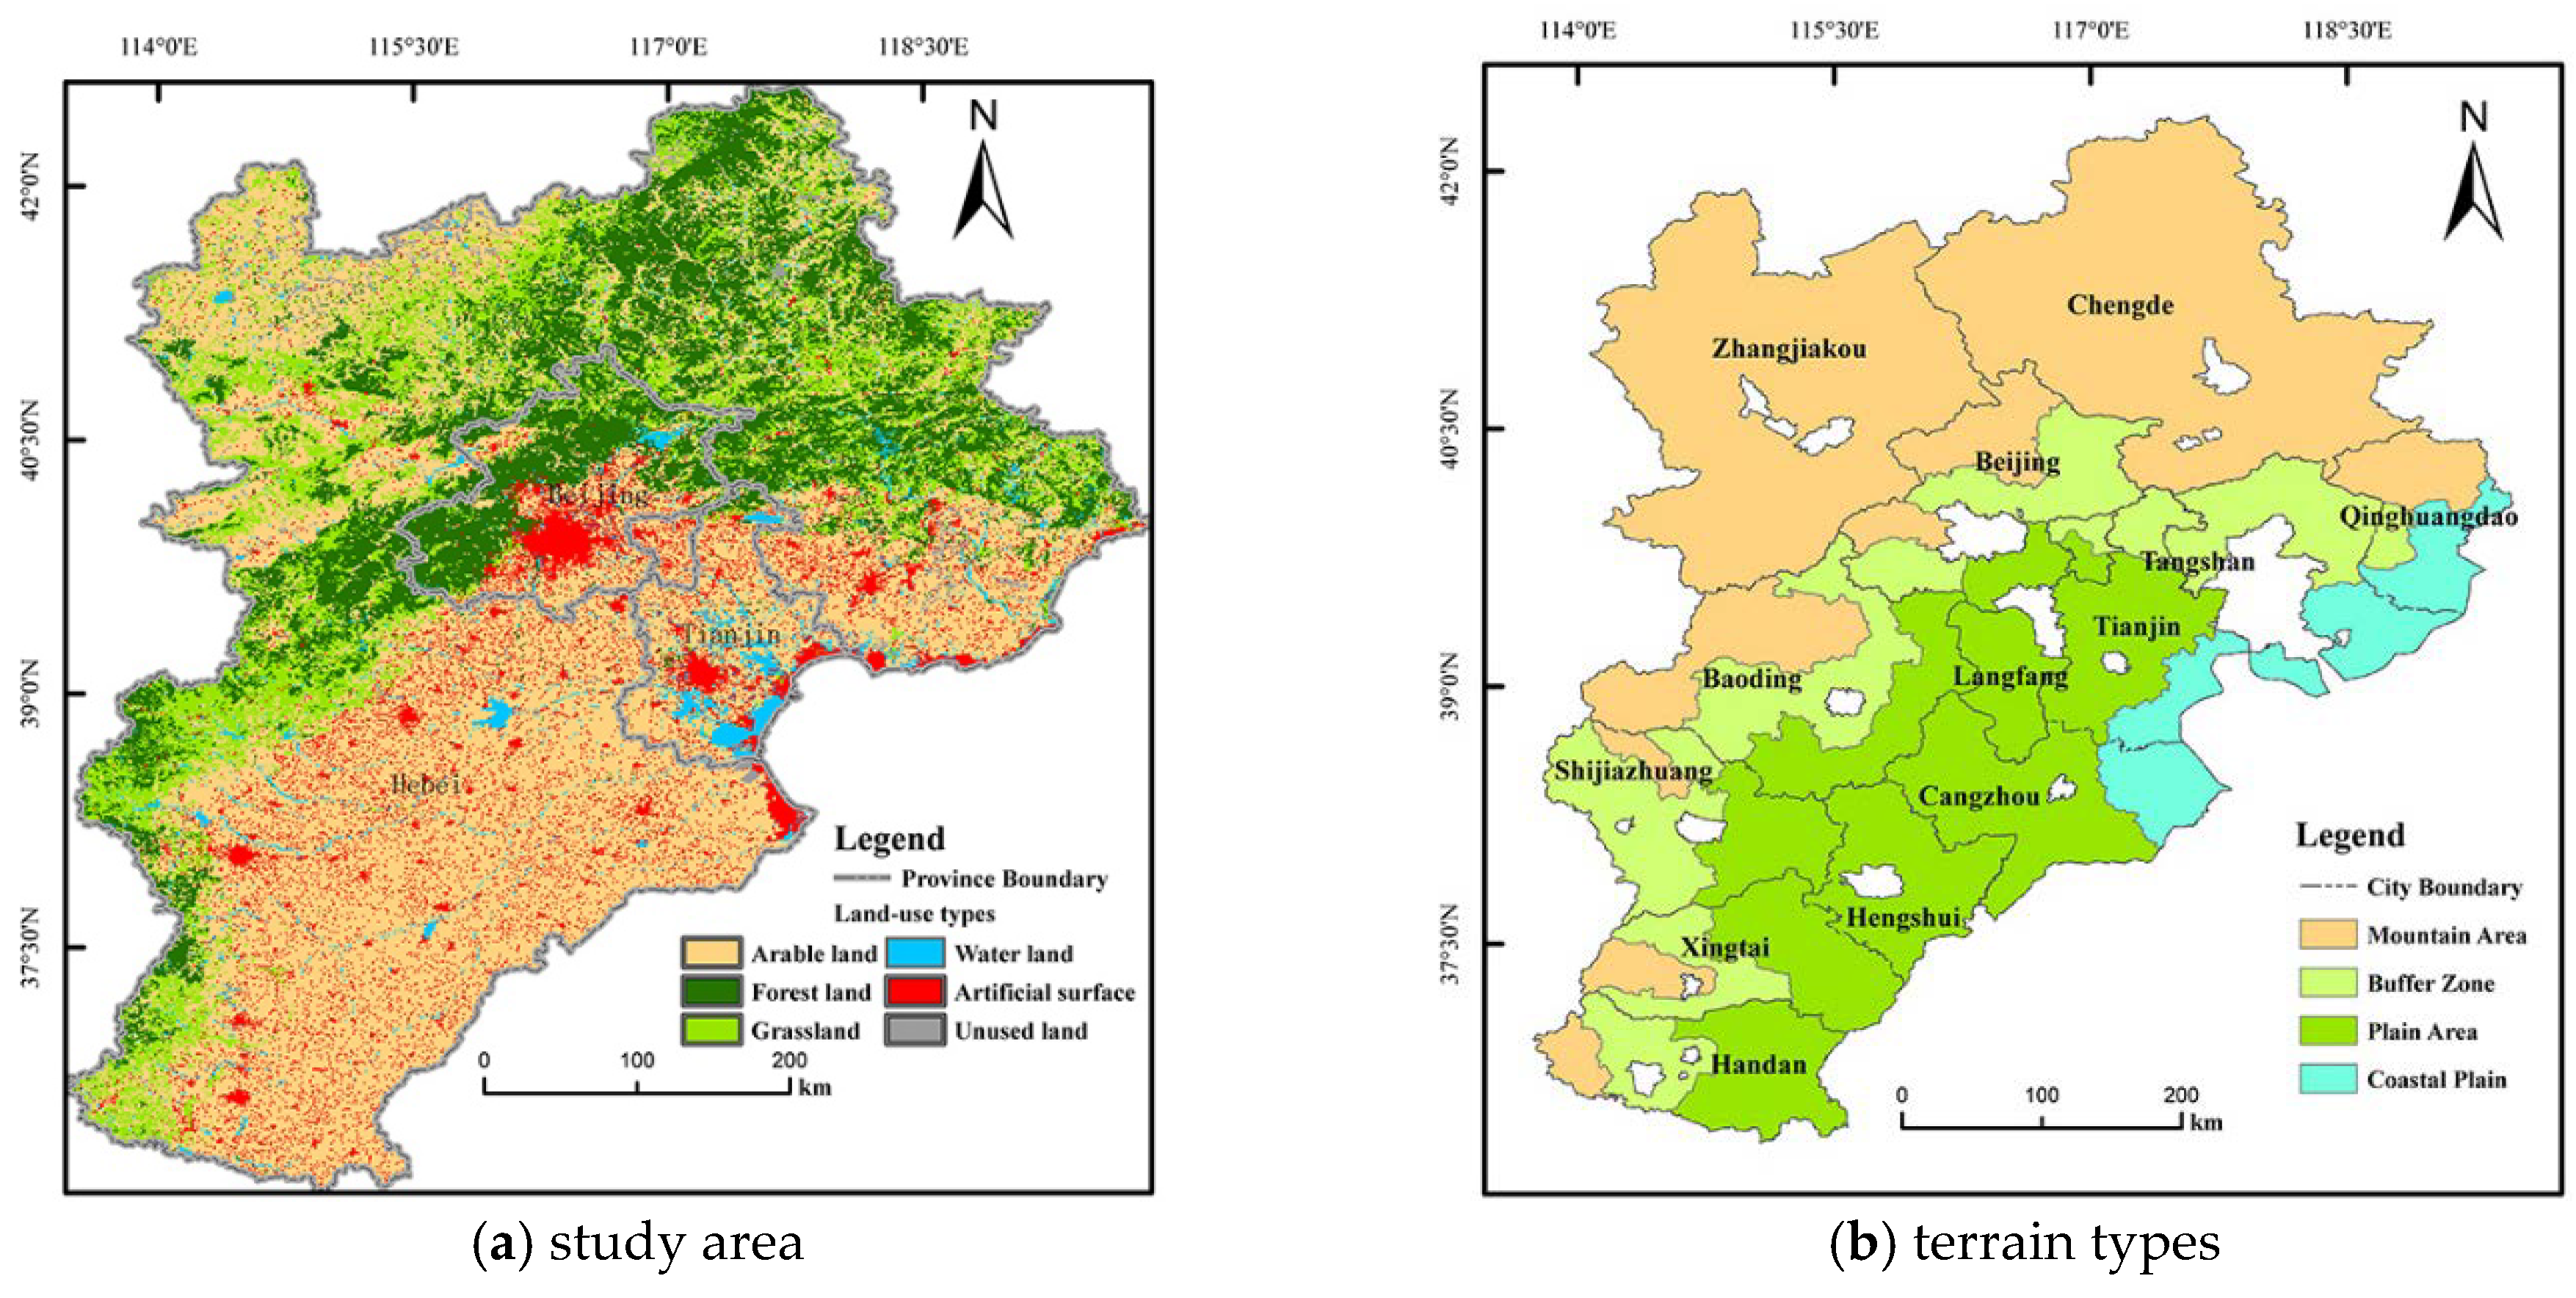
2.1. Study Region
2.2. WF-AL Analysis
2.2.1. Calculation Methods
2.2.2. Virtual Water Content of Agriculture and Livestock Products
3. Results
3.1. Structure of the WF-AL
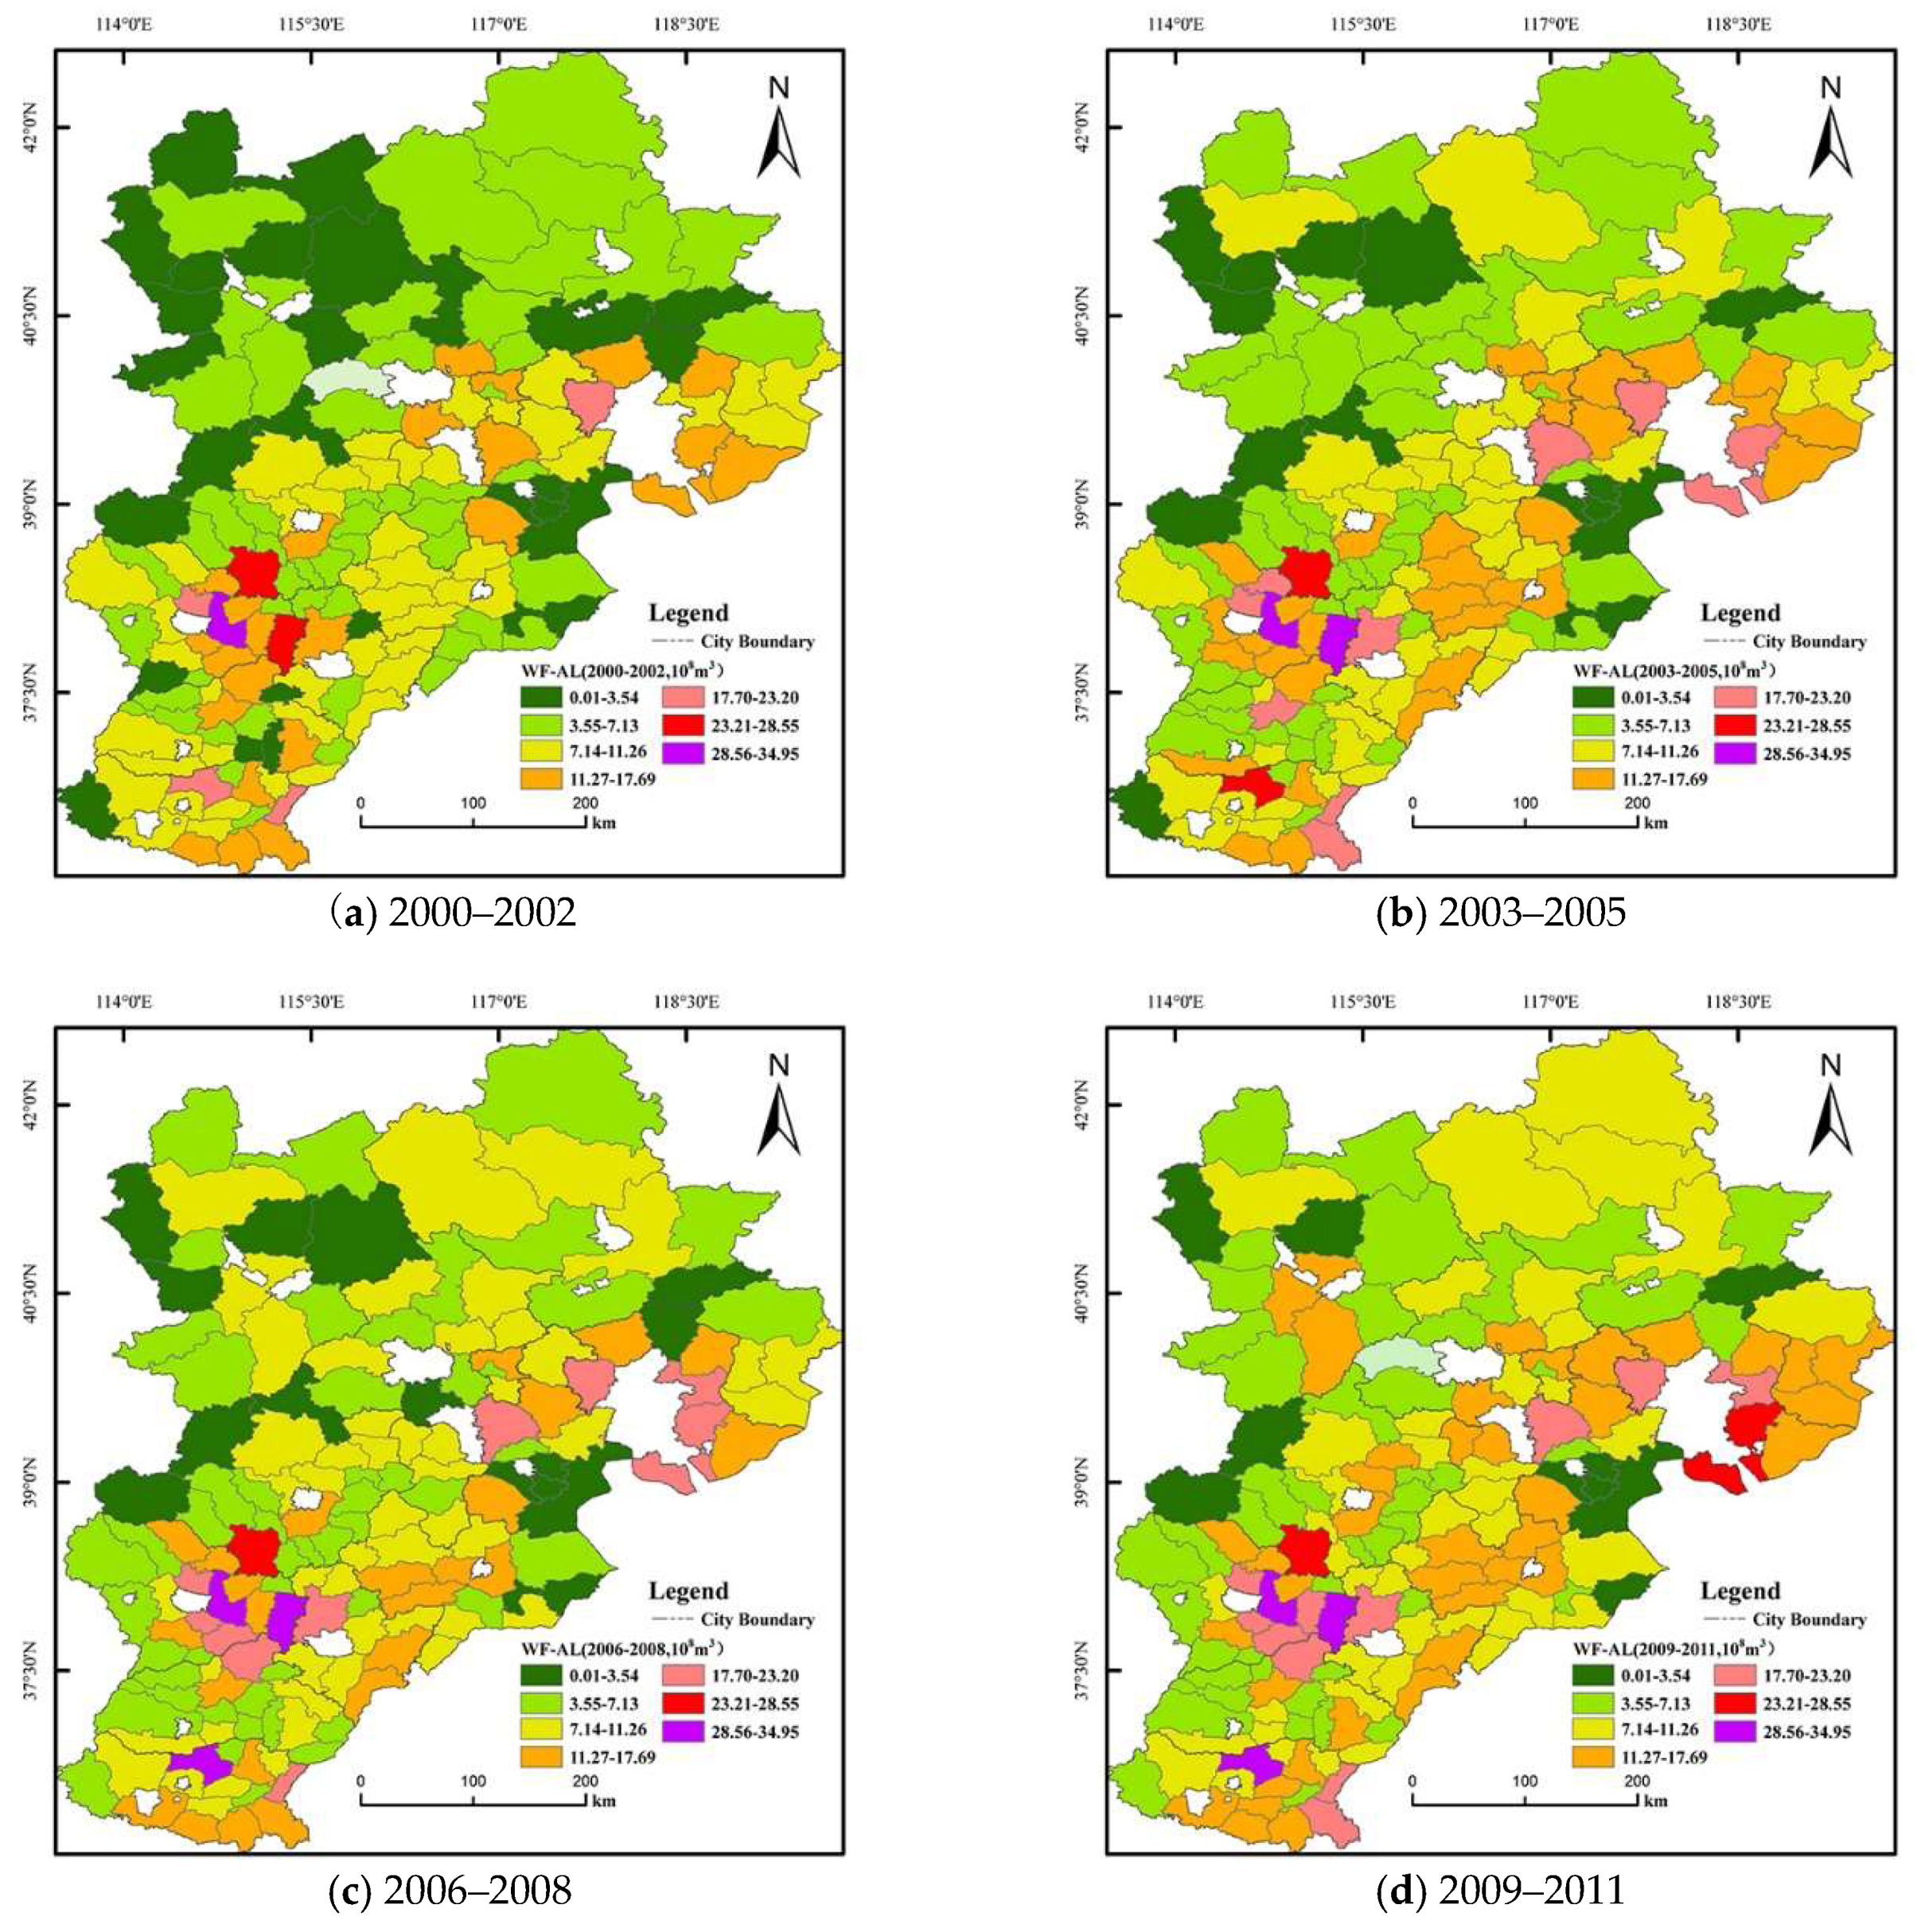
3.1.1. County WF-AL
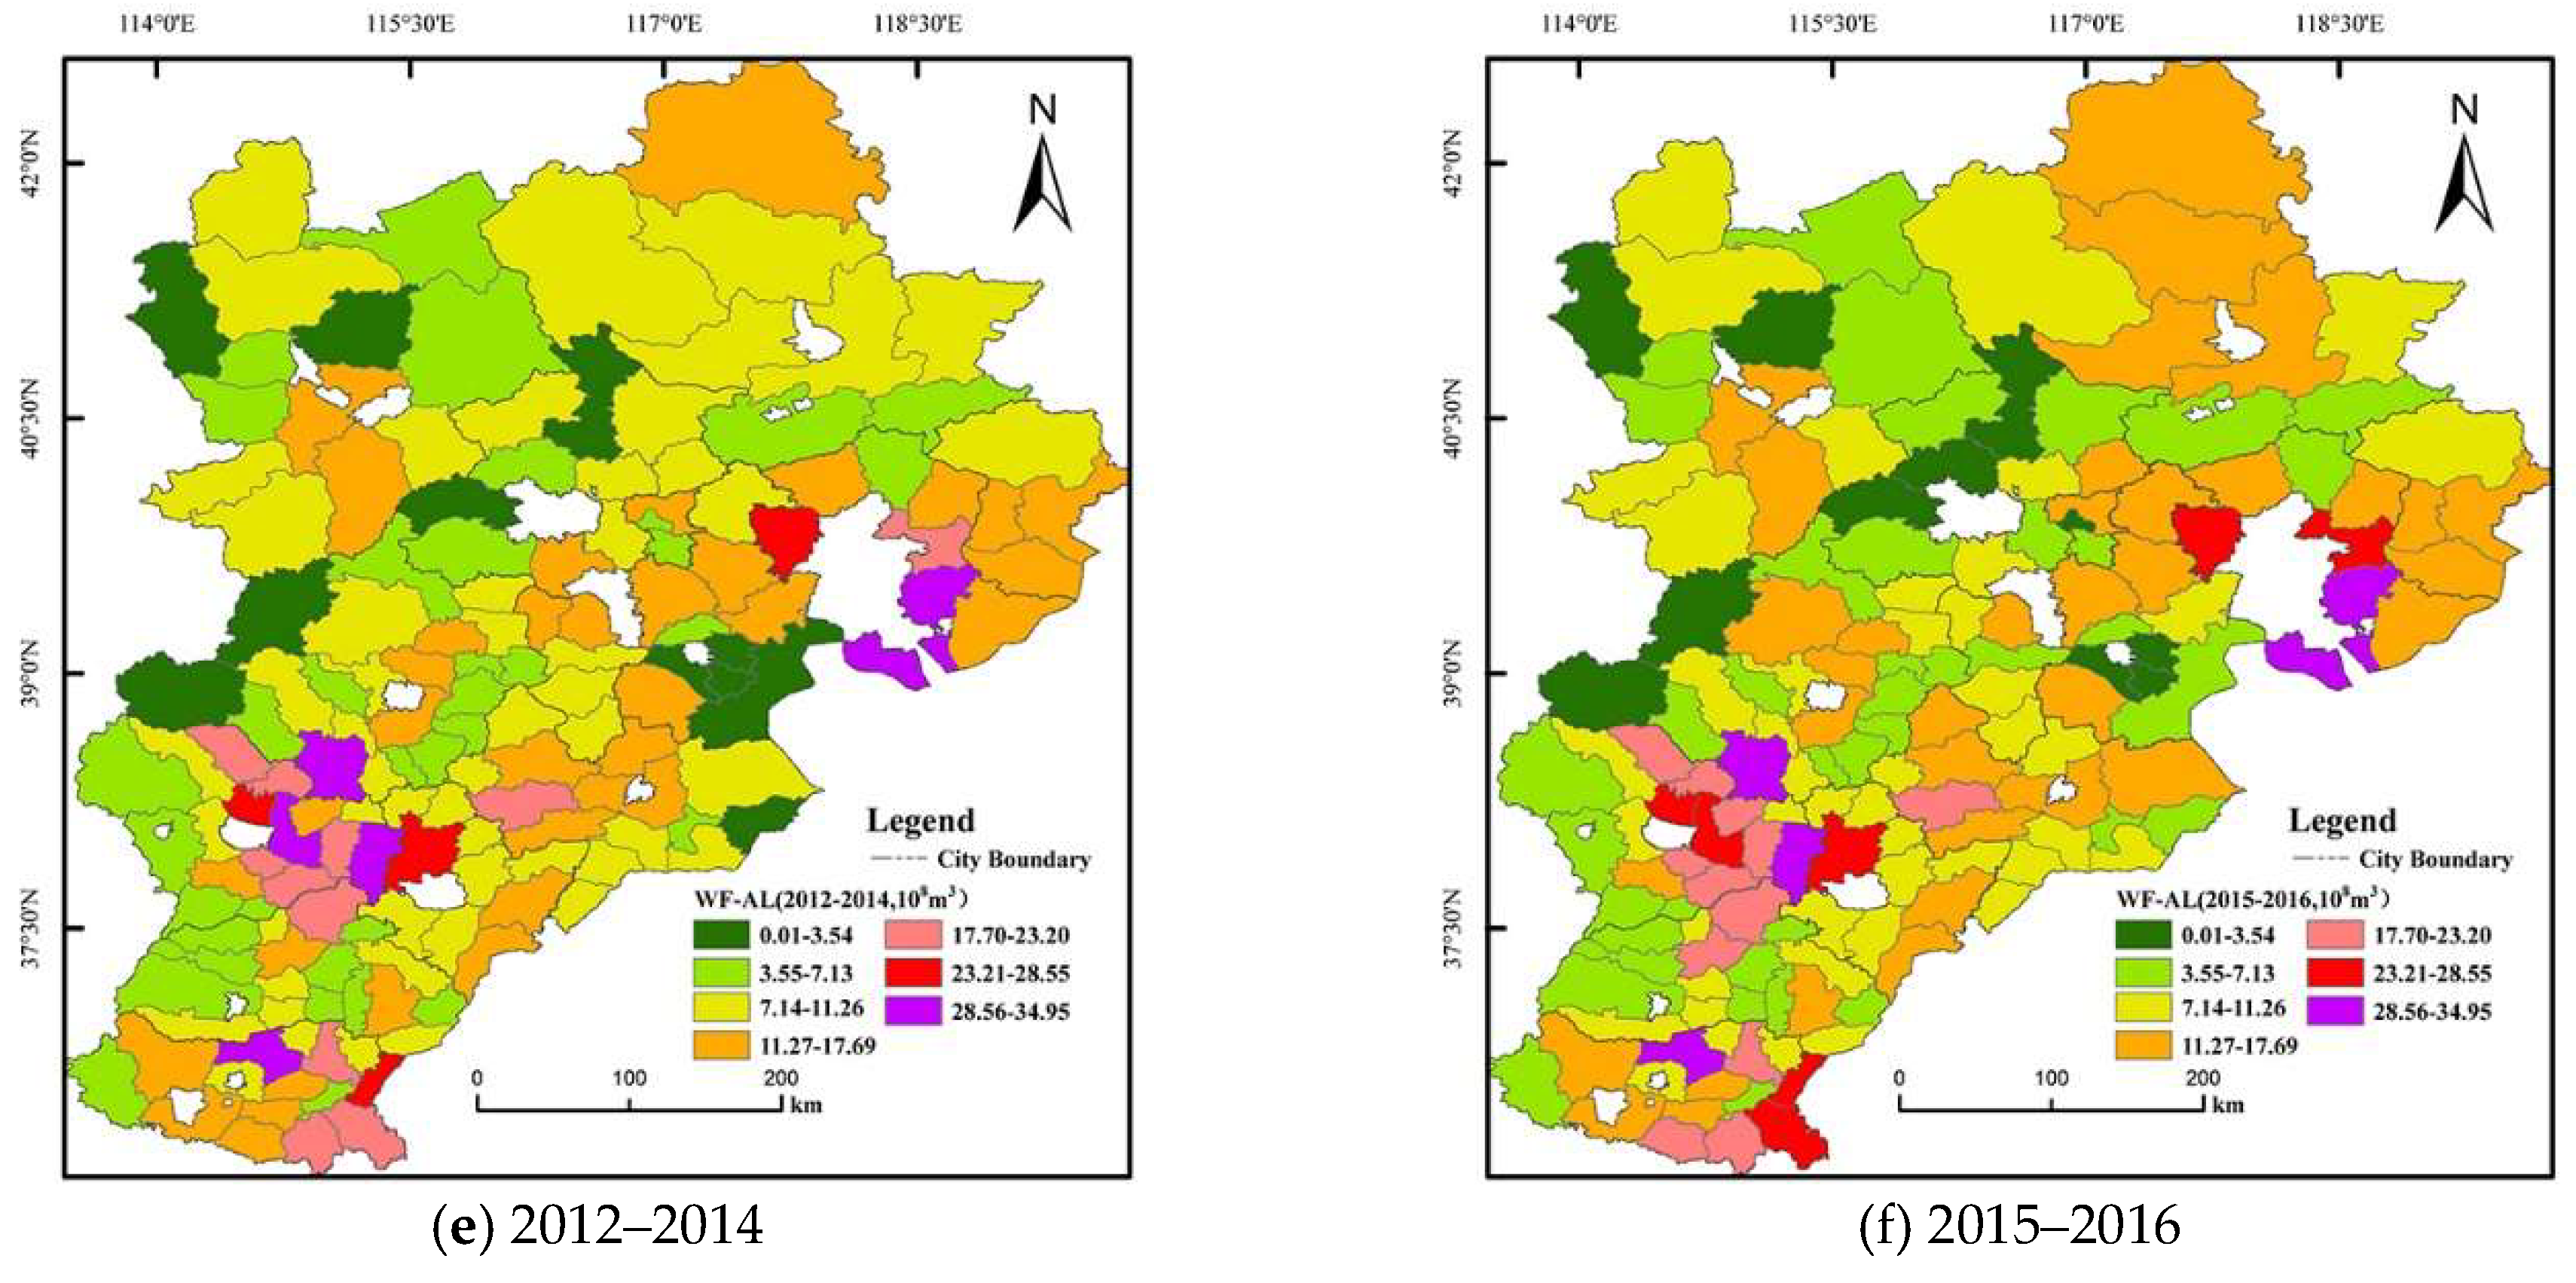
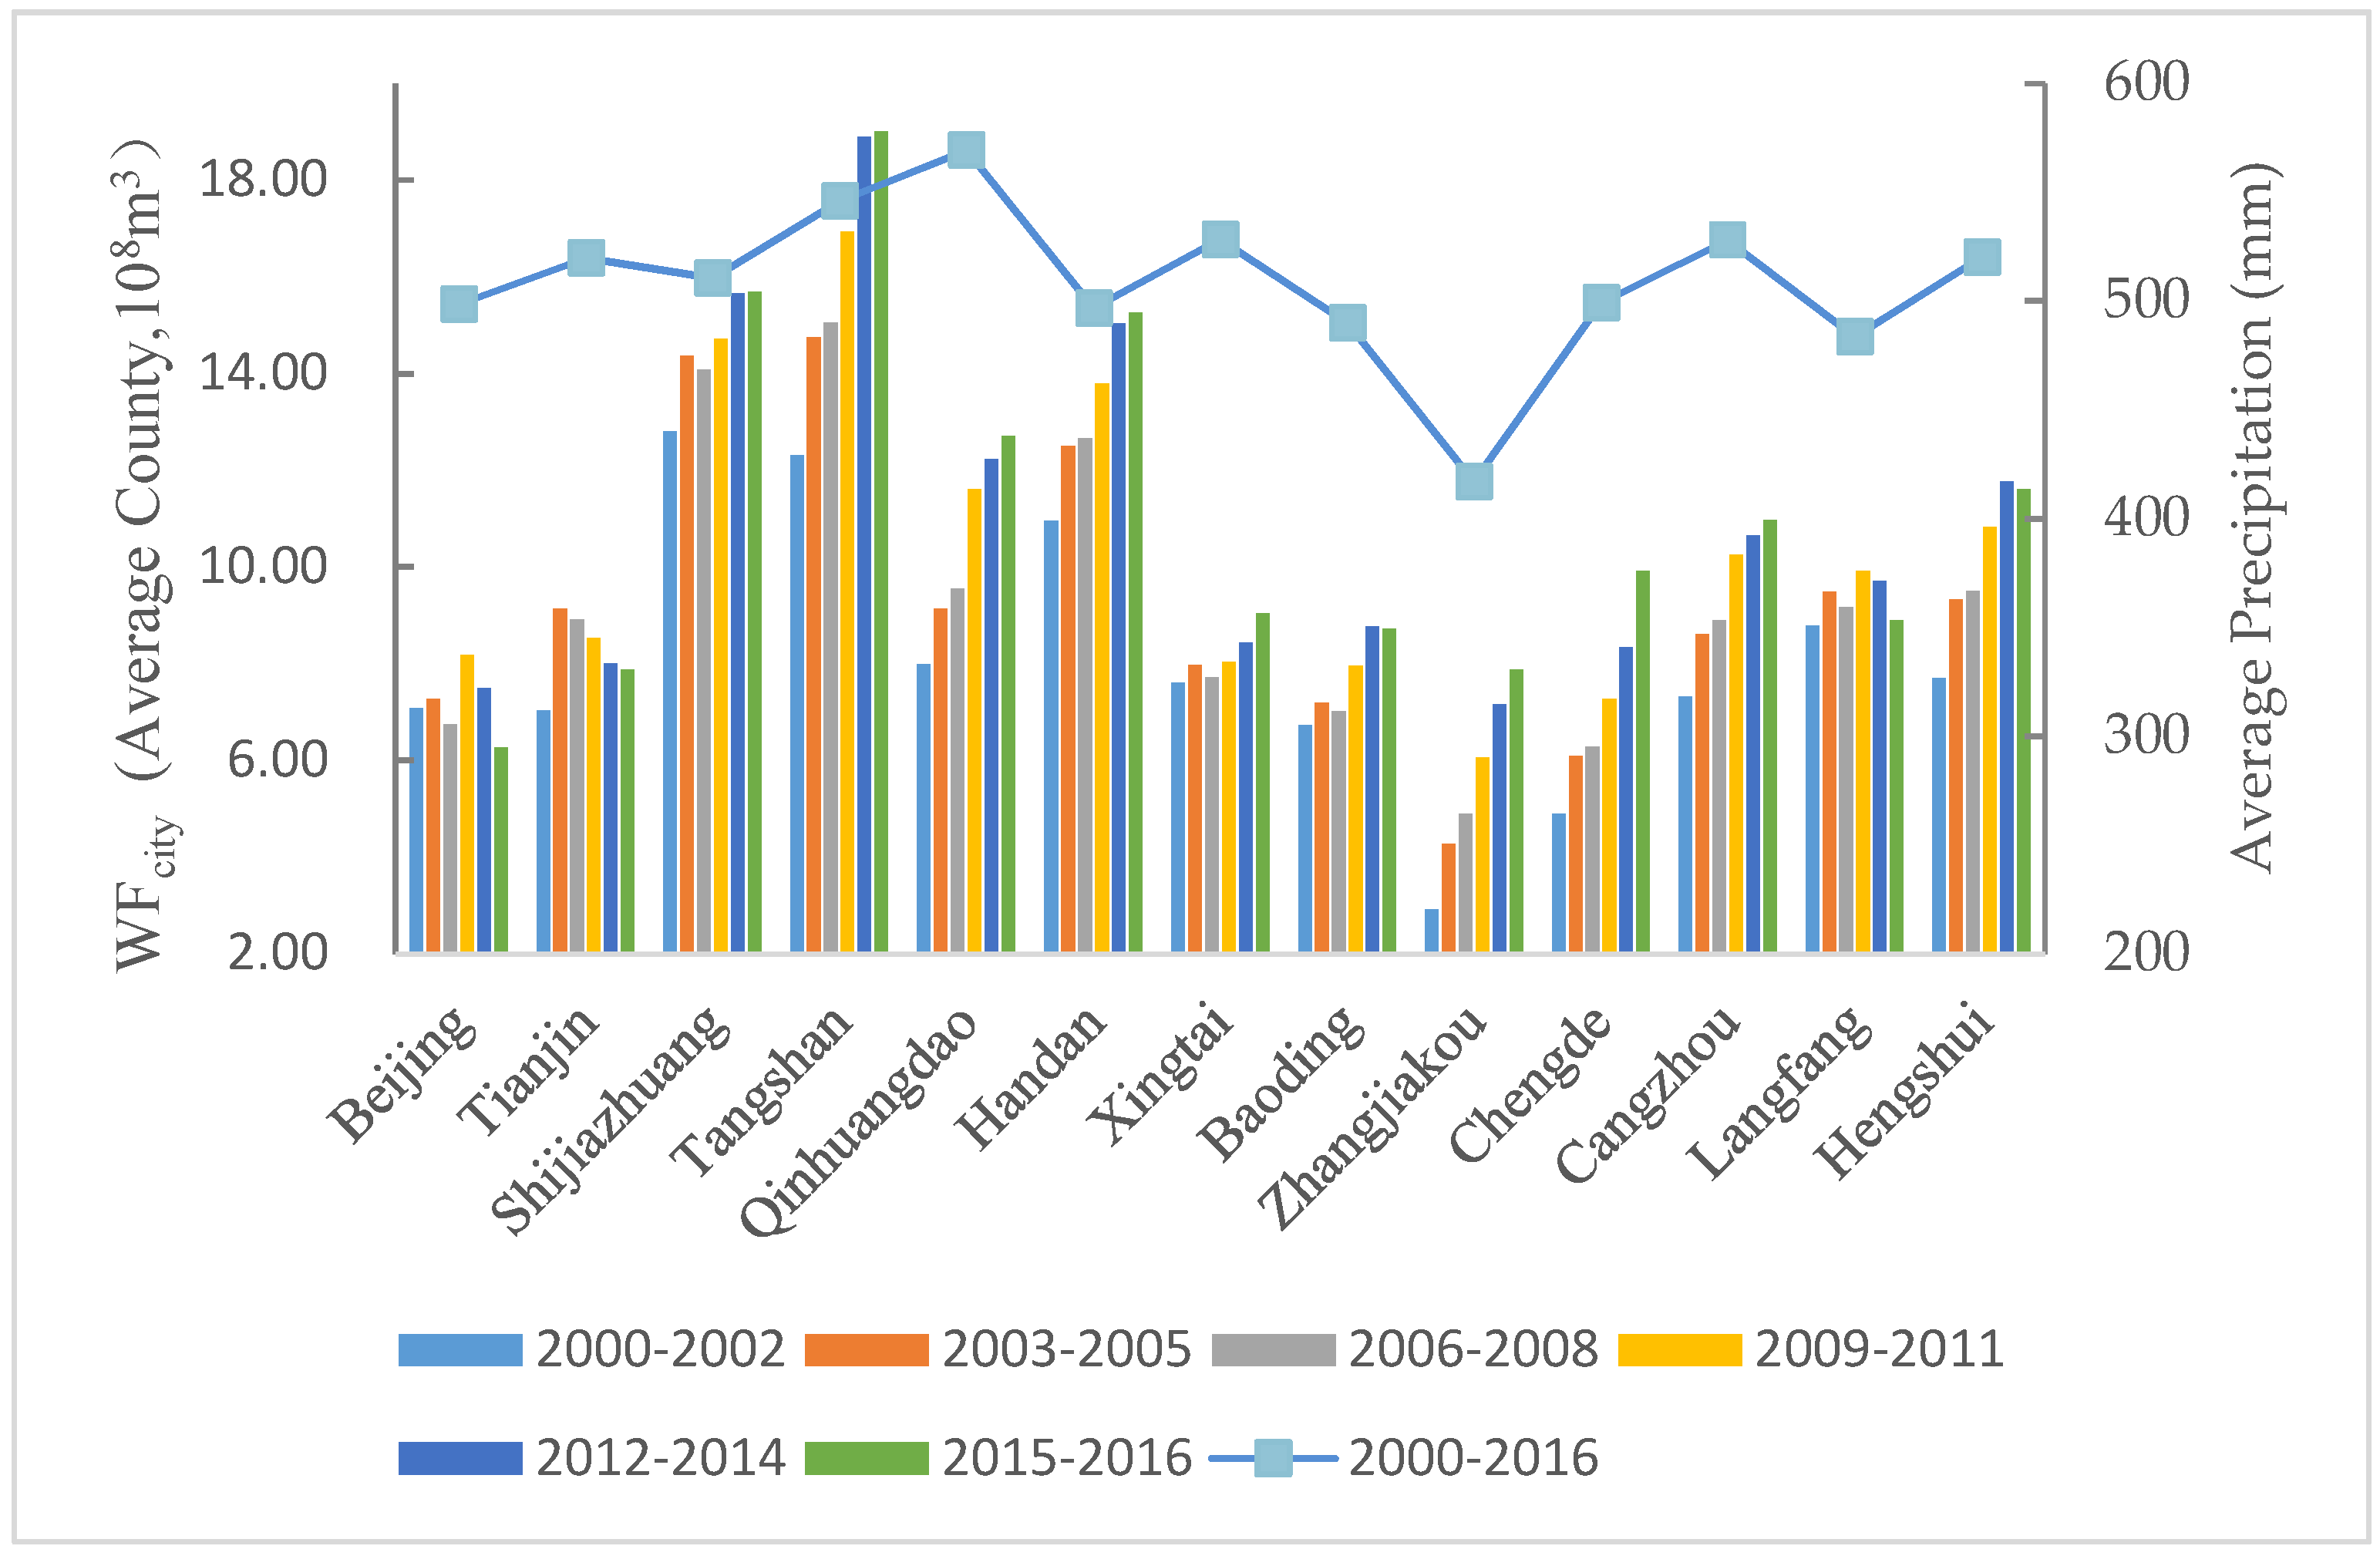
3.1.2. City WF-AL
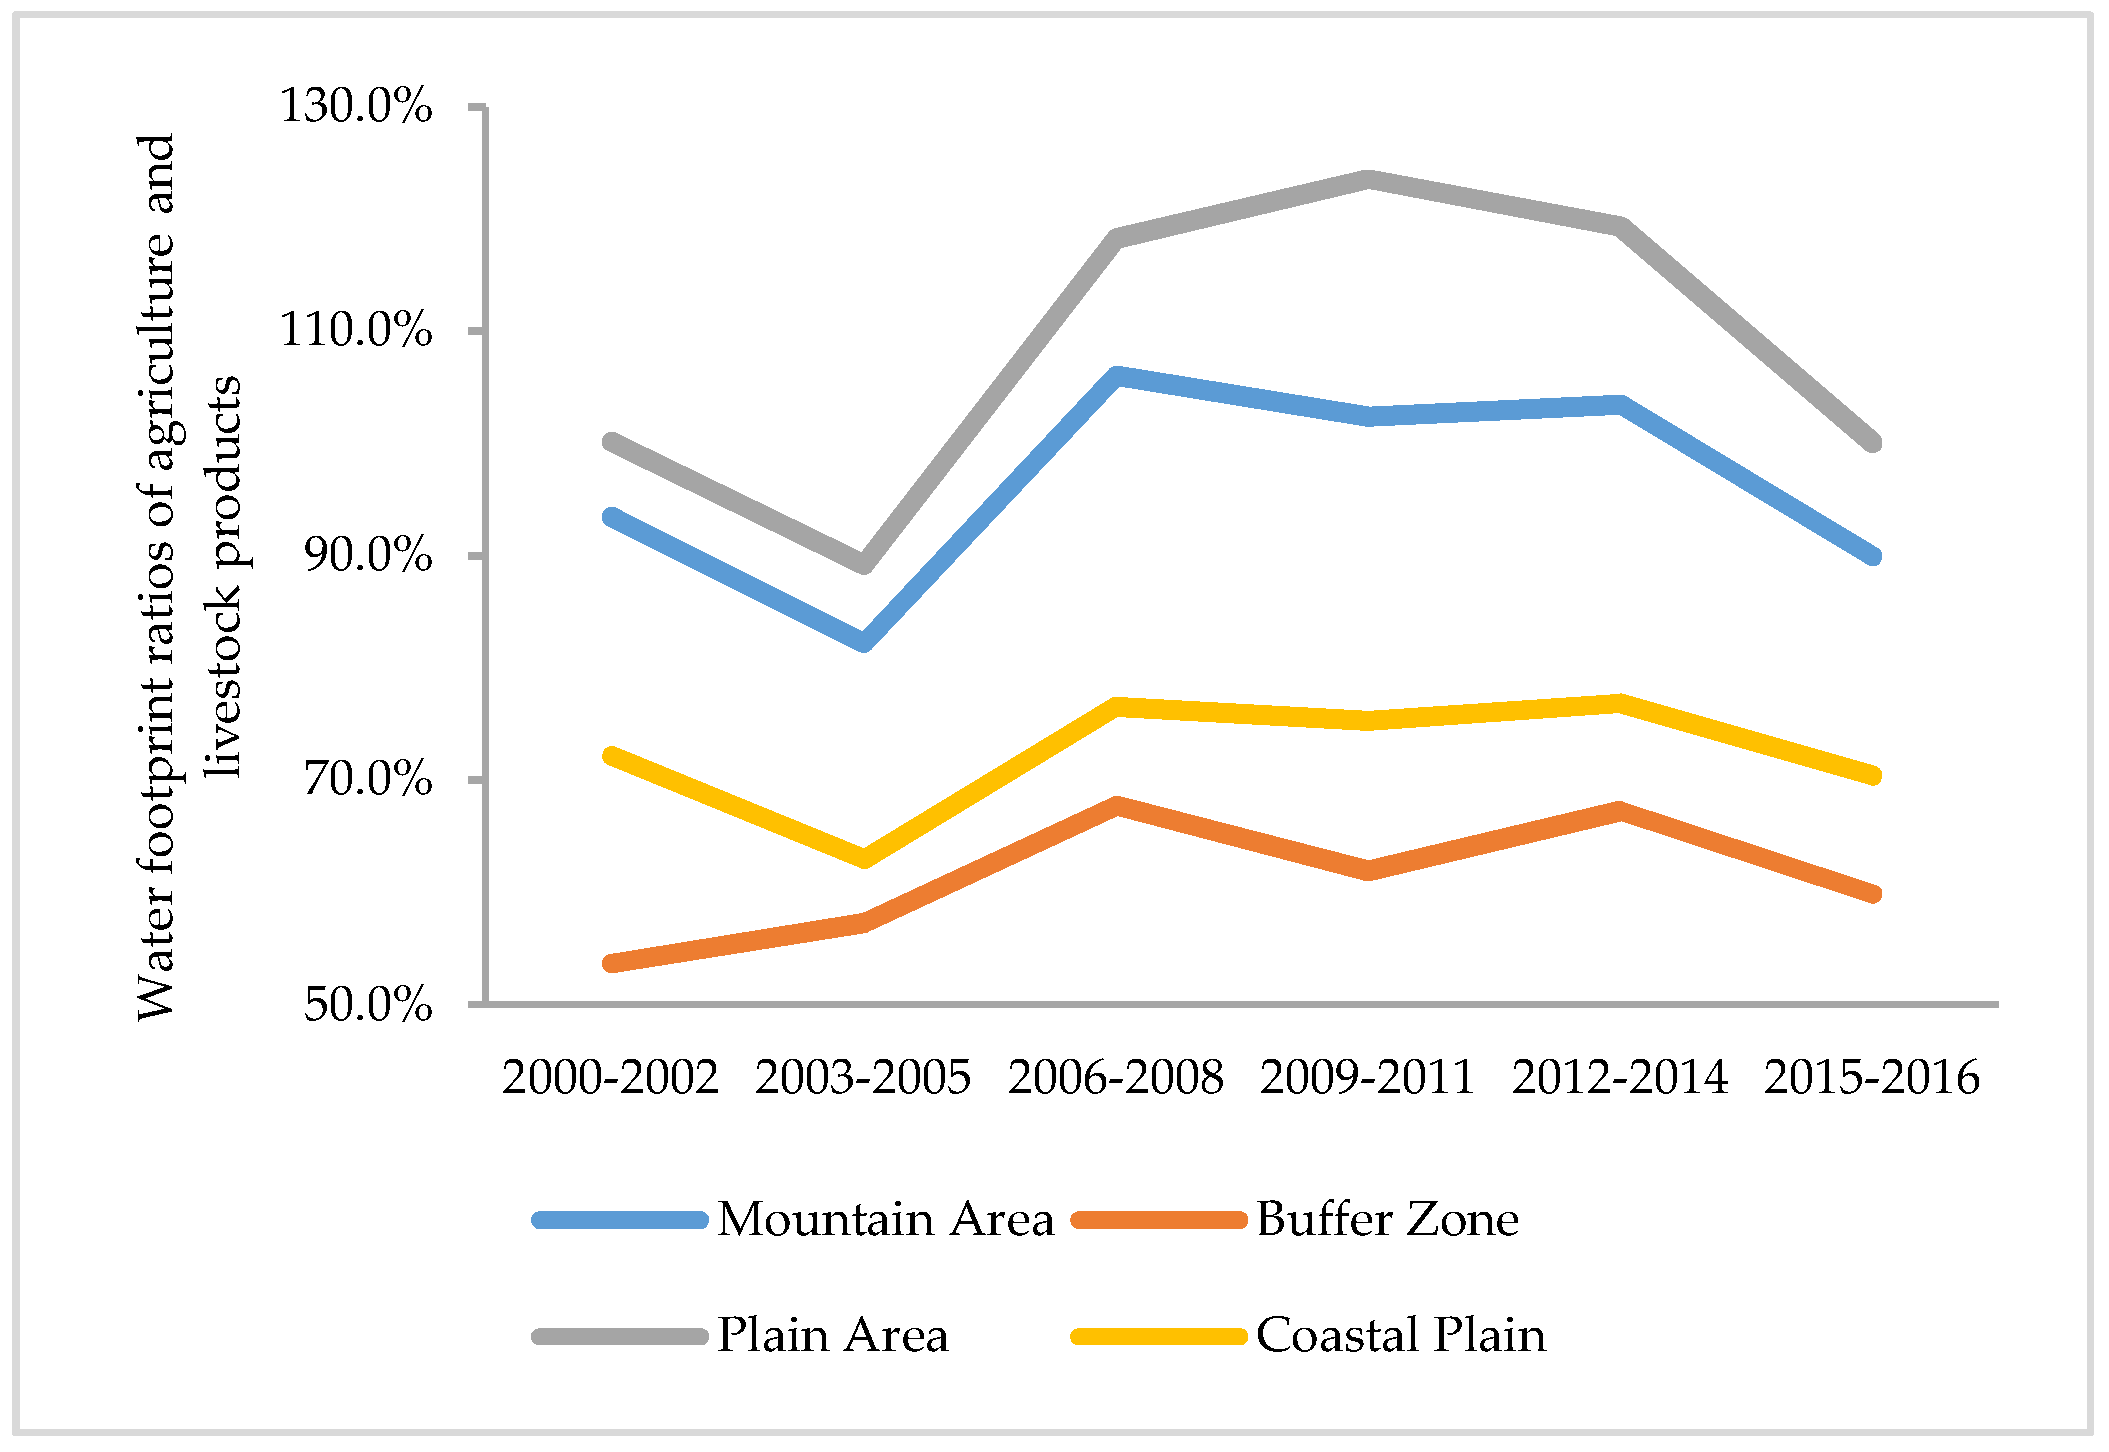
3.1.3. Terrain WF-AL
3.2. Density Variation of the WF-AL
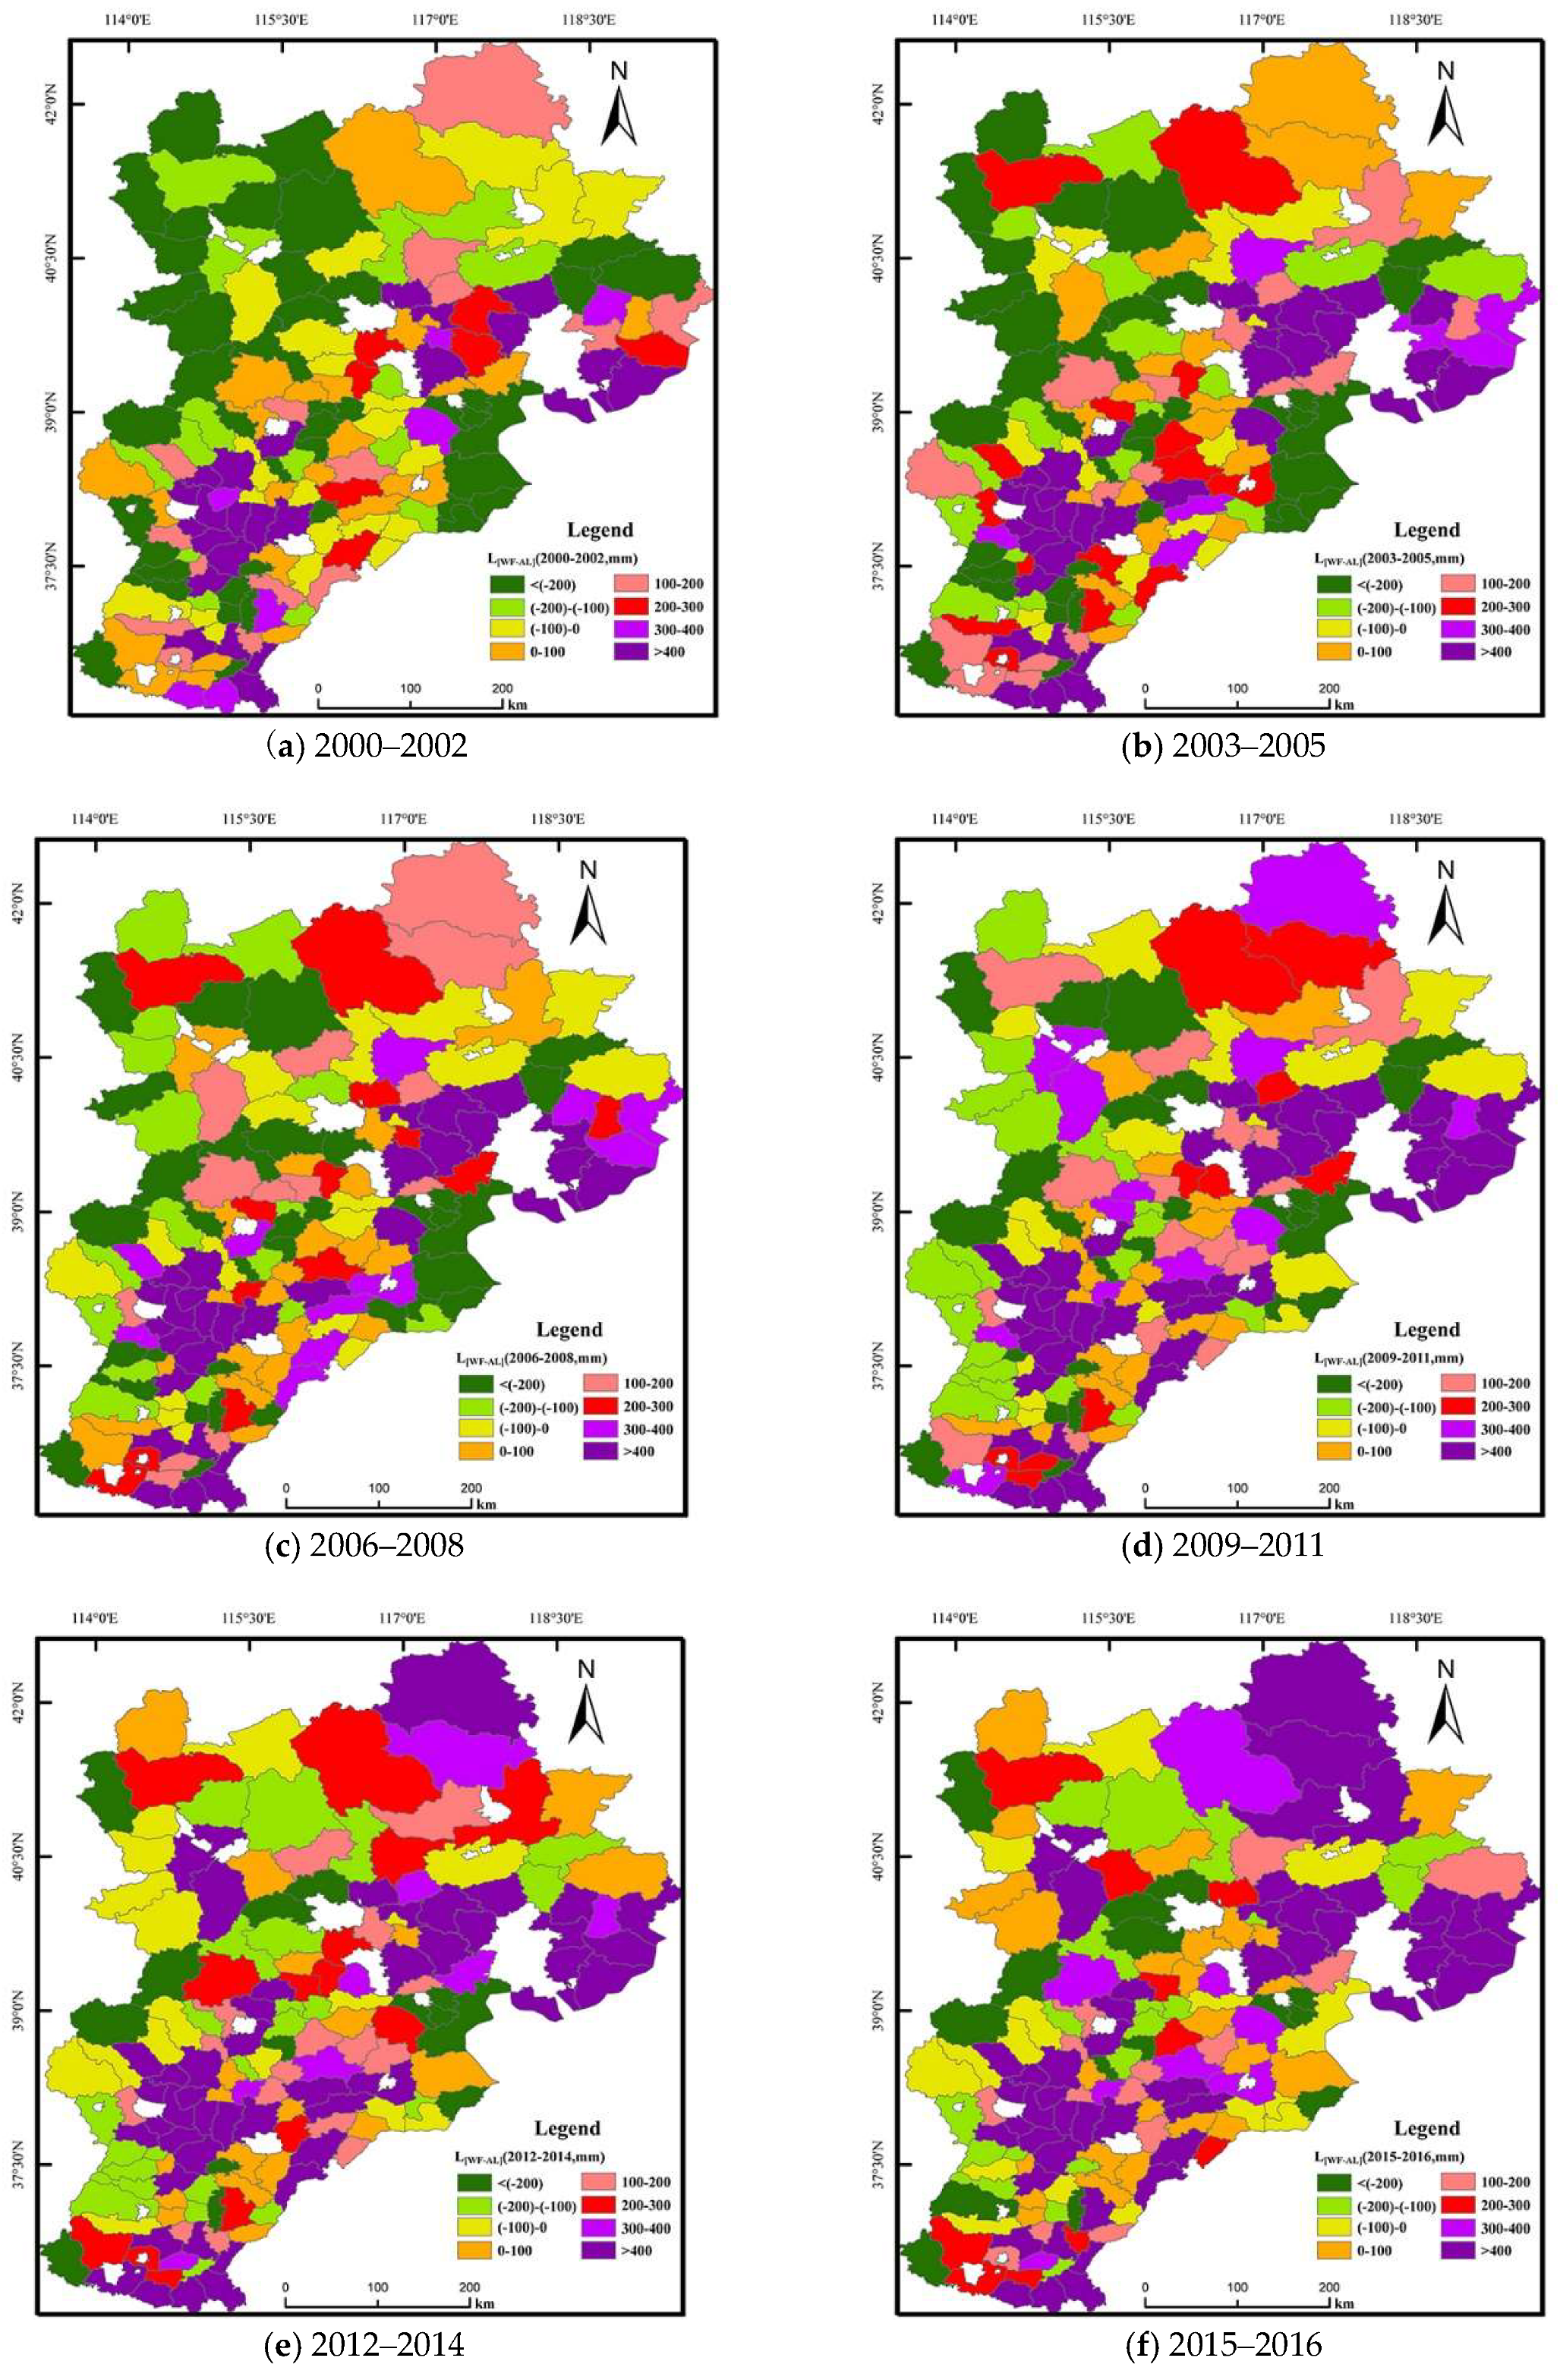
3.2.1. Surplus or Loss of Water Footprint Density
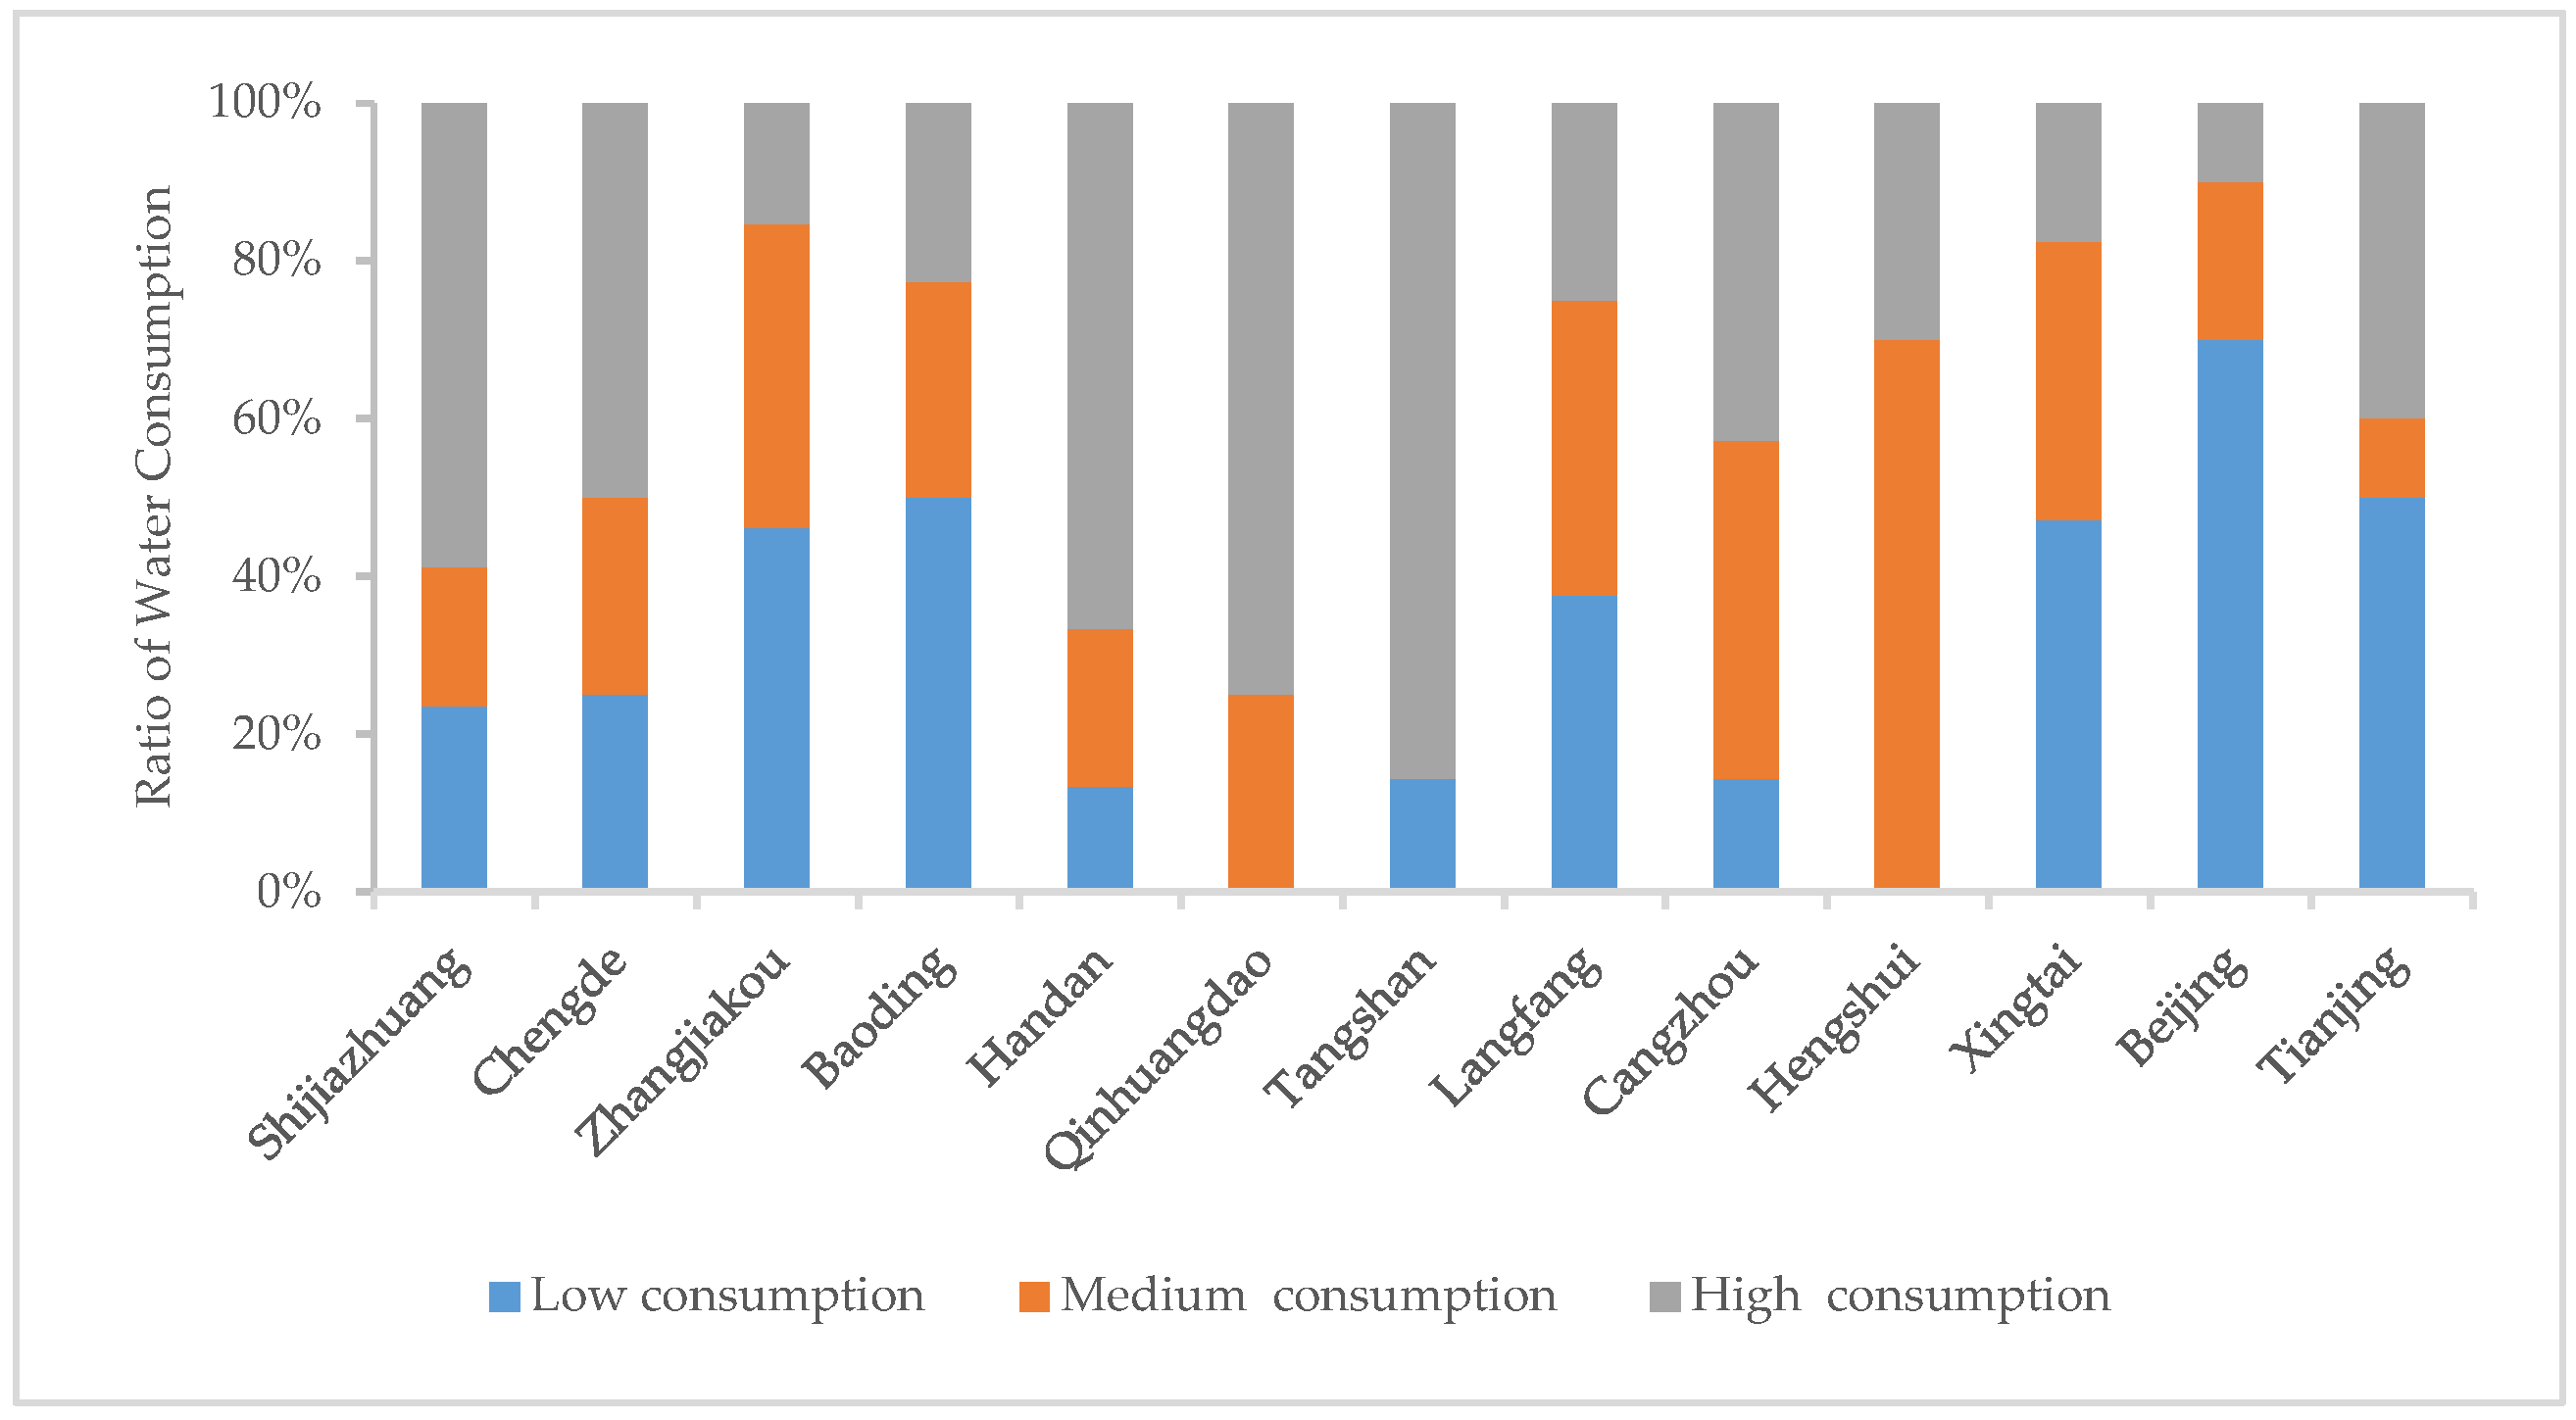
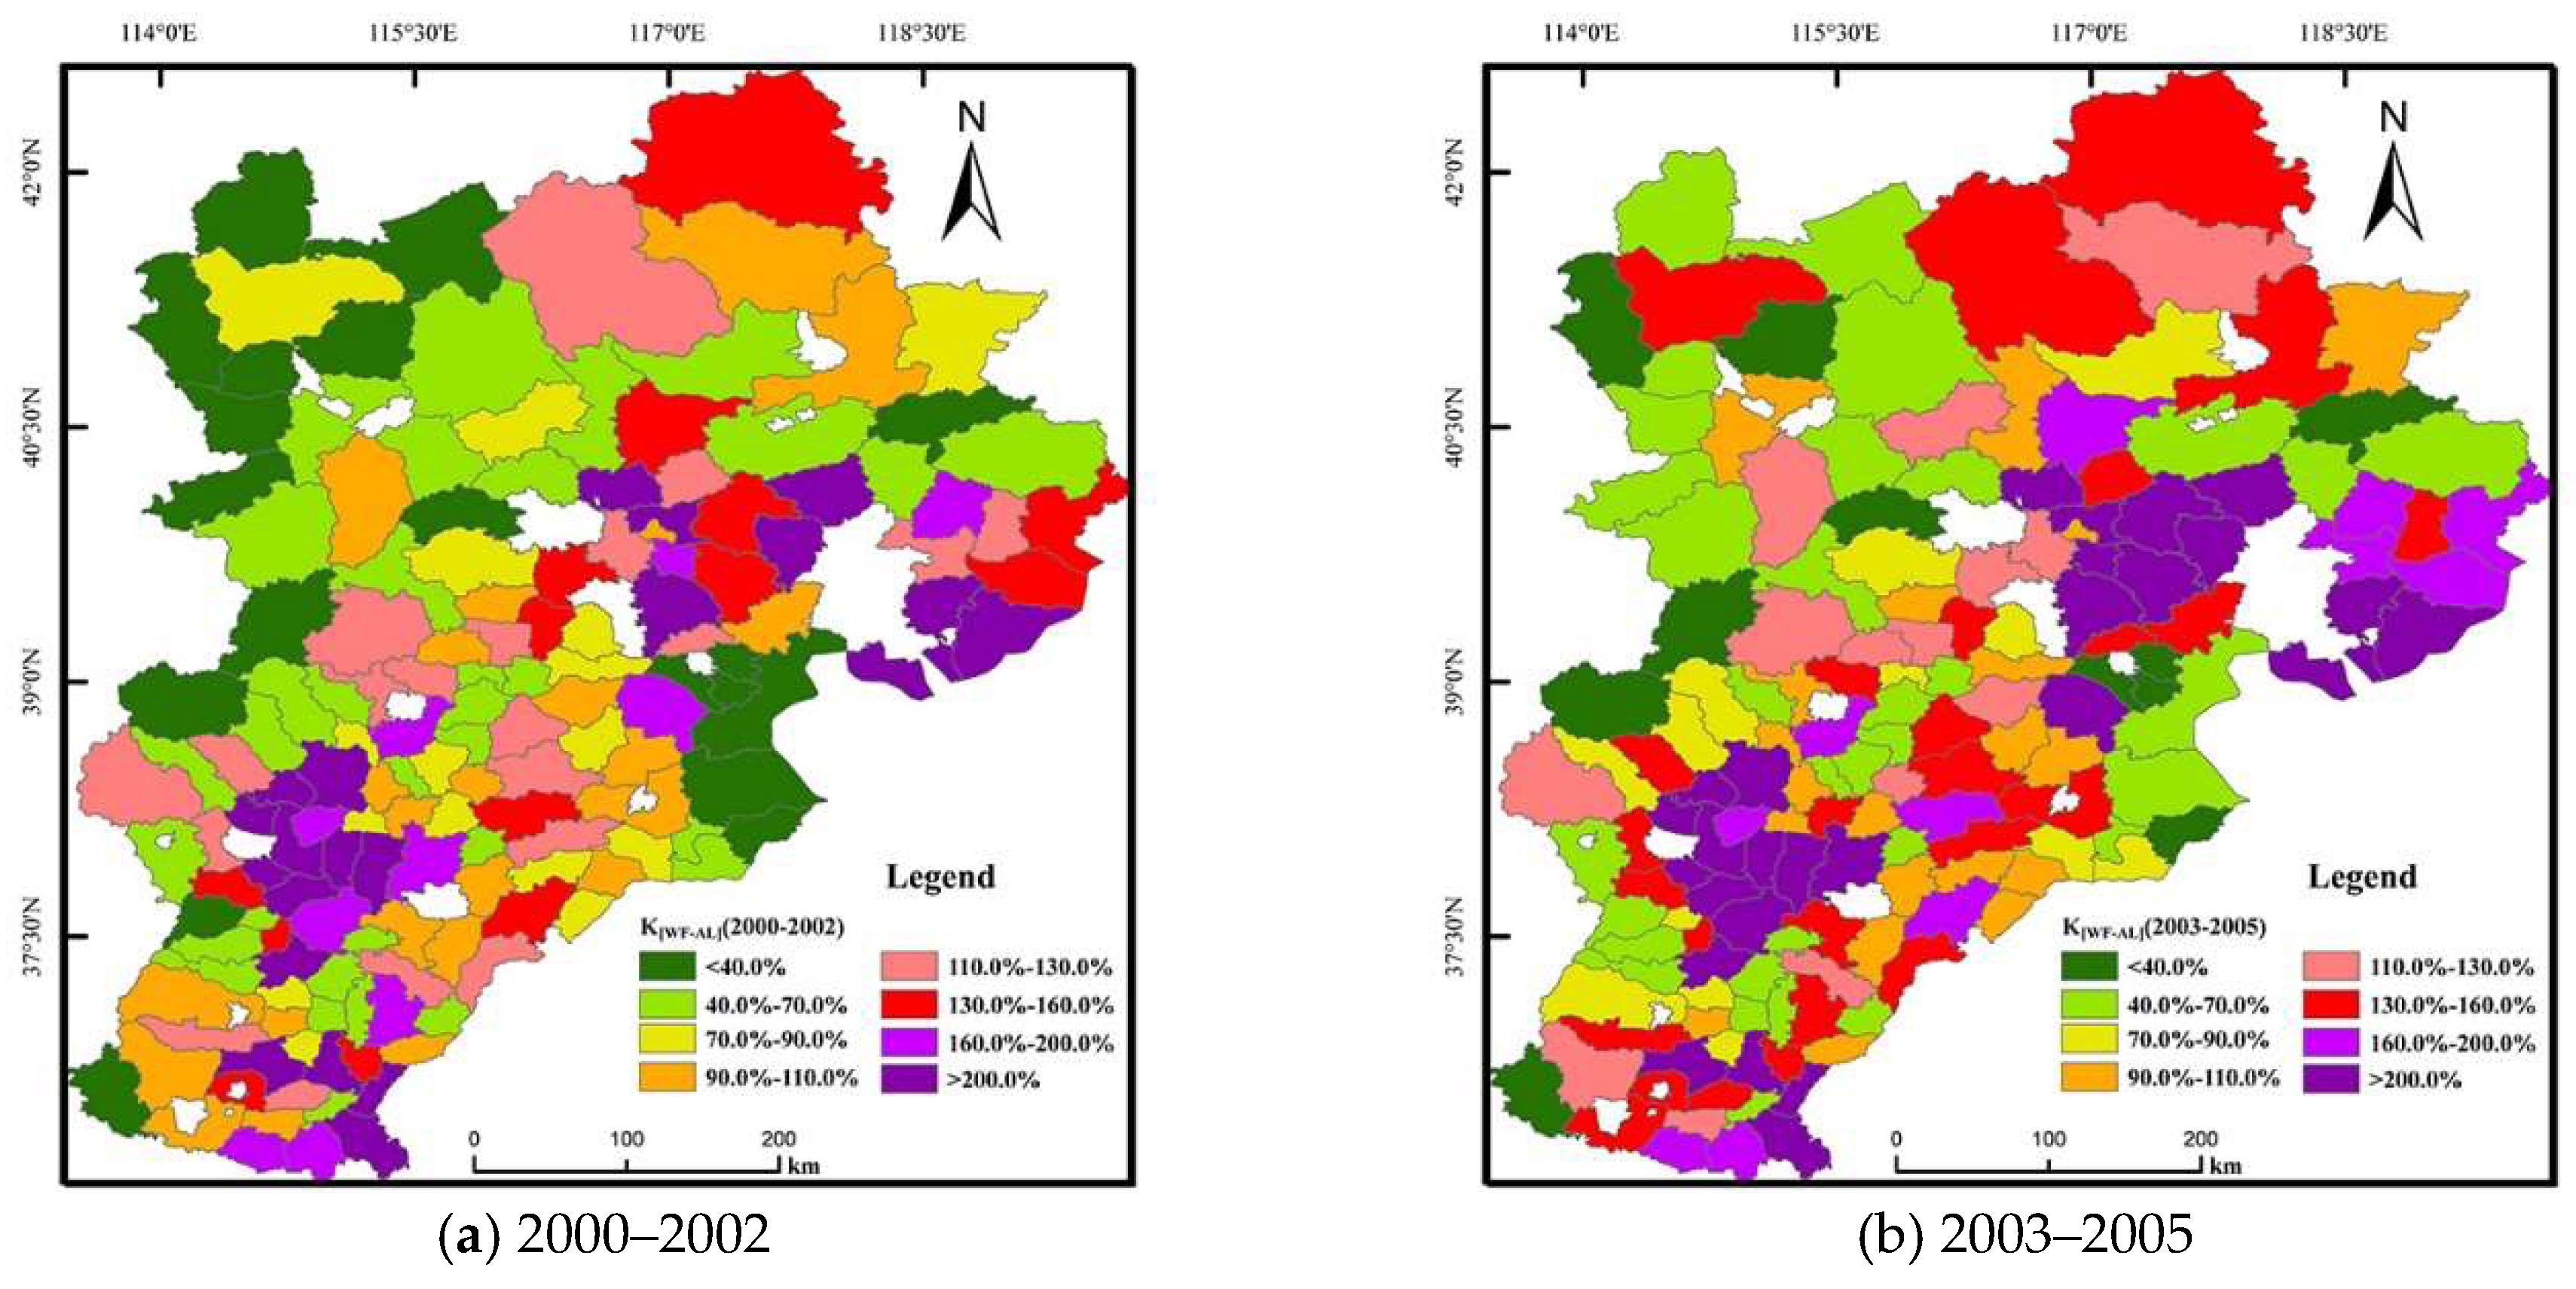
3.2.2. Ratio of Water Footprint Density
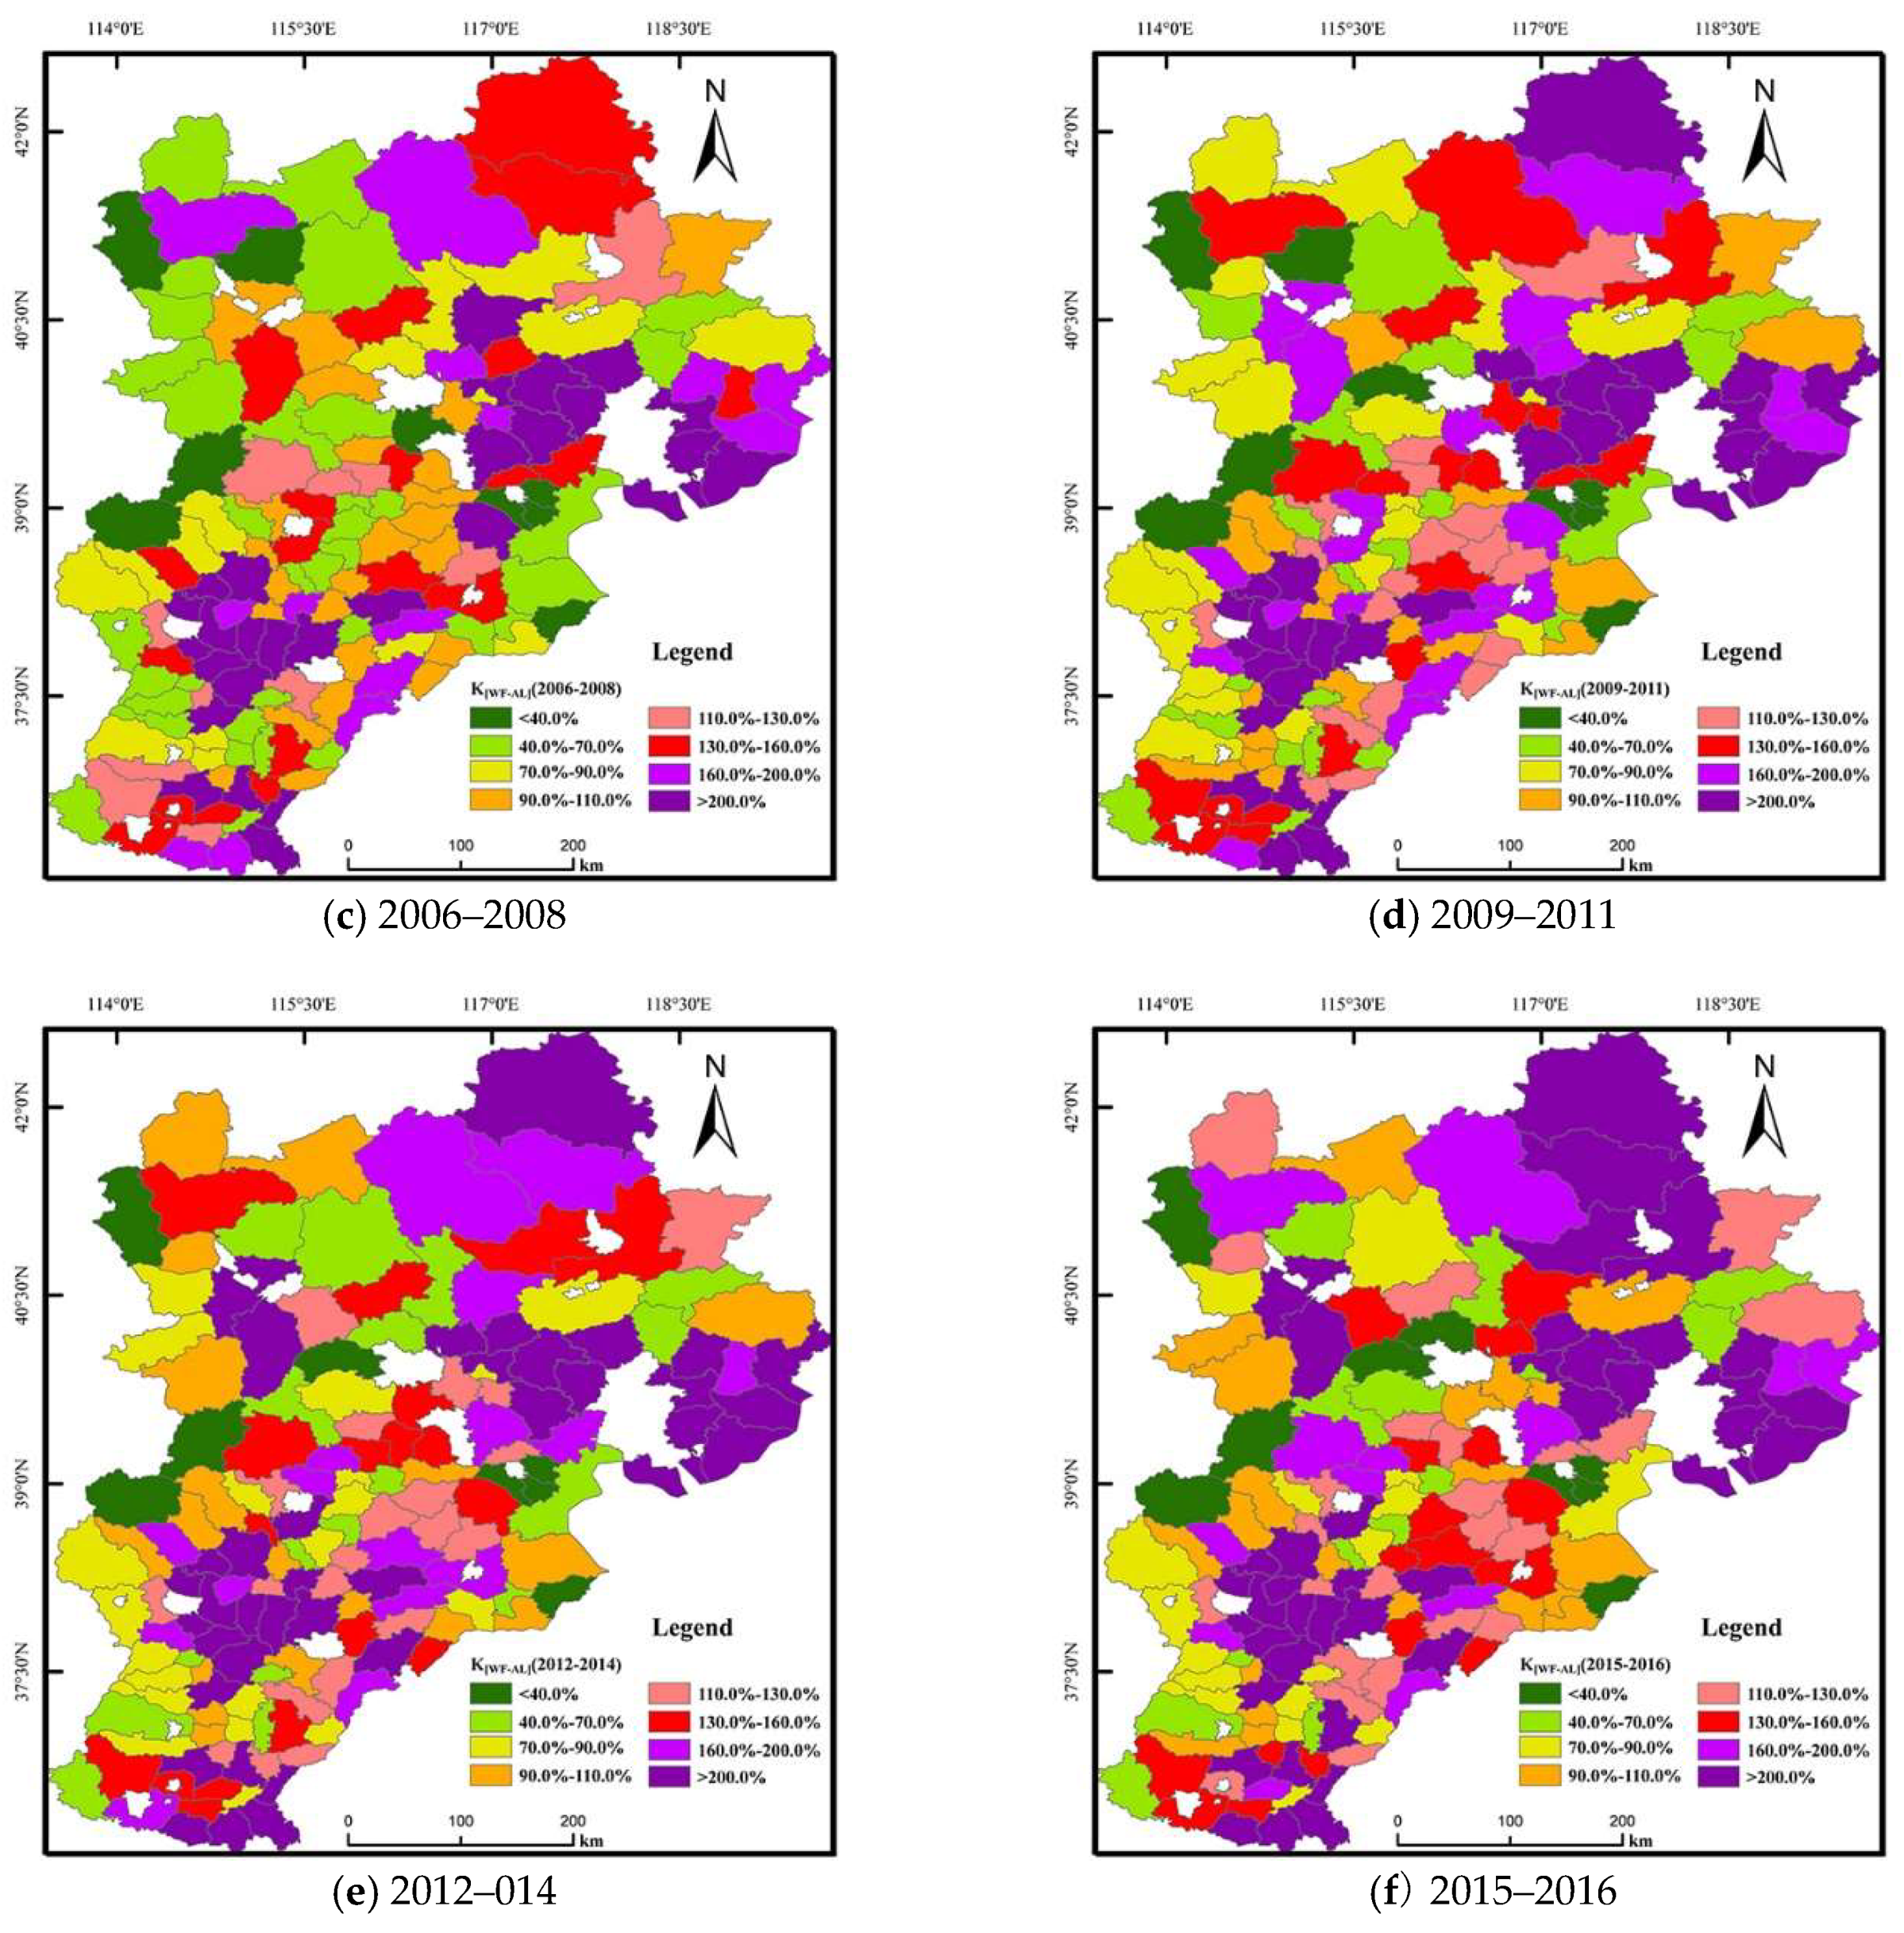
3.3. Prediction and Early-Warning of WF-AL
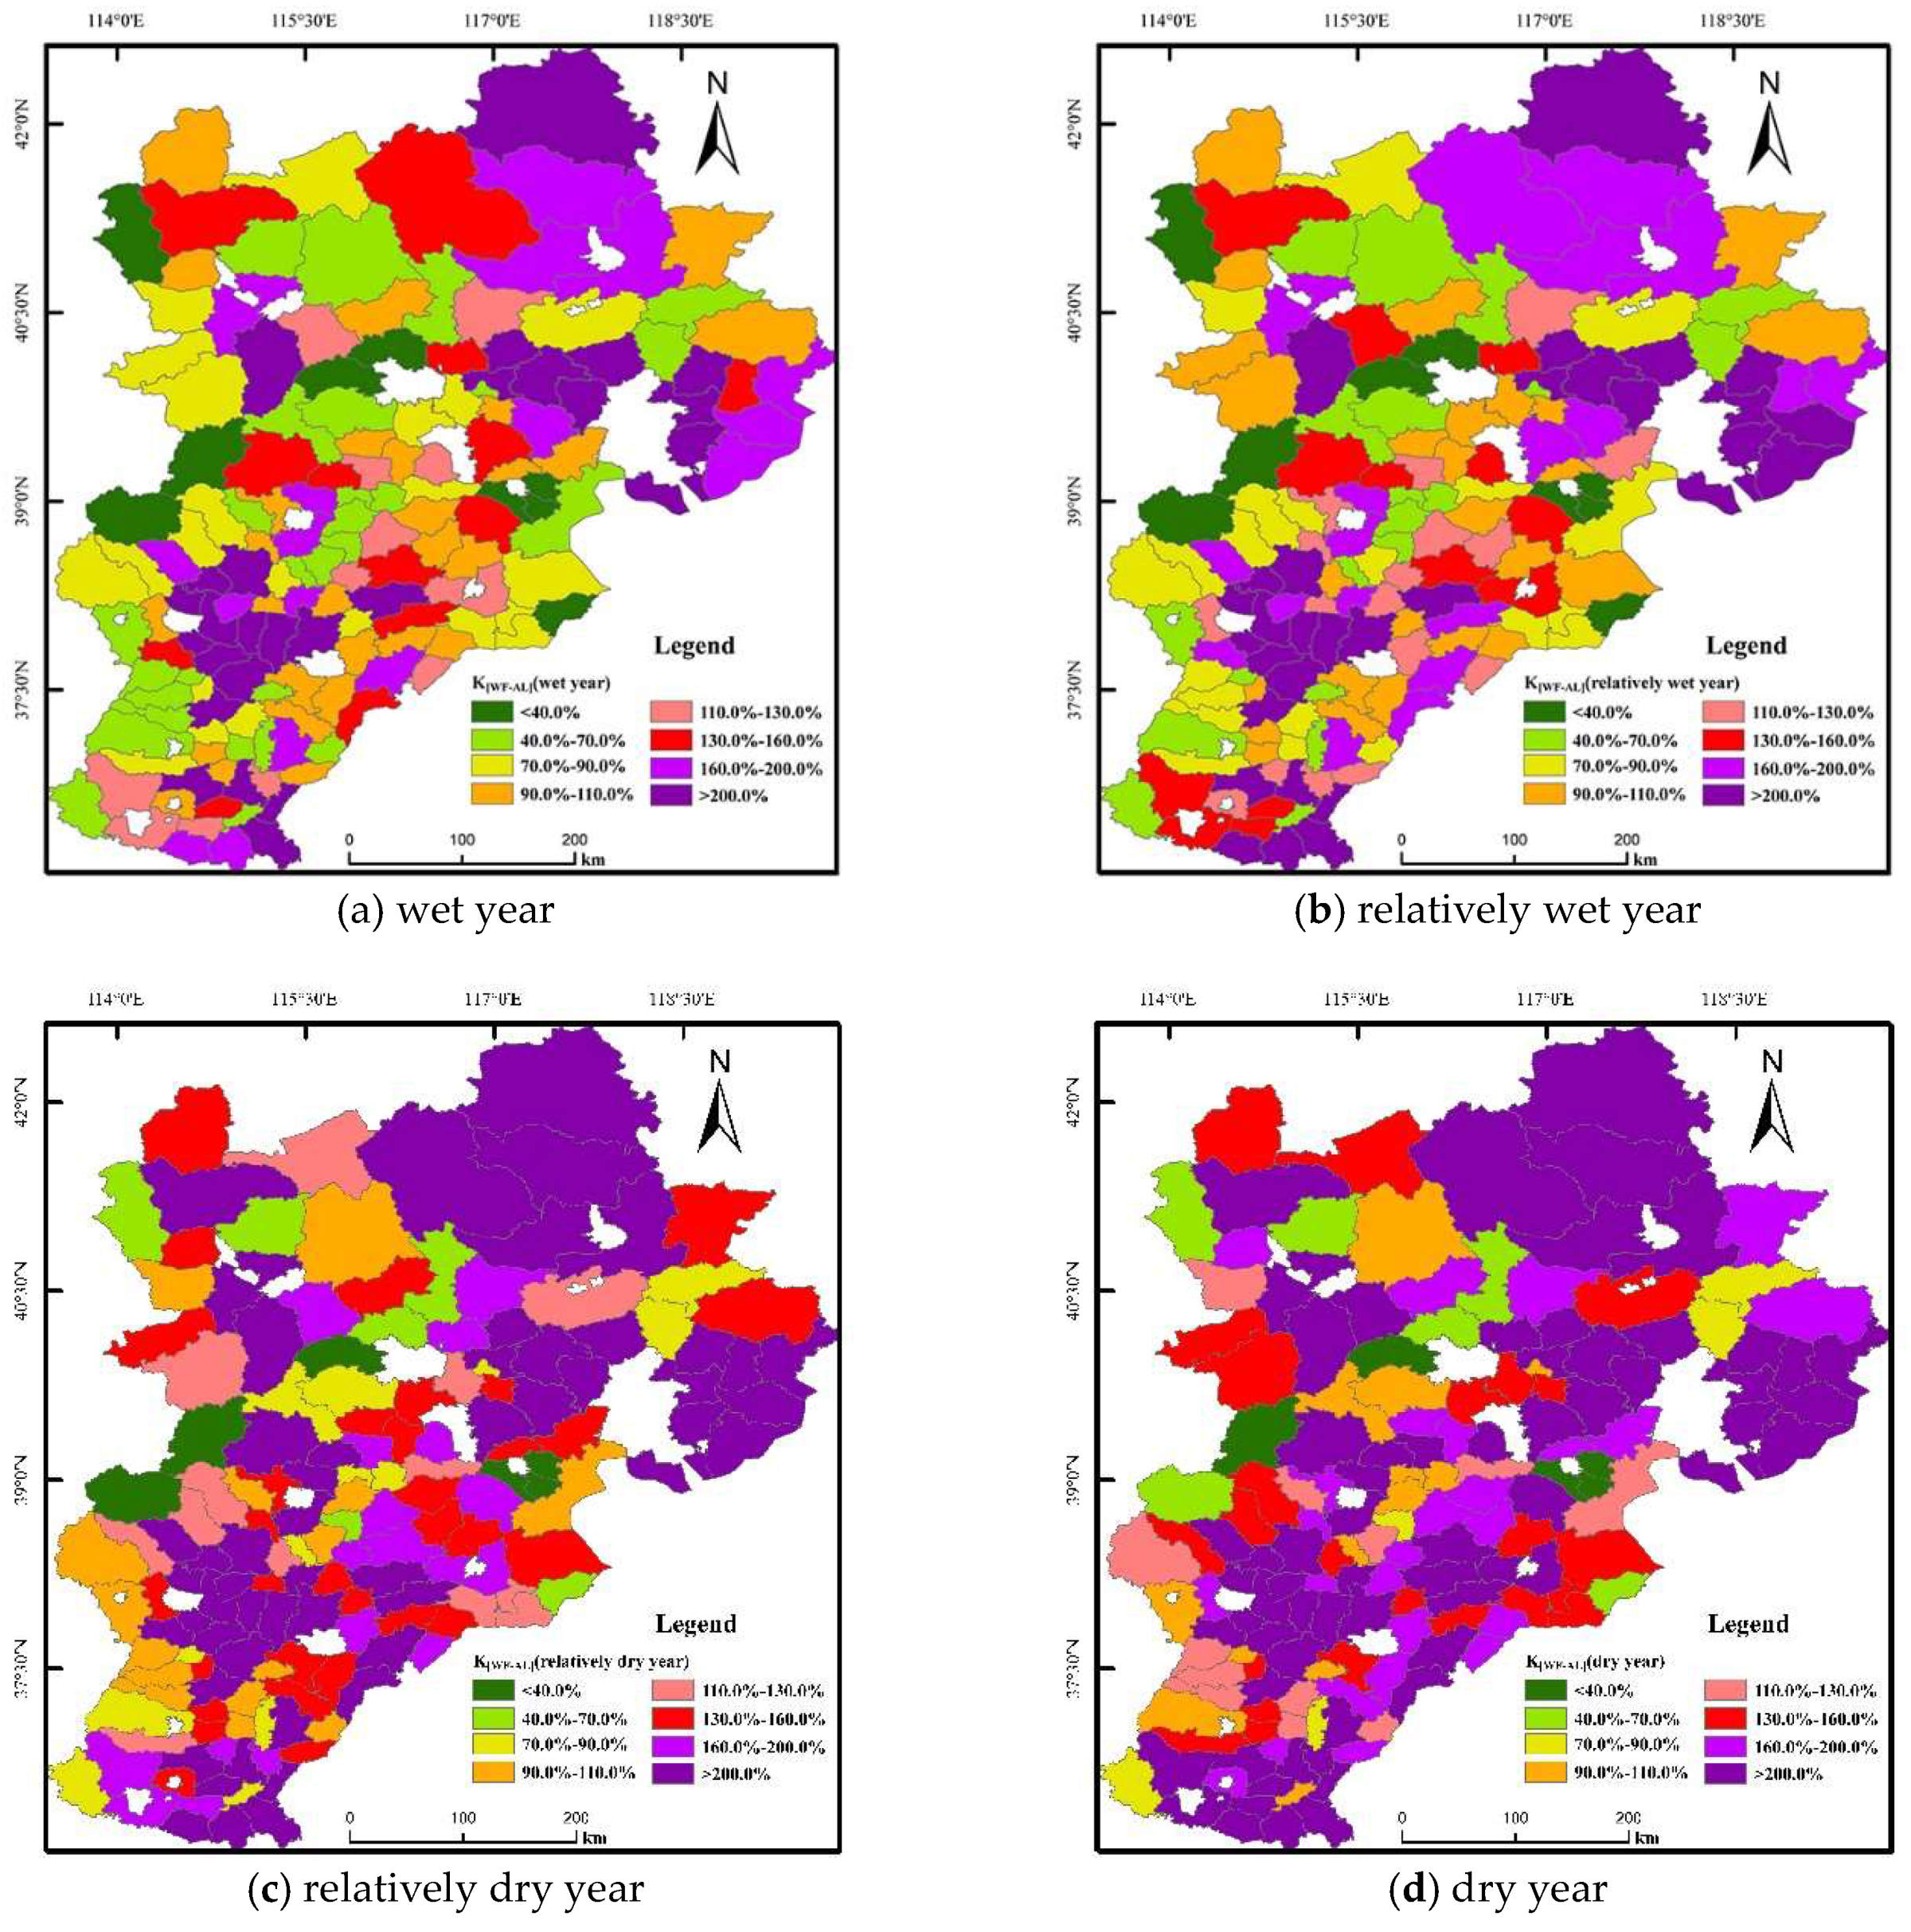
3.3.1. Early-Warning in Different Precipitation Years
3.3.2. Pressure Response Control of Water Resources
4. Discussion
4.1. Merits and Limitations of the Multi-Scale Study
4.2. Optimization of the Ecological Nodes
5. Conclusions
Author Contributions
Funding
Acknowledgments
Conflicts of Interest
References
- Hoekstra, A.Y.; Mekonnen, M.M. The water footprint of humanity. Proc. Natl. Acad. Sci. USA 2012, 109, 3232–3237. [Google Scholar] [CrossRef] [PubMed] [Green Version]
- Mekonnen, M.M.; Hoekstra, A.Y. Four billion people facing severe water scarcity. Sci. Adv. 2016, 2, e1500323–e1500328. [Google Scholar] [CrossRef]
- Ridoutt, B.G.; Pfister, S. A revised approach to water footprinting to make transparent the impacts of consumption and production on global freshwater scarcity. Glob. Environ. Chang. Hum. Policy Dimens. 2010, 20, 113–120. [Google Scholar] [CrossRef]
- Miglietta, P.P.; De Leo, F.; Toma, P. Environmental Kuznets curve and the water footprint: An empirical analysis. Water Environ. J. 2017, 31, 20–30. [Google Scholar] [CrossRef]
- Zhang, C.; Anadon, L.D. A multi-regional input-output analysis of domestic virtual water trade and provincial water footprint in China. Ecol. Econ. 2014, 100, 159–172. [Google Scholar] [CrossRef]
- Xiong, W.; Holman, I.; Lin, E.; Conway, D.; Jiang, J.; Xu, Y.; Li, Y. Climate change, water availability and future cereal production in China. Agric. Ecosyst. Environ. 2010, 135, 58–69. [Google Scholar] [CrossRef]
- Jiang, Y. China’s water scarcity. J. Environ. Manag. 2009, 90, 3185–3196. [Google Scholar] [CrossRef]
- He, S.; Shao, X. Spatial Clustering and Coupling Coordination of Population-Land-Economic Urbanization in Beijing-Tianjin-Hebei Region. Econ. Geogr. 2018, 38, 95–102. [Google Scholar]
- Wu, J.; Xu, D.; Xie, W.; Peng, J. Spatialization of Demographic Data at Medium Scale Based on Remote Sensing Images: Regarding Beijing-Tianjin-Hebei as an Example. Acta Sci. Nat. Univ. Pekin. 2015, 51, 707–717. [Google Scholar]
- Han, Y.; Li, X.; Huang, H.; Jia, D. Spatial and temporal distribution of water footprint of main crops and its influencing factors in Beijing-Tianjin-Hebei region. South—North Water Transf. Water Sci. Technol. 2018, 16, 26–34. [Google Scholar]
- Li, C.; Xu, M.; Wang, X.; Tan, Q. Spatial analysis of dual-scale water stresses based on water footprint accounting in the Haihe River Basin, China. Ecol. Indic. 2018, 92, 254–267. [Google Scholar] [CrossRef]
- Ren, L.L.; Wang, M.R.; Li, C.H.; Zhang, W. Impacts of human activity on river runoff in the northern area of China. J. Hydrol. 2002, 261, 204–217. [Google Scholar] [CrossRef]
- Yang, Y.; Tian, F. Abrupt change of runoff and its major driving factors in Haihe River Catchment, China. J. Hydrol. 2009, 374, 373–383. [Google Scholar] [CrossRef]
- Mekonnen, M.M.; Hoekstra, A.Y. A Global Assessment of the Water Footprint of Farm Animal Products. Ecosystems 2012, 15, 401–415. [Google Scholar] [CrossRef] [Green Version]
- Sun, S. Water footprints in Beijing, Tianjin and Hebei: A perspective from comparisons between urban and rural consumptions in different regions. Sci. Total Environ. 2019, 647, 507–515. [Google Scholar] [CrossRef] [PubMed]
- Chu, Y.; Shen, Y.; Yuan, Z. Water footprint of crop production for different crop structures in the Hebei southern plain, North China. Hydrol. Earth Syst. Sci. 2017, 21, 3061–3069. [Google Scholar] [CrossRef] [Green Version]
- White, D.J.; Feng, K.; Sun, L.; Hubacek, K. A hydro-economic MRIO analysis of the Haihe River Basin’s water footprint and water stress. Ecol. Model. 2015, 318, 157–167. [Google Scholar] [CrossRef]
- Wang, Z.; Liang, L.; Sun, Z.; Wang, X. Spatiotemporal differentiation and the factors influencing urbanization and ecological environment synergistic effects within the Beijing-Tianjin-Hebei urban agglomeration. J. Environ. Manag. 2019, 243, 227–239. [Google Scholar] [CrossRef]
- Liu, M.; Xu, X.; Wang, H.; Wang, F. Water Footprint and Spatial-temporal Analysis of Hebei Province Based on Virtual Water Theory. J. Nat. Resour. 2012, 27, 1022–1034. [Google Scholar]
- Li, Y.; Zhang, Z.; Shi, M. Restrictive Effects of Water Scarcity on Urban Economic Development in the Beijing-Tianjin-Hebei City Region. Sustainability 2019, 11, 2452. [Google Scholar] [CrossRef]
- Fan, L.; Wang, H.; Liu, Z.; Li, N. Quantifying the Relationship between Drought and Water Scarcity Using Copulas: Case Study of Beijing-Tianjin-Hebei Metropolitan Areas in China. Water 2018, 10, 1622. [Google Scholar] [CrossRef]
- Serio, F.; Miglietta, P.P.; Lamastra, L.; Ficocelli, S.; Intini, F.; De Leo, F.; De Donno, A. Ground water nitrate contamination and agricultural land use: A grey water footprint perspective in Southern Apulia Region (Italy). Sci. Total Environ. 2018, 645, 1425–1431. [Google Scholar] [CrossRef] [PubMed]
- Chapagain, A.K.; Hoekstra, A.Y.; Savenije, H.H.G.; Gautam, R. The water footprint of cotton consumption: An assessment of the impact of worldwide consumption of cotton products on the water resources in the cotton producing countries. Ecol. Econ. 2006, 60, 186–203. [Google Scholar] [CrossRef]
- Yano, S.; Hanasaki, N.; Itsubo, N.; Oki, T. Water Scarcity Footprints by Considering the Differences in Water Sources. Sustainability 2015, 7, 9753–9772. [Google Scholar] [CrossRef] [Green Version]
- Paterson, W.; Rushforth, R.; Ruddell, B.L.; Konar, M.; Ahams, I.C.; Gironas, J.; Mijic, A.; Mejia, A. Water Footprint of Cities: A Review and Suggestions for Future Research. Sustainability 2015, 7, 8461–8490. [Google Scholar] [CrossRef] [Green Version]
- Novoa, V.; Ahumada-Rudolph, R.; Rojas, O.; Saez, K.; de la Barrera, F.; Luis Arumi, J. Understanding agricultural water footprint variability to improve water management in Chile. Sci. Total Environ. 2019, 670, 188–199. [Google Scholar] [CrossRef] [PubMed]
- Li, J. Scenario analysis of tourism’s water footprint for China’s Beijing-Tianjin-Hebei region in 2020: Implications for water policy. J. Sustain. Tour. 2018, 26, 127–145. [Google Scholar] [CrossRef]
- Li, Y.; Wang, X.; Zhu, C.; Qiao, R. Research for Calculation and Prediction of Water Resource Ecological Footprint in Xingtai City, Hebei Province. Res. Soil Water Conserv. 2014, 21, 227–230. [Google Scholar]
- Wang, X.; Li, X.; Fischer, G.; Sun, L.; Tan, M.; Xin, L.; Liang, Z. Impact of the changing area sown to winter wheat on crop water footprint in the North China Plain. Ecol. Indic. 2015, 57, 100–109. [Google Scholar] [CrossRef]
- Yongqiang, C.A.O.; Jing, M.A. Empirical Study on Water Footprint of Water Resources Management in Hebei Province. J. Yangtze River Sci. Res. Inst. 2011, 28, 18–21. [Google Scholar]
- Han, Y.; Jia, D.; Zhuo, L.; Sauvage, S.; Sanchez-Perez, J.-M.; Huang, H.; Wang, C. Assessing the Water Footprint of Wheat and Maize in Haihe River Basin, Northern China (1956–2015). Water 2018, 10, 867. [Google Scholar] [CrossRef]
- Cheng, X.; Sun, R.; Chen, L.; Kong, P. Spatial and temporal patterns of the water footprint in the Beijing-Tianjin-Hebei region with consideration of crop and animal products and domestic water. Acta Ecol. Sin. 2018, 38, 4461–4472. [Google Scholar]
- Chapagain, A.K.; Hoekstra, A.Y. The water footprint of coffee and tea consumption in the Netherlands. Ecol. Econ. 2007, 64, 109–118. [Google Scholar] [CrossRef]
- Philipp, D.; Putman, B.; Thoma, G. Asas-Csas Annual Meeting Symposium on Water Use Efficiency at The Forage-Animal Interface: Life cycle assessment of forage-based livestock production systems. J. Anim. Sci. 2019, 97, 1865–1873. [Google Scholar] [CrossRef] [PubMed]
- Allan, J.A. Virtual water-the water, food, and trade nexus useful concept or misleading metaphor? Water Int. 2003, 28, 106–113. [Google Scholar] [CrossRef]
- Wang, Y.Y.; Wang, H.X.; Cai, Y. Calculation and analysis of water footprint in Beijing City. Chin. J. Eco-Agric. 2011, 19, 954–960. [Google Scholar] [CrossRef]
- Bao, C.; He, D. Spatiotemporal characteristics of water resources exploitation and policy implications in the Beijing-Tianjin-Hebei Urban Agglomeration. Prog. Geogr. 2017, 36, 58–67. [Google Scholar]
- Zhang, Y.; Li, Y.; Ouyang, Z.; Liu, J. The grey water footprint of the winter wheat-summer maize crop rotation system of the North China Plain. Acta Ecol. Sin. 2015, 35, 6647–6654. [Google Scholar]
- Wei, Y.; Tang, D.; Ding, Y.; Agoramoorthy, G. Incorporating water consumption into crop water footprint: A case study of China’s South-North Water Diversion Project. Sci. Total Environ. 2016, 545, 601–608. [Google Scholar] [CrossRef]
- Mekonnen, M.M.; Hoekstra, A.Y. The green, blue and grey water footprint of crops and derived crop products. Hydrol. Earth Syst. Sci. 2011, 15, 1577–1600. [Google Scholar] [CrossRef] [Green Version]
- Wang, Y.; Liu, J.; Zhao, D. Assessing Water Resources Based on Theory of Water Footprint—A Case Study in Xuanhua District, Zhangjiakou City, Hebei Province. Bull. Soil Water Conserv. 2018, 38, 213–219. [Google Scholar]
- Kayatz, B.; Harris, F.; Hillier, J.; Adhya, T.; Dalin, C.; Nayak, D.; Green, R.F.; Smith, P.; Dangour, A.D. “More crop per drop”: Exploring India’s cereal water use since 2005. Sci. Total Environ. 2019, 673, 207–217. [Google Scholar] [CrossRef] [PubMed]
- Miglietta, P.P.; De Leo, F.; Ruberti, M.; Massari, S. Mealworms for Food: A Water Footprint Perspective. Water 2015, 7, 6190–6203. [Google Scholar] [CrossRef]
- Ridoutt, B.G.; Sanguansri, P.; Harper, G.S. Comparing Carbon and Water Footprints for Beef Cattle Production in Southern Australia. Sustainability 2011, 3, 2443–2455. [Google Scholar] [CrossRef] [Green Version]
- Ma, D.; Xian, C.; Zhang, J.; Zhang, R.; Ouyang, Z. The Evaluation of Water Footprints and Sustainable Water Utilization in Beijing. Sustainability 2015, 7, 13206–13221. [Google Scholar] [CrossRef] [Green Version]
- Ibidhi, R.; Ben Salem, H. Water footprint and economic water productivity of sheep meat at farm scale in humid and semi-arid agro-ecological zones. Small Rumin. Res. 2018, 166, 101–108. [Google Scholar] [CrossRef]
- Lamastra, L.; Miglietta, P.P.; Toma, P.; De Leo, F.; Massari, S. Virtual water trade of agri-food products: Evidence from italian-chinese relations. Sci. Total Environ. 2017, 599, 474–482. [Google Scholar] [CrossRef] [PubMed]
- Yu, Y.; Zhang, H.; Hu, H. Water Resources Carrying Capacity of Livestock Husbandry in China Based on Water Footprint Theory. Resour. Sci. 2012, 34, 394–400. [Google Scholar]
- Lu, Y.; Payen, S.; Ledgard, S.; Luo, J.F.; Ma, L.; Zhang, X.Y. Components of feed affecting water footprint of feedlot dairy farm systems in Northern China. J. Clean Prod. 2018, 183, 208–219. [Google Scholar] [CrossRef]
- Shi-feng, Z.; Jun-xu, C. Research on the Risk of Water Resources Shortage in North China. J. Nat. Resour. 2009, 24, 1192–1199. [Google Scholar]
- Yuan, W.; Lianxi, S.; Ke, L.I.; Hongyan, S.U.N. Analysis of present situation of water resources and countermeasures for sustainble development in China. J. Water Resour. Water Eng. 2008, 19, 10–14. [Google Scholar]
- Xiqin, W.; Yuan, Z. The Allowable Exploitation Rate of Rivers Water Resources of the Seven Major Rivers in China. J. Nat. Resour. 2008, 23, 500–506. [Google Scholar]


| Region | Agricultural and Livestock Products | |||||||||||||
|---|---|---|---|---|---|---|---|---|---|---|---|---|---|---|
| Grain Crops | Cash Crops | Livestock Products | ||||||||||||
| Wheat | Maize | Paddy | Tubers | Peanut | Cotton | Vegetable | Fruit | Pork | Beef | Mutton | Poultry | Egg | Milk | |
| Hebei | 1.38 | 1.19 | 2.19 | 1.2 | 1.2 | 5.5 | 0.1 | 0.68 | 3.6 | 18.1 | 19.98 | 3.50 | 8.65 | 2.2 |
| Beijing | 1.23 | 0.84 | 1.4 | 0.7 | 1.5 | 4.4 | 0.2 | 0.58 | ||||||
| Tianjin | 1.25 | 0.76 | 1.19 | 0.88 | 1.5 | 5.22 | 0.1 | 0.48 | ||||||
| 2000–2002 | 2003–2005 | 2006–2008 | 2009–2011 | 2012–2014 | 2015–2016 | |
|---|---|---|---|---|---|---|
| Low consumption | 51.6% | 44.5% | 43.2% | 36.8% | 30.3% | 32.9% |
| Medium consumption | 29.0% | 27.1% | 32.9% | 28.4% | 34.2% | 29.0% |
| High consumption | 19.4% | 28.4% | 23.9% | 34.8% | 35.5% | 38.1% |
| 2000–2002 | 2003–2005 | 2006–2008 | 2009–2011 | 2012–2014 | 2015–2016 | County Number | |
|---|---|---|---|---|---|---|---|
| Mountain Area | 3.79 | 4.90 | 5.44 | 6.01 | 6.82 | 7.53 | 31 |
| Buffer Zone | 8.63 | 9.53 | 9.33 | 10.28 | 10.95 | 10.89 | 37 |
| Plain Area | 9.36 | 10.62 | 10.44 | 11.36 | 11.89 | 11.91 | 80 |
| Coastal Plain | 8.21 | 9.81 | 10.25 | 12.64 | 13.67 | 13.80 | 7 |
| L[WF-AL] (mm) | <−200 | (−200,−100) | (−100,0) | (0,100) | (100,200) | (200,300) | (300,400) | >400 |
|---|---|---|---|---|---|---|---|---|
| 2000–2002 | 27.7% | 9.7% | 14.2% | 14.8% | 9.7% | 4.5% | 4.5% | 14.8% |
| 2003–2005 | 23.9% | 11.0% | 8.4% | 11.6% | 10.3% | 9.7% | 4.5% | 20.6% |
| 2006–2008 | 21.3% | 10.3% | 12.3% | 13.5% | 8.4% | 8.4% | 7.1% | 18.7% |
| 2009–2011 | 16.1% | 11.6% | 10.3% | 12.3% | 10.3% | 6.5% | 7.7% | 25.2% |
| 2012–2014 | 9.0% | 14.8% | 10.3% | 12.3% | 10.3% | 9.0% | 5.2% | 29.0% |
| 2015–2016 | 9.7% | 12.3% | 10.3% | 16.1% | 9.0% | 6.5% | 5.2% | 31.0% |
| K[WF-AL] | <40% | 40%–70% | 70%–90% | 90%–110% | >110% | >200% |
|---|---|---|---|---|---|---|
| 2000–2002 | 12.3% | 21.3% | 10.3% | 14.8% | 41.3% | 12.9% |
| 2003–2005 | 7.1% | 21.3% | 8.4% | 12.9% | 50.3% | 16.8% |
| 2006–2008 | 5.8% | 22.6% | 9.7% | 15.5% | 46.5% | 17.4% |
| 2009–2011 | 5.8% | 12.9% | 12.9% | 11.6% | 56.8% | 19.4% |
| 2012–2014 | 5.2% | 11.0% | 12.9% | 11.6% | 59.4% | 23.9% |
| 2015–2016 | 5.8% | 9.0% | 11.0% | 13.5% | 60.6% | 25.8% |
| K[WF-AL], Now | K[WF-AL], Future | Limited Production of Agriculture | Limited Production of Livestock | Water Transfer |
|---|---|---|---|---|
| 0–0.4 | Maintain | - | - | - |
| 0.4–0.5 | drop to 0.4 | - | 10% | - |
| 0.5–0.7 | Drop to 0.4 | 10% | 30% | - |
| 0.7–0.8 | Drop to 0.7 | - | 10% | Reservoir water transfer |
| 0.8–0.9 | Drop to 0.7 | 10% | 10% | Reservoir water transfer |
| 0.9–1.1 | Drop to 0.9 | 10% | 15% | Cross-region water transfer |
| 1.1–1.3 | Drop to 0.9 | 10% | 30% | Cross-region water transfer |
| >1.3 | Drop to 0.9 | 30% | 30% | Cross-region water transfer |
© 2019 by the authors. Licensee MDPI, Basel, Switzerland. This article is an open access article distributed under the terms and conditions of the Creative Commons Attribution (CC BY) license (http://creativecommons.org/licenses/by/4.0/).
Share and Cite
Cao, C.; Lu, X.; Li, X. Risk Assessment and Pressure Response Analysis of the Water Footprint of Agriculture and Livestock: A Case Study of the Beijing–Tianjin–Hebei Region in China. Sustainability 2019, 11, 3693. https://0-doi-org.brum.beds.ac.uk/10.3390/su11133693
Cao C, Lu X, Li X. Risk Assessment and Pressure Response Analysis of the Water Footprint of Agriculture and Livestock: A Case Study of the Beijing–Tianjin–Hebei Region in China. Sustainability. 2019; 11(13):3693. https://0-doi-org.brum.beds.ac.uk/10.3390/su11133693
Chicago/Turabian StyleCao, Chen, Xiaohan Lu, and Xuyong Li. 2019. "Risk Assessment and Pressure Response Analysis of the Water Footprint of Agriculture and Livestock: A Case Study of the Beijing–Tianjin–Hebei Region in China" Sustainability 11, no. 13: 3693. https://0-doi-org.brum.beds.ac.uk/10.3390/su11133693