Article

Highlighting Regional Energy-Economic-Environmental Benefits of Agricultural Bioresources Utilization: An Integrated Model from Life Cycle Perspective

1
College of New Energy and Environment, Jilin University, 2699 Qianjin Street, Changchun 130012, China
2
Department of Industrial and Systems Engineering, Hong Kong Polytechnic University, Hong Kong SAR, China
*
Author to whom correspondence should be addressed.
Sustainability 2019, 11(13), 3743; https://0-doi-org.brum.beds.ac.uk/10.3390/su11133743
Submission received: 5 June 2019 / Revised: 3 July 2019 / Accepted: 3 July 2019 / Published: 9 July 2019
(This article belongs to the Section Energy Sustainability)

Abstract

:
Bioenergy utilization is ambitiously being promoted, attributed to its renewable and clean natures. China’s provincial regions have distinct levels of agricultural development, and thus, different levels of agricultural bioresources (ABs) potentials. In this study, an integrated assessment model is developed to quantify the 3E benefits from the life cycle perspective, covering the whole process of energy-oriented ABs utilization. Integrating nine types of ABs and four types of energy conversion modes (direct combustion power generation, gasification power generation, briquette fuel and bioethanol), the model is applied to 31 provincial regions in China to uncover regional features of the 3E benefits. The results showcase that total energy benefits in all regions amount to 100.6 million tons of coal-equivalent, with the most for Henan, Heilongjiang, Shandong, Xinjiang and Jilin and the least for Tibet, Beijing, Shanghai, Qinghai and Hainan. The economic and environmental benefits of regions are consistent with the energy benefits, with a total amount of 10.5 billion USD and 229.2, 1.5 and 2.5 million t CO2, SO2 and NOx mitigations. Energy utilization proportion of ABs, allocation proportion, energy conversion coefficients, net profit coefficient and mitigation coefficients for four modes are the key parameters affecting regional 3E benefits. The results have policy implications on facilitating to reasonable and pertinent regional planning of energy-oriented ABs utilization.

1. Introduction

With rapid economic development and increasing energy demand, the issues of energy shortage, global warming and environmental pollution have attracted worldwide concerns [1,2]. Facing the triple pressures mentioned above, bioenergy has drawn considerable interest as a sustainable energy source to replace the exhausting fossil fuels and ameliorate the environmental problems [3,4]. The combustion of biomass is considered as carbon neutral, as an equivalent amount of carbon dioxide is absorbed from the atmosphere during its growth. This is especially true for the agricultural crops, which replenish themselves through re-growth [5]. The agricultural bioresources (ABs), such as crop straw and various agricultural residues, have grown dramatically along with significant population growth and agricultural development in China, where the average annual increase rate of ABs is higher than 4% [6]. Besides the “renewable” and “clean” natures, ABs are also characterized with easy collection, storage and transport. They can be directly converted into solid, liquid and gas forms, all of which can play important roles in replacing fossil fuels and meeting energy demand [7]. However, more than 30% of the ABs are currently being discarded and burned by farmers as per tradition in China, which aggravates the air quality deterioration [8]. Therefore, once utilized for bioenergy production, ABs can help to create energy and environmental benefits of large potentials. The Chinese government proposed the goal in “The 13th five-year plan for bioenergy development”, that bioenergy development should be oriented towards industrialization and commercialization, which allows China to achieve the targets of yearly 58 million tons of coal equivalent (Mtce) production and 15 GW installed capacity by 2030 [9].
Sufficient supply and optimized logistics process of ABs provide the basis to ensure the industrial development of ABs utilization. The assessment of ABs potentials mainly includes static and dynamic assessment based on three levels of accountings, including the theoretical reserve, the collectible quantity and the utilizable quantity for bioenergy production [10], based on which the temporal and spatial analyses can be conducted resorting to Geographic Information System. Most researchers adopted the quantification method provided by the Food and Agriculture Organization, which combines the grain yield with straw-grain ratio of crops. Zhong et al. [11], Weiser et al. [12], Portugal-Pereira et al. [13], Avcioglu et al. [14] and Haase et al. [15] made assessment of the ABs potentials in Gansu Province, Gamany, Brasil, Turkey and five European regions, respectively with the aforementioned method. Besides, Ji predicted the yield of ABs in China with an artificial neural network (ANN) mode and showed that the theoretical output of crop residues in China at national scale could be up to 930.8 Mt in 2015. [16]. Wang et al. used statistical data, simulation modeling, and a dynamic analysis framework to evaluate the potential and distribution of regional ABs in Heilongjiang, China and indicated that 32.48 × 10⁶ t of ABs were available in 2003, which soared to 77.13 × 10⁶ t in 2013. [17]. When the potential and intensity of ABs are quantified, it entails to design a complete logistics process from the ABs collection points to the bioenergy projects, covering the collection, transport, storage and pretreatment of ABs [18,19]. The whole process should be optimized to target the minimization of cost and environmental impacts and the maximization of energy production [20,21]. Aldana et al. incorporated bioenergy production maximization and the total cost minimization by constructing a comprehensive mixed integer linear programming (MILP) model to analyze the supply chain of biofuel production with ABs in Mexico [22]. Ebadian et al. established an integrated biomass supply analysis and logistics-multi-crop (IBSAL-MC) model to simulate and optimize the logistics process of mixed ABs for fuel ethanol production to achieve maximized feedstock supply and minimized cost [23].
The bioenergy projects to which the ABs are transported correspond to multiple energy conversion technologies or modes, which convert ABs into electricity, heat, and solid, liquid and gaseous fuels [24]. These technologies present diverse energy, environmental and economic performances, reflected in the total energy production, greenhouse gas and air pollutant mitigation, investment and operational cost, net profit, etc. Against the distinctions of the above indicators among the technologies, numerous scholars have conducted assessments adopting divergent methods, such as life cycle assessment (LCA) [5,25], emergy method [26], cost benefit analysis [27], data envelope analysis (DEA) [28] and so on. For some technology-specific examples, Delivand et al. [29], Nguyen et al. [30], Hu et al. [31], Shie et al. [32] and Wang et al. [33] conducted assessments of the performances of the technologies of direct combustion power generation, gasification power generation, briquette fuel, syngas and bioethanol respectively, by setting scenarios through changing the technological scales and parameters. Among the methods employed, LCA is the most widely used one that is capable of quantifying the environmental and economic outcomes completely and elaborately. Song et al. made life cycle environmental and economic assessments of the corn stalk pellet fuels with yearly 10 kt and 50 kt production capacity in Jilin Province, China and indicated that the utilization of corn stalk can eliminate 90.46% of the life cycle GHG emissions by replacing coal burning. [34]. Cambero et al. presented a life cycle analysis of greenhouse gas (GHG) emissions of alternative bioenergy systems that consist of four combustion and gasification technologies in two remote communities in Canada [35]. Wong et al. conducted an LCA on converting lignocellulosic biomass into biodiesel by estimating the well-to-wheel GHG emissions and found that the GHG emissions were 53.4%–61.1% lower than fossil-based diesel [36].
Besides, some researchers focused on the overall sustainability of regional ABs utilization. Most of them tried to incorporate multiple indicators that allow to comprehensively quantify the sustainability degree. For example, Martire et al. applied a sustainability impact assessment (SIA) on local bioenergy development in the alpine area of Lake Como (Italy) by modeling 11 scenarios considering different biomass utilizations, mechanization levels, combustion technologies, and subsidies schemes [37]. Kudoh et al. assessed the sustainability of biomass utilization in the East Asian countries based on the needs and potential of bioresources and formulated a set of main and secondary indicators for biomass utilization under the three pillars of sustainability [38]. Hayashi et al. provided clarification on the concept of sustainability in the context of the Global Bioenergy Partnership indicators and developed a holistic assessment tool for evaluating the sustainability of bioenergy programs [39]. These studies further highlighted the advantages of energy-oriented ABs utilization from the perspective of regional sustainable development.
China has a vast territory, whose provincial regions have distinct levels of agricultural development and thus different levels of ABs potentials. In light of the ambitious targets of bioenergy production proposed, each region is supposed to facilitate to energy-oriented ABs utilization and create the maximum energy, environmental and economic (3E) benefits. Among the reviewed studies, few have made a holistic assessment of the 3E benefits involving multiple types of ABs and energy conversion modes on a region by region case. Regional 3E benefits could be achieved to what extent and the spatial disparities of regional 3E benefits still remain elucidatorily revealed. In this study, an integrated assessment model is constructed to quantify the 3E benefits from life cycle perspective via considering the whole process of energy-oriented ABs utilization (collection, transport, energy conversion and final use) via multiple modes. The model is applied to 31 provincial regions in China to explicitly uncover the spatial disparities with regard to the 3E benefits, aiming at providing reference to better decision-making on regional biomass development and utilization.

2. Model Formulation

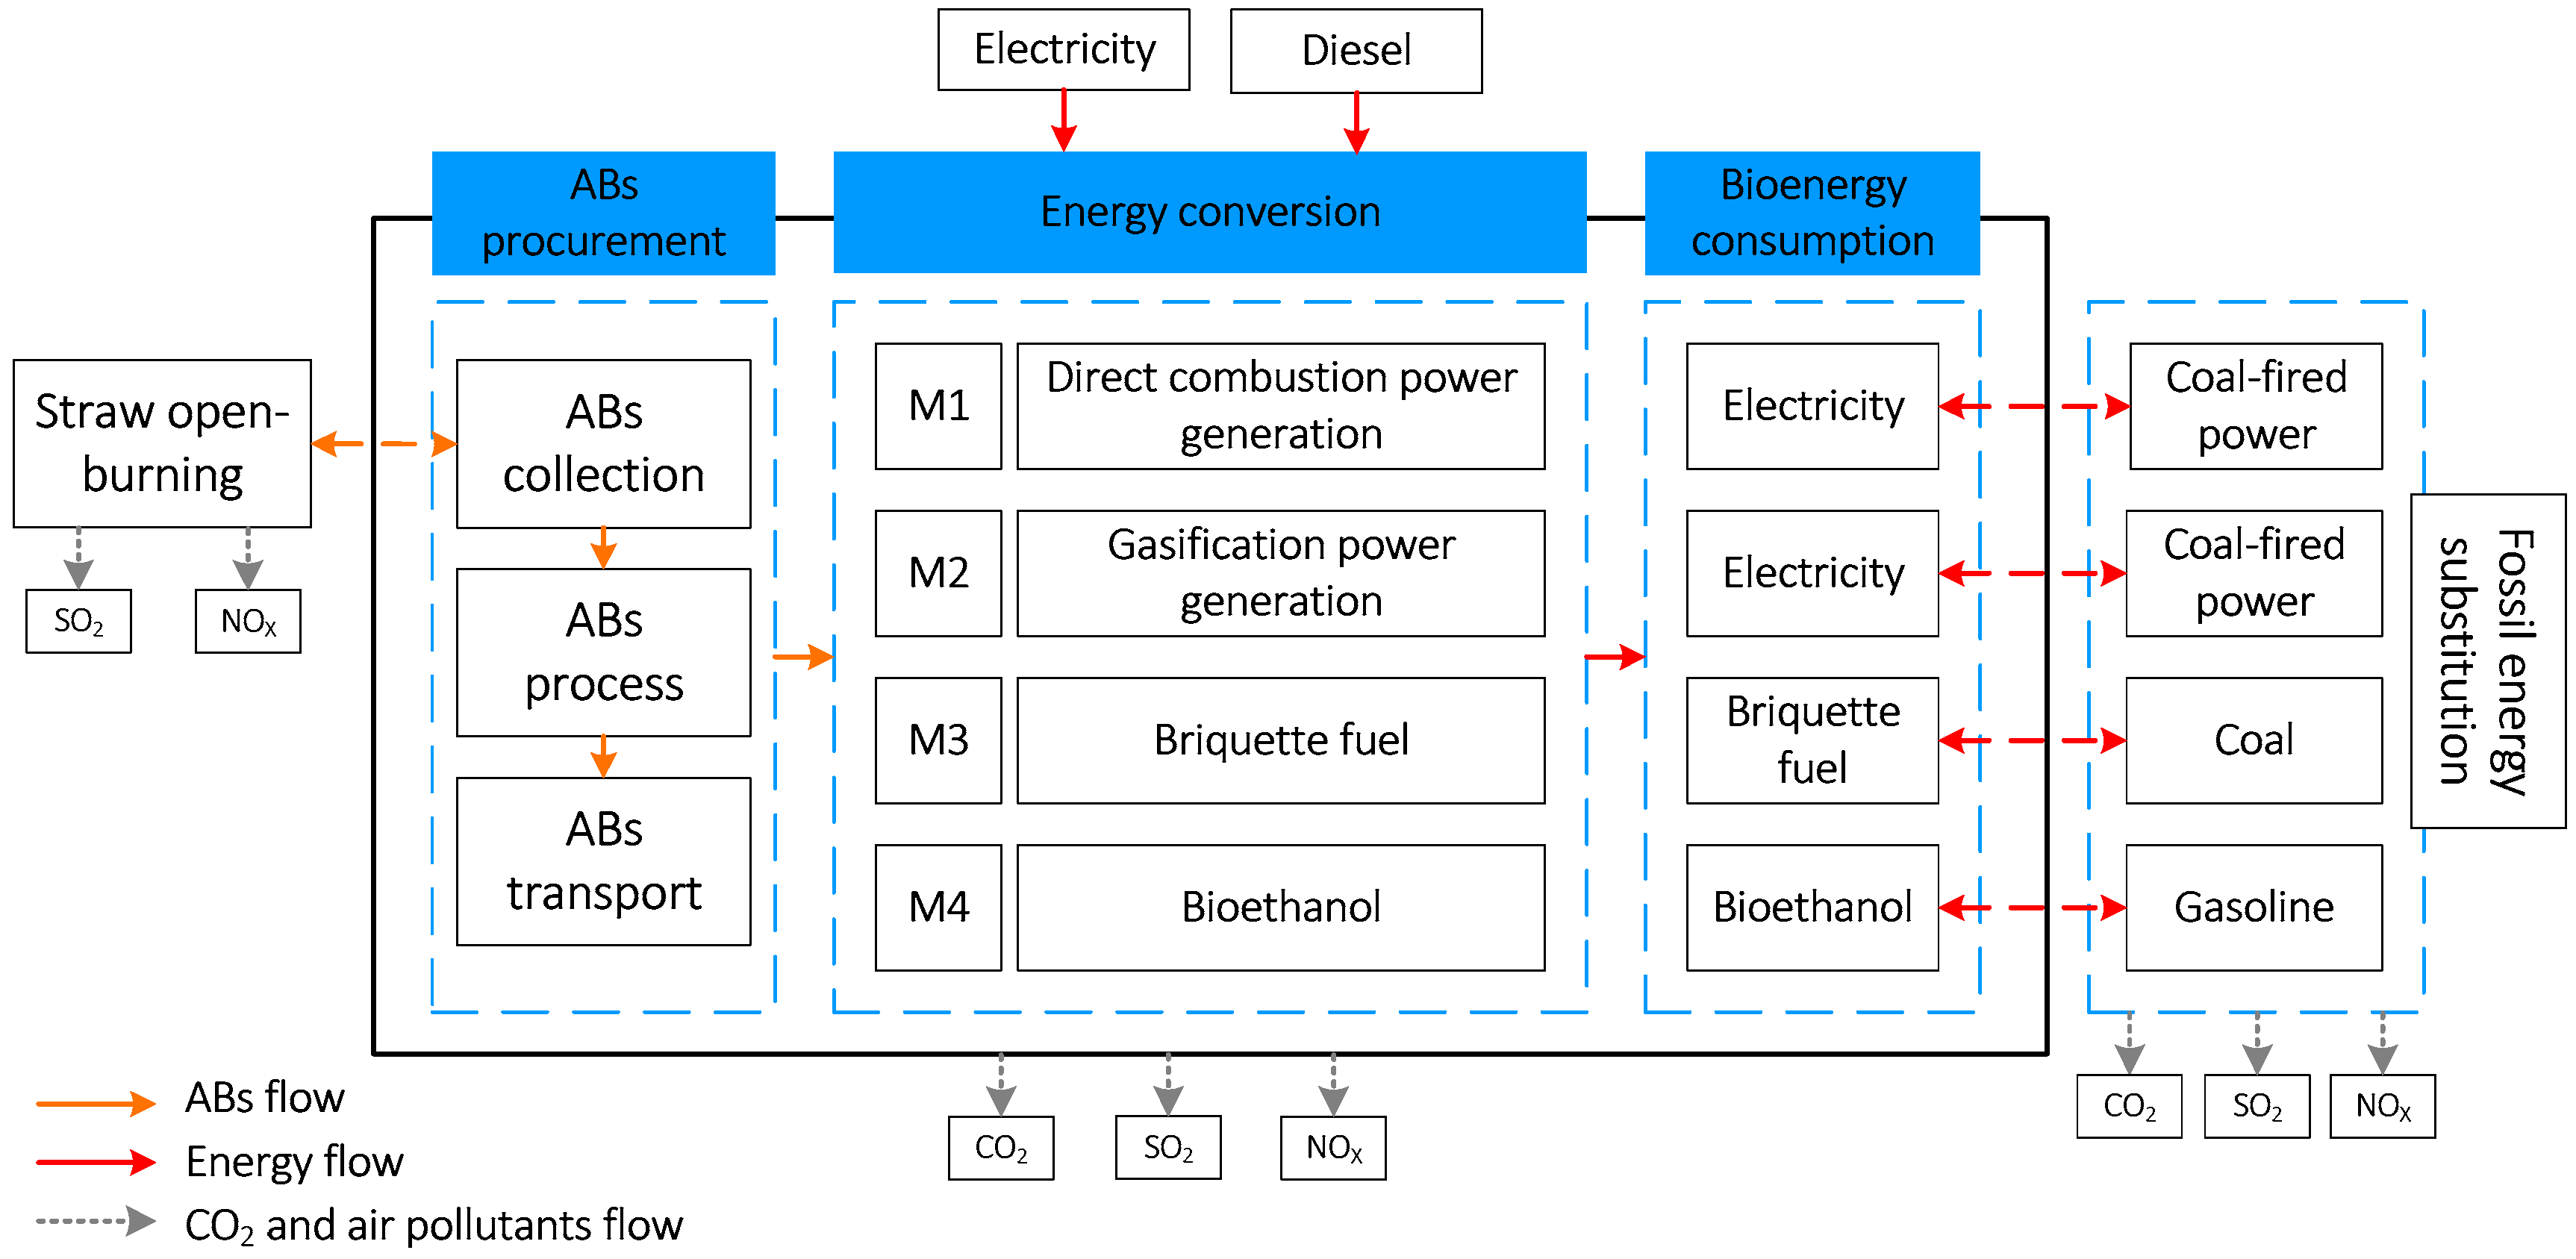
2.1. Energy Benefits of Agricultural Bioresources Utilization

We use the subscript i to denote the type of crop in a region. It is assumed that the quantities of different types of ABs from the crops are summable and that there are no differences for different types of ABs when they are used for energy purposes. The energy benefits of ABs for a region are calculated based on three levels: theoretical reserve ( Q i t ) (the quantity of ABs that exist theoretically), collectible quantity ( Q i c ) (the quantity of ABs that can be collected from the theoretical reserve) and utilizable quantity for bioenergy production (Qa) (the quantity of the part of the collectible ABs that can be used for bioenergy production). Hereby, bioenergy production refers to the production of bioenergy products (biomass power and biofuels). For the ABs of crop i, Q i c is expressed as the grain yield (Yi) multiplying straw-grain ratio (ηi) (the ratio of the quantity of ABs to the quantity of grain yield of a certain kind of crop) and collection coefficient (λi) (the percentage of the collectible quantity in the theoretical reserve of a certain kind of ABs). Total utilizable quantity of all collectible ABs (Qa) in a region is expressed as the sum of Q i c , multiplying the energy utilization proportion (ξ) (the percentage of the utilizable quantity for bioenergy production in the total collectible quantity, with the rest used in other ways, such as home burning, straw turnover, fertilizer, feed, papermaking, etc.) as:
Q i c = λ i Q t = λ i η i Y i
Q a = ξ i Q i c
We use j to denote the type of energy conversion mode. All the utilizable ABs for bioenergy production are allocated to several energy conversion modes in a region. An allocation proportion of ABs (μj) (the percentage of utilizable quantity for bioenergy production for a certain mode in total utilizable quantity) is set for mode j. Each mode is with an energy conversion coefficient of ABs (ςj) (tce/t-ABs) (bioenergy production amount of unit AB). Total energy benefits of ABs utilization through mode j (ENj) are the sum of bioenergy production under mode j.
E N j = j ς j μ j Q a   ( j μ j = 1 )

2.2. Economic Benefits of Agricultural Bioresources Utilization

2.2.1. Total Cost of ABs Utilization

We use m to denote a bioenergy project under mode j in a region. The life cycle cost of project m (Cm) consists of the procurement cost of ABs ( C m p ) and the operation cost of energy conversion ( C m o ). The procurement cost includes acquisition cost (buying ABs from farmers) ( C m p - a ), process cost (binding and compression of ABs) ( C m p - p ), transport cost (transport of ABs to the bioenergy projects) ( C m p - t ) and other cost (loading, storage, etc.) ( C m p - o ).
C m = C m p + C m o
C m p = C m p - a + C m p - p + C m p - t + C m p - o
Determination of the transport cost of ABs is the most intractable due to complex transport routes. Hereby, we assume a resource-island distribution pattern of ABs. The resource-islands are circular collection areas distributed around a bioenergy project. Different types of ABs are evenly distributed within a resource-island, with no differences in collection and transport. The collection radius in each resource-island is constant. In each resource-island, ABs are collected and transported to the center for binding and compression, which is a process called transportation within the island. The ABs harvested in all resource-islands are transported to the bioenergy project, which is a process called transportation outside the island [40].
C m p - t - k , i n = 0 R m k 2 f π r m k 2 D m k ρ p - t d r m k = 2 3 f ρ p - t π D m k R m k 3
C m p - t - k , o u t = f ρ p - t Q m k L m k
where R m k is the radius of island k; D m k is the ABs density of island k; L m k is the distance between island k and project m. R m k and L m k are closely relevant to the scale of project m. Total ABs demand of project m are provided by a certain number of resource islands. For island k, the transport cost contains the cost within the island ( C m p - t - k , in ) and the cost outside the island ( C m p - t - k , out ). They are calculated by the transport distance multiplying the quantity of ABs collected within island k ( Q m k ) and the price rate of transport (ρp-t) (USD/t*km). Particularly, the transport distance inside an island is determined by the integral infinitesimal method as Formula (6). A tortuosity factor of road f is adopted considering that the road is not perfectly straight.
The ABs demanded by project m (Qm) are provided by all resource islands. Total transport cost ( C m p - t ) is the sum of the cost for all resource islands. The acquisition cost ( C m p - a ), process cost ( C m p - p ) and other cost ( C m p - o ) are calculated by corresponding price rate (ρp-a, ρp-p and ρp-o) (USD/t) multiplying Qm.
Q m = k Q m k
C m p - t = k ( C m p - t - k , i n + C m p - t - k , o u t )
C m p - a + C m p - p + C m p - o = ( ρ p - a + ρ p - p + ρ p - o ) Q m
The operation cost of energy conversion of project m ( C m o ) is determined by unit operation cost ( ρ m o ) (USD/tce) multiplying total bioenergy production of project m (Sm).
C m o = ρ m o S m

2.2.2. Total Profit Contributed by ABs Utilization

The net profit of project m (ECm) is yielded by gross sale (calculated according to the price of unit bioenergy product produced by mode j (ρj) and Sm) deducting total cost. Total economic benefits of ABs utilization through mode j (ECj) are the sum of net profit of all bioenergy projects under mode j.
E C m = ρ j S m C m
E C j = m E C m

2.3. Environmental Benefits of Agricultural Bioresources Utilization

We define the environmental system boundary of energy-oriented ABs utilization into four stages as collection, transportation, energy conversion and final use. Due to the difficulty in data accessibility on the construction of bioenergy projects and transport of bioenergy products to the consumers, these two processes are not incorporated [41].

2.3.1. Benchmark Emissions

A benchmark is set by assuming that if the ABs are not utilized for bioenergy production through project m, they would be open-burned, resulting in air pollutant emissions ( E m b ) (CO2 emissions are not considered due to the carbon neutral nature of ABs), which can be calculated by the emission factor of open burning of ABs (eAB) multiplying Qm. eAB denotes the emission factor for SO2 or NOx.
E m b = e A B Q m

2.3.2. Emissions during Procurement of ABs

The emissions generated during ABs process ( E m p - p ) are calculated according to the diesel consumption factor of ABs process (φp-p), emission factor of diesel burning (eD) and Qm. The emissions generated during ABs transport ( E m p - t ) are calculated according to the diesel consumption factor of ABs transport (φp-t), eD, transport distance (determined referring to Formulas (6) and (7)) and Qm.
E m p = E m p - p + E m p - t
E m p - p = e D ϕ p - p Q m
E m p - t = k e D ϕ p - t ( 2 3 f π D m k R m k 3 + f Q m k L m k )

2.3.3. Emissions during Project Operation

During energy conversion process, a bioenergy project has to consume fossil fuels or thermal power to maintain or assist in its operation, which may lead to CO2 and air pollutant emissions.
E m o = e F F m o
where E m o denotes the emissions during project operation; F m o is the consumption amount of fossil fuels or thermal power during project operation; eF is the emission factor corresponding to fossil fuels or thermal power.

2.3.4. Reduced Emissions Due to Substitution of Fossil Fuels

The energy products of project m could substitute fossil fuels and thus contribute to emission reduction. The amount of substituted fossil fuels equals to the amount of the bioenergy products of project m (Sm):
E m s = e F S m
where E m s denotes the emission reduction due to substitution of fossil fuels.

2.3.5. Emissions during Utilization of Energy Products

When the bioenergy products of project m are being consumed, there are also emissions generated:
E m u = δ j S m
where E m u denotes the emissions from consumption of the bioenergy products of project m; δj is the emission factor of the bioenergy product corresponding to mode j.

2.3.6. Mitigated Emissions Attributed to ABs Utilization

Total mitigated emissions contributed by project m (EVm) can be calculated combining the five aspects above. Total environmental benefits of ABs utilization through mode j (EVj) are the sum of the mitigated emissions of all bioenergy projects under mode j.
E V m = E m b E m p E m o + E m s E m u
E V j = m E V m

3. Data Presentation

3.1. Conversion Coefficients of ABs

In total, nine kinds of crops are considered in this study including rice, wheat, corn, soybean, potato, cotton, peanut, oilseed rape and sugarcane. The straw-grain ratio (ηi) and collection coefficient (λi) are obtained from Liu et al.’s study [42].
The study area of this work is the 31 provincial regions of China, including 20 provinces, five autonomous regions and five municipalities directly under the central government. According to the locations, they can be divided into the Northeastern regions, North regions, East regions, Central and South regions, Southwest regions and Northwest regions. Another study we are currently conducting evaluates the suitability for the industrial development of energy-oriented ABs utilization in the 31 regions. All regions are classified into five ranks. A higher rank for a region implies that the region is more suitable for the industrial development of energy-oriented ABs utilization in terms of the bioresource potential, development demands (indicated by the growth rate of electricity consumption, proportion of thermal power in regional total power generation, non-compliance rate of air quality, etc.) and development conditions (indicated by rural population, total output value of agriculture, energy conservation and environmental protection expenditure, etc.) in this region. Hereby we assume that the energy utilization proportion (ξ) is consistent with the rank for a region, namely a region with a higher rank has a larger energy utilization proportion, as presented in Table 1. Such an assumption takes into account the need of croplands for straw turnover and to a large extent maximizes regional energy benefits of ABs utilization. The quantity of grain yields of nine kinds of crops can be obtained from China Statistical Yearbook [43] and China Rural Statistical Yearbook [44] (with 2016 as the study year).

3.2. Environmental and Economic Coefficients of Energy Conversion Modes

According to Wang et al.’s study, which makes an integrated assessment of seven energy conversion modes for ABs and yields a prioritization with regard to their sustainability performances [45], we select the four top-ranked modes, including direct combustion power generation (M1), gasification power generation (M2), briquette fuel (M3) and bioethanol (M4) that have developed for years in China with better maturity and development prospect as typical modes for ABs utilization.
The transport cost is most mutable among the procurement cost that varies along with the collection radius and transport distance. The radius of a resource island ( R m k ) is assumed to be 3 km. Considering divergent demands of the energy conversion modes for ABs, the transport distance ( L m k ) outside the island is respectively assumed as 20 km, 10 km, 5 km and 30 km for four modes. The values of the tortuosity factor of road (f), price rate of acquisition (ρp-a), process (ρp-p), transport (ρp-t) and other cost (ρp-o) are referred to Wang et al.’s study [40].
We attempt to use the average values of the economic and environmental data of some bioenergy projects under mode j to represent the levels of cost/profit and environmental emissions/mitigations of mode j (j = 1, 2, 3, 4). A functional unit is determined as 1 Mtce (unit bioenergy product of mode j). All data on the costs/profits and environmental emissions/mitigations of M1–M4 under the functional unit can be calculated by referring to the results of the techno-economic assessments and LCA of the four modes with divergent scales, by resorting to the methods elaborated in Section 2.2 and Section 2.3 [6,7,34,45,46,47].
Specifically, the system boundary of ABs utilization through M1–M4 is depicted in Figure 1. In particular, a benchmark scenario where open-burning of straw occurs, is set. The figure shows the whole process of ABs utilization from ABs collection to the final use of bioenergy products, as well as the substitutional relationship between a pair of bioenergy product and fossil energy product (e.g., electricity produced by M1, coal fired power). All the coefficients regarding energy conversion and economic and environmental benefits of M1–M4 are summarized in Table 2. There may be differences in the allocation proportion of ABs (μj) for four modes in different regions. Such information cannot be obtained on a region-by-region basis. Hereby we uniformly assume the allocation proportion of ABs for four modes as M1 (50%), M2 (10%), M3 (30%) and M4 (10%), based on the collectible quantity of ABs in each region considering the maturity and penetration of technologies.

4. Results and Discussion

4.1. Regional Energy Benefits of ABs Utilization

According to the grain yield of each region and straw-grain ratio of each kind of crop, the theoretical reserve and collectible quantity of ABs in each region are calculated, with the latter illustrated in Figure 2. Among 31 regions, Henan, Heilongjiang, Shandong, Xinjiang and Jilin are the top-five regions with more ABs. The collectible quantity of ABs in Henan amounts to larger than 60 Mt. The regions with smaller area (Shanghai, Beijing) and the least developed regions (Tibet and Qinghai) have the least ABs. Some spatial features can be revealed from Figure 2 from the ABs structure perspective. The structure of ABs in the northeast is dominated by corn. The northern regions have a larger proportion of wheat and corn. The eastern regions have a larger proportion of wheat and rice. Rice accounts for a larger proportion in the ABs structure in the southern regions. The structure of ABs in the northwest is similar to that in the northeast, however, with a much smaller total quantity. Observably, Xinjiang has a much larger proportion of ABs from cotton (nearly 2/3), which is due to the larger straw-grain ratio of cotton.
According to the energy utilization proportion for regions pre-assumed in Table 1, the energy benefits for each region can be attained. The spatial distribution of the energy benefits for 31 regions is depicted in Figure 3. Henan and Heilongjiang pertain to the first level, with the energy benefits larger than 9 Mtce. Shandong, Hebei, Jilin and Xinjiang belong to the second level, with the energy benefits ranging within 6 to 9 Mtce. Larger collectible quantity of ABs and larger energy utilization proportion jointly contribute to larger energy benefits in these regions. Level three and level four involve nine regions and 16 regions, respectively. Shanghai, Beijing, Qinghai and Tibet are the most disadvantageous, due to either smaller area of croplands or undeveloped agricultural development. Total energy benefits in all regions amount to 100.6 Mtce, which could account for 2.3% in total energy consumption of China in 2016. Seen from a national perspective as in Figure 4, M3 contributes to 67.2% of total energy benefits, due to higher (30%) allocation proportion of ABs and much larger energy conversion coefficient (0.54 tce/t-ABs).

4.2. Regional Economic Benefits of ABs Utilization

The economic benefits of ABs utilization are indicated by the net profits, which present a similar pattern to that of the energy benefits as delineated in Figure 5. The regions with larger energy benefits also have more considerable economic benefits. For example, total net profits created in Henan by four modes could reach 1.08 billion USD, followed by that in Heilongjiang (0.96), Shandong (0.92) and Xinjiang (0.77). Also, Shanghai, Beijing, Qinghai and Tibet have less economic benefits. Total economic benefits in all regions amount to 10.53 billion USD.
According to what Table 2 presents, M4 has a much larger net profit coefficient (442.21 USD/tce) compared with other modes. Though, with a smaller allocation proportion (10%), M4 contributes to the highest proportion of economic benefits among four modes, which comes to around 50% in each region. However, M1, which is more technologically mature and widely adopted, is not the most advantageous in terms of economic benefits.

4.3. Regional Environmental Benefits of ABs Utilization

The environmental benefits of ABs utilization are indicated by the mitigations of CO2, SO2 and NOx emissions, aimed to highlight the merits of ABs utilization in ameliorating global warming and air pollution. Similarly, the pattern of environmental benefits is overall consistent with that of the energy benefits and economic benefits, as illustrated in Figure 6. The regions with larger energy benefits also contribute to more substantial environmental benefits. Henan, Heilongjiang, Shandong, Hebei, Jilin and Xinjiang are more environmentally advantageous. Total CO2, SO2 and NOx mitigations in Henan could amount to 24.32 Mt, 0.16 Mt and 0.25 Mt, respectively. Likewise, the environmental benefits in Shanghai, Beijing, Qinghai and Tibet are very tiny.
Observed on the national level, total mitigations of CO2, SO2 and NOx emissions are 229.23 Mt, 1.53Mt and 2.48 Mt, respectively. For CO2 mitigation, M3 contributes to the highest proportion (69.1%), followed by M1 (18.7%), M4 (8.9%) and M2 (3.2%). A similar pattern appears for SO2 mitigation with M3 contributing to the most (68.8%). While M1 dominates NOx mitigation, contributing to 45.5%. M2 contributes to the least CO2 and NOx mitigations. M4 has negligible contribution to SO2 mitigation. The above results are the outcomes closely related to the combinations of the energy conversion coefficients and mitigation coefficients provided in Table 2.

4.4. Uncertainty Analysis

The assumptions of some parameters such as energy utilization proportion of ABs, allocation proportion of ABs for four modes, and the energy conversion coefficients and economic and environmental coefficients for four modes could bring uncertainties to the results.
First, we assume that the quantity of different types of ABs is practically summable. Also, we assume no differences for different types of ABs when they are used for energy purposes, namely that their colorific values are consistent. Whereas practically the distinctions of the colorific values of different kinds of ABs may yield different energy conversion results.
We set the energy utilization proportion of ABs for each region according to five ranks reflecting whether a region is suitable for the industrial development of energy-oriented ABs utilization. When the utilization proportion of ABs for the regions belonging to Rank V is increased to the level comparable to that for the regions belonging to Rank I, the results of regional energy benefits in these regions will increase by 36%. Such a rate will be 25% and 17% for the regions belonging to Rank IV and Rank III. However, higher energy-oriented utilization proportion of ABs in these regions is difficult to attain practically.
The allocation proportion of ABs for four modes are set according to the maturity and penetration of technologies. Thus, M1 as the earliest initiated and widely spread energy conversion mode of ABs is set with a higher proportion (50%), followed by that for M3 (30%) (more simple for operation, but non-competitive for industrial development), M2 (10%) and M4 (10%) (with a higher cost and complex demand for techniques). Hereby, we set a 100% allocation proportion of ABs for a certain mode and 0% for the remaining three. The energy benefits for each are 36.5%, 31.9%, 223.9% and 113.9% of the original values according to the settings in Table 3. M3 presents its advantage when allocated more ABs.
The coefficients presented in Table 2 are determined according to the data in published literatures combined with the methods described in Section 2.2 and Section 2.3. These coefficients reflect the average levels of energy conversion of ABs, life cycle environmental emissions and profit for each mode. There would be improvements in terms of less ABs consumption, more mitigations of environmental emissions and higher net profit for unit bioenergy production along with technological innovations in the future. Thus, an increase in the coefficients may contribute to better energy, economic and environmental benefits.

4.5. Summative Discussion

Considering the deficiency in existing studies regarding the holistic revelation of the 3E benefits of the energy-oriented ABs utilization on a region by region case in China, this work is motivated to plot detailed accounting methods of the 3E benefits. The establishment of life cycle system for ABs procurement and four energy conversion modes of ABs allows for more accurate and complete assessments of the 3E benefits.
A precise accounting of the three-level quantities of ABs (theoretical reserve, collectible quantity and utilizable quantity) is the premise for assessing the 3E benefits. By incorporating ABs from nine kinds of crops, the abundance of ABs in each region is completely revealed. Most of the straw-grain ratio of crops is around 1, with that of cotton as an extreme exception, which is as large as 9.2, contributing to large quantity of ABs in Xinjiang. Beyond diverse levels of total collectible quantity and spatial distribution of ABs, the structural features of regional ABs could help decision makers with regard to the development of which kind of ABs with priority.
Overall, the regions with more prosperous agricultural development have a larger quantity of grain yield of crops and thus a larger quantity of ABs. A region with higher suitability for industrial development of energy-oriented ABs utilization is set with higher energy utilization proportion. First, the energy utilization proportion of ABs determines how much ABs can be utilized for bioenergy production; then, the allocation proportion of ABs determines how much ABs can be utilized through each type of energy conversion mode. These two kinds of coefficients collectively determine the energy benefits of ABs in a region when the collectible quantity of ABs is given.
From the perspective of energy conversion mode, in a certain region with a given amount of ABs available for bioenergy production, the allocation proportion and energy conversion coefficient of ABs collaboratively determine the amount of bioenergy that can be converted through a mode. Though, with a low allocation proportion (30%), M3 contributes to more energy benefits among four modes (67.2%), owing to larger energy conversion coefficient that is nearly 7–8 times that of M1 and M2.
For a region, more energy benefits imply more economic and environmental benefits. For an energy conversion mode, the energy conversion and economic and environmental coefficients collaboratively determine the economic and environmental benefits. Under the dual effects of energy conversion and economic and environmental coefficients, M4 contributes to more economic benefits (48.1%); M3 are more advantageous with regard to CO2 and SO2 mitigation (69.1% and 68.8%); more NOx mitigation can be achieved through M1 (45.5%).
There is a consistency within the 3E benefits contributed by ABs utilization for regions. A region with larger ABs potentials is inclined to have better energy, economic and environmental benefits, like Henan, Shandong, Heilongjiang, Xinjiang, Jilin, etc., whereas the benefits for Tibet, Beijing, Shanghai, Qinghai, Hainan, etc. are very tiny. Development of ABs utilization in the undeveloped western regions like Sichuan, Yunnan Guangxi, etc. may help to create more local fiscal revenue and farmer income. Also, ABs utilization is a potential way for ameliorating air pollution in the regions in north China like Hebei, Shanxi, Inner Mongolia, etc., where the haze phenomenon is serious.

5. Conclusions

This study makes an integrated assessment of the energy, economic and environmental benefits contributed by energy-oriented ABs utilization through four typical energy conversion modes. The assessment is conducted from the life cycle perspective by considering the whole process of ABs utilization including collection, transport, energy conversion and final use. The 3E benefits are reflected by bioenergy production, net profit and mitigations of environmental emissions (CO2, SO2 and NOx emissions), respectively. 31 provincial regions in China are the study areas for revealing regional disparities of the 3E benefits. Some of the discovered findings are described as follows:
(1)
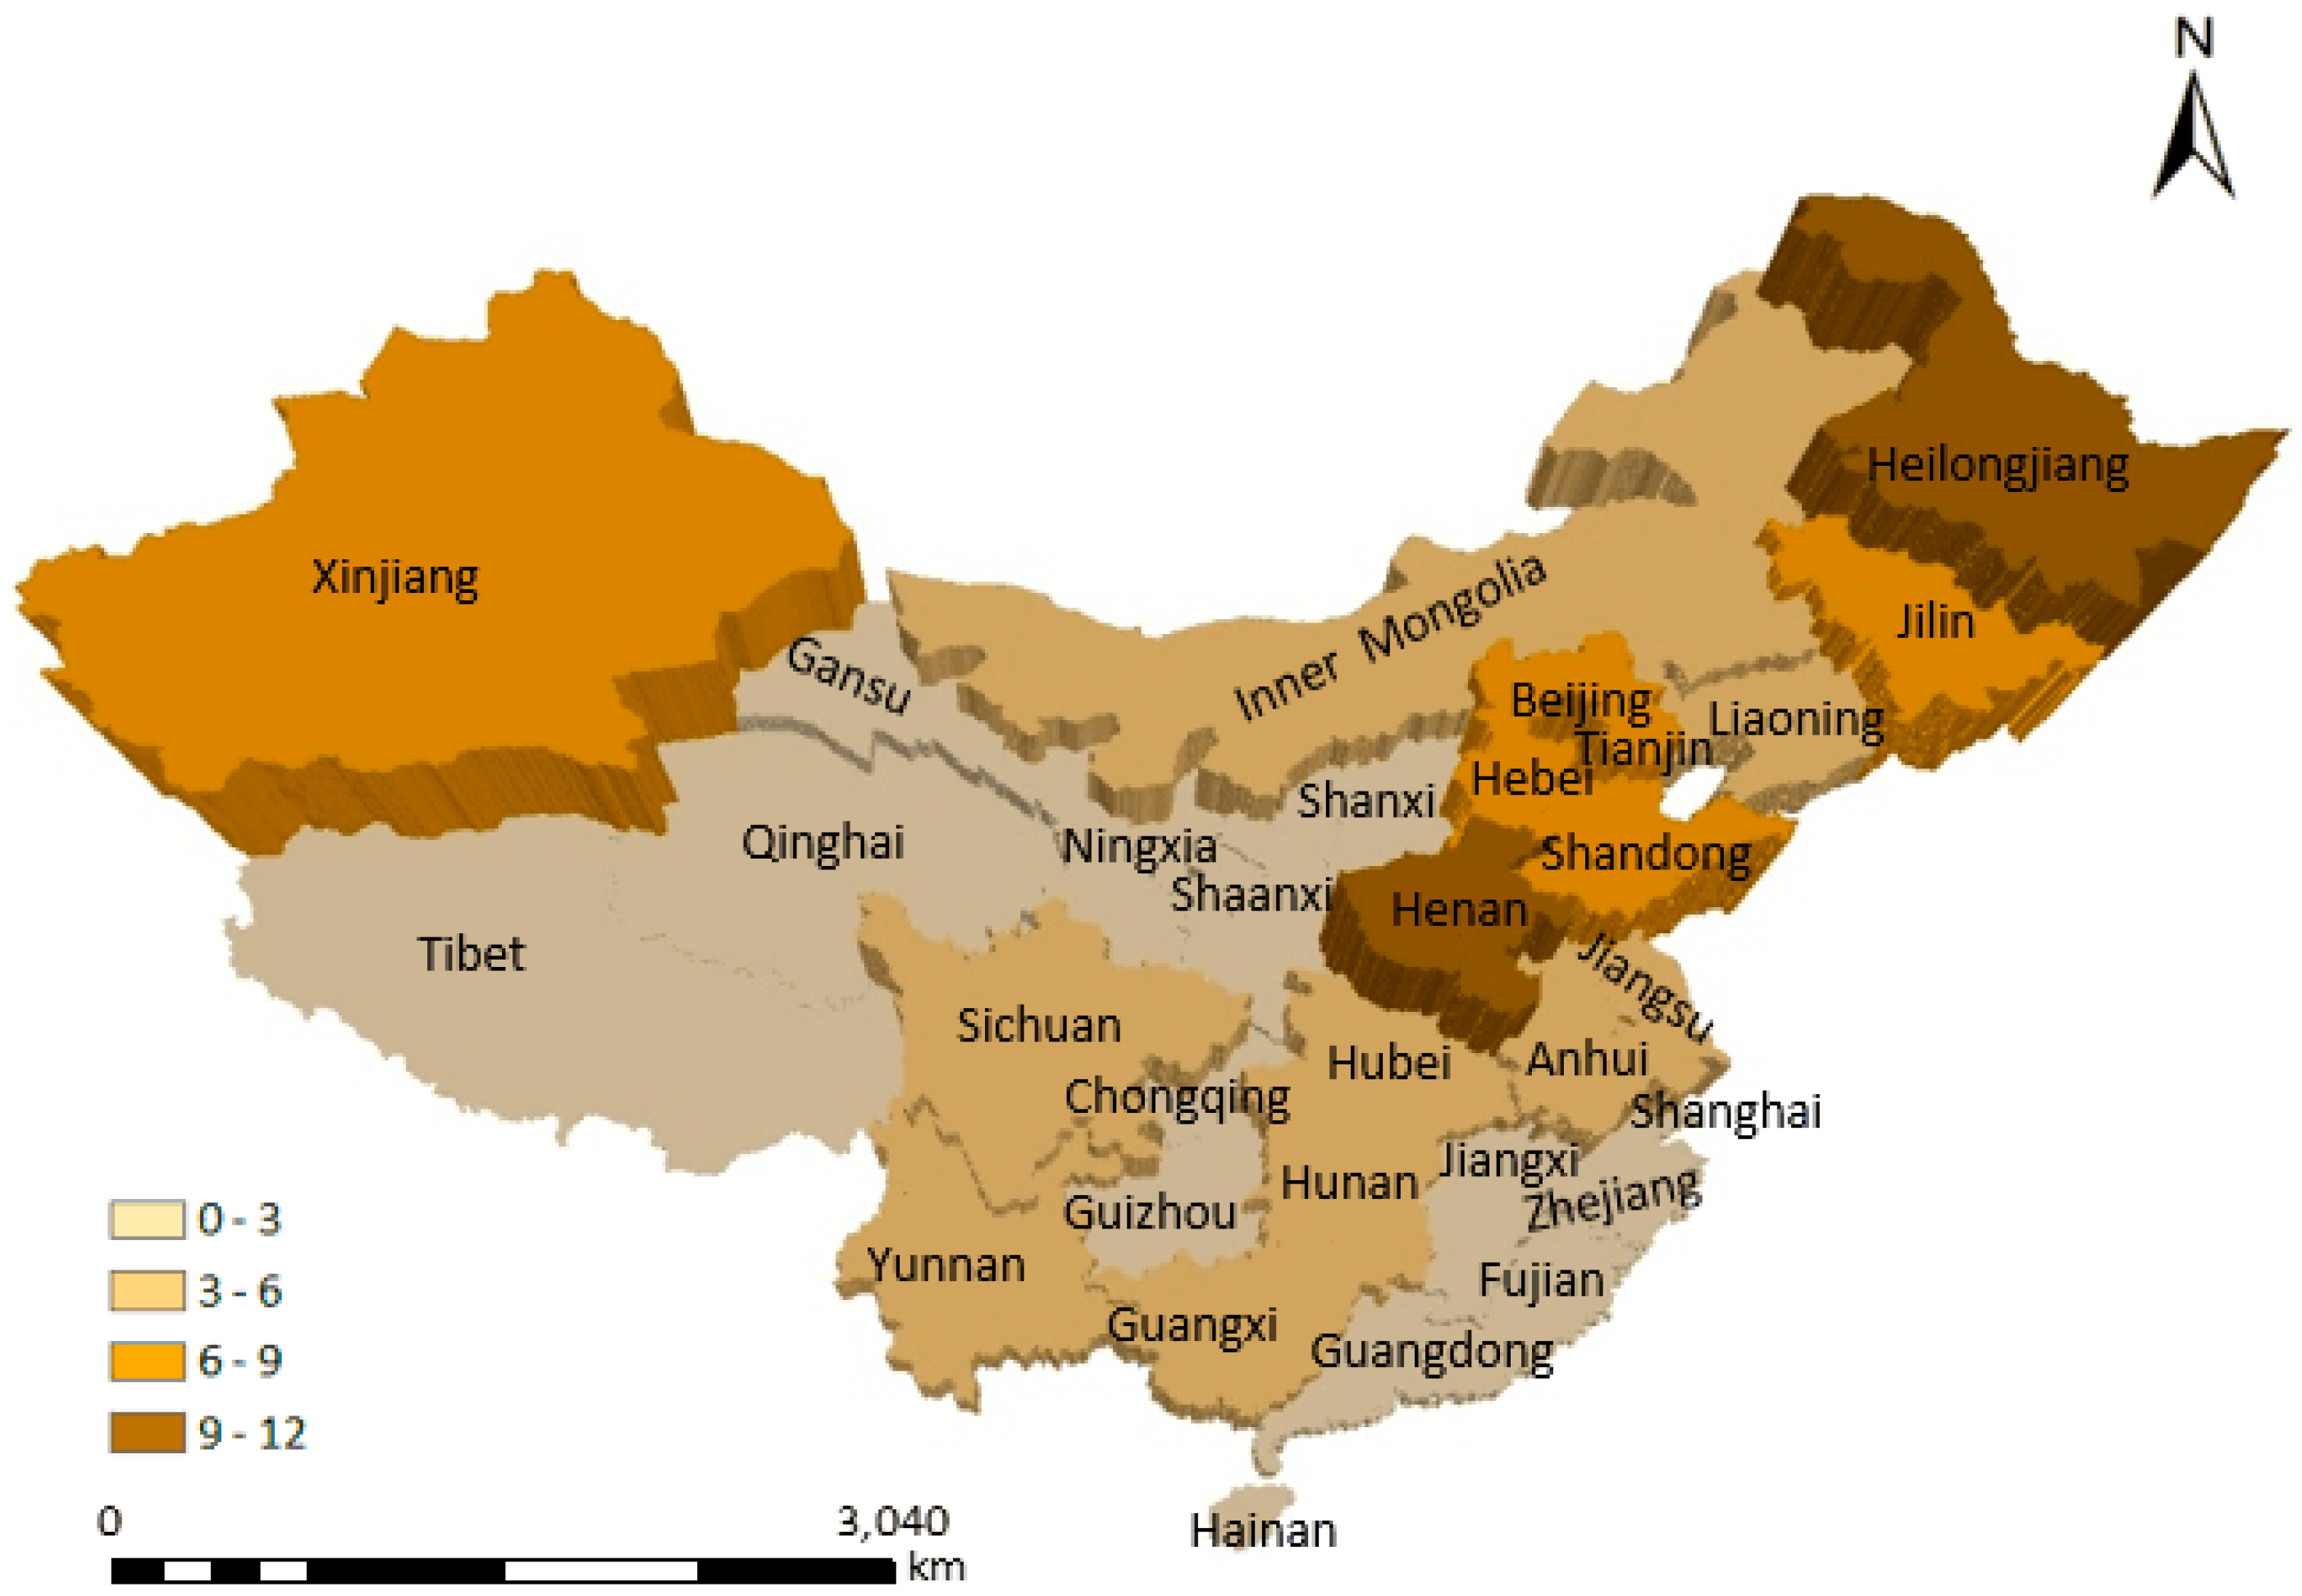
Henan, Heilongjiang, Shandong, Xinjiang and Jilin are the top-five regions with larger ABs potentials, with that in Henan amounting to larger than 60 Mt.
(2)
Larger collectible quantity of ABs and larger energy utilization proportion jointly contribute to larger energy benefits in the five regions above. M3 contributes to 67.2% of total energy benefits among four modes.
(3)
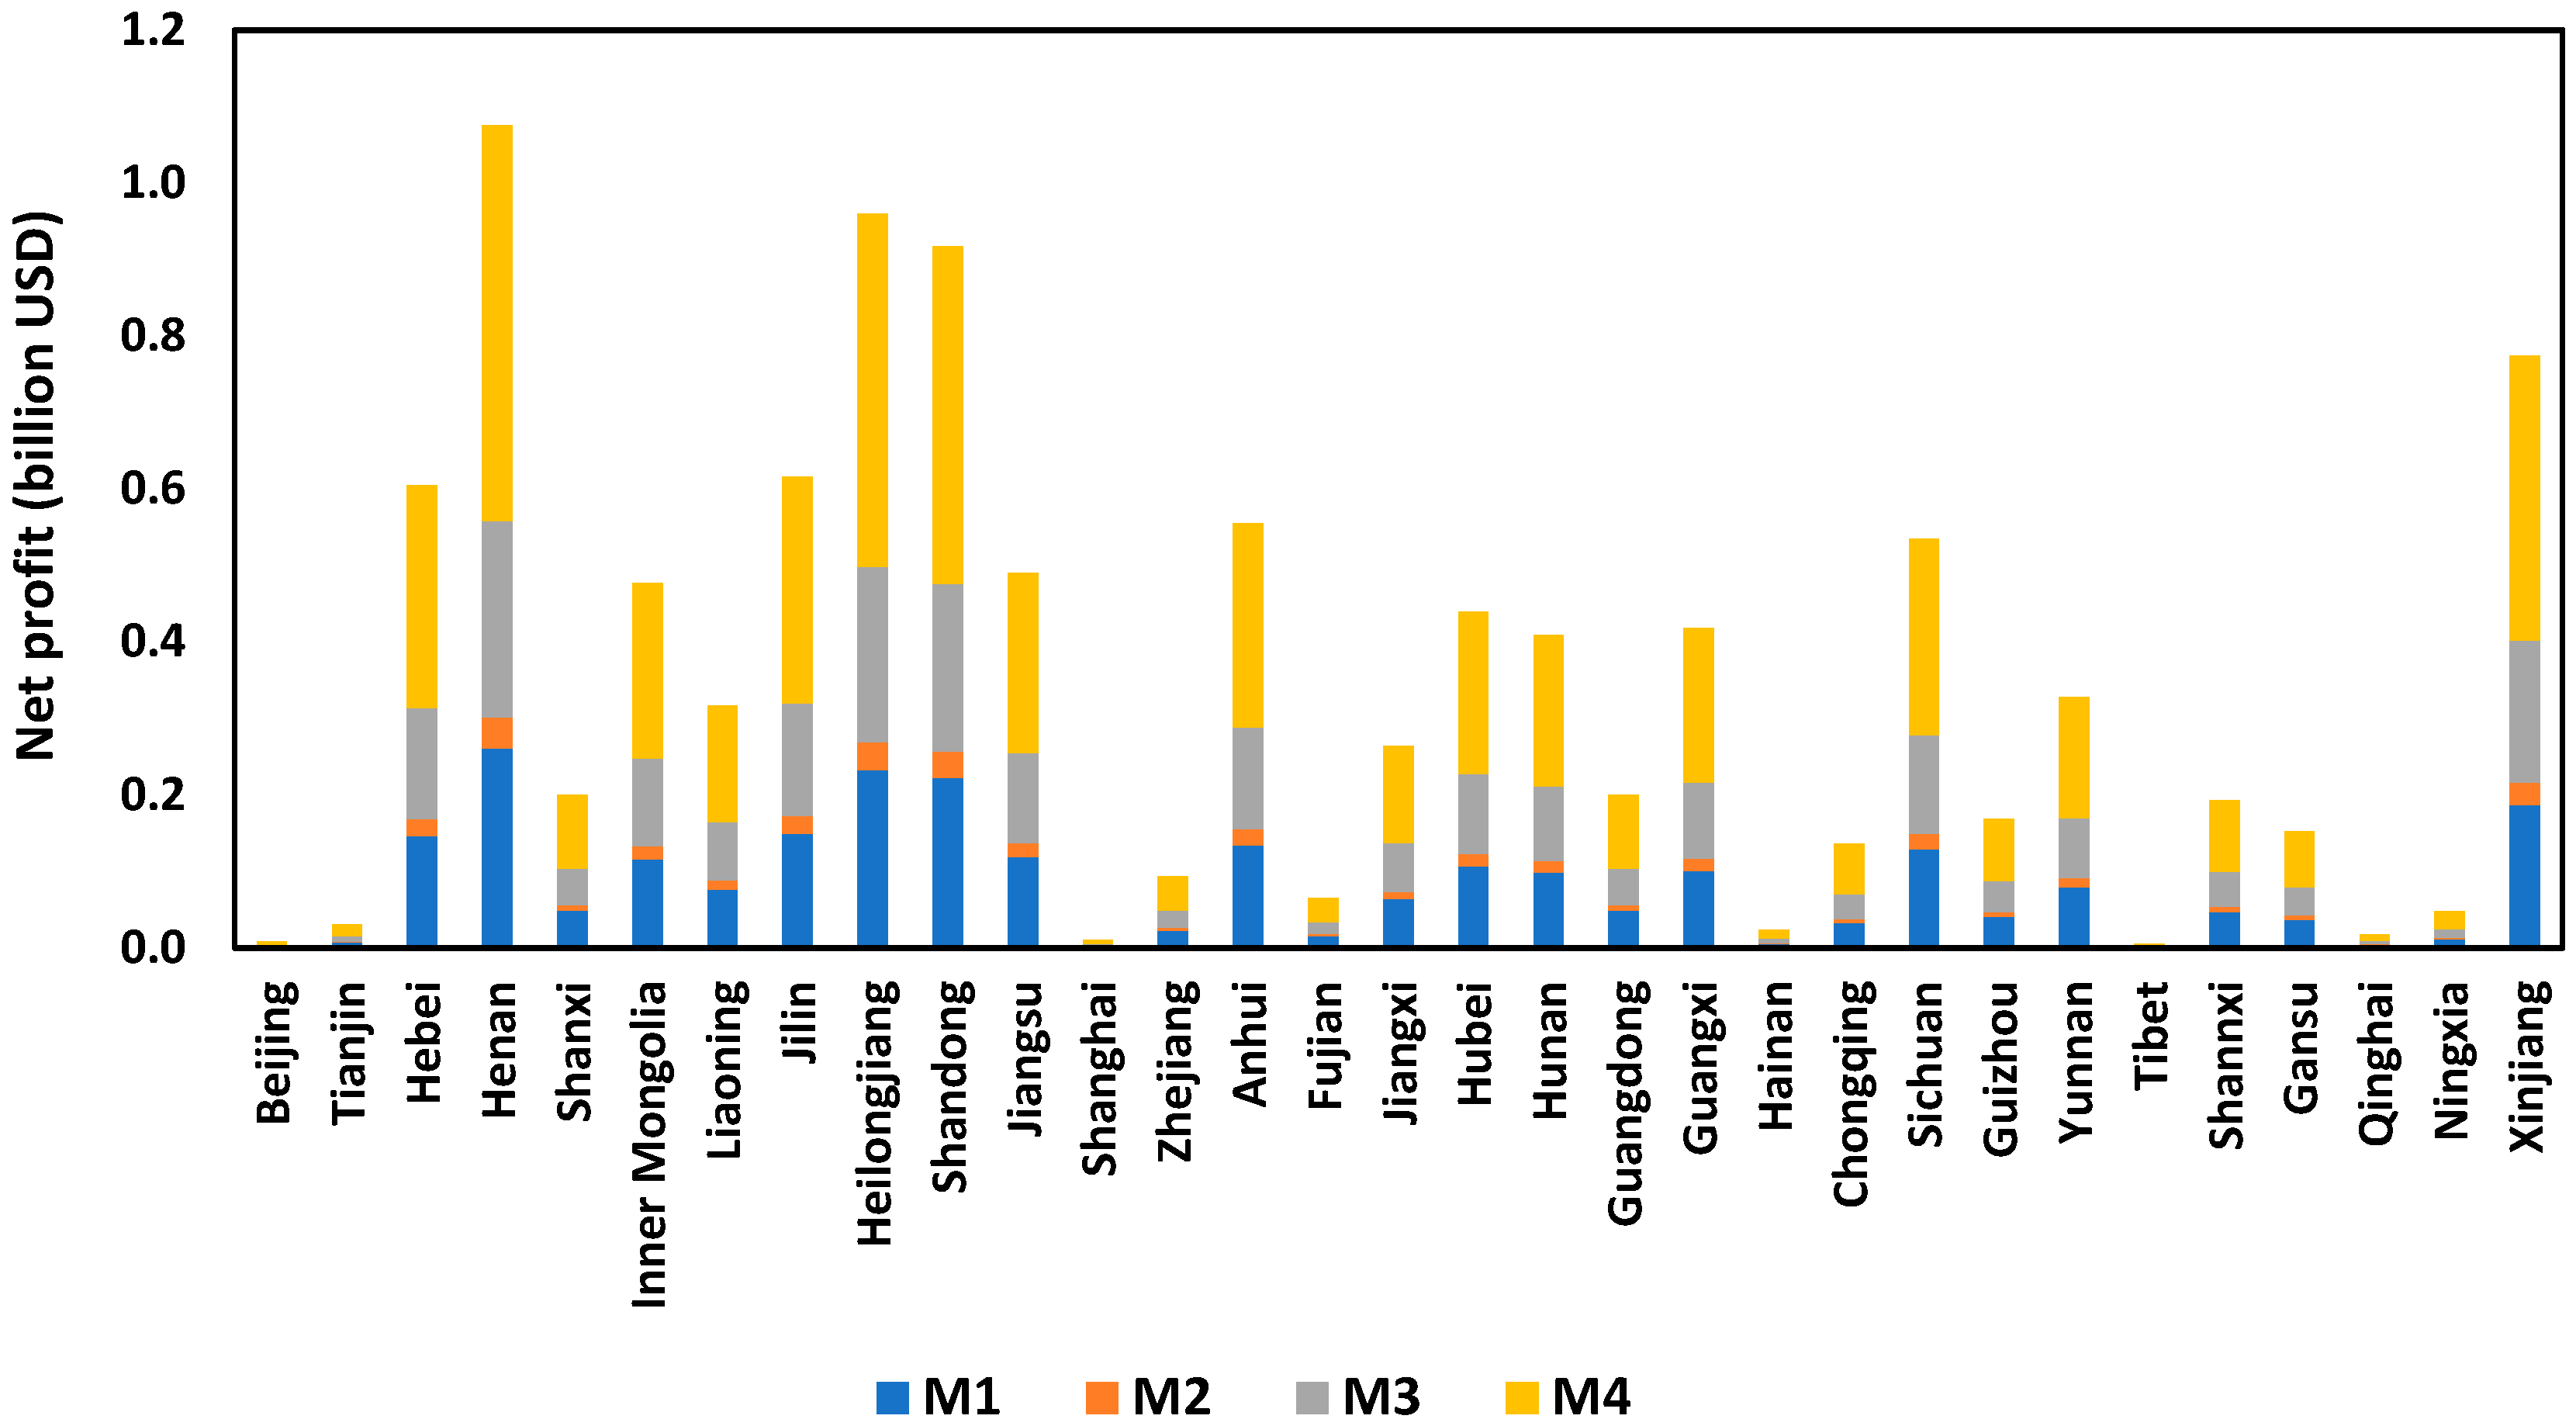
The regions with larger energy benefits also have more economic benefits. Total net profits created in Henan by four modes could reach 1.08 billion USD, followed by that in Heilongjiang, Shandong and Xinjiang. M4 contributes to the highest proportion of economic benefits among four modes (48.1%).
(4)
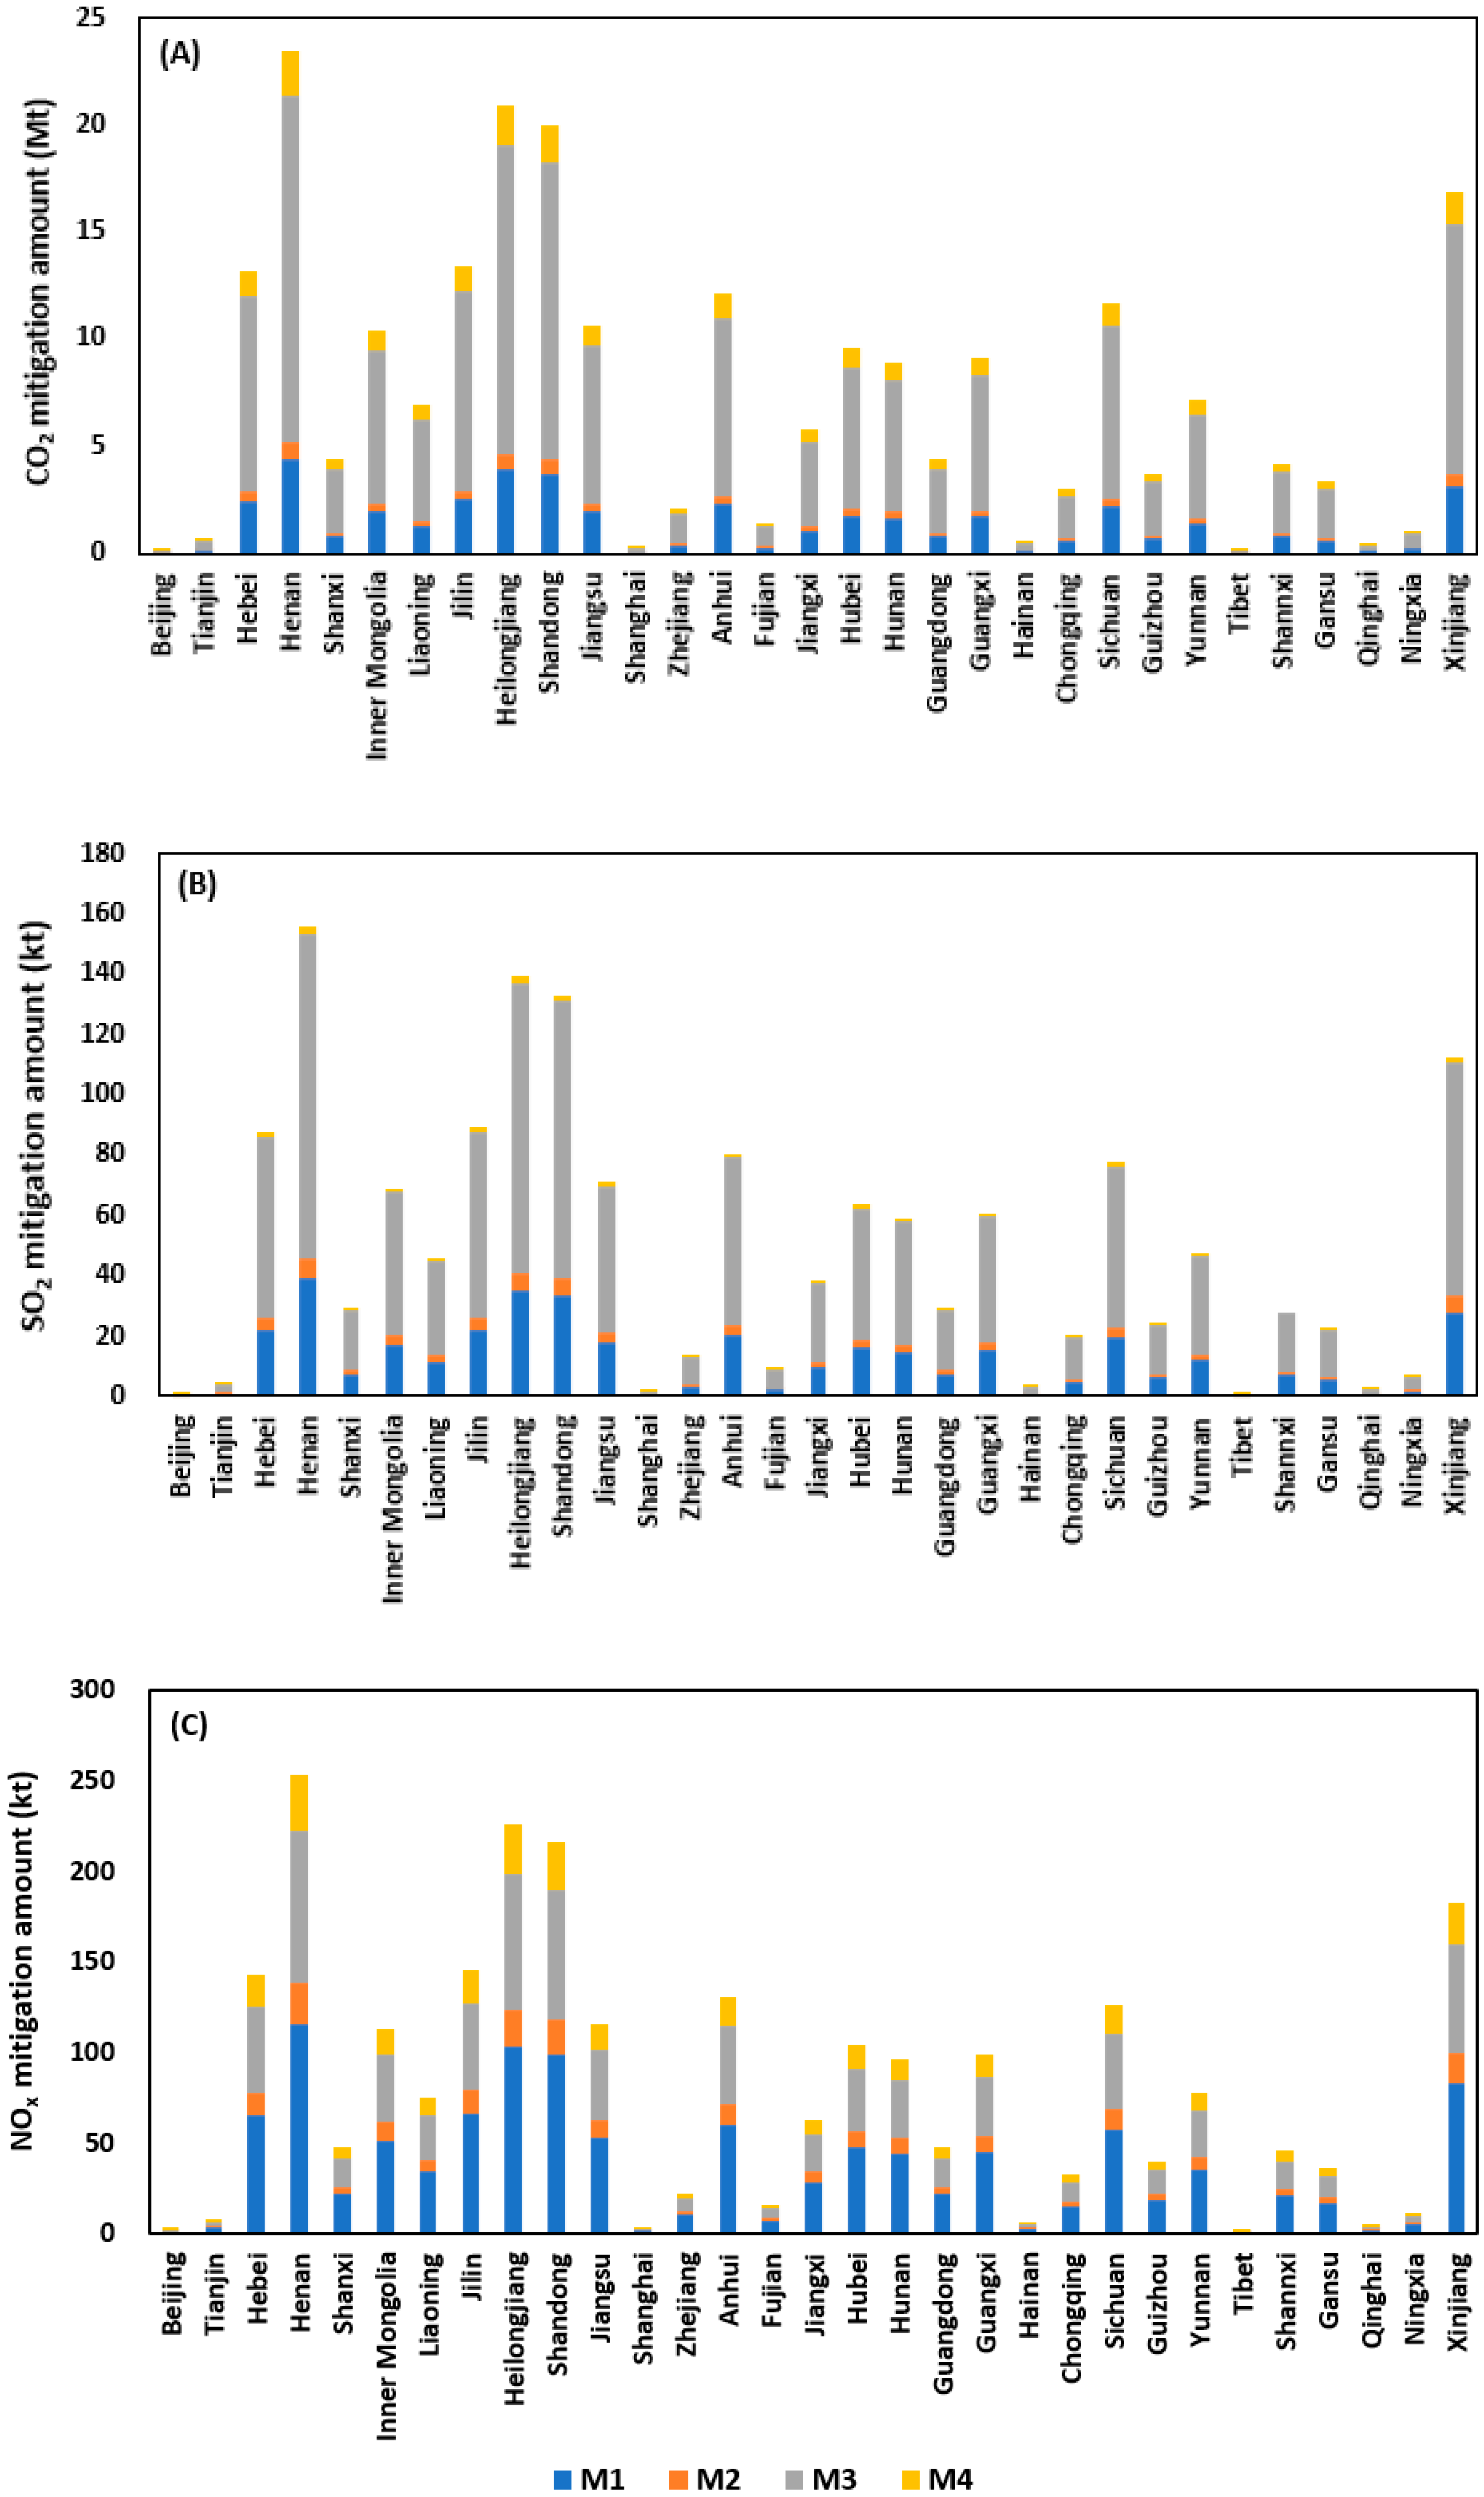
The regions with larger energy benefits are also more environmentally advantageous. Total mitigations of CO2, SO2 and NOx emissions in China amount to 229.23 Mt, 1.53 Mt and 2.48 Mt, respectively.
Besides, some parameters that may induce the uncertainties of results are elaborately analyzed. Seen overall, a consistency lies within the 3E benefits contributed by regional ABs utilization. Development of ABs utilization in the regions with larger energy benefits could facilitate to remarkable economic and environmental benefits and meanwhile promote local economic development and environmental quality. The methods and results presented by this study may provide decision makers with support on reasonable deployment on ABs utilization from the perspectives of both region and energy conversion mode. Future study can be extended to predict the future quantity of ABs according to the affecting factors of crops’ grain yield and assess the 3E benefits dynamically.

Author Contributions

Conceptualization, W.Y. and J.S.; methodology, W.Y.; data curation, Y.P.; writing—original draft preparation, J.S. and Y.P.; writing—review and editing, J.R.

Funding

This study was funded by National Natural Science Foundation of China, grant number 41701628, 41801199; the Fundamental Research Funds for the Central Universities.

Acknowledgments

We gratefully thank the two anonymous reviewers for their comments and suggestions, which have substantially improved the quality of the paper.

Conflicts of Interest

The authors declare no conflict of interests.

Nomenclature

Abbreviation
ABsagricultural bioresources;
3Eenergy-economic-environmental;
Mtcemillion tons of coal equivalent;
Mtmillion ton;
ktthousand ton;
USDUnited States dollar;
M1direct combustion power generation;
M2gasification power generation;
M3briquette fuel;
M4bioethanol.
Subscript
itype of crop;
jtype of energy conversion mode;
mbioenergy project under mode j.
Variables:
Q i t theoretical reserve of ABs (t);
Q i c collectible quantity of ABs (t);
Qautilizable quantity of ABs for bioenergy production (t);
Yigrain yield (t);
ηistraw-grain ratio;
λicollection coefficient of ABs (%);
ξenergy utilization proportion (%);
μjallocation proportion of ABs for mode j (%);
ςjenergy conversion coefficient of ABs for mode j (tce/t-ABs);
ENjtotal energy benefits of ABs utilization through mode j (tce);
Cmlife cycle cost of project m (USD);
C m p procurement cost of ABs (USD);
C m o operation cost of energy conversion (USD);
C m p - a acquisition cost (buying ABs from farmers) (USD);
C m p - p process cost (binding and compression of ABs) (USD);
C m p - t transport cost (transport of ABs to the bioenergy projects) (USD);
C m p - o other cost (loading, storage, etc.) (USD);
R m k radius of island k (km);
D m k ABs density of island k (t/km2);
L m k distance between island k and project m (km);
C m p - t - k , in transport cost within island k (USD);
C m p - t - k , out transport cost outside island k (USD);
Q m k quantity of ABs collected within island k (t);
ρp-tprice rate of ABs transport (USD/t*km);
ftortuosity factor of road;
QmABs demanded by project m (t);
C m p - t total transport cost (USD);
ρp-a, ρp-p, ρp-oprice rate of acquisition cost, process cost and other cost of ABs (USD/t);
ρ m o unit operation cost of energy conversion (USD/tce);
Smtotal bioenergy production of project m (tce);
ECmnet profit of project m (USD);
ρjprice of unit bioenergy product produced by mode j (USD/tce);
ECjtotal economic benefits of ABs utilization through mode j (USD);
E m b emissions of project m in the benchmark scenario (t);
eABemission factor of open burning of ABs (t/t-ABs);
E m p - p emissions of project m generated during ABs process (t);
φp-pdiesel consumption factor of ABs process (L/t-ABs);
eDemission factor of diesel burning (t/L);
E m p - p emissions of project m generated during ABs transport (t);
φp-tdiesel consumption factor of ABs transport (L/t-ABs);
E m o emissions of project m during project operation process (t);
F m o consumption amount of fossil fuels or thermal power of project m during project operation process (tce);
eFemission factor corresponding to fossil fuels or thermal power (t/tce);
E m s emission reduction of project m due to substitution of fossil fuels (t);
E m u emissions of project m from consumption of the bioenergy products (t);
δjemission factor of the bioenergy product corresponding to mode j (t/tce);
EVmtotal mitigated emissions contributed by project m (t);
EVjtotal environmental benefits of ABs utilization through mode j (t).

References

  1. Angelis-Dimakis, A.; Biberacher, M.; Dominguez, J.; Fiorese, G.; Gadocha, S.; Gnansounou, E.; Guariso, G.; Kartalidis, A.; Panichelli, L.; Pinedo, I.; et al. Methods and tools to evaluate the availability of renewable energy sources. Renew. Sustain. Energy Rev. 2011, 15, 1182–1200. [Google Scholar] [CrossRef]
  2. Cutz, L.; Haro, P.; Santana, D.; Johnsson, F. Assessment of biomass energy sources and technologies: The case of Central America. Renew. Sustain. Energy Rev. 2016, 58, 1411–1431. [Google Scholar] [CrossRef]
  3. Nanda, S.; Azargohar, R.; Dalai, A.K.; Kozinski, J.A. An assessment on the sustainability of lignocellulosic biomass for biorefining. Renew. Sustain. Energy Rev. 2015, 50, 925–941. [Google Scholar] [CrossRef]
  4. Kambo, H.S.; Dutta, A. Strength, storage, and combustion characteristics of densified lignocellulosic biomass produced via torrefaction and hydrothermal carbonization. Appl. Energy 2014, 135, 182–191. [Google Scholar] [CrossRef]
  5. Weldemichael, Y.; Assefa, G. Assessing the energy production and GHG (greenhouse gas) emissions mitigation potential of biomass resources for Alberta. J. Clean. Prod. 2016, 112, 4257–4264. [Google Scholar] [CrossRef]
  6. Hong, J.; Ren, L.; Hong, J.; Xu, C. Environmental impact assessment of corn straw utilization in China. J. Clean. Prod. 2016, 112, 1700–1708. [Google Scholar] [CrossRef]
  7. Song, J.; Yang, W.; Higano, Y.; Wang, X. Dynamic integrated assessment of bioenergy technologies for energy production utilizing agricultural residues: An input-output approach. Appl. Energy 2015, 158, 178–189. [Google Scholar] [CrossRef]
  8. Wang, J.; Xi, F.; Liu, Z.; Bing, L.; Alsaedi, A.; Hayat, T.; Ahmad, B.; Guan, D. The spatiotemporal features of greenhouse gases emissions from biomass burning in China from 2000 to 2012. J. Clean. Prod. 2018, 181, 801–808. [Google Scholar] [CrossRef] [Green Version]
  9. National Development and Reform Commission. The 13th Five-Year Plan for Bioenergy Development; National Development and Reform Commission: Beijing, China, 2016. [Google Scholar]
  10. Said, N.; EI-Shatoury, S.A.; Diaz, L.F.; Zamorano, M. Quantitative appraisal of biomass resources and their energy potential in Egypt. Renew. Sustain. Energy Rev. 2013, 24, 84–91. [Google Scholar] [CrossRef]
  11. Zhong, S.; Niu, S.; Wang, Y. Research on potential evaluation and sustainable development of rural biomass energy in Gansu Province of China. Sustainability 2018, 10, 3800. [Google Scholar] [CrossRef]
  12. Weiser, C.; Zeller, V.; Reinicke, F.; Wagner, B.; Majer, S.; Vetter, A.; Thraen, D. Integrated assessment of sustainable cereal straw potential and different straw-based energy applications in Germany. Appl. Energy 2014, 114, 749–762. [Google Scholar] [CrossRef]
  13. Portugal-Pereira, J.; Soria, R.; Rathmann, R.; Schaeffer, R.; Szklo, A. Agricultural and agro-industrial residues-to-energy: Techno-economic and environmental assessment in Brazil. Biomass Bioenergy 2015, 81, 521–533. [Google Scholar] [CrossRef]
  14. Avcıoglu, A.O.; Dayıoğlu, M.A.; Türker, U. Assessment of the energy potential of agricultural biomass residues in Turkey. Renew. Energy 2019, 138, 610–619. [Google Scholar] [CrossRef]
  15. Haase, M.; Rosch, C.; Ketzer, D. GIS-based assessment of sustainable crop residue potentials in European regions. Biomass Bioenergy 2016, 86, 156–171. [Google Scholar] [CrossRef]
  16. Ji, L. An assessment of agricultural residue resources for liquid biofuel production in China. Renew. Sustain. Energy Rev. 2015, 44, 561–575. [Google Scholar] [CrossRef]
  17. Wang, W.; Ouyang, W.; Hao, F.; Liu, G. Temporal-spatial variation analysis of agricultural biomass and its policy implication as an alternative energy in northeastern China. Energy Policy 2017, 109, 337–349. [Google Scholar] [CrossRef]
  18. Kristianto, Y.; Zhu, L.D. Techno-economic optimization of ethanol synthesis from rice-straw supply chains. Energy 2017, 141, 2164–2176. [Google Scholar] [CrossRef]
  19. Hohn, J.; Lehtonen, E.; Rasi, S.; Rintala, J. A geographical information system (GIS) based methodology for determination of potential biomasses and sites for biogas plants in southern Finland. Appl. Energy 2013, 113, 1–10. [Google Scholar] [CrossRef]
  20. Shafie, S.M.; Masjuki, H.H.; Mahlia, T.M.I. Rice straw supply chain for electricity generation in Malaysia: Economical and environmental assessment. Appl. Energy 2014, 135, 299–308. [Google Scholar] [CrossRef]
  21. Zhao, X.G.; Li, A. A multi-objective sustainable location model for biomass power plants: Case of China. Energy 2016, 112, 1184–1193. [Google Scholar] [CrossRef]
  22. Aldana, H.; Lozano, F.J.; Acevedo, J. Evaluating the potential for producing energy from agricultural residues in Mexico using MILP optimization. Biomass Bioenergy 2014, 67, 372–389. [Google Scholar] [CrossRef]
  23. Ebadian, M.; Sowlati, T.; Sokhansanj, S.; Stumborg, M.; Townley-Smith, L. A new simulation model for multi-agricultural biomass logistics system in bioenergy production. Biosyst. Eng. 2011, 10, 208–290. [Google Scholar] [CrossRef]
  24. Khishtandar, S.; Zandieh, M.; Dorri, B. A multi criteria decision making framework for sustainability assessment of bioenergy production technologies with hesitant fuzzy linguistic term sets: The case of Iran. Renew. Sustain. Energy Rev. 2017, 77, 1130–1145. [Google Scholar] [CrossRef]
  25. Thakur, A.; Canter, C.E.; Kumar, A. Life-cycle energy and emission analysis of power generation from forest biomass. Appl. Energy 2014, 128, 246–253. [Google Scholar] [CrossRef]
  26. Liu, Z.; Wang, D.; Ning, T.; Zhang, S.; Yang, Y.; He, Z.; Li, Z. Sustainability assessment of straw utilization circulation modes based on the emergetic ecological footprint. Ecol. Indic. 2017, 75, 1–7. [Google Scholar] [CrossRef]
  27. Mani, S.; Sokhansanj, S.; Tagore, S.; Turhollow, A.F. Techno-economic analysis of using corn stover to supply heat and power to a corn ethanol plant—Part 2: Cost of heat and power generation systems. Biomass Bioenergy 2010, 34, 356–364. [Google Scholar] [CrossRef]
  28. Ren, J.; Tan, S.; Dong, L.; Mazzi, A.; Scipioni, A. Determining the life cycle energy efficiency of six biofuel systems in China: A Data Envelopment Analysis. Bioresour. Technol. 2014, 162, 1–7. [Google Scholar] [CrossRef]
  29. Delivand, M.K.; Barz, M.; Gheewala, S.H.; Sajjakulnukit, B. Economic feasibility assessment of rice straw utilization for electricity generating through combustion in Thailand. Appl. Energy 2011, 88, 3651–3658. [Google Scholar] [CrossRef]
  30. Nguyen, T.L.T.; Hermansen, J.E.; Nielsen, R.G. Environmental assessment of gasification technology for biomass conversion to energy in comparison with other alternatives: The case of wheat straw. J. Clean. Prod. 2013, 53, 138–148. [Google Scholar] [CrossRef]
  31. Hu, J.; Lei, T.; Wang, Z.; Yan, X.; Shi, X.; Li, Z. Economic, environmental and social assessment of briquette fuel from agricultural residues in China—A study on flat die briquetting using corn stalk. Energy 2014, 64, 557–566. [Google Scholar] [CrossRef]
  32. Shie, J.; Lee, C.; Chen, C.; Lin, K.; Chang, C. Scenario comparisons of gasification technology using energy life cycle assessment for bioenergy recovery from rice straw in Taiwan. Energy Convers. Manag. 2014, 87, 156–163. [Google Scholar] [CrossRef]
  33. Wang, L.; Littlewood, J.; Murphy, R.J. Environmental sustainability of bioethanol production from wheat straw in the UK. Renew. Sustain. Energy Rev. 2013, 28, 715–725. [Google Scholar] [CrossRef] [Green Version]
  34. Song, S.; Liu, P.; Xu, J.; Chong, C.; Huang, X.; Ma, L.; Li, Z.; Ni, W. Life cycle assessment and economic evaluation of pellet fuel from corn straw in China: A case study in Jilin Province. Energy 2017, 130, 373–381. [Google Scholar] [CrossRef]
  35. Cambero, C.; Alexandre, M.H.; Sowlati, T. Life cycle greenhouse gas analysis of bioenergy generation alternatives using forest and wood residues in remote locations: A case study in British Columbia, Canada. Resour. Conserv. Recycl. 2015, 105, 59–72. [Google Scholar] [CrossRef] [Green Version]
  36. Wong, A.; Zhang, H.; Kumar, A. Life cycle assessment of renewable diesel production from lignocellulosic biomass. Int. J. Life Cycle Assess. 2016, 21, 1404–1424. [Google Scholar] [CrossRef]
  37. Martire, S.; Tuomasjukka, D.; Lindner, M.; Fitzgerald, J.; Castellani, V. Sustainability impact assessment for local energy supplies’ development-The case of the alpine area of Lake Como, Italy. Biomass Bioenergy 2015, 83, 60–76. [Google Scholar] [CrossRef]
  38. Kudoh, Y.; Sagisaka, M.; Chen, S.S.; Elauria, J.C.; Gheewala, S.H.; Hasanudin, U.; Romero, J.; Sharma, V.K.; Shi, X. Region-Specific Indicators for Assessing the Sustainability of Biomass Utilisation in East Asia. Sustainability 2015, 7, 16237–16259. [Google Scholar] [CrossRef] [Green Version]
  39. Hayashi, T.; Van Ierland, E.C.; Zhu, X. A holistic sustainability assessment tool for bioenergy using the Global Bioenergy Partnership (GBEP) sustainability indicators. Biomass Bioenergy 2014, 66, 70–80. [Google Scholar] [CrossRef]
  40. Wang, X.; Li, K.; Song, J.; Duan, H.; Wang, S. Integrated assessment of straw utilization for energy production from views of regional energy, environmental and socioeconomic benefits. J. Clean. Prod. 2018, 190, 787–798. [Google Scholar] [CrossRef]
  41. Xu, C.; Hong, J.; Chen, J.; Han, X.; Lin, C.; Li, X. Is biomass energy really clean? An environmental life-cycle perspective on biomass-based electricity generation in China. J. Clean. Prod. 2016, 133, 767–776. [Google Scholar] [CrossRef]
  42. Liu, Z.; Ren, A.; Gao, C.; Fu, W.; Chen, C. Power generation potential assessment of agricultural biomass resources in China. Chin. J. Agric. Resour. Reg. Plan. 2014, 35, 133–140. (In Chinese) [Google Scholar]
  43. Chinese Bureau of Statistics. China Statistical Yearbook; China Statistics Press: Beijing, China, 2017. (In Chinese)
  44. Chinese Bureau of Statistics. China Rural Statistical Yearbook; China Statistics Press: Beijing, China, 2017. (In Chinese)
  45. Wang, B.; Song, J.; Ren, J.; Li, K.; Duan, H.; Wang, X. Selecting sustainable energy conversion technologies for agricultural residues: A fuzzy AHP-VIKOR based prioritization from life cycle perspective. Resour. Conserv. Recycl. 2019, 142, 78–87. [Google Scholar] [CrossRef]
  46. Wang, Z.; Lei, T.; Yang, M.; Li, Z.; Qi, T.; Xin, X.; He, X.; Ajayebi, A.; Yan, X. Life cycle environmental impacts of cornstalk briquette fuel in China. Appl. Energy 2017, 192, 83–94. [Google Scholar] [CrossRef]
  47. Jiang, Q.; Sun, Y.; Teng, H.; Xiu, Z.; Liu, C. Economic analysis of cellulose fuel ethanol technology. J. Process Eng. 2012, 12, 97–104. (In Chinese) [Google Scholar]
Figure 1. System boundary of the energy-oriented utilization modes of ABs.
Sustainability 11 03743 g001
Figure 2. Collectible quantity and structure of ABs in 31 regions.
Sustainability 11 03743 g002
Figure 3. Distribution of energy benefits in 31 regions (unit: Mtce).
Sustainability 11 03743 g003
Figure 4. Contribution proportion of bioenergy production of four modes in China (unit: Mtce).
Sustainability 11 03743 g004
Figure 5. Economic benefits of ABs utilization in 31 regions.
Sustainability 11 03743 g005
Figure 6. Environmental benefits of ABs utilization in 31 regions ((A) CO2 mitigation; (B) SO2 mitigation; (C) NOx mitigation).
Sustainability 11 03743 g006
Table 1. Provincial regions in China and energy utilization proportions.
RegionSuitability RankEnergy Utilization Proportion (ξ)RegionSuitability RankEnergy Utilization Proportion (ξ)
HenanI0.75GuangdongIII0.65
ShandongI0.75GuangxiIII0.65
XinjiangI0.75GuizhouIII0.65
HeilongjiangII0.70YunnanIII0.65
JilinII0.70ShaanxiIII0.65
Inner MongoliaII0.70BeijingIV0.60
HebeiII0.70ShanghaiIV0.60
JiangsuII0.70TianjinIV0.60
AnhuiII0.70FujianIV0.60
HubeiII0.70HainanIV0.60
SichuanII0.70ChongqingIV0.60
LiaoningIII0.65NingxiaIV0.60
ShanxiIII0.65GansuIV0.60
ZhejiangIII0.65QinghaiV0.55
JiangxiIII0.65TibetV0.55
HunanIII0.65
Table 2. Coefficients of energy conversion and economic and environmental benefits for M1–M4.
M1M2M3M4
Energy conversion coefficient (tce/t-ABs)0.0886 0.0774 0.5430 0.1548
Net profit coefficient (USD/tce)138.78123.4837.26442.21
CO2 mitigation coefficient (t/tce)2.3344 2.3196 2.3465 1.7847
SO2 mitigation coefficient (t/tce)0.0209 0.0216 0.0155 0.0020
NOx mitigation coefficient (t/tce)0.0614 0.0687 0.0122 0.0269
Table 3. Setting of changes in the allocation proportion of ABs for four modes.
M1M2M3M4Energy Benefits Compared with the Original Value
Allocation proportion of ABs100%00036.5%
0100%0031.9%
00100%0223.9%
000100%113.9%

