The Role of Hazard and Vulnerability in Modulating Economic Damages of Inland Floods in the United States Using a Survey-Based Dataset


Abstract
:1. Introduction
2. Data and Methodology
2.1. Survey-Based Records of Flooding
2.2. Impact Metrics and Data Analysis
3. Results and Discussion
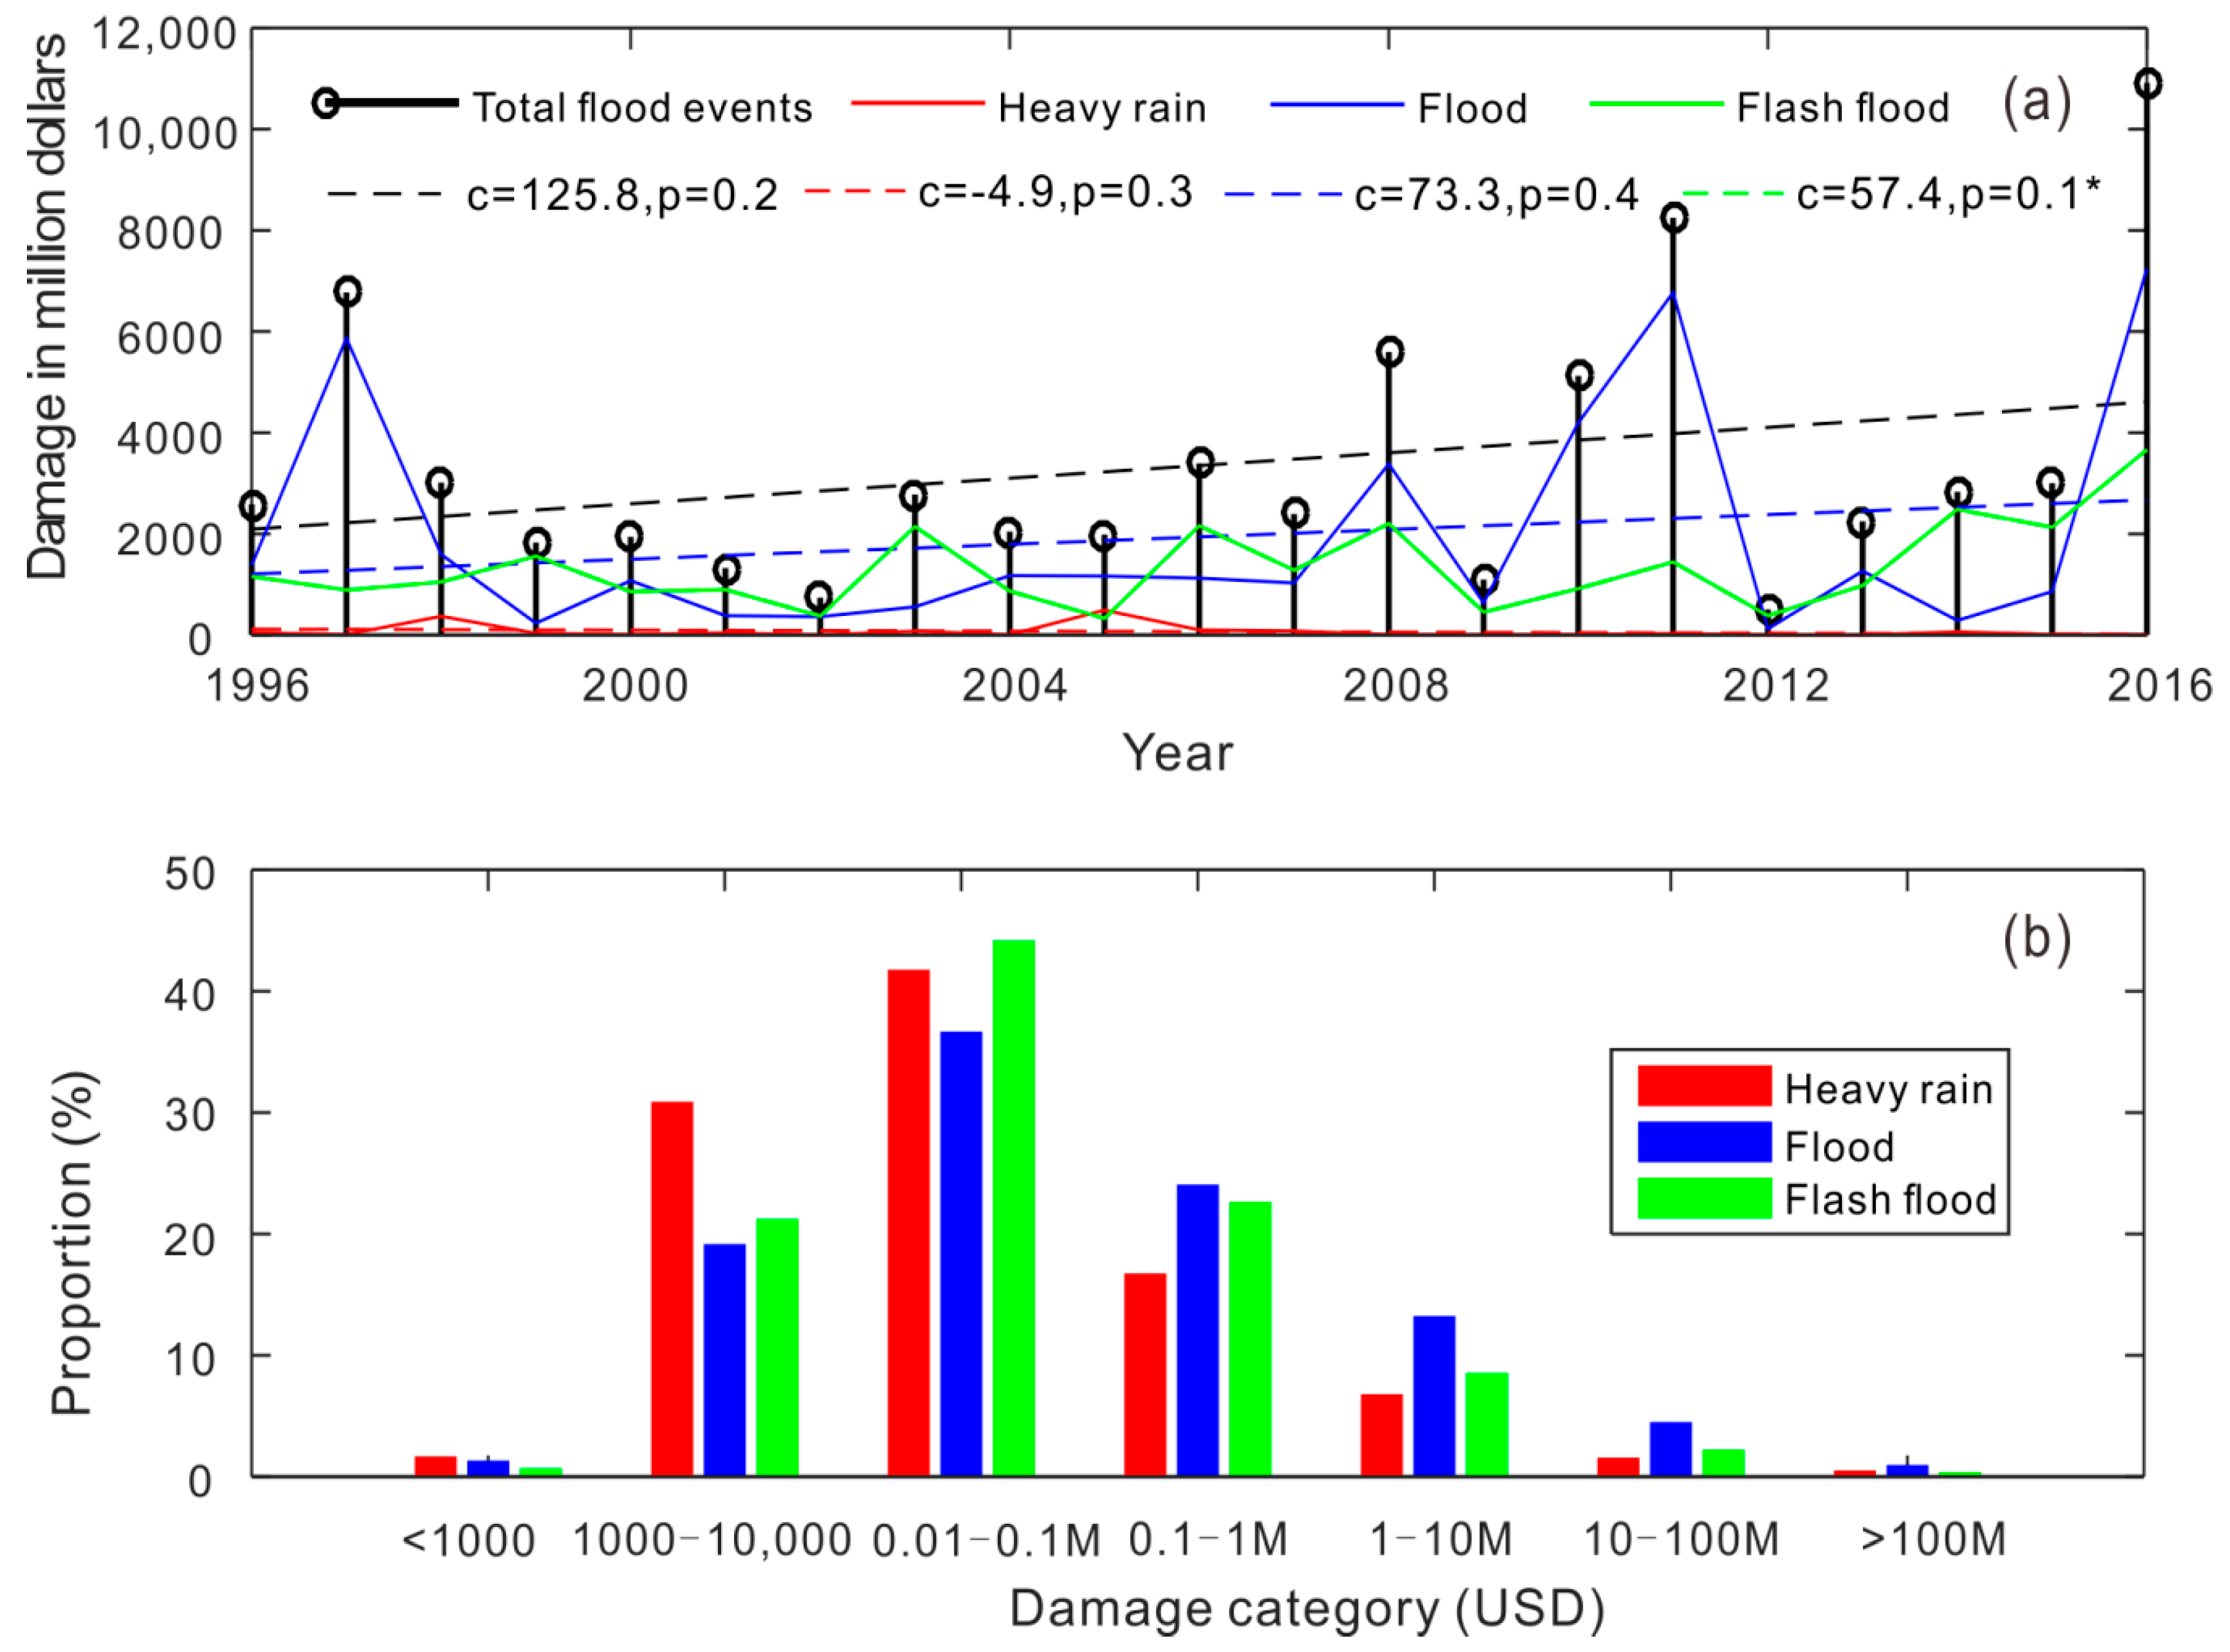
3.1. Changes in Economic Damages
3.2. Hazard
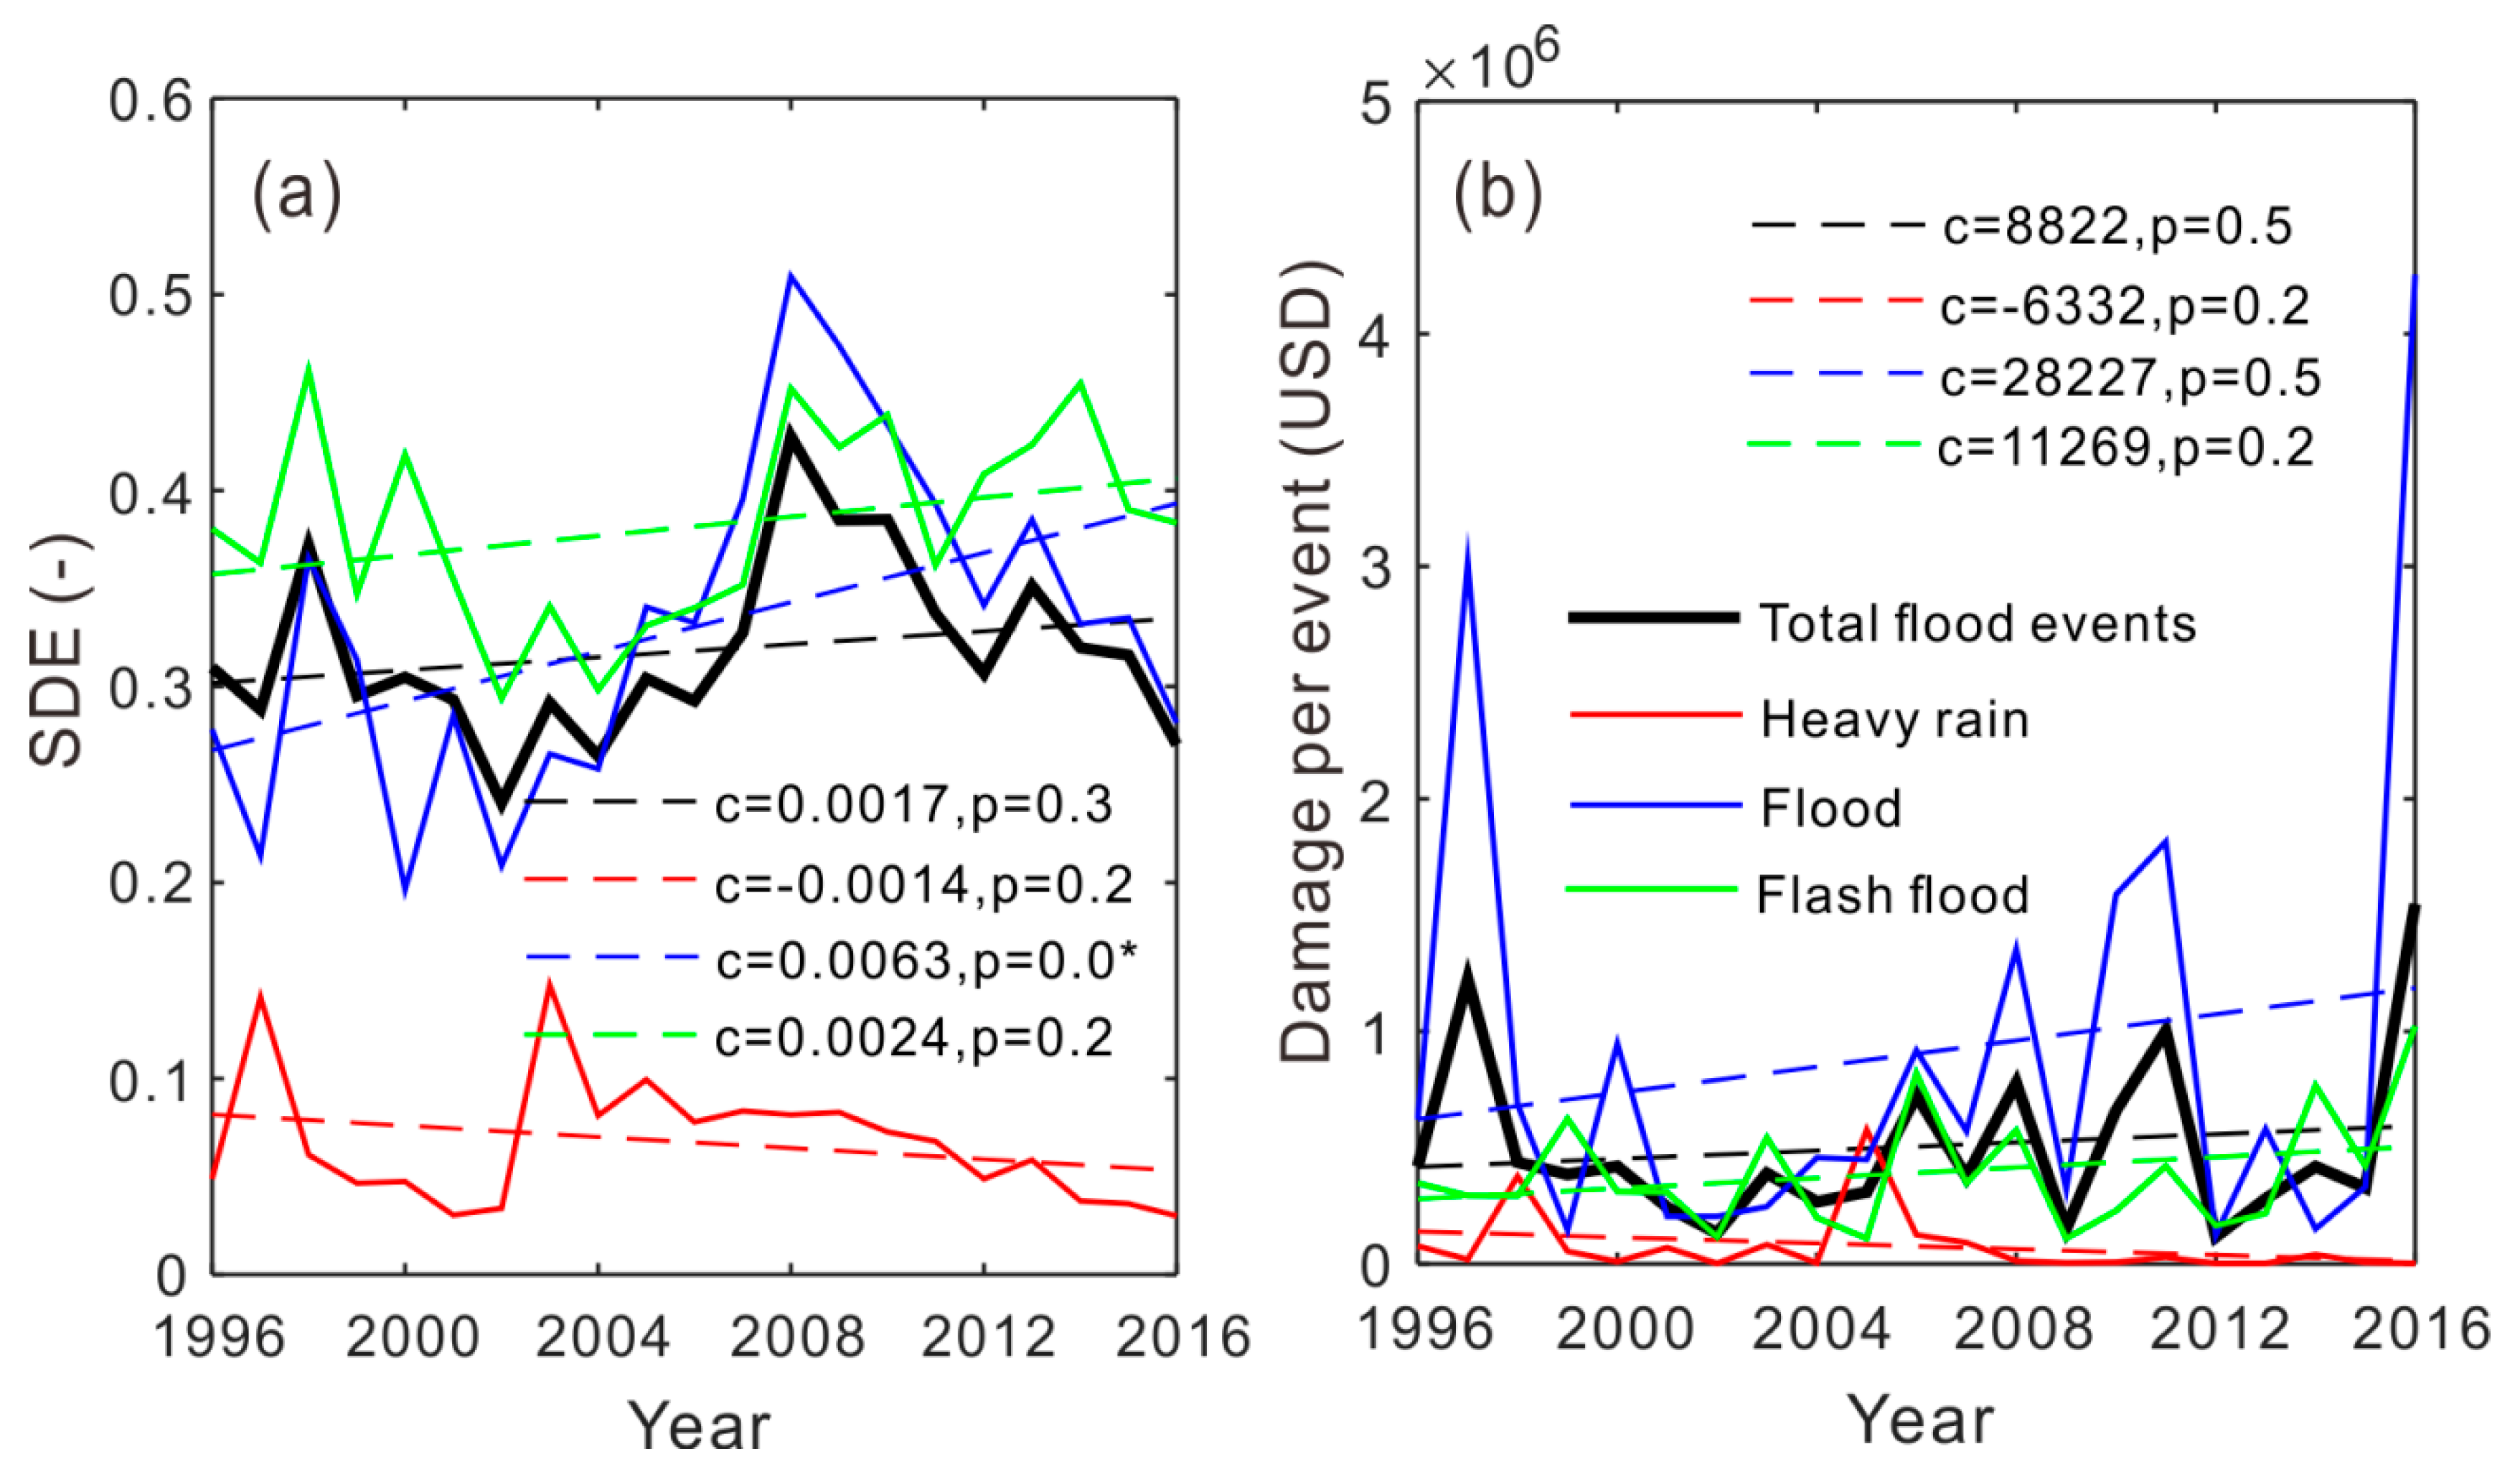
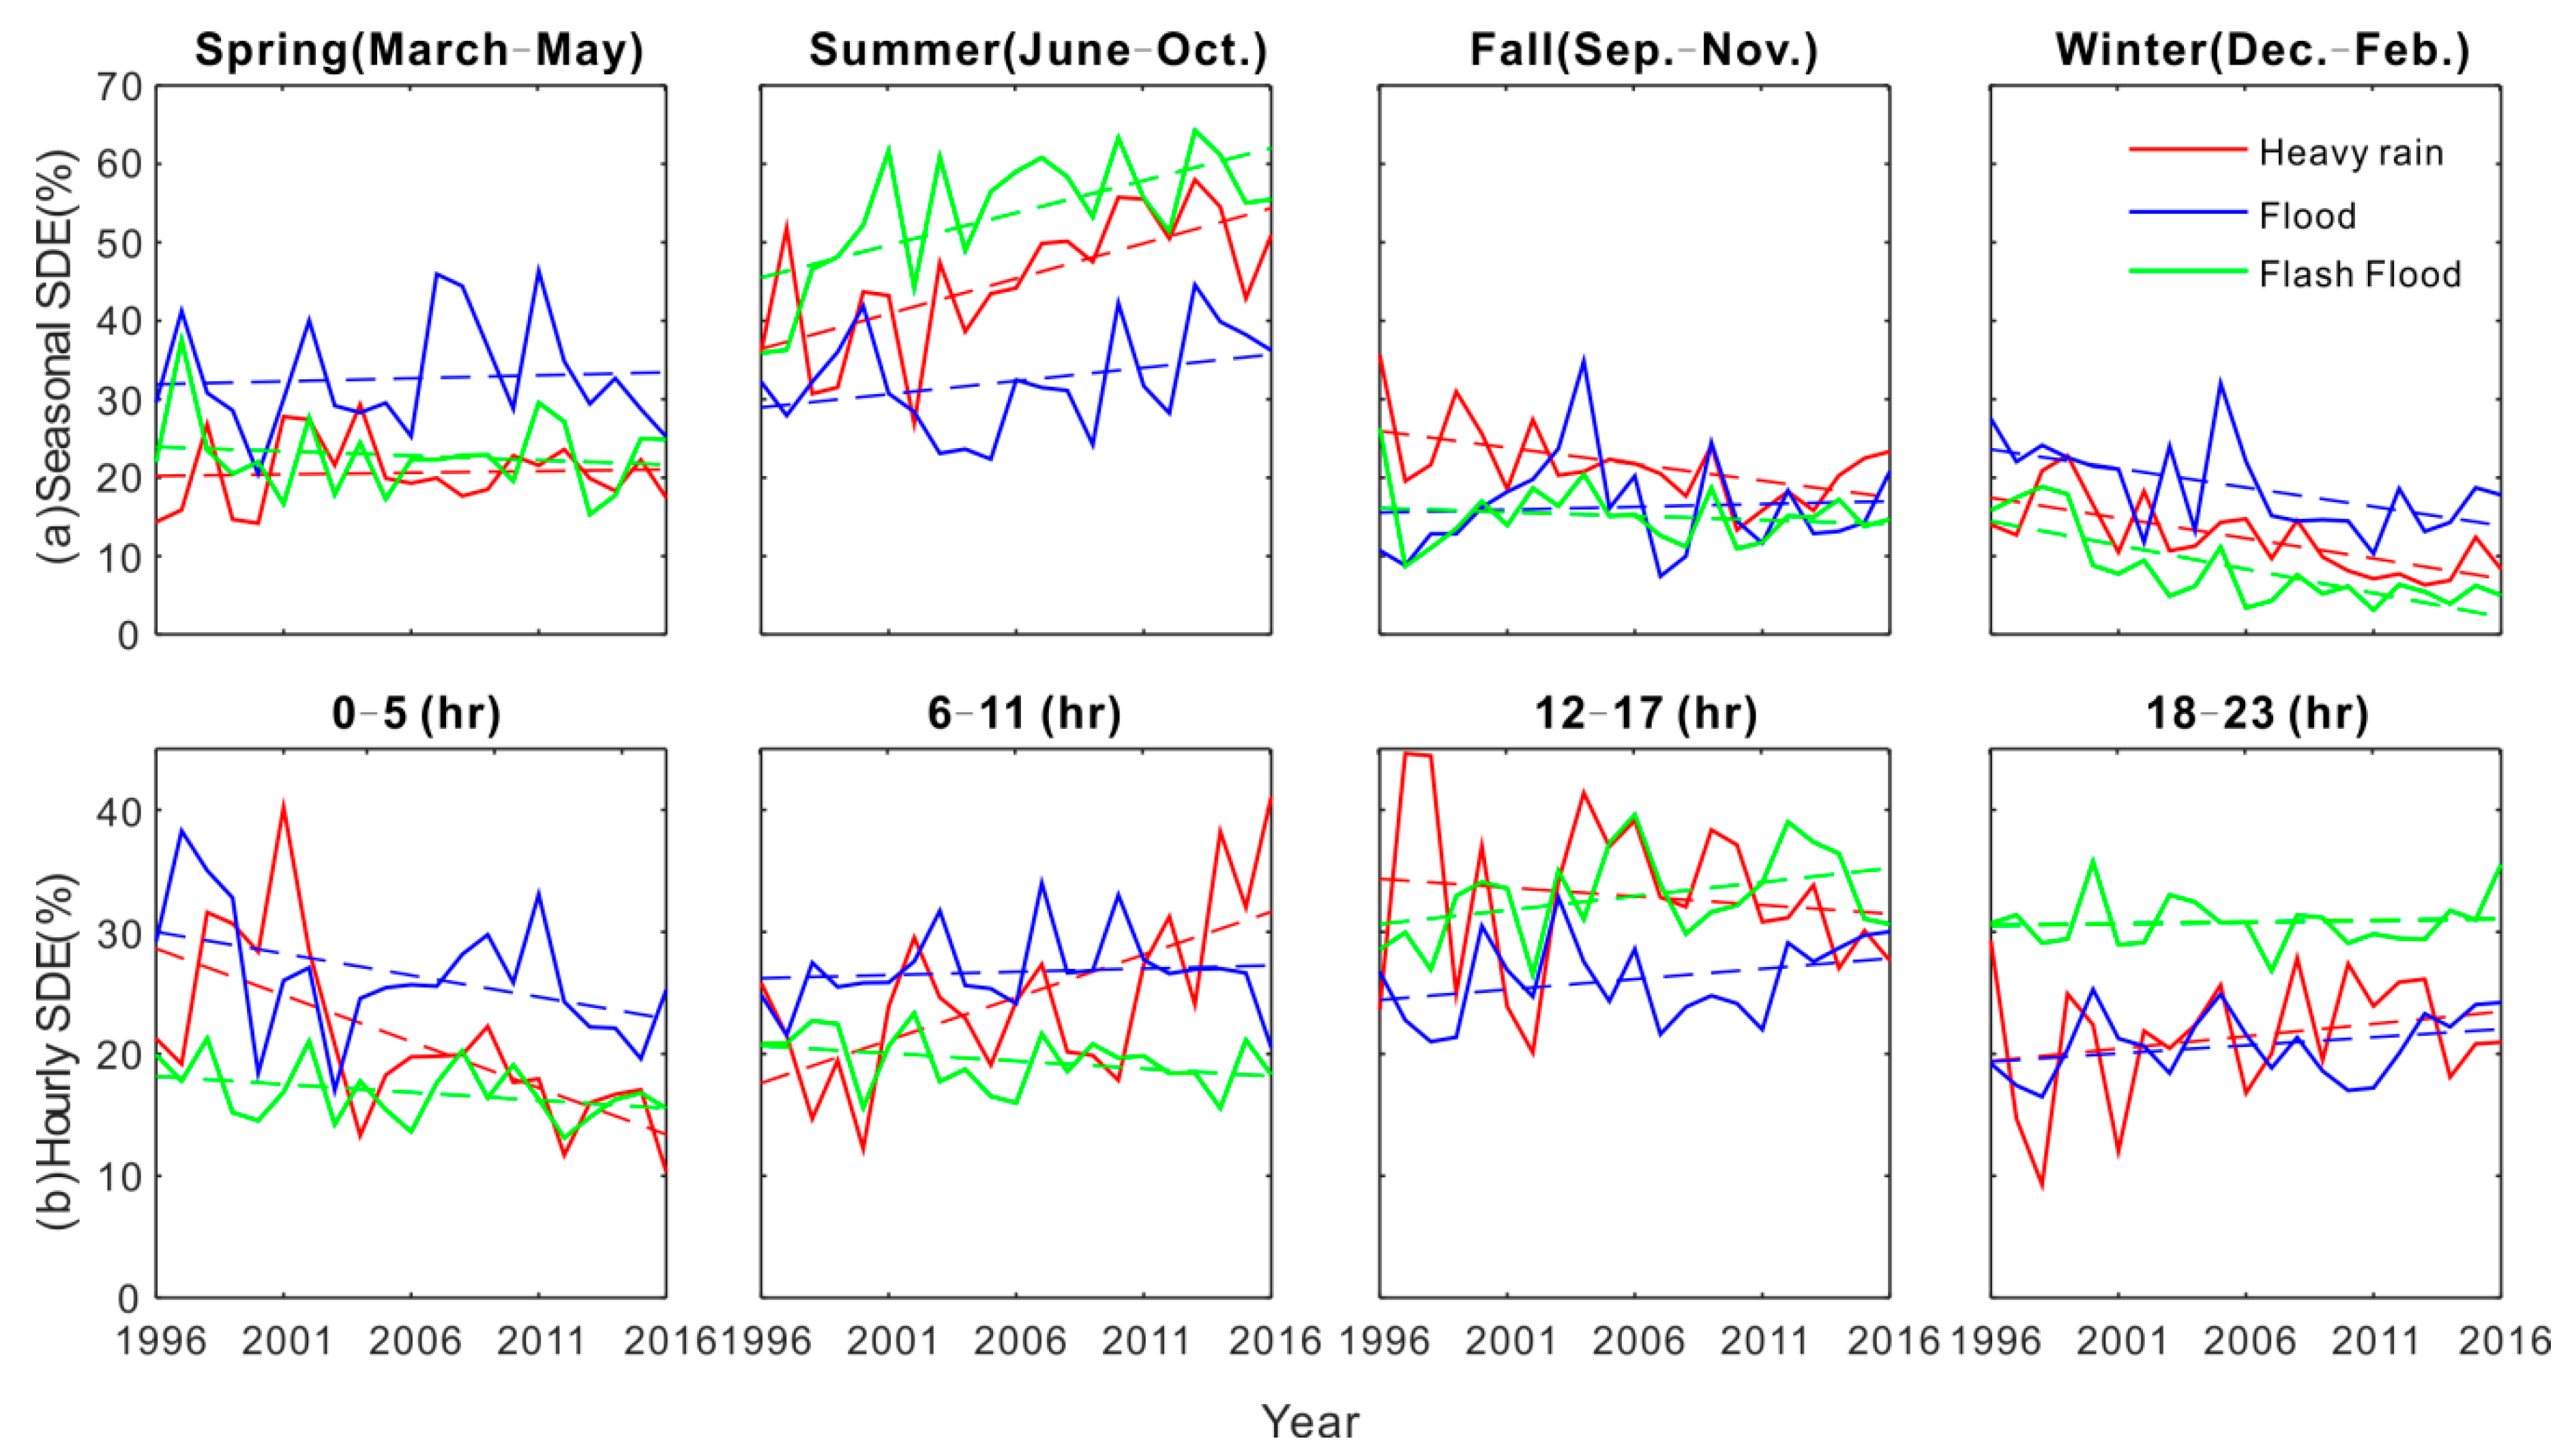
3.3. Vulnerability
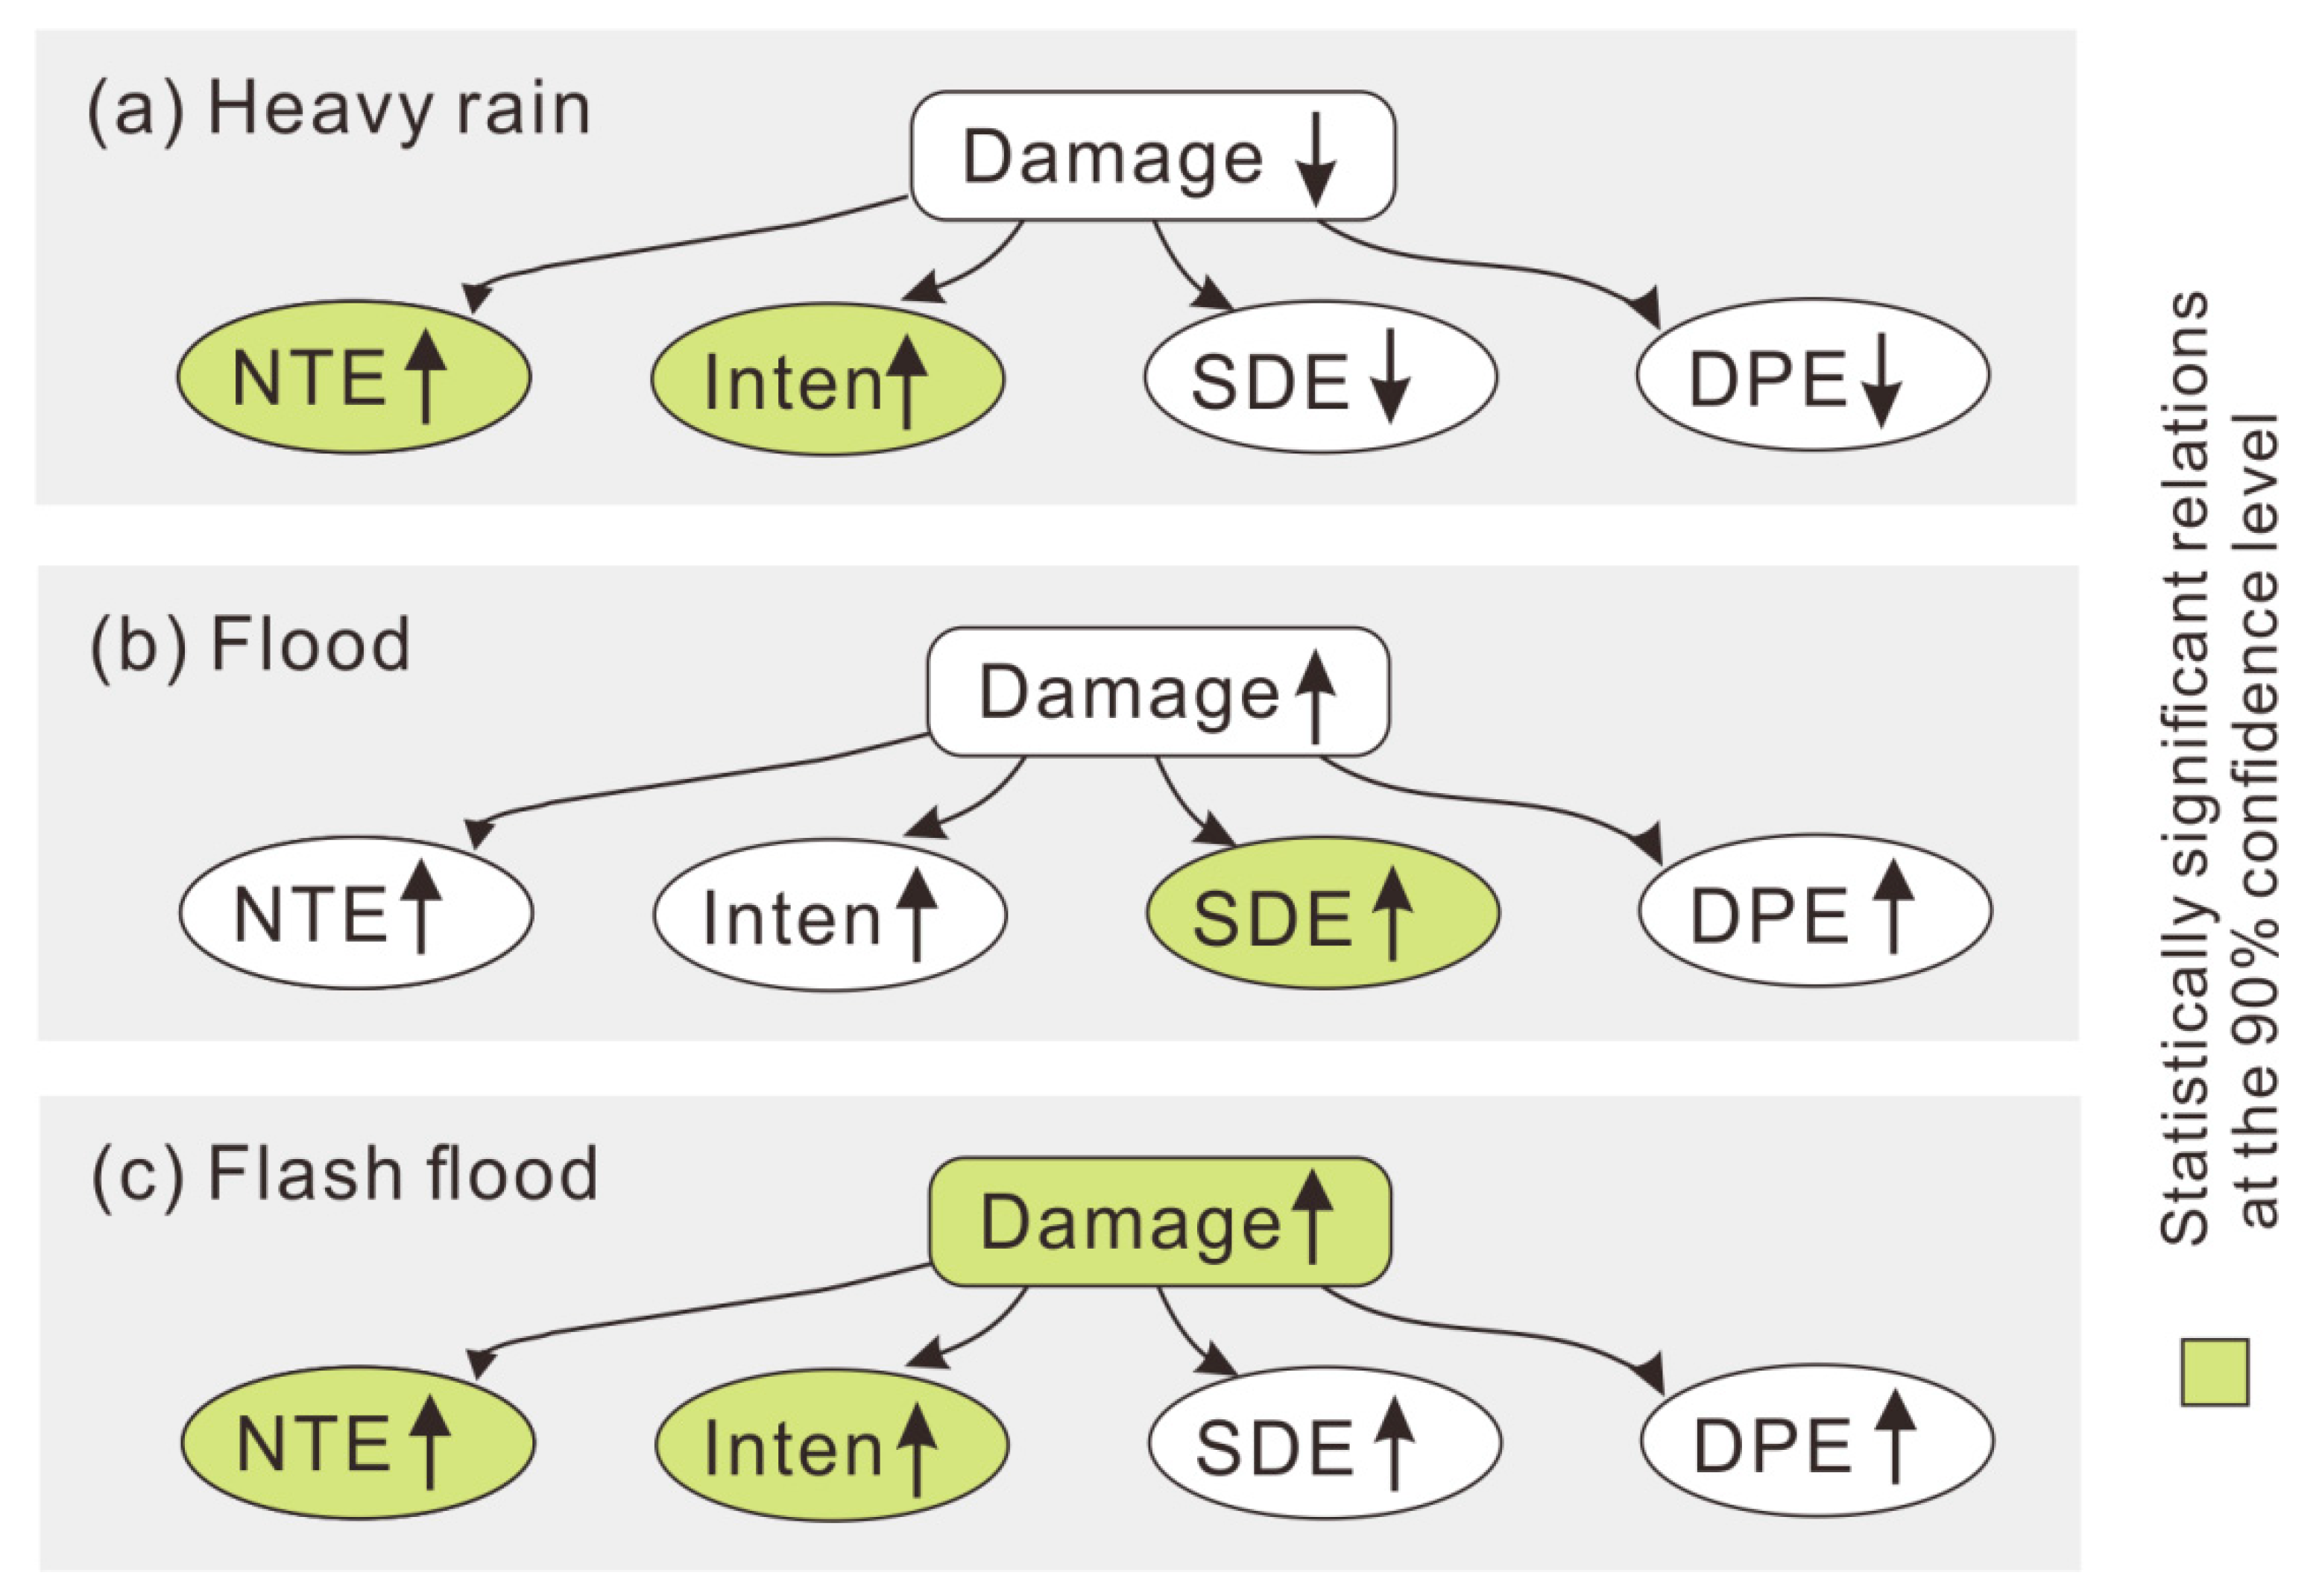
3.4. Attribution Analysis of Key Indicators
4. Summary and Conclusions
Author Contributions
Funding
Conflicts of Interest
References
- Pielke, R.A. Nine fallacies of floods. Clim. Chan. 1999, 42, 413–438. [Google Scholar] [CrossRef]
- Kundzewicz, Z.W.; Kanae, S.; Seneviratne, S.I.; Handmer, J.; Nicholls, N.; Peduzzi, P.; Mechler, R.; Bouwer, L.M.; Arnell, N.; Mach, K.; et al. Flood risk and climate change: Global and regional perspectives. Hydrol. Sci. J. 2014, 59, 1–28. [Google Scholar] [CrossRef]
- Easterling, D.R.; Meehl, G.A.; Parmesan, C.; Changnon, S.A.; Karl, T.R.; Mearns, L.O. Climate extremes: Observations, modeling, and impacts. Science 2000, 289, 2068–2074. [Google Scholar] [CrossRef] [PubMed]
- Philip, J.W.; Brenden, J.; Frederiek Sperna, W.; Arno, B.; Rens van, B.; Marc, F.P.B.; Willem, L.; Hessel, C.W. Assessing flood risk at the global scale: Model setup, results, and sensitivity. Environ. Res. Lett. 2013, 8, 044019. [Google Scholar]
- IPCC. Managing the Risks of Extreme Events and Disasters to Advance Climate Change Adaptation; A Special Report of Working Groups I and II of the Intergovernmental Panel on Climate Change; Field, C.B., Barros, V., Stocker, T.F., Qin, D., Dokken, D.J., Ebi, K.L., Mastrandrea, M.D., Mach, K.J., Plattner, G.-K., Allen, S.K., et al., Eds.; Cambridge University Press: Cambridge, UK; New York, NY, USA, 2012; p. 582. [Google Scholar]
- NOAA. US Climate Extremes Index. National Climatic Data Center, National Oceanic and Atmospheric Administration. Available online: http://www.ncdc.noaa.gov/extremes/cei/ (accessed on 5 February 2018).
- Retchless, D.; Frey, N.; Wang, C.M.; Hung, L.S.; Yarnal, B. Climate extremes in the united states: Recent research by physical geographers. Phys. Geogr. 2014, 35, 3–21. [Google Scholar] [CrossRef]
- Villarini, G.; Smith, J.A.; Baeck, M.L.; Krajewski, W.F. Examining flood frequency distributions in the midwest us. JAWRA J. Am. Water Resour. Assoc. 2011, 47, 447–463. [Google Scholar] [CrossRef]
- Ashley, S.T.; Ashley, W.S. Flood fatalities in the United States. J. Appl. Meteorol. Climatol. 2008, 47, 805–818. [Google Scholar] [CrossRef]
- Pielke, R.A.; Downton, M.W. Precipitation and damaging floods: Trends in the United States, 1932–1997. J. Clim. 2000, 13, 3625–3637. [Google Scholar] [CrossRef]
- NCEI. U.S. Billion-Dollar Weather and Climate Disasters. NOAA National Centers for Environmental Information (NCEI). Available online: https://www.ncdc.noaa.gov/billions/ (accessed on 12 March 2018).
- Smith, A.B.; Katz, R.W. US billion-dollar weather and climate disasters: Data sources, trends, accuracy and biases. Nat. Hazards 2013, 67, 387–410. [Google Scholar] [CrossRef]
- Stewart, I.T.; Ficklin, D.L.; Carrillo, C.A.; McIntosh, R. 21st century increases in the likelihood of extreme hydrologic conditions for the mountainous basins of the southwestern united states. J. Hydrol. 2015, 529, 340–353. [Google Scholar] [CrossRef]
- Takeuchi, K. Increasing vulnerability to extreme floods and societal needs of hydrological forecasting. Hydrol. Sci. J. 2001, 46, 869–881. [Google Scholar] [CrossRef]
- Huang, S.; Leng, G.; Huang, Q.; Xie, Y.; Liu, S.; Meng, E.; Li, P. The asymmetric impact of global warming on us drought types and distributions in a large ensemble of 97 hydro-climatic simulations. Sci. Rep. 2017, 7, 5891. [Google Scholar] [CrossRef] [PubMed]
- Leng, G.; Tang, Q.; Rayburg, S. Climate change impacts on meteorological, agricultural and hydrological droughts in china. Glob. Planet. Chang. 2015, 126, 23–34. [Google Scholar] [CrossRef]
- Trenberth, K.E.; Dai, A.; van der Schrier, G.; Jones, P.D.; Barichivich, J.; Briffa, K.R.; Sheffield, J. Global warming and changes in drought. Nat. Clim. Chang. 2014, 4, 17–22. [Google Scholar] [CrossRef]
- Ntelekos, A.A.; Oppenheimer, M.; Smith, J.A.; Miller, A.J. Urbanization, climate change and flood policy in the United States. Clim. Chang. 2010, 103, 597–616. [Google Scholar] [CrossRef]
- Parr, D.; Wang, G.L.; Ahmed, K.F. Hydrological changes in the us northeast using the connecticut river basin as a case study: Part 2. Projections of the future. Glob. Planet. Chang. 2015, 133, 167–175. [Google Scholar] [CrossRef]
- Zhou, Q.; Mikkelsen, P.S.; Halsnæs, K.; Arnbjerg-Nielsen, K. Framework for economic pluvial flood risk assessment considering climate change effects and adaptation benefits. J. Hydrol. 2012, 414, 539–549. [Google Scholar] [CrossRef]
- Tanoue, M.; Hirabayashi, Y.; Ikeuchi, H. Global-scale river flood vulnerability in the last 50 years. Sci. Rep. 2016, 6, 36021. [Google Scholar] [CrossRef]
- Jongman, B.; Winsemius, H.C.; Aerts, J.C.; de Perez, E.C.; van Aalst, M.K.; Kron, W.; Ward, P.J. Declining vulnerability to river floods and the global benefits of adaptation. Proc. Natl. Acad. Sci. USA 2015, 112, E2271–E2280. [Google Scholar] [CrossRef] [Green Version]
- Floodsite. Flood Risk Assessment and Flood Risk Management. An Introduction and Guidance Based on Experiences and Findings of Floodsite (An Eu-Funded Integrated Project); Deltares/Delft Hydraulics: Delft, The Netherlands, 2009; ISBN 97890840670. [Google Scholar]
- Karl, T.R.; Knight, R.W. Secular trend of precipitation amount, frequency, and intensity in the United States. Bull. Am. Meteorol. Soc. 1998, 79, 231–242. [Google Scholar] [CrossRef]
- Kunkel, K.E.; Andsager, K.; Easterling, D.R. Long-term trends in extreme precipitation events over the conterminous United States and Canada. J. Clim. 1999, 12, 2515–2527. [Google Scholar] [CrossRef]
- Zhou, Q.; Leng, G.; Feng, L. Predictability of state-level flood damage in the conterminous united states: The role of hazard, exposure and vulnerability. Sci. Rep. 2017, 7, 5354. [Google Scholar] [CrossRef] [PubMed]
- Mallakpour, I.; Villarini, G. The changing nature of flooding across the central united states. Nat. Clim. Chang. 2015, 5, 250–254. [Google Scholar] [CrossRef]
- Changnon, S.A.; Pielke, R.A.; Changnon, D.; Sylves, R.T.; Pulwarty, R. Human factors explain the increased losses from weather and climate extremes. Bull. Am. Meteorol. Soc. 2000, 81, 437–442. [Google Scholar] [CrossRef]
- Barredo, J.I.; Sauri, D.; Llasat, M.C. Assessing trends in insured losses from floods in Spain 1971–2008. Nat. Hazards Earth Syst. Sci. 2012, 12, 1723–1729. [Google Scholar] [CrossRef]
- Visser, H.; Petersen, A.C.; Ligtvoet, W. On the relation between weather-related disaster impacts, vulnerability and climate change. Clim. Chang. 2014, 125, 461–477. [Google Scholar] [CrossRef] [Green Version]
- Choi, O.; Fisher, A. The impacts of socioeconomic development and climate change on severe weather catastrophe losses: Mid-atlantic region (mar) and the US. Clim. Chang. 2003, 58, 149–170. [Google Scholar] [CrossRef]
- Bouwer, L.M. Have disaster losses increased due to anthropogenic climate change? Bull. Am. Meteorol. Soc. 2011, 92, 39. [Google Scholar] [CrossRef]
- Wing, O.E.J.; Bates, P.D.; Smith, A.M.; Sampson, C.C.; Johnson, K.A.; Fargione, J.; Morefield, P. Estimates of present and future flood risk in the conterminous united states. Environ. Res. Lett. 2018, 13, 034023. [Google Scholar] [CrossRef]
- Barredo, J.I. Major flood disasters in Europe: 1950–2005. Nat. Hazards 2007, 42, 125–148. [Google Scholar] [CrossRef]
- Neumayer, E.; Barthel, F. Normalizing economic loss from natural disasters: A global analysis. Glob. Environ. Chang. 2011, 21, 13–24. [Google Scholar] [CrossRef] [Green Version]
- Hallegatte, S.; Green, C.; Nicholls, R.J.; Corfee-Morlot, J. Future flood losses in major coastal cities. Nat. Clim. Chang. 2013, 3, 802–806. [Google Scholar] [CrossRef]
- Peduzzi, P.; Chatenoux, B.; Dao, H.; De Bono, A.; Herold, C.; Kossin, J.; Mouton, F.; Nordbeck, O. Global trends in tropical cyclone risk. Nat. Clim. Chang. 2012, 2, 289. [Google Scholar] [CrossRef]
- Wu, J.; Han, G.; Zhou, H.; Li, N. Economic development and declining vulnerability to climate-related disasters in china. Environ. Res. Lett. 2018, 13, 3. [Google Scholar] [CrossRef]
- NWS. National Weather Service Instruction 10-1605, Storm Data Preparation. 2016. Available online: https://www.ncdc.noaa.gov/stormevents/pd01016005curr.pdf (accessed on 8 March 2018).
- Gaume, E.; Bain, V.; Bernardara, P.; Newinger, O.; Barbuc, M.; Bateman, A.; Blaskovicova, L.; Bloschl, G.; Borga, M.; Dumitrescu, A.; et al. A compilation of data on european flash floods. J. Hydrol. 2009, 367, 70–78. [Google Scholar] [CrossRef]
- Barredo, J.I. Normalised flood losses in Europe: 1970–2006. Nat. Hazards Earth Syst. Sci. 2009, 9, 97–104. [Google Scholar] [CrossRef]
- Lung, T.; Lavalle, C.; Hiederer, R.; Dosio, A.; Bouwer, L.M. A multi-hazard regional level impact assessment for europe combining indicators of climatic and non-climatic change. Glob. Environ. Chang. 2013, 23, 522–536. [Google Scholar] [CrossRef]
- Dang, N.M.; Babel, M.S.; Luong, H.T. Evaluation of food risk parameters in the day river flood diversion area, red river delta, vietnam. Nat. Hazards 2011, 56, 169–194. [Google Scholar] [CrossRef]
- Ahmadisharaf, E.; Kalyanapu, A.J.; Chung, E.S. Sustainability-based flood hazard mapping of the swannanoa river watershed. Sustainability 2017, 9, 1735. [Google Scholar] [CrossRef]
- Meyer, V.; Haase, D.; Scheuer, S. Flood risk assessment in european river basins—Concept, methods, and challenges exemplified at the mulde river. Integr. Environ. Assess. Manag. 2009, 5, 17–26. [Google Scholar] [CrossRef]


| Impact Metrics | Descriptions |
|---|---|
| Damage | Total annual Damages (D) in USD |
| Hazard | Number of Total Events (NTE); Number of Valid Events (NVE) |
| Intensity, i.e., depth of precipitation | |
| Vulnerability | Share of Damaging Events (SDE = NVE/NTE) |
| Damage Per Event (DPE = D/NTE) |
© 2019 by the authors. Licensee MDPI, Basel, Switzerland. This article is an open access article distributed under the terms and conditions of the Creative Commons Attribution (CC BY) license (http://creativecommons.org/licenses/by/4.0/).
Share and Cite
Zhou, Q.; Su, J.; Leng, G.; Peng, J. The Role of Hazard and Vulnerability in Modulating Economic Damages of Inland Floods in the United States Using a Survey-Based Dataset. Sustainability 2019, 11, 3754. https://0-doi-org.brum.beds.ac.uk/10.3390/su11133754
Zhou Q, Su J, Leng G, Peng J. The Role of Hazard and Vulnerability in Modulating Economic Damages of Inland Floods in the United States Using a Survey-Based Dataset. Sustainability. 2019; 11(13):3754. https://0-doi-org.brum.beds.ac.uk/10.3390/su11133754
Chicago/Turabian StyleZhou, Qianqian, Jiongheng Su, Guoyong Leng, and Jian Peng. 2019. "The Role of Hazard and Vulnerability in Modulating Economic Damages of Inland Floods in the United States Using a Survey-Based Dataset" Sustainability 11, no. 13: 3754. https://0-doi-org.brum.beds.ac.uk/10.3390/su11133754