A Study of Tourists’ Holiday Rush-Hour Avoidance Travel Behavior Considering Psychographic Segmentation

1
College of Architecture and Civil Engineering, Beijing University of Technology, Beijing 100124, China
2
Beijing Engineering Research Center of Urban Transport Operation Guarantee, Beijing University of Technology, Beijing 100124, China
3
School of Traffic, Qinghai Nationalities University, Xining 810007, China
*
Author to whom correspondence should be addressed.
Sustainability 2019, 11(13), 3755; https://0-doi-org.brum.beds.ac.uk/10.3390/su11133755
Submission received: 17 June 2019
/
Revised: 3 July 2019
/
Accepted: 4 July 2019
/
Published: 9 July 2019
Abstract
:Tourists are confronted with congestion caused by concentrated travel during public holidays. In order to guide tourists to make voluntary changes regarding their travel times during holidays, this paper focuses on exploring holiday rush-hour avoidance travel behavior (HRATB) considering psychological factors. First, based on the theory of planned behavior, the effects of psychological factors including attitude, subjective norm, and perceived behavior control on holiday avoidance travel intention and behavior were quantitatively analyzed by the structural equation model. Second, according to those three subjective psychological factors and the three objective factors of age, monthly income, and tourist group, the segmentation method of the latent class model was adopted to explore tourists’ preferences with regard to HRATB. Finally, an empirical analysis was carried out through questionnaire data. The results show that attitude, subjective norm, and perceived behavior control have significant impacts on intention and behavior with regard to holiday avoidance travel. There are significant differences in psychological observation variables such as rush-hour avoidance travel intention, attitude and subjective norm among the four segments of tourists, and cost sensitivity. In addition, this paper puts forward some countermeasures and suggestions for the four types of tourists. Conclusions provide a theoretical basis for formulating travel measures to attract different types of tourists.
1. Introduction
With people’s increasing living standards, the demand for tourism continues to grow, especially for concentrated tourism and travel on holidays. The number of Chinese tourists on holidays has been increasing in recent years, with 415 million Chinese tourists traveled during the 2019 Spring Festival as compared to 203 million in 2013. However, due to imperfect travel information, insufficient service capacity of scenic spots, roads, and parking facilities, and other factors, tourist attractions are overcrowded on holidays, thus highways and roads around scenic spots are congested [1,2,3]. According to statistics, the average time for congested sections of highways on holidays is more than 10 hours in 2017 National Day [4]. The longest time for congestion exceeds 113 hours of S15 highway and the driving time around Hongcun scenic areas is four times longer than usual in 2018 National Day [5]. Crowded scenic spots and roads on holidays seriously affect tourists’ travel experience and pose a serious threat to their travel efficiency and safety as well as the ecological environment of those scenic spots. In the longer term, this phenomenon restricts the sustainable development of tourism.
In order to alleviate the problem of travel congestion on holidays and festivals, various countermeasures have been implemented, such as inducing holiday travel, restricting freight car traffic, avoiding rush hour, limiting scenic spot flow diversion, instituting peak fares, and making reservation in advance. Among them, rush-hour avoidance is a soft measure of traffic demand management for travelers to change their travel time voluntarily mainly by means of information and knowledge exchange [6]. The implementation cost is low and it can alleviate the congestion of centralized travel to a certain extent. Salomon et al. [7], Hess et al. [8], and Choo et al. [9] showed that in order to avoid traffic congestion, travelers are more likely to adjust their departure time than change their traffic mode. Therefore, it can be seen that travelers will take some useful measures such as reasonable departure time so as to avoid traffic congestion, and it is necessary to carry out intensive research of holiday traffic behavior.
Thus, the questions are as follows: How to guide tourists to avoiding rush hour travel on holidays? What are the psychological factors that affect tourists’ holiday travel behavior during rush hour? Which types of tourists are more likely to avoid rush hour travel during holidays and how to classify those tourists? What targeted measures can be developed to guide tourists to avoid rush hour travel on holidays and obtain better travel experience?
Rush-hour avoidance travel is essentially the choice of departure time. Peak spreading is a research topic that can be traced back to the 1970 and 1980s [10]. Many scholars have studied the influencing factors of rush-hour avoidance travel. For example, Steed and Bhat [11] established a discrete selection model from the point of view of leisure and entertainment travel and shopping travel, and studied departure time selection behavior. The results show that sociodemographic variables, family structure variables, personal work-related attributes, and travel characteristics all have a significant impact on departure time. Ben-Elia [12,13,14] found flexible working time, incentives and road tolls had an impact on the shift from peak travel to low-peak travel for car commuters. Zhang et al. [15] investigated the influence of incentive measures on the travel behaviors of office workers on the basis of a questionnaire survey on the Beijing subway system, and found that services related to fast food restaurants, reduced fares, and flexible working hours had a positive effect on avoiding morning rush hour. Thorhauge et al. [16] considered that the flexibility of daily activity time has a significant impact on travelers’ willingness to change their departure time.
In terms of holiday travel behavior, Shailes et al. [17] showed that about 54% of travelers during holidays chose to change their departure time in order to avoid rush-hour road congestion, and attitude, group size, and visit frequency were the main influencing factors. During holiday periods, due to the concentration of travel, traffic distribution has obvious congestion peaks for going and returning [1]. The congestion of concentrated travel on holidays seriously affects tourists’ travel experience and increases their travel time cost [2]. In order to improve the experience and reduce the delay, tourists choose reasonable travel times to avoid the peak of congestion, that is, holiday rush-hour avoidance travel (HRAT). The avoidance travel of holidays is different from that of commuting. First of all, the time scale of peak travel is different. The peak of commuting is mostly concentrated in the morning and evening rush hours [14]. However, the peak of holidays is mostly concentrated in the departure and return during the holiday cycle [18]. Second, the time restrictions on the implementation of rush-hour avoidance travel are different. Commuting travel is mainly restricted by working time [16], while holiday travel is mainly restricted by free time to change plans [18]. Moreover, the subjects and their behavioral intentions for rush-hour avoidance are different: commuters pay more attention to punctuality [19], and holiday travelers pay more attention to experience [20].
On the other hand, the influence of psychological factors on travel choice, especially the choice of departure time, has attracted the attention of some scholars in recent years. Arellana et al. [21] first pointed out that one’s attitude toward departure time and changing travel conditions would affect the choice of departure time. Choo et al. [8] showed that travel preferences and attitudes and other factors have a significant impact on commuters’ choice of departure time. Thorhauge et al. [22] used a structural equation model to study the influence of three behavioral intention latent variables on departure time: punctual arrival, short trip, and low cost. Haustein et al. [23] built a structural equation model by adding personal norms and perceived mobility on the basis of planned behavior theory, and studied the influence of psychological factors on commuters’ choice of departure time. These studies show that psychological factors have a great impact on departure time choice behavior.
In addition, because of the different sensitivity of travelers to the influencing factors, their performance behavior is different, and thus has different effects on the implementation of policy measures. Generally, a segmentation study of travelers is helpful to determine the differences in their behavior rules and characteristics, to classify travelers with behavior differences, and then to formulate more targeted and effective policy measures [23]. The latent class model is an important research method to subdivide the behavioral differences of travelers with distinct characteristics [24]. It can overcome the disadvantage of traditional clustering analysis, which categorically allocates travelers to a single group and ignores the possibility of misclassification [25]. Latent class models have been applied to traffic segmentation in recent years, such as air passenger segmentation [26,27], the route selection behavior of long-distance drivers [28], travelers using multiple modes of transportation [25], bicycle users [29], the driving behavior of combined sections [30], and how long tourists stay at destinations [31], and all of these studies have demonstrated the advantages of segmentation research with the latent class model. A traveler segmentation study considering psychological factors has higher predictive power than an individual attribute segmentation study [32,33]. Some researchers make use of attitudes to segment the travel market and find that they can effectively identify latent transferers in other travel modes [34,35].
Obviously, the above studies on rush-hour avoidance travel behavior mainly focused on daily commuting behavior, and there is a lack of research on holiday tourists. It is generally believed that there is a great difference between holiday travel behavior and commuter travel behavior [36,37,38]. In addition, existing research mostly focuses on the objective influencing factors, while the effect of psychological factors on travel behavior remain to be explored. Some studies have posited that travelers’ psychological factors have a greater impact on their travel choice behaviors than socioeconomic attributes and infrastructure [39]. Therefore, it is necessary to take psychological factors into consideration in order to conduct a subdivision study, to have a deeper understanding of the demands of different tourist groups and holiday rush-hour avoidance travel behavior preferences.
To sum up, exploring the influence of psychological factors on holiday rush-hour avoidance travel behavior can better reveal the internal reasons for the choices travelers make. Thus, the main purposes of this study are as follows: (1) to explore the causality between psychological factors and holiday tourists’ intention and behavior with regard to avoiding rush-hour traffic by using a structural equation model, and (2) to segment the categories of tourist groups by the latent class model and analyze the differences in the selections made by tourists in terms of holiday travel avoidance according to psychological factors, individual attributes, and tourism characteristics. In view of the model results, the behavioral characteristics of tourists are analyzed which will help to provide reference for the formulation of targeted induction measures based on the resulting tourists’ psychographic profiles.
The remaining sections are organized as follows: Section 2 introduces the research framework and research methods. Section 3 describes the holiday travel questionnaire. Section 4 presents the model estimation and subdividing results. Section 5 elaborates the conclusions of the research and puts forward corresponding measures and suggestions, as well as future research work.
2. Methodology
2.1. Model Framework
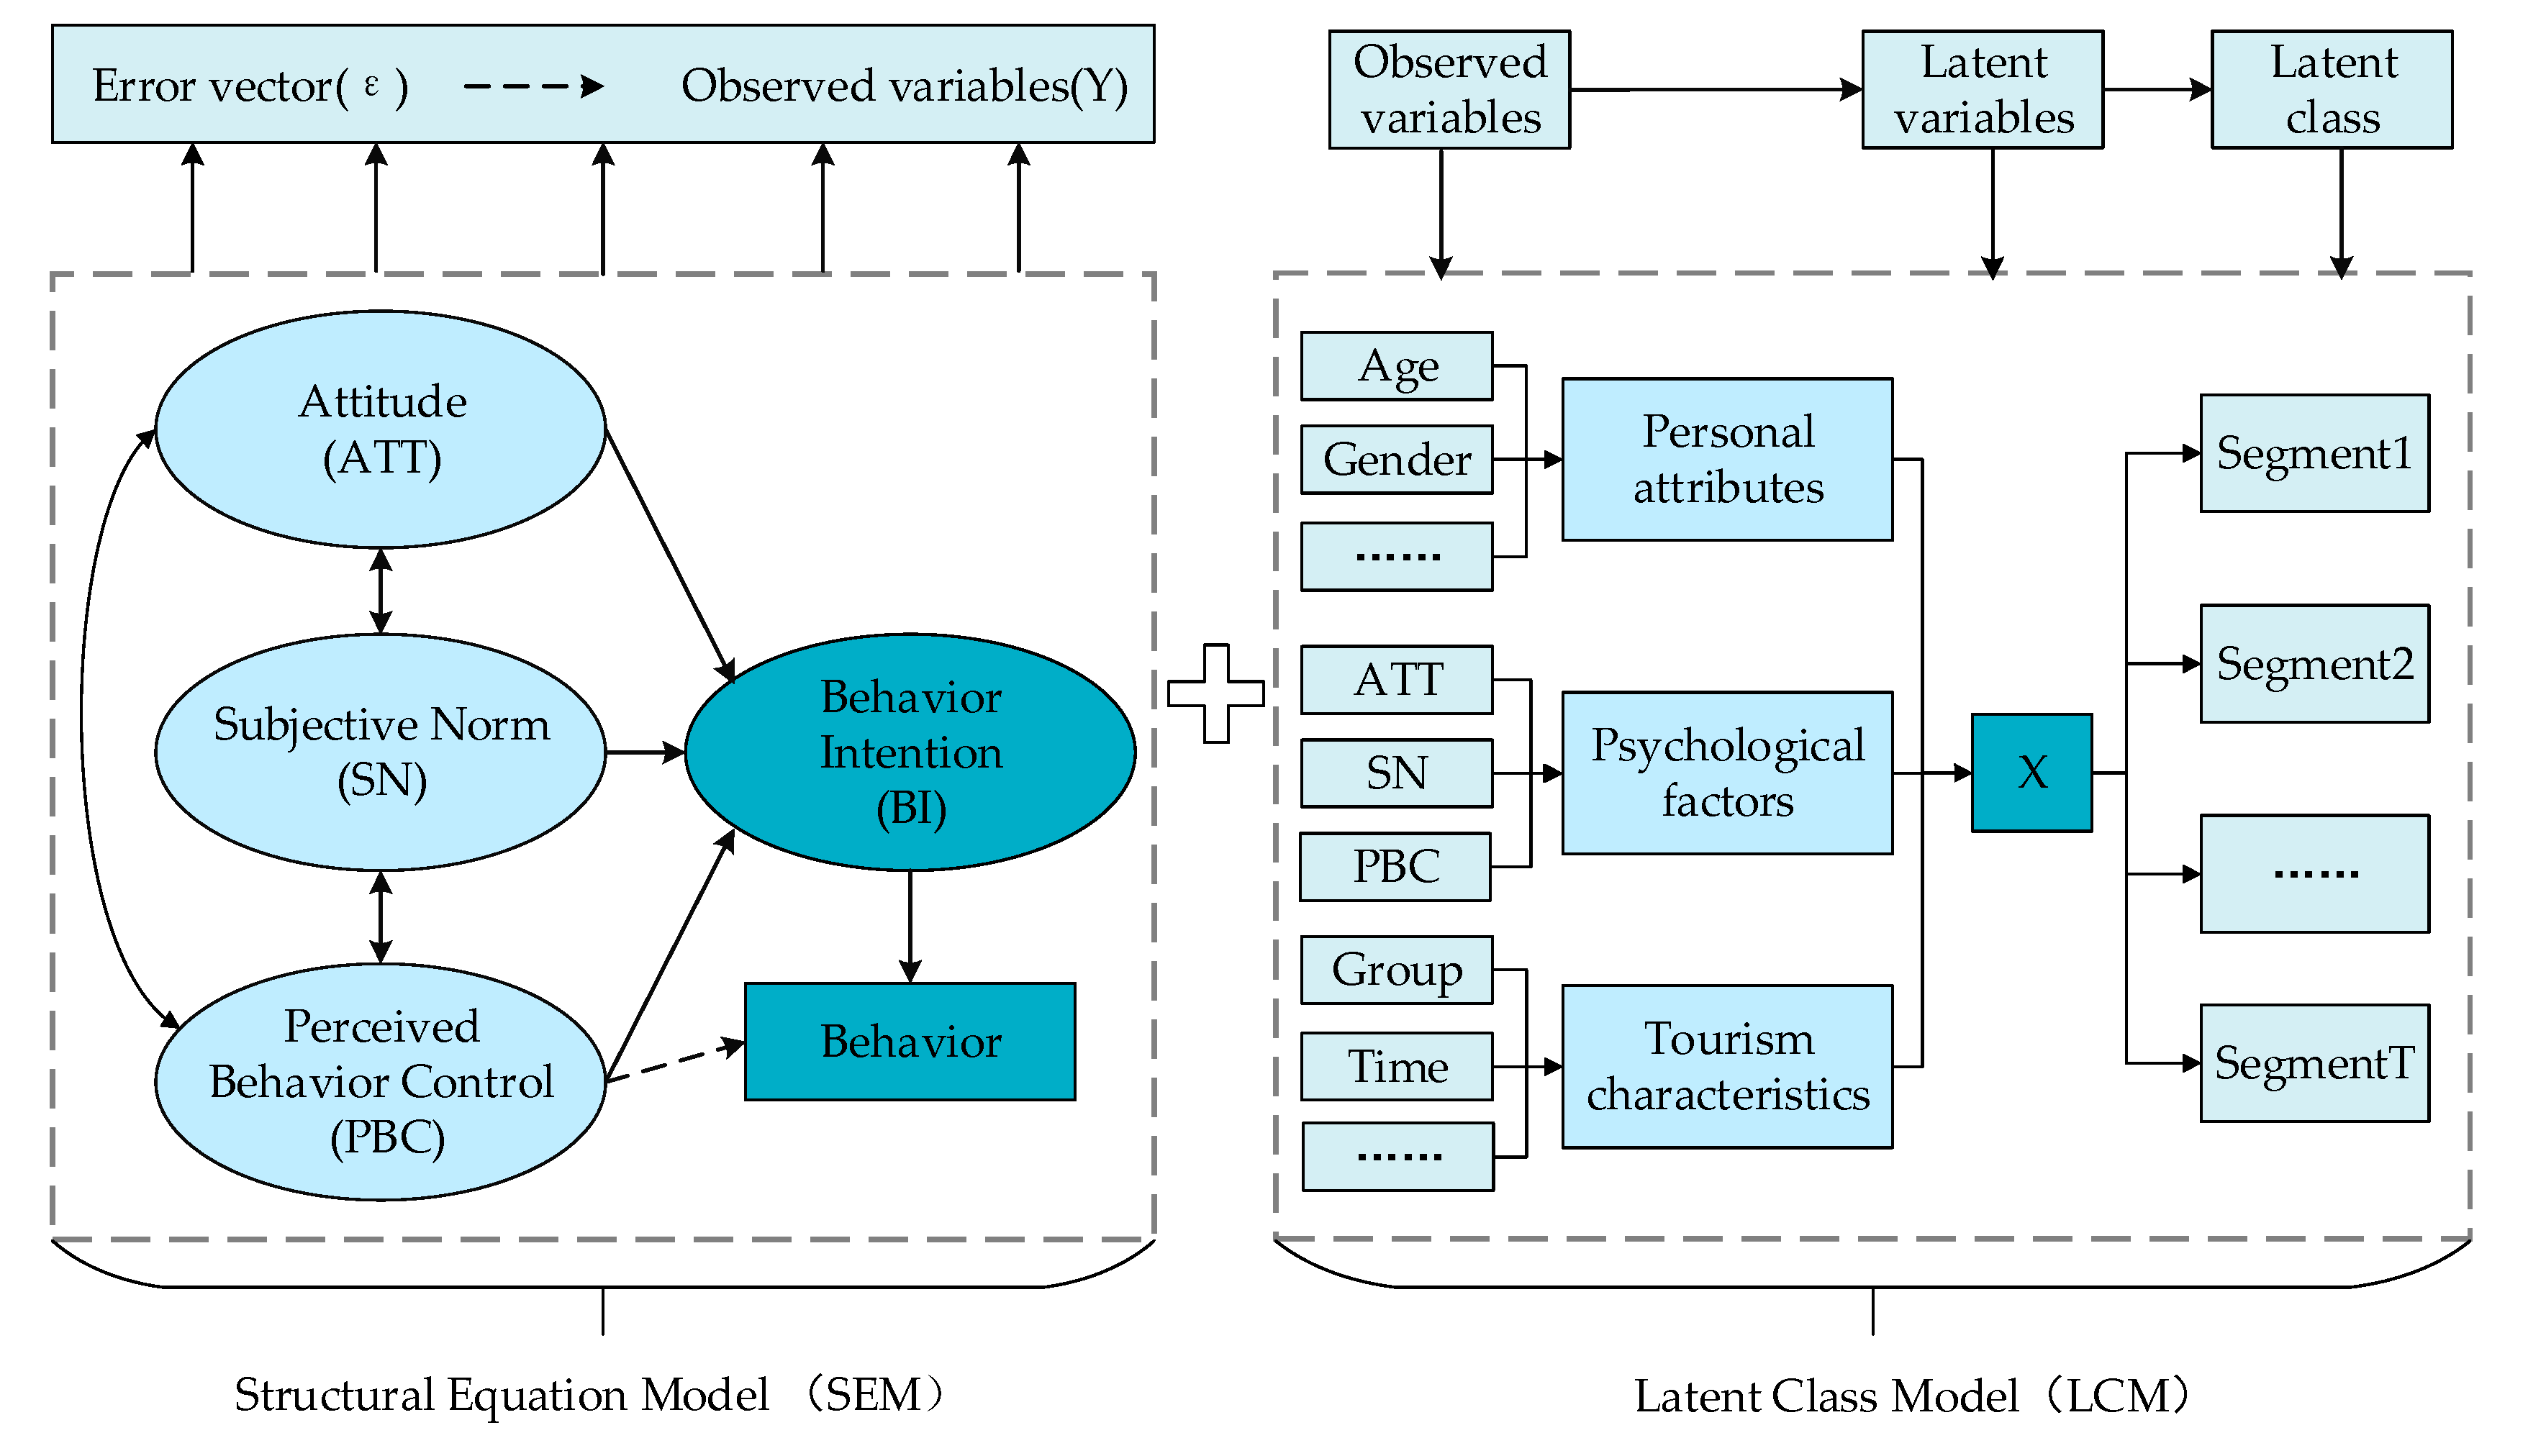
In order to analyze the influence of psychological factors on the intention and behavior of holiday tourists with regard to rush-hour avoidance, this paper first establishes the relationship between psychological factors and travel intention and behavior by using a structural equation model (SEM) to explore the causal relationship and influence of various factors. After that, in order to identify the differences in the preferences of tourists’ HRATB, a latent class model (LCM) is used to explore the latent tourist category and analyze the selection characteristics of different groups. The framework is shown in Figure 1.
According to the theory of planned behavior (TPB), behavior is directly affected wholly or partly by intention, attitude, subjective norm, perceived behavior control and other psychological factors [40]. The TPB provides a theoretical basis for explaining the influence of psychological factors on travel time choice [21,22]. Based on the TPB, this paper constructs a theoretical model of the relationship between psychological factors and behavioral intentions and behaviors, as shown in the SEM framework in Figure 1. The constructed model includes four latent variables: attitude (ATT), subjective norm (SN), perceived behavior control (PBC), and behavior intention (BI). Among them, BI is an intermediary variable, and the result of behavior is whether to choose holiday rush-hour avoidance travel. We put forward the following assumptions:
Hypothesis 1 (H1).
Attitude has a positive effect on the intention to avoid holiday rush-hour travel.
Hypothesis 2 (H2).
Subjective norm has a positive effect on the intention to avoid holiday rush-hour travel.
Hypothesis 3 (H3).
Perceived behavior control has a positive effect on the intention to avoid holiday rush-hour travel.
Hypothesis 4 (H4).
Perceived behavior control has a positive effect on holiday rush-hour avoidance behavior.
Hypothesis 5 (H5).
The intention to avoid holiday rush-hour has a positive effect on holiday rush-hour avoidance behavior.
Based on the analysis of the relationship between psychological factors and holiday rush-hour avoidance intention and behavior, the differences in tourists’ behavioral intention and preferences were further explored, and the latent class model was used for tourist segmentation, as shown in the LCM framework in Figure 1. In the study of traveler segmentation, demographic factors are usually taken as basic classification indicators, such as age, gender, family type, occupation, and income [39]. In addition, environmental factors [29], travel-related factors [41], and various combinations of factors [26] are also used in segmentation research. The choice behavior of tourists is closely related to tourism characteristics, such as motivation [42], tourist group [17], and destination attributes [43]. Therefore, this paper comprehensively considers the combination of individual attributes, tourism attributes, and psychological factors to carry out segmentation research. The latent class model is established by age and other observed variables, the latent variable is determined to obtain the final number of categories, and the characteristics of each segment are summarized and analyzed.
2.2. Structural Equation Model
SEM is a powerful statistical method for determining the relationship between observed variables and latent variables and the inside of the latent variables [44,45]. It can explain the interactions of psychological factors that cannot be directly measured, and has been widely used in research on travel behavior [38]. SEM includes a measurement model and a structural model. The measurement model is used to describe the relationship between observed variables and latent variables, and the structural model is used to describe the internal relationship between latent variables. The measurement model can be expressed by:
The structural equation is written as:
Equation (1) is a measurement model of exogenous variables, where is a vector that contains exogenous observed variables, is a factor loading matrix of in and is an vector that contains exogenous latent variables, and is a vector with errors. Equation (2) is a measurement model of endogenous variables, where is a vector that contains endogenous observed variables, is a factor loading matrix of in and is an vector that contains endogenous latent variables, and is a vector with errors. Equation (3) is a structural model, where is an coefficient matrix that describes the causal influence of endogenous latent variables on one another, is an coefficient matrix that describes the causal influences between exogenous and endogenous latent variables, and is an residual error vector.
2.3. Latent Class Model
LCM is a method that can assign individuals to various classes probabilistically while taking measurement errors into account [25]. It attempts to explain the associations observed between the factors that make up the table by introducing unobservable underlying classes [46]. The most important feature of LCM is that it can deal with the classification data, and use the maximum likelihood method to estimate the parameters, which can calculate the appropriate number of categories more accurately. Moreover, the classification results are relatively stable, which is convenient for practical application [27,31].
Establishing the LCM requires three steps: (1) model construction (probability parameterization), (2) model fitting and parameter estimation, and (3) latent classification and result interpretation [25]. Probability parameterization, the first step, converts the probability of classifying variables into a parameter model. Assuming that there is a latent variable with latent categories that can explain the relationship between the three latent variables , , and , the LCM can be expressed as:
subject to:
where
is the probability of a combination at level in the observed data;
is the probability of being in a latent class of latent variable , that is, ;
is the conditional probability that an observation has response to the manifest variable given that the observation is in latent class ;
is the conditional probability that an observation has response to the manifest variable given that the observation is in latent class ; and
is the conditional probability that an observation has response to the manifest variable given that the observation is in latent class .
Equation (4) represents the joint probability of the LCM and Equation (5) represents that the sum of probabilities of each latent class is 1; in Equation (6), since the different levels of latent variables are independent of each other, the sum of conditional probabilities latent variables is 1. These conditional probabilities can be used to explain the relationship between latent classes and manifest variables, to help researchers explain the content and nature of each latent class [47]. In each latent class, a large conditional probability value indicates that the latent variable has a strong influence on the manifest variable and a large proportion. The probability of the latent class represents the proportion of different categories of latent variable , that is, the population size of each latent class, while the conditional probability is used to explain the attribute characteristics and significance of each latent class. The modeling estimation procedure begins with T = 1 latent class, and continues adding latent classes until a suitable model is detected that has an adequate fit based on several goodness-of-fit criteria.
In LCM, the maximum likelihood (ML) is adopted as the main method to estimate model parameters, and the expectation–maximization (EM) algorithm is mainly used in the iterative process. The main methods of testing fitting results are likelihood ratio chi-square statistic test (), Pearson test (), Akaike information criterion (AIC), Bayesian information criterion (BIC), and entropy value [47,48].
After the optimal latent model is determined and the parameters are estimated, each piece of observation data should be classified into the appropriate latent class, that is, latent cluster analysis. According to Bayesian theory, the posterior probability of classifying observed data to latent classes is calculated according to Equations (7) and (8). The category of maximum posterior probability corresponding to each piece of observation data is regarded as the potential category, and the posterior probability of all observed data is calculated and compared, so that the clustering purpose is realized. After clustering, the classification accuracy is verified according to Equations (9) and (10) [49,50].
where is the posterior probability that the observation data is classified into latent class t and is the probability that the observation data is assigned to latent class t.
The first verification index is the percentage of correct classification, and the formula is
The second formula for calculating the verification index is:
where is the proportion of errors caused by classifying all observed data into the category with the maximum probability of latent classes, is the maximum latent class probability in T categories, and is the proportion of errors caused by assigning all observed data to the latent class with the maximum posterior probability. Experience shows that if is above 0.6, the correlation is high and the classification effect is better [49].
3. Data
3.1. Sample
In this paper, an online questionnaire survey was used for investigation through SO JUMP (It is a professional online questionnaire platform in China) in January 2019. The participants were randomly recruited via a link to the questionnaire of SO JUMP. According to the statistics of IP information of respondents, it is found that the recruiters come from 27 provinces in China (33 in total). The survey mainly focused on travelers with domestic tourism experiences during holidays in China. There was a total of 523 questionnaires. The valid number for this study was 484 (92.5% efficiency), excluding participants whose surveys were incomplete. The survey was composed of three parts: the first part covered social and economic statistics of tourists; the second part covered travel information of the most recent holiday travel (Revealed preference Data), such as tourism motivation, tourist group (It means the number of traveling companions), travel mode, etc., and the third part covered the TPB variables of the participants: attitude, subjective norm, perceived behavior control, and intention.
Table 1 summarizes the main characteristics of valid samples (N = 484). Basic information and socio-economic attributes of the surveyed tourists included gender, age, marital status, monthly income, education, occupation, family population, and tour time. Among them, there were slightly more male than female respondents, accounting for 52.82%. They were mainly young and middle-aged people 24 to 44 years of age, accounting for 86.57%. Enterprise employees, students, administrative institution employees, and teachers accounted for a large proportion of occupations. The majority of respondents had middle or low income.
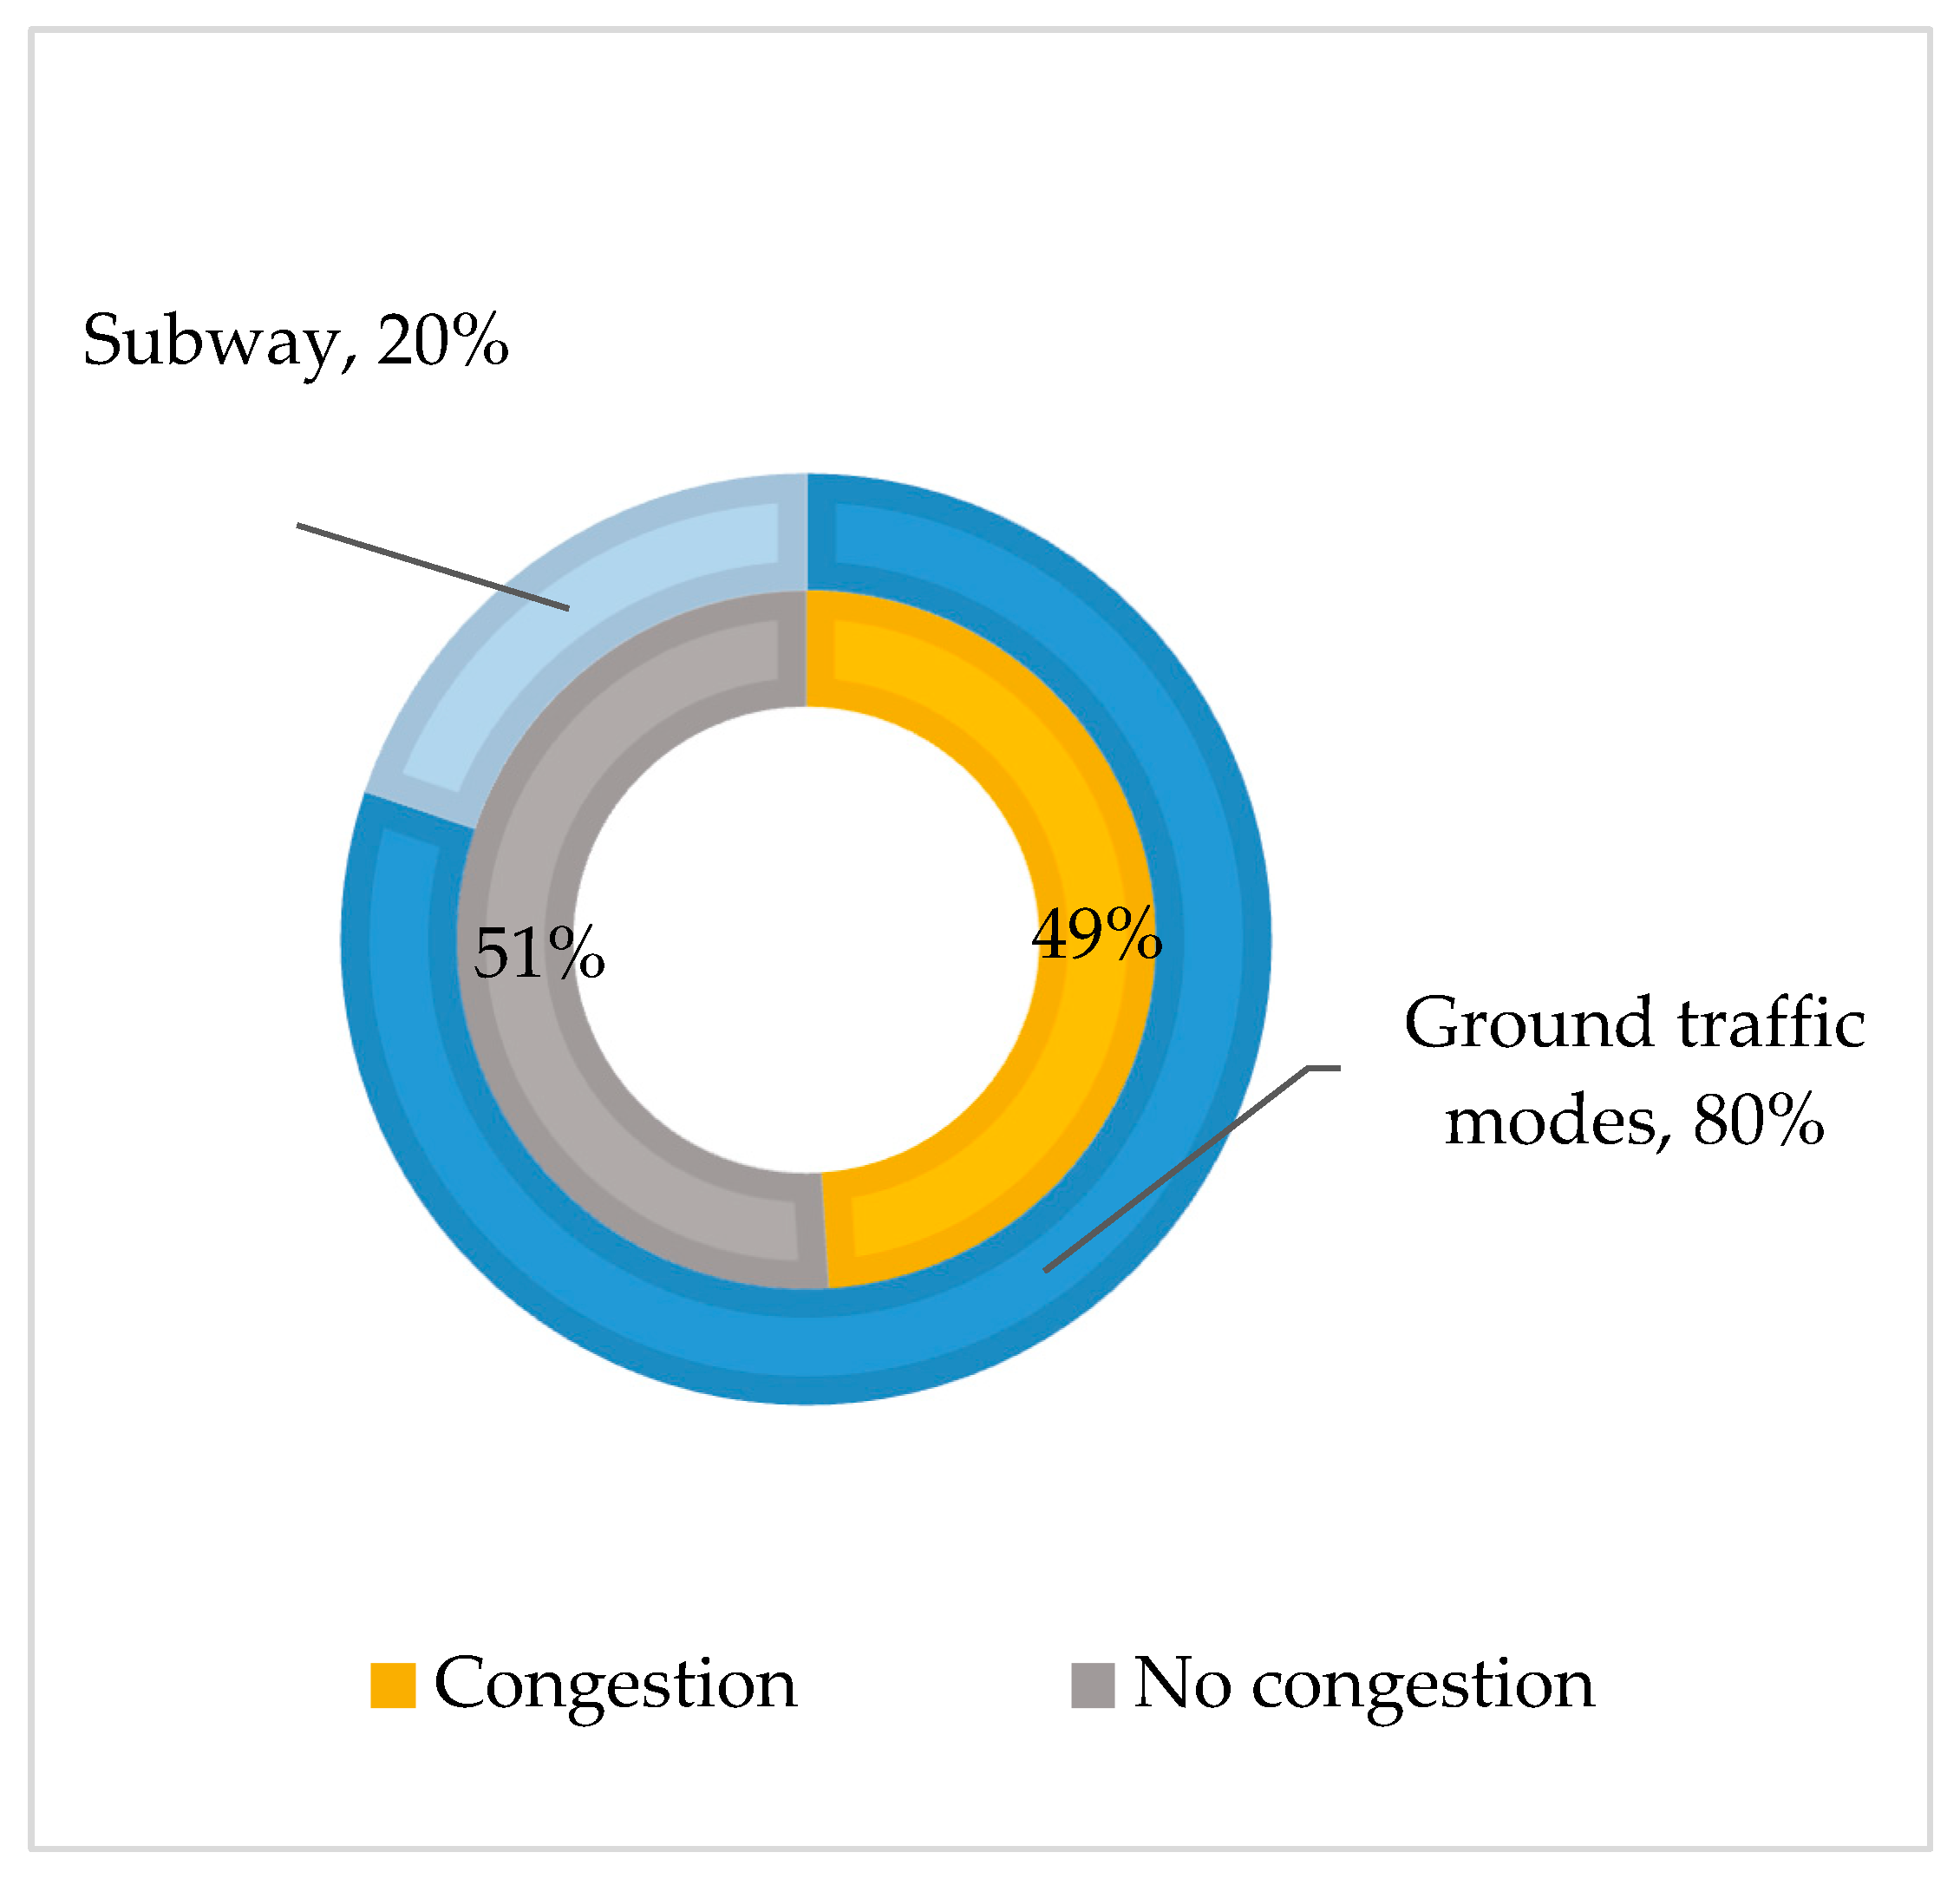
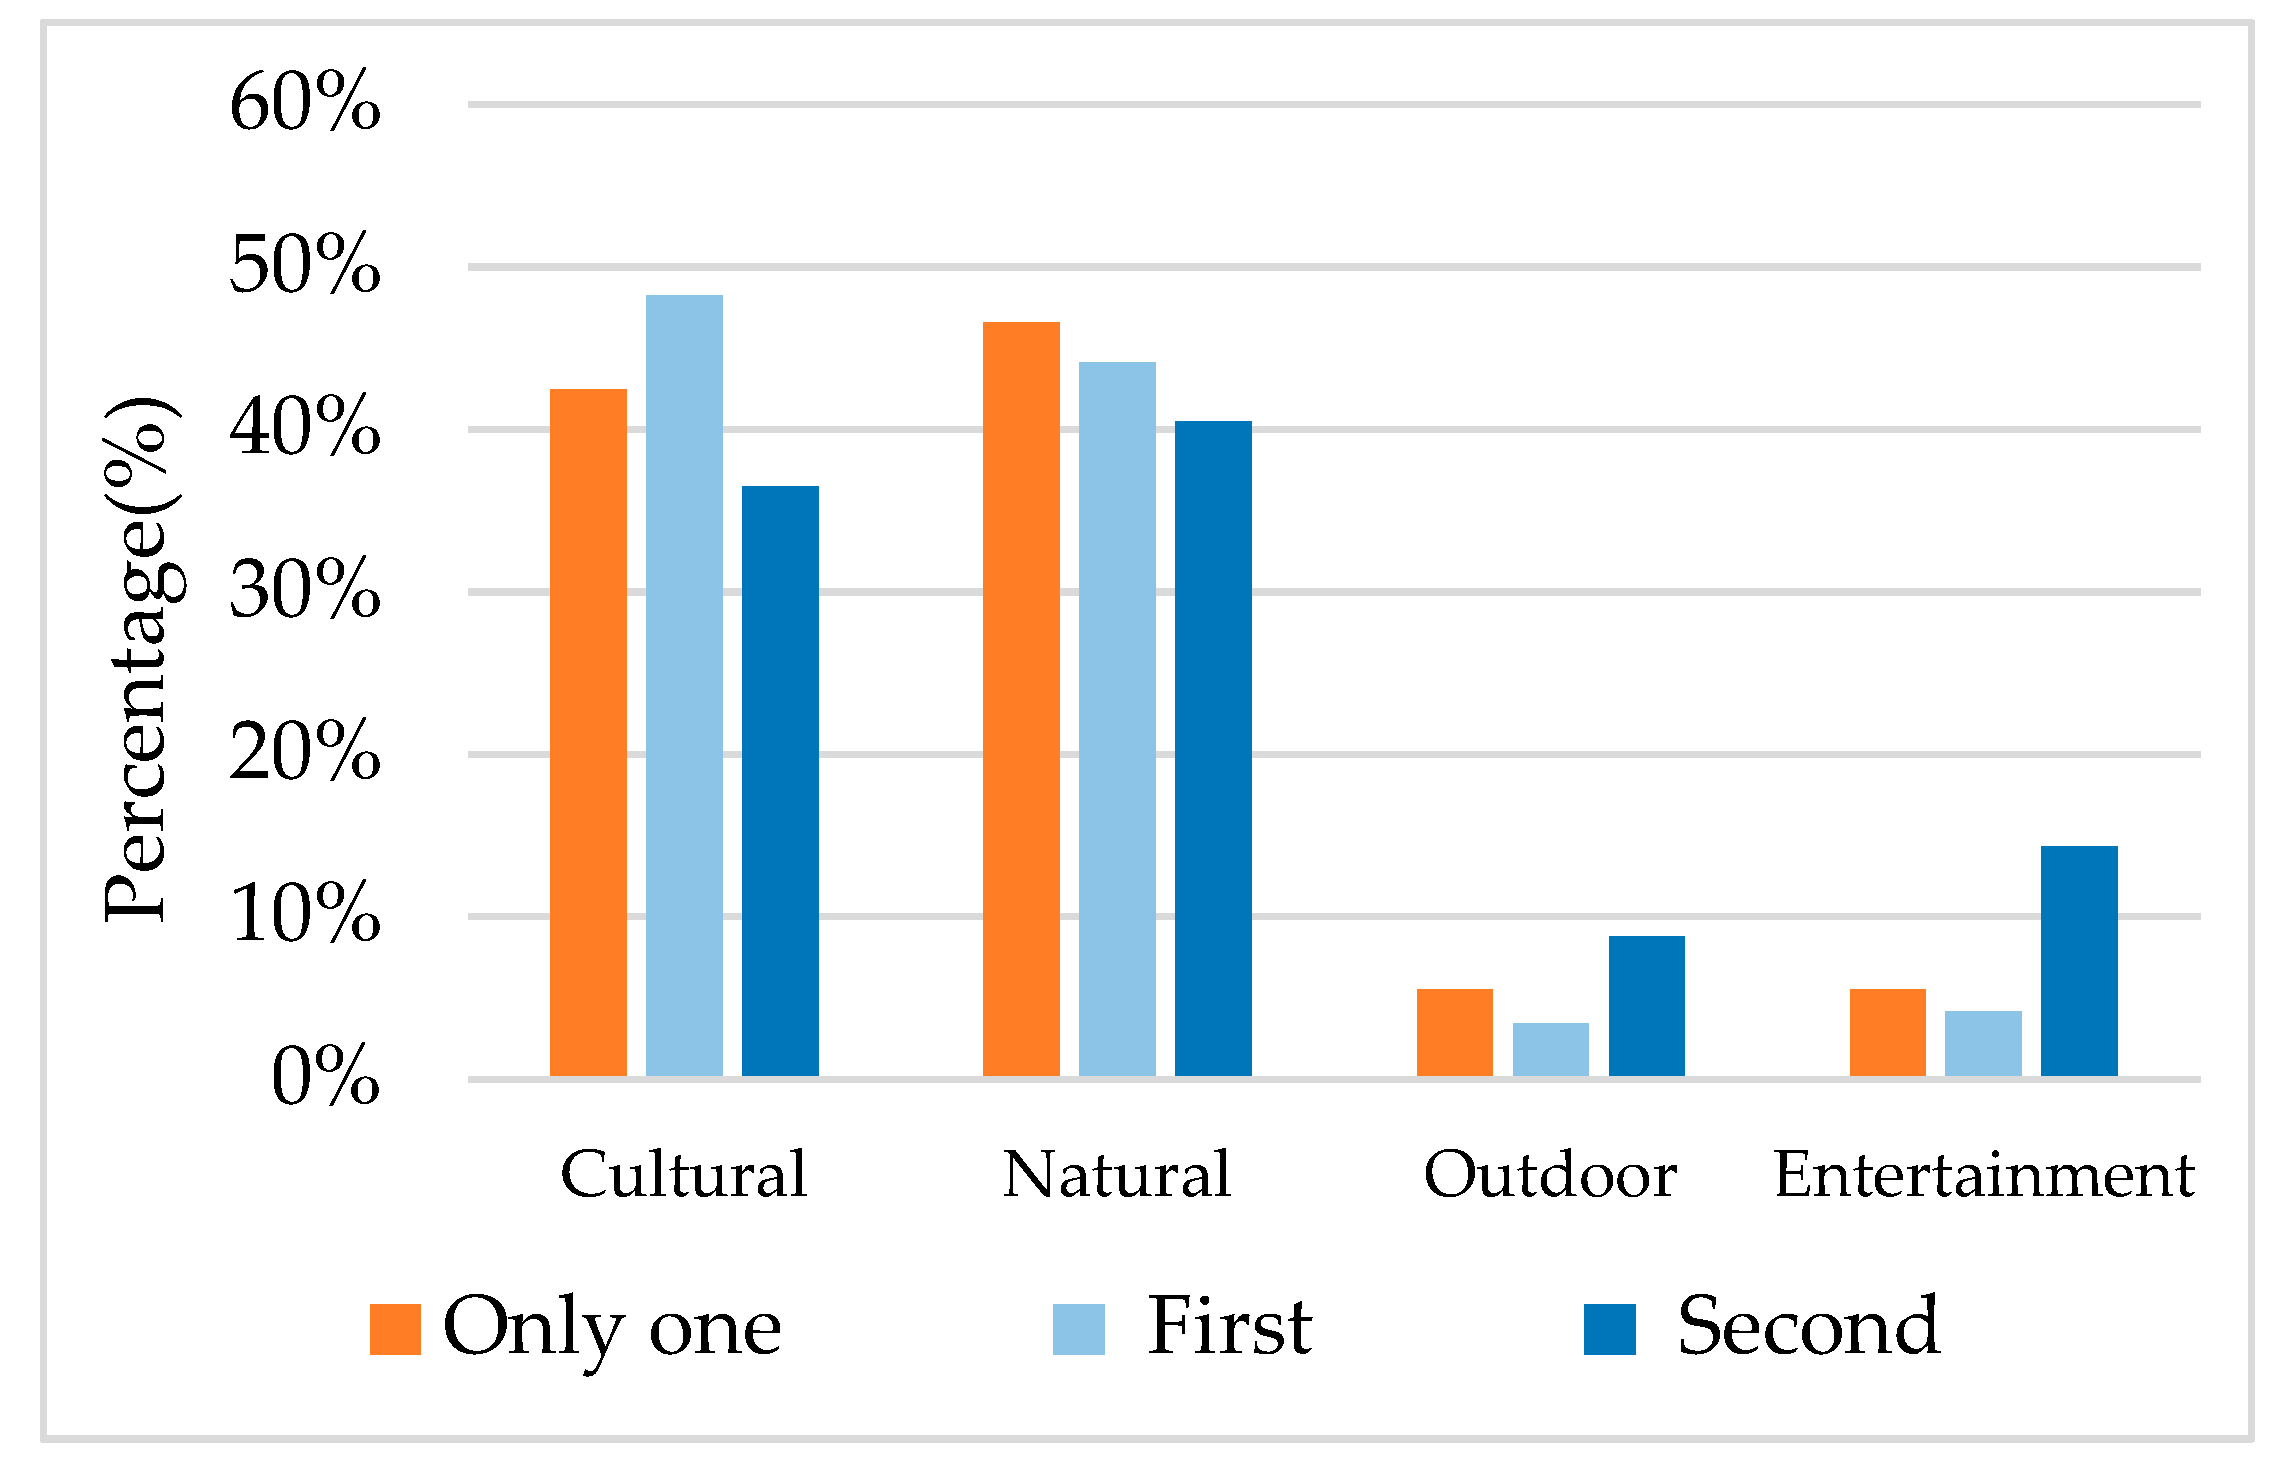
The analysis of tourists’ travel information during the latest holiday is shown in Figure 2 and Figure 3. The results show that 49% of the tourists who use the ground traffic modes (including cars, taxis, tour buses and buses, not including subways) have experienced road congestion. In this paper, tourist destinations are classified into 4 types: cultural attractions (include historical sites, archaeological sites, architecture, cuisine, monuments, museums, etc.), natural attractions (include landscape, parks, mountains, flora, fauna, beach, etc.), outdoor attractions (include various sports including golf, swimming, tennis, hiking, snow sports, etc.) and entertainment attractions (include theme parks, amusement parks, performing arts centers, shopping centers, etc.) [51]. Among them, there are 145(29.96%) tourists who visited only one tourist destination, in which 50.34% of the tourists felt crowded. The remaining 339(70.04%) tourists visited two destinations, and 42.77% of them encountered congestion in the first destination and 37.17% encountered congestion in the second destination. Tourists experience a high proportion of congestion in cultural and natural tourist destinations, as these two types of tourist attractions are preferred by tourists on holidays.
We measured all psychological constructs (TPB variables) with a five-point Likert scale (1 = strongly disagree; 5 = strongly agree). The higher the score, the higher the degree of agreement. The psychological variables were measured as follows:
The variable “attitude toward holiday rush-hour avoidance travel (HRAT)” was measured by the following three items with the statement, “For me, holiday rush-hour avoidance travel would …”: Y1: improve the tourism experience; Y2: avoid travel congestion; Y3: reduce the loss of time.
Subjective norm were measured by the following four items: Y4: “Most people around me will choose HRAT”; Y5: “Advice and support from family members will affect my choice of HRAT”; Y6: “Suggestions from friends/classmates/colleagues will affect my choice of HRAT”; Y7: “The propaganda of the news media on HRAT will affect my choice.”
Perceived behavior control was measured by the following six items: Y8: “The limited time restricts my HRAT”; Y9: “Accurate and complete information would guide me to choose HRAT”; Y10: “Preferential tickets for scenic spots would attract me to choose HRAT”; Y11: “Preferential travel costs would attract me to choose HRAT”; Y12: “Convenient transportation facilities would attract me to choose HRAT”; Y13: “Experience is very useful for me to choose HRAT”.
The intention to choose HRAT was measured by the following three items: Z1: “I am willing to try HRAT in the future”; Z2: “I am willing to give priority to HRAT in the future”; Z3: “I am willing to recommend HRAT to friends and relatives.”
3.2. Data Analysis
Kaiser-Meyer-Olkin (KMO) and Bartlett’s spherical tests were performed on the scale with SPSS 23.0 software. According to the results, KMO = 0.896 (greater than 0.7) and Bartlett’s spherical test value were significant (<0.001). The results show that the questionnaire data met the requirement of factor analysis. The Cronbach’s α coefficient of each index was calculated, and the results are shown in Table 2. According to Table 2, Cronbach’s α coefficients of ATT, SN, PBC, and BI are all higher than the standard of 0.7. This indicates that the variables have good internal consistency, and the survey data are reliable [38].
4. Result Analysis
4.1. Analysis of SEM Estimation Results
Based on the effective full sample survey data, the complete structural equation model was established with Amos 24.0. Common goodness-of-fit measures for SEM are as shown in Table 3. Among the fitting indicators of the model, the CMIN/DF value is 1.723 (CMIN = 194.685, DF = 113). As a general rule, the value of RMSEA and RMR for a good fit should be less than 0.05, while values of GFI, AGFI, NFI, TLI, IFI and CFI greater than 0.90 are usually interpreted as indicating an acceptable fit [45]. From the results, it can be seen that all of the model fitting indices are within the recommended data range and the model has good fit.
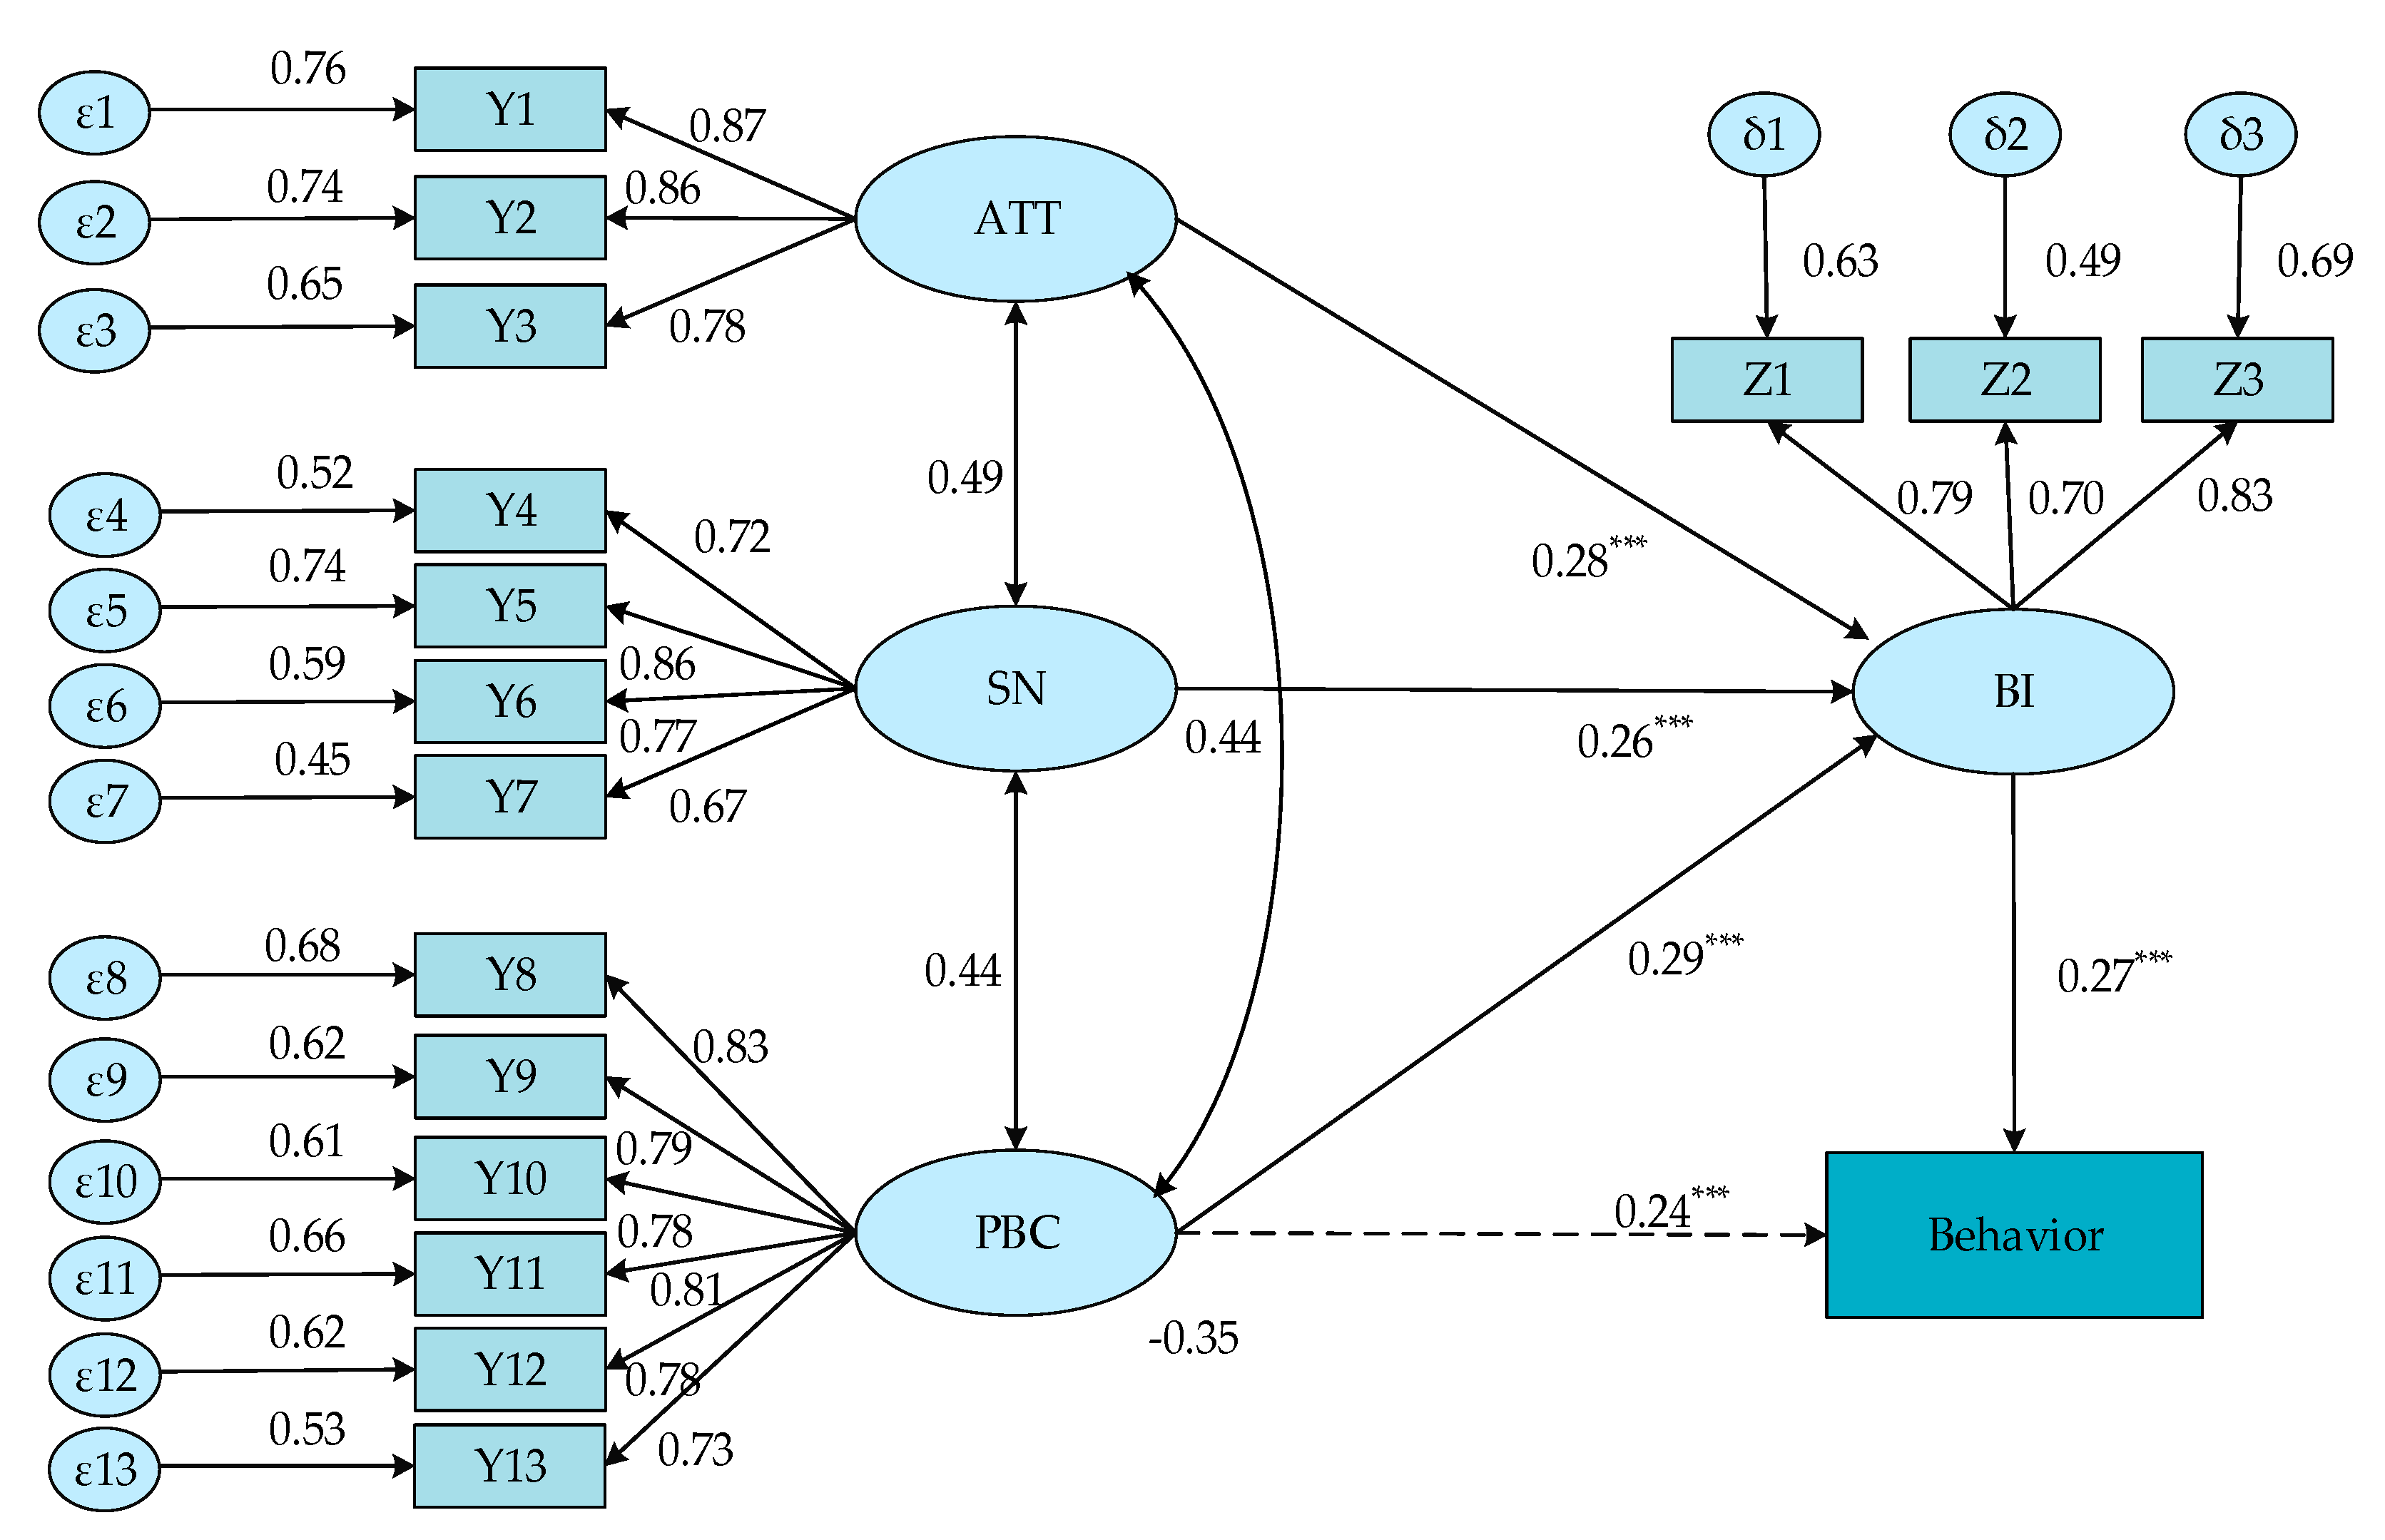
The standardized load factor value (denoted as β) of SEM output is listed in Figure 2. From the load factor value, H1 (β = 0.28, p < 0.001), H2 (β = 0.26, p < 0.001), and H3 (β = 0.29, p < 0.001) were all positive and significant for HRAT intention. The result supports these three hypotheses and indicates that HRAT intention is influenced by attitude, subjective norm, and perceived behavior control. It is shown that perceived behavior control is the most important factor in holiday rush-hour avoidance travel behavior (HRATB), which is mainly due to the constraints involved in tourism. In addition, H4 (β = 0.24, p < 0.001) and H5 (β = 0.27, p < 0.001) were positive and significant for HRATB. This shows that behavior intention has a stronger effect on HRATB than perceived behavior control. Therefore, H1, H2, H3, H4, and H5 are all valid.
As shown in Figure 4, the attitude of improving the tourism experience (Y1) has the greatest influence (β = 0.87), with a standardized coefficient of 0.87. This shows that the higher the level of evaluation of positive direction of HRAT, the more likely it will be chosen. Among the observed variables of subjective norm, family (Y5) plays the most important role (β = 0.86), while social media (Y7) plays a relatively small role (β = 0.67), and the standardization coefficients are 0.86 and 0.67, respectively. This shows that tourists pay more attention to the opinions of important people around them when choosing HRAT. However, news media is the main source of information for holiday travel, and it is particularly important to explore the acceptance of news media. In observed variables of perceived behavior control, generous time (Y8) has the greatest impact (β = 0.82), followed by preferential travel costs (Y11; β = 0.81). In addition, accurate and perfect information guidance (Y9; β = 0.79), preferential tickets for scenic spots (Y10; β = 0.78), and convenient transportation facilities (Y12; β = 0.77) also have a strong impact, while the experience of HRAT (Y13; β = 0.73) has the weakest impact. From the results, HRAT is mainly restricted by time, while cost, information, and convenient transportation are attractive to tourists. With regard to HRATB intention, tourists are more likely to try rush-hour avoidance travel (Z1; β = 0.63) and recommend it to relatives and friends (Z3; β = 0.69), while the choice of giving priority (Z2; β = 0.49) is relatively weak.
4.2. Analysis of LCM Segmentation Results
In this study, six factors were selected for tourist segmentation for HRATB by cross-analysis and comparison. These factors are age, monthly income, tourist group, attitude toward improving the tourism experience (Y1), subjective normative role of news media (Y7), and attraction of preferential travel cost (Y11). Mplus 7.4 software was used for LCM model fitting and parameter estimation. The fitting results of the LCM model are shown in Table 4. As a general rule, the value of entropy is more than 0.8, while smaller , , Akaike information criterion(AIC), and Bayesian information criterion(BIC) should be better, indicating that the model has a good segmentation effect [47]. Therefore, considering these five indices, it can be determined that classification accuracy is best when the number of latent classes .
The respondents were modeled according to the latent classes, and the model parameters were estimated. The results are shown in Table 5. From the results, the probability of the four latent categories is 0.295, 0.339, 0.162, and 0.204, respectively. According to the results in Table 4, the whole sample dataset is clustered, and the actual proportion of tourists after classification is 0.293, 0.335, 0.161, and 0.211, respectively, which is very close to the clustering proportion of the established latent class model. Finally, the classification accuracy of the model is and . The results show that the classification accuracy is high and the classification result is reasonable [49].
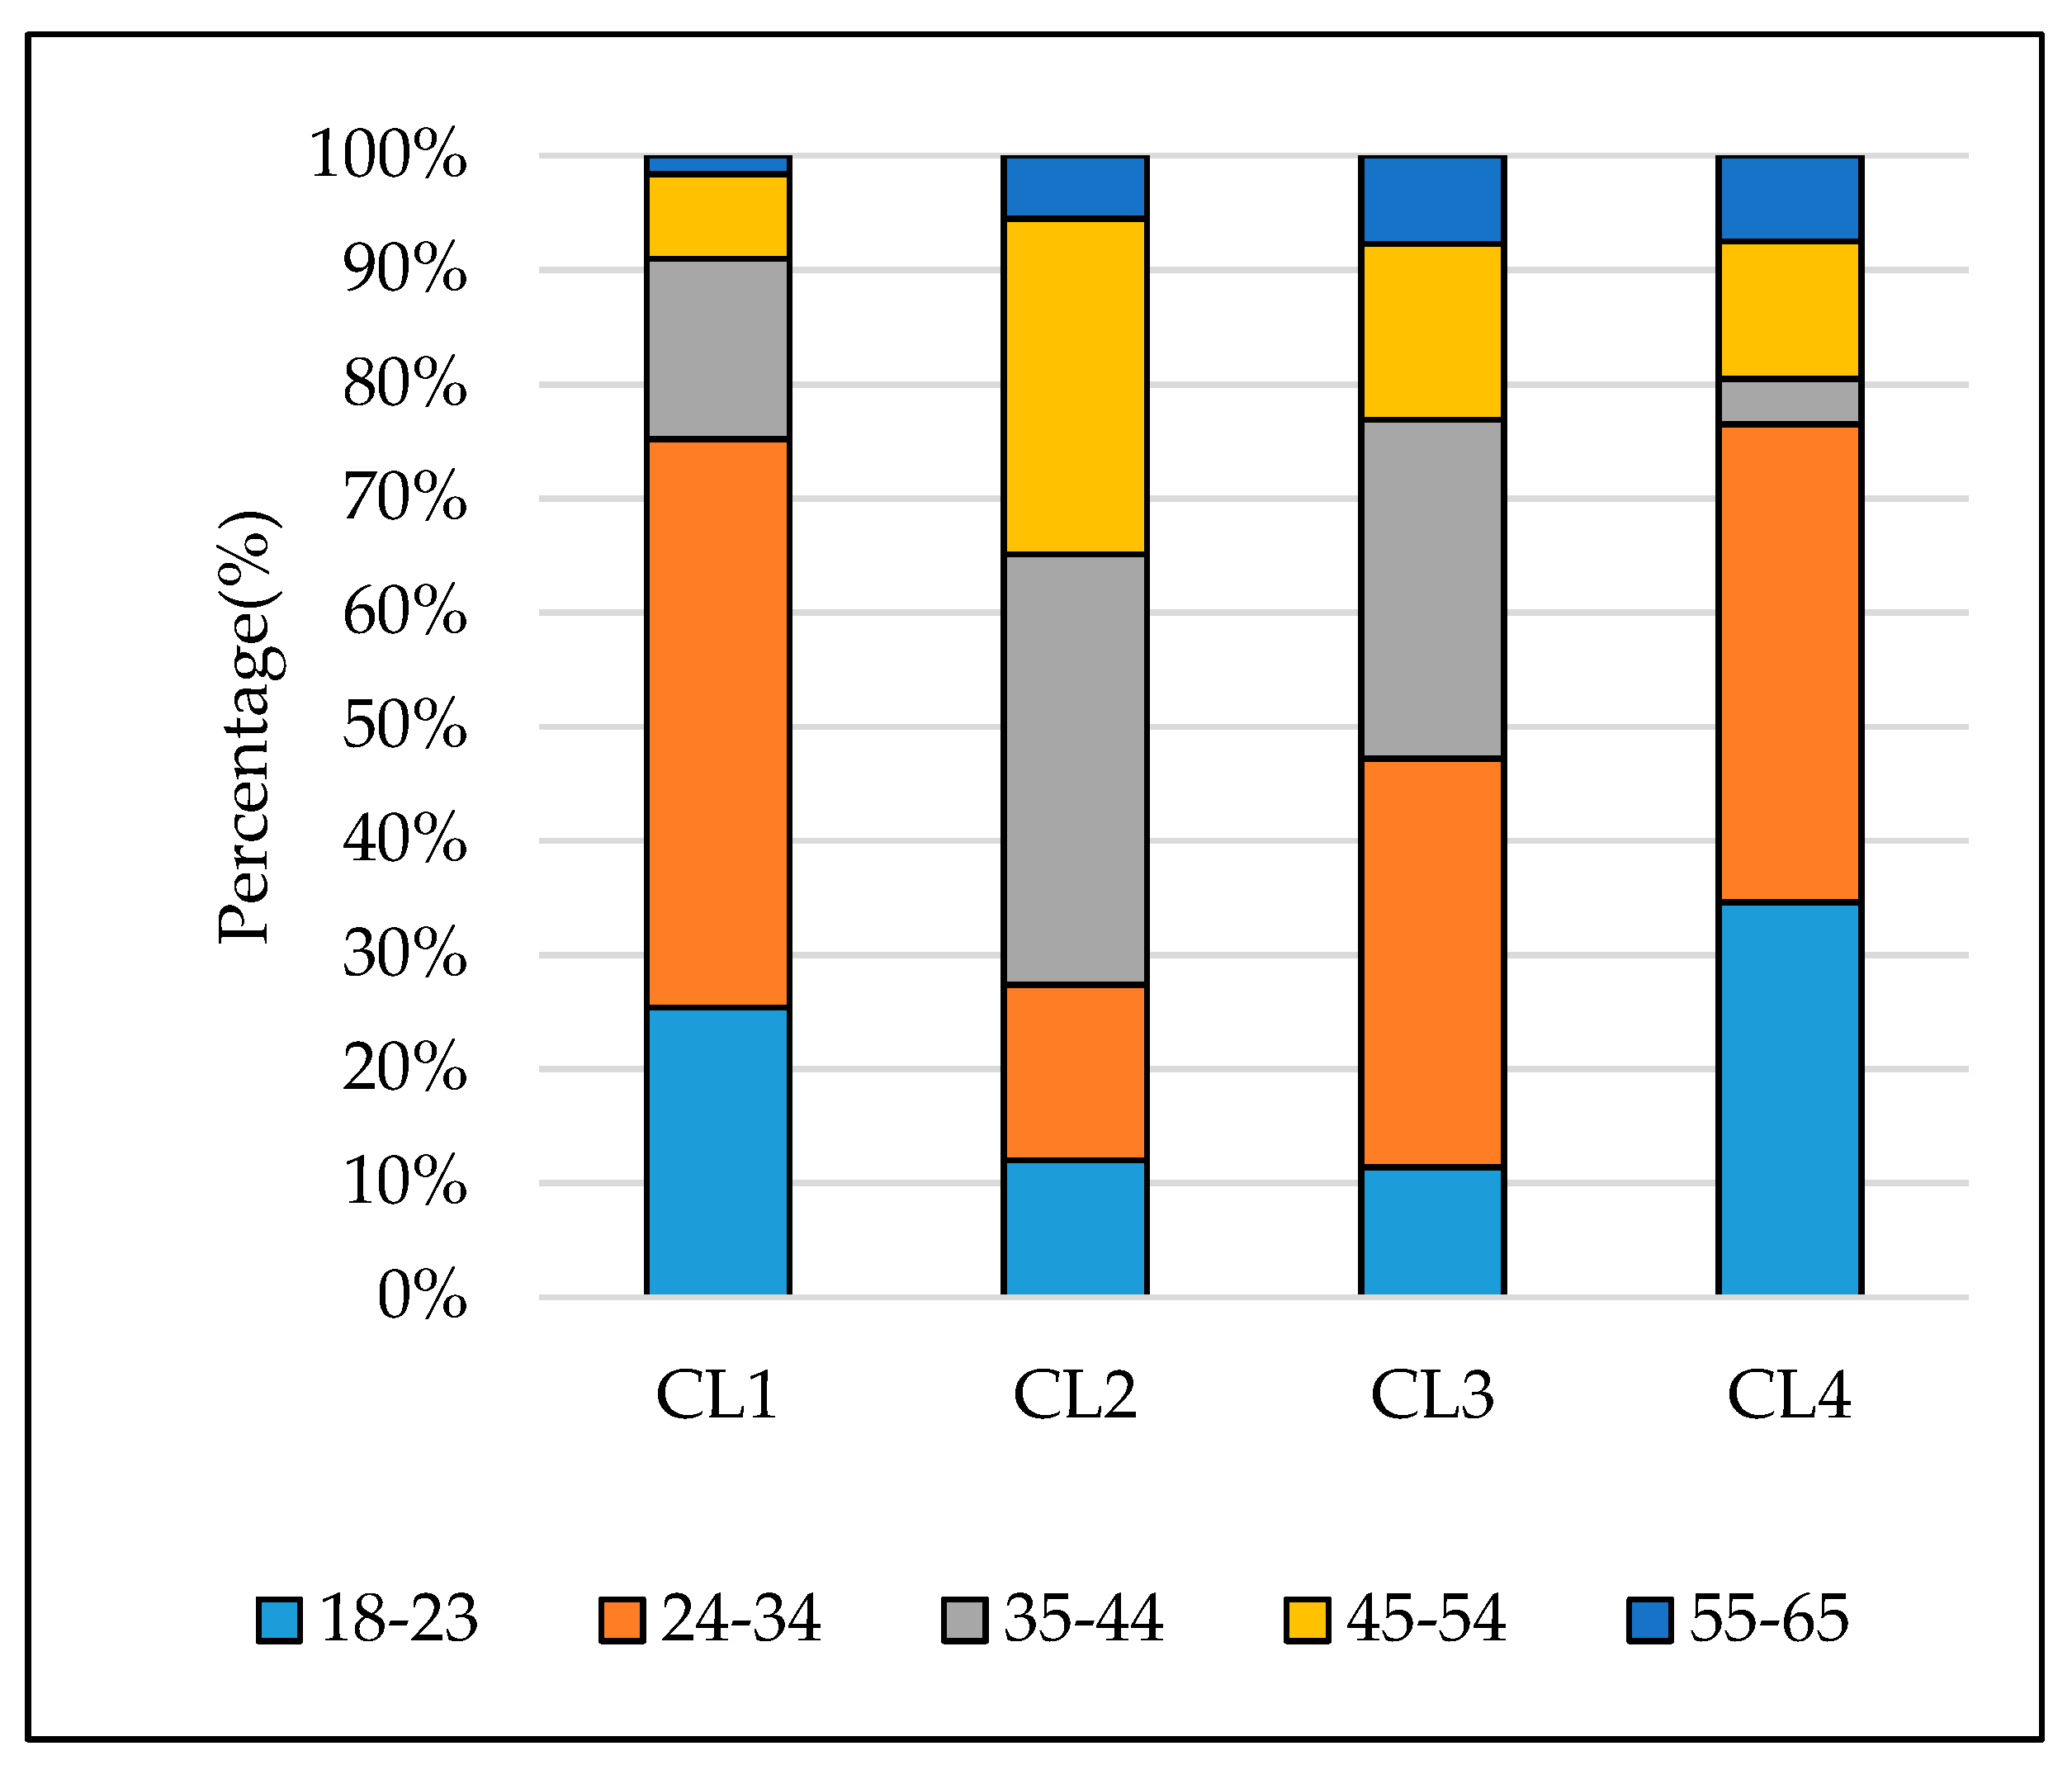
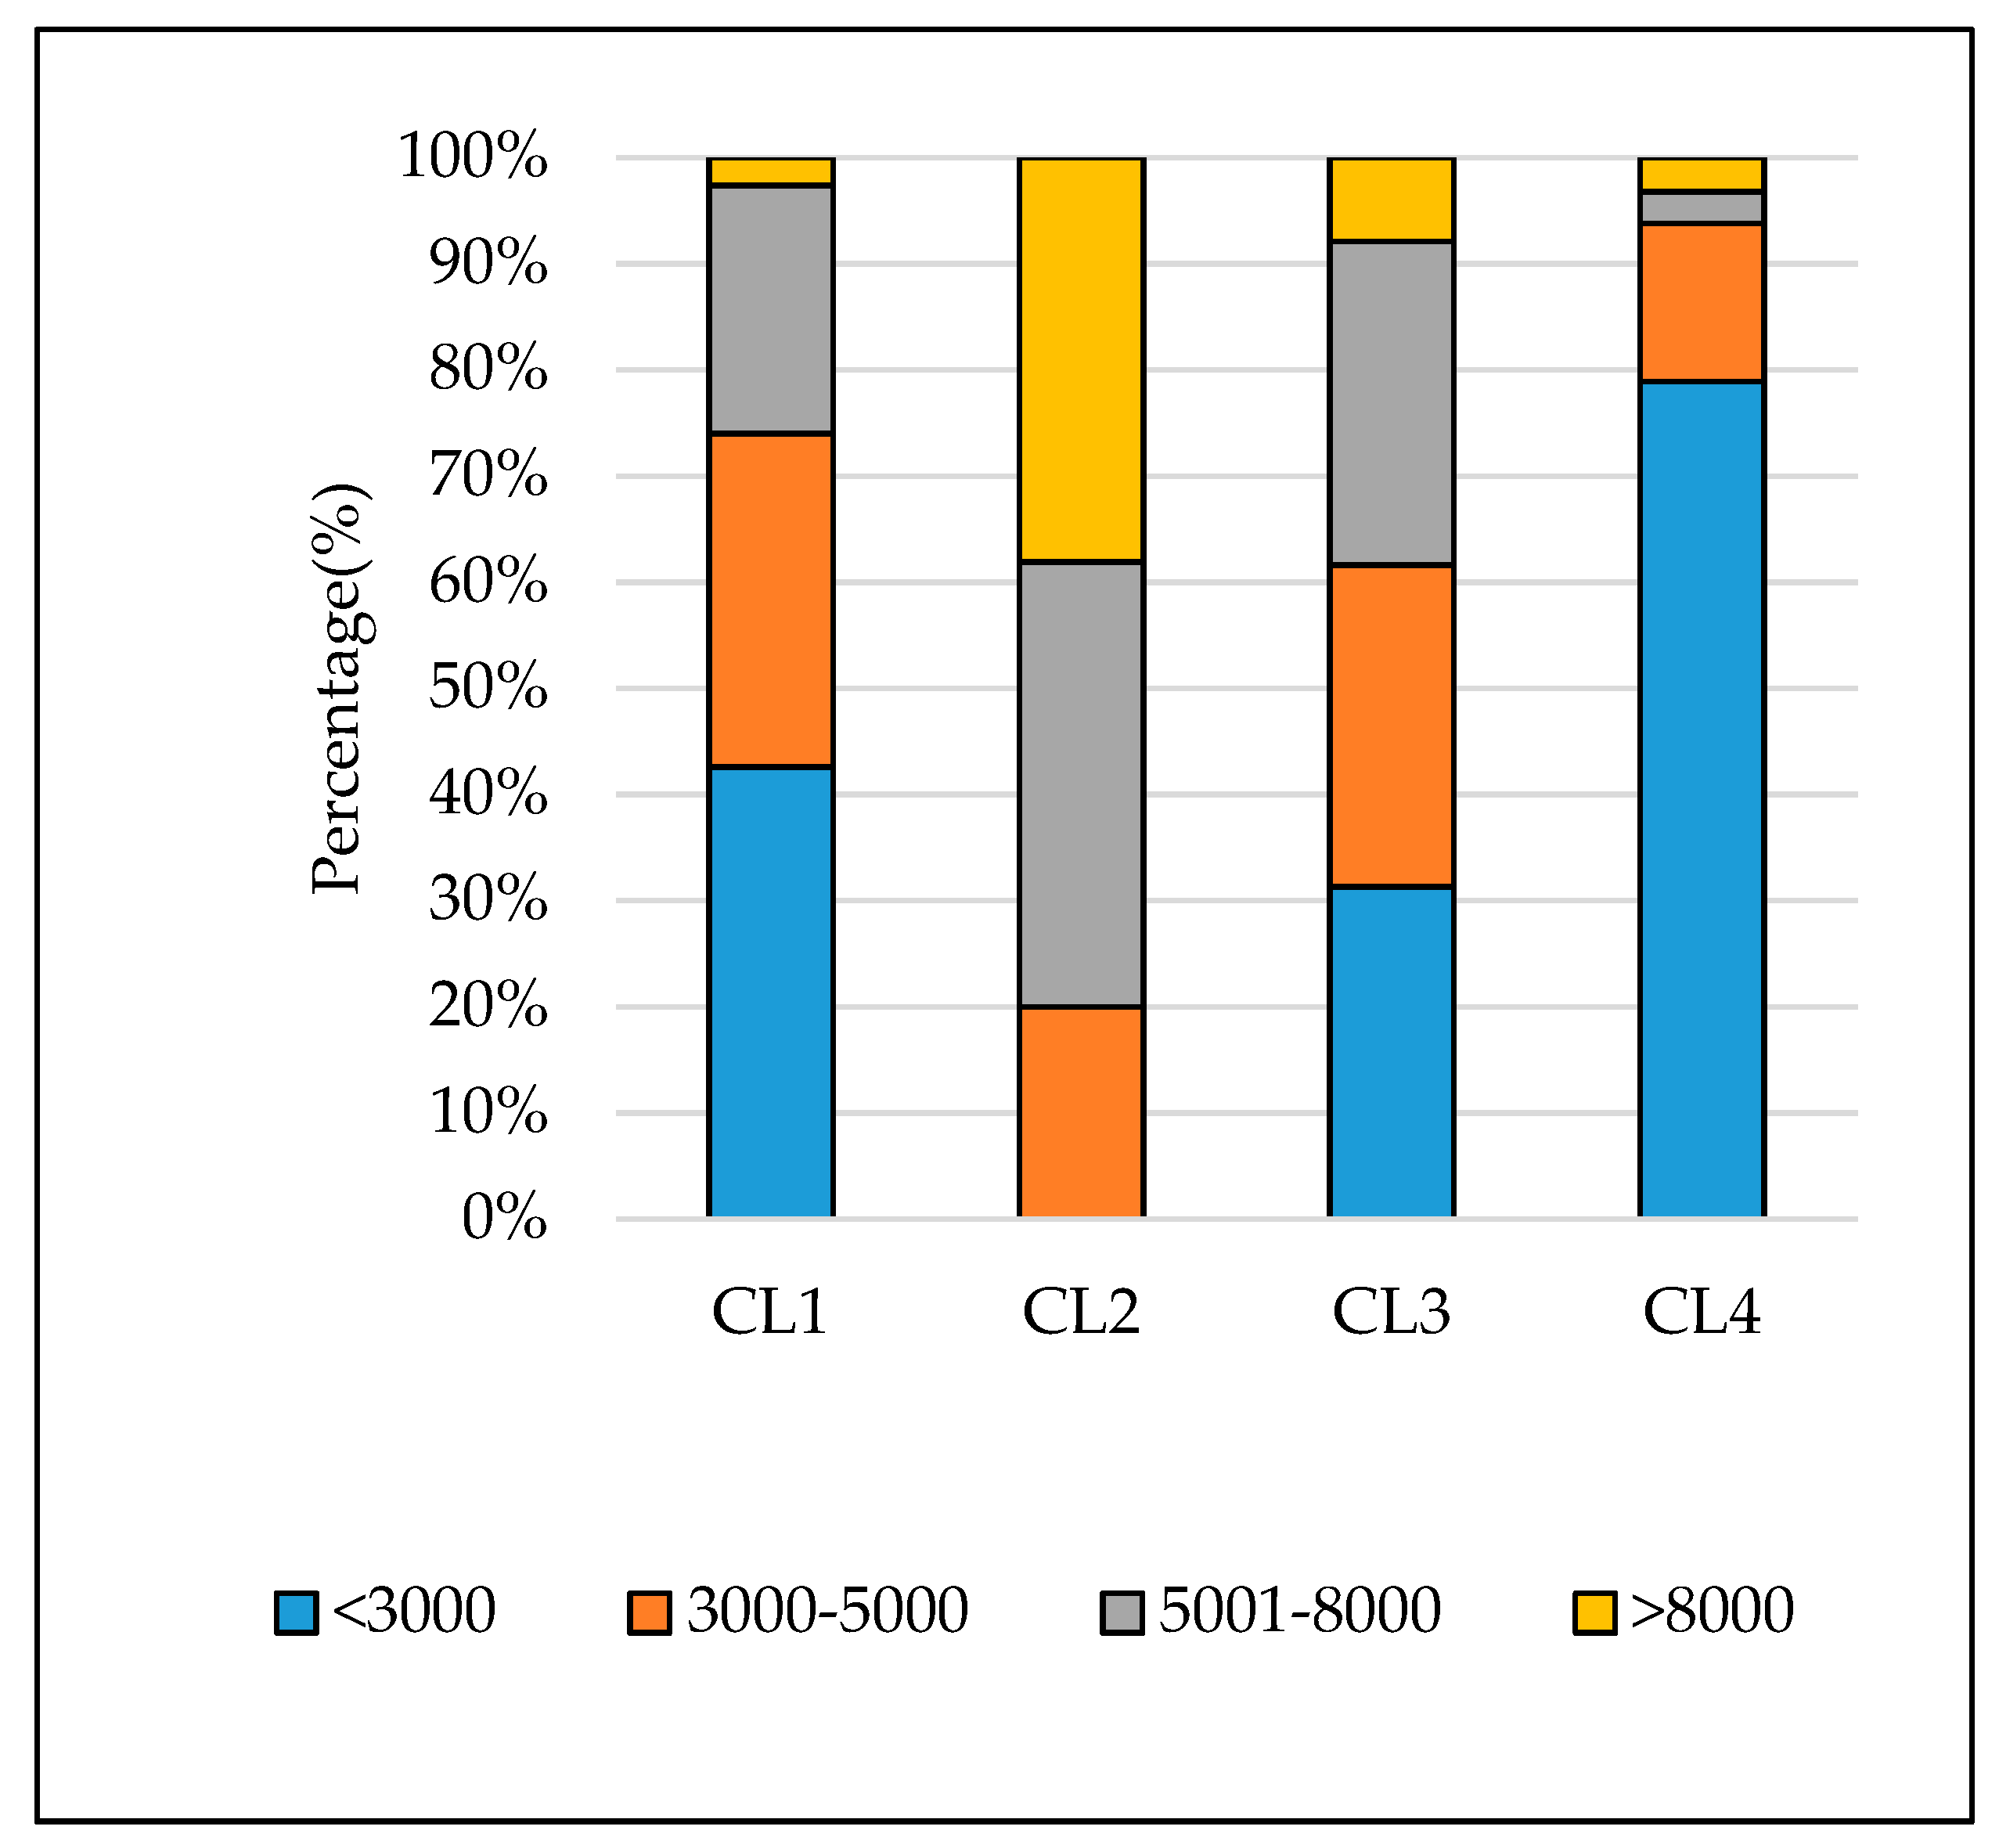
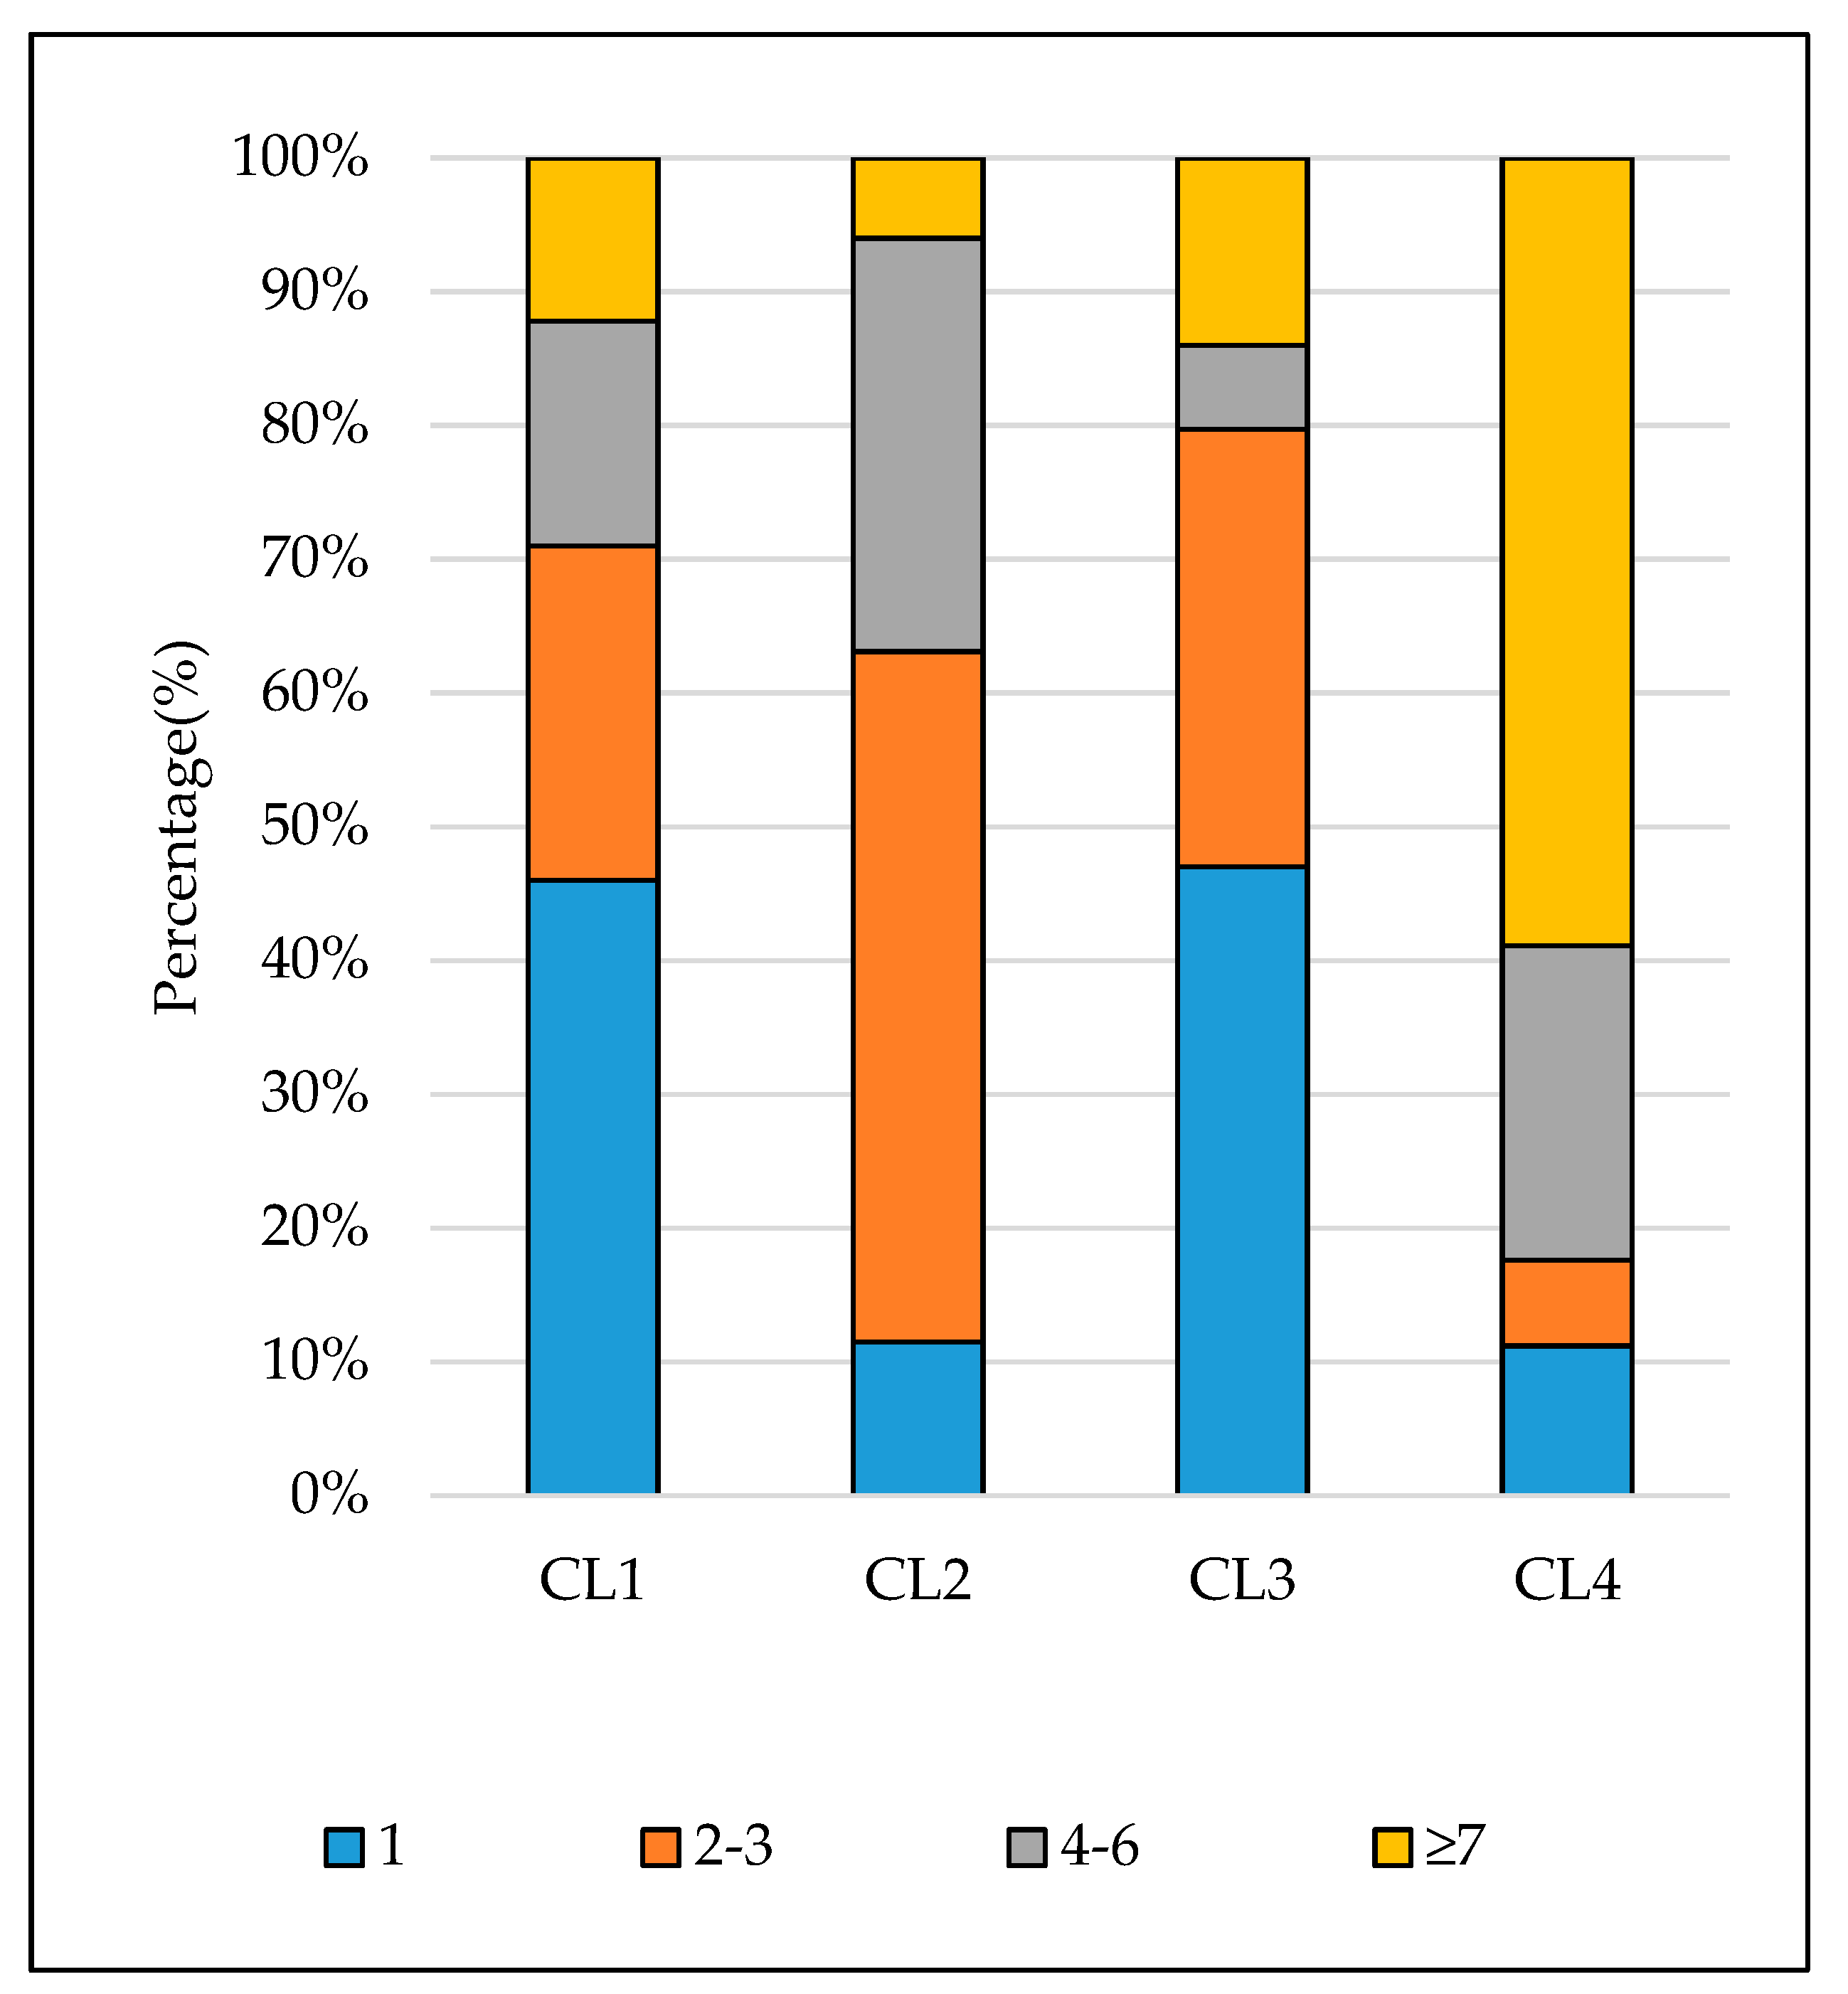
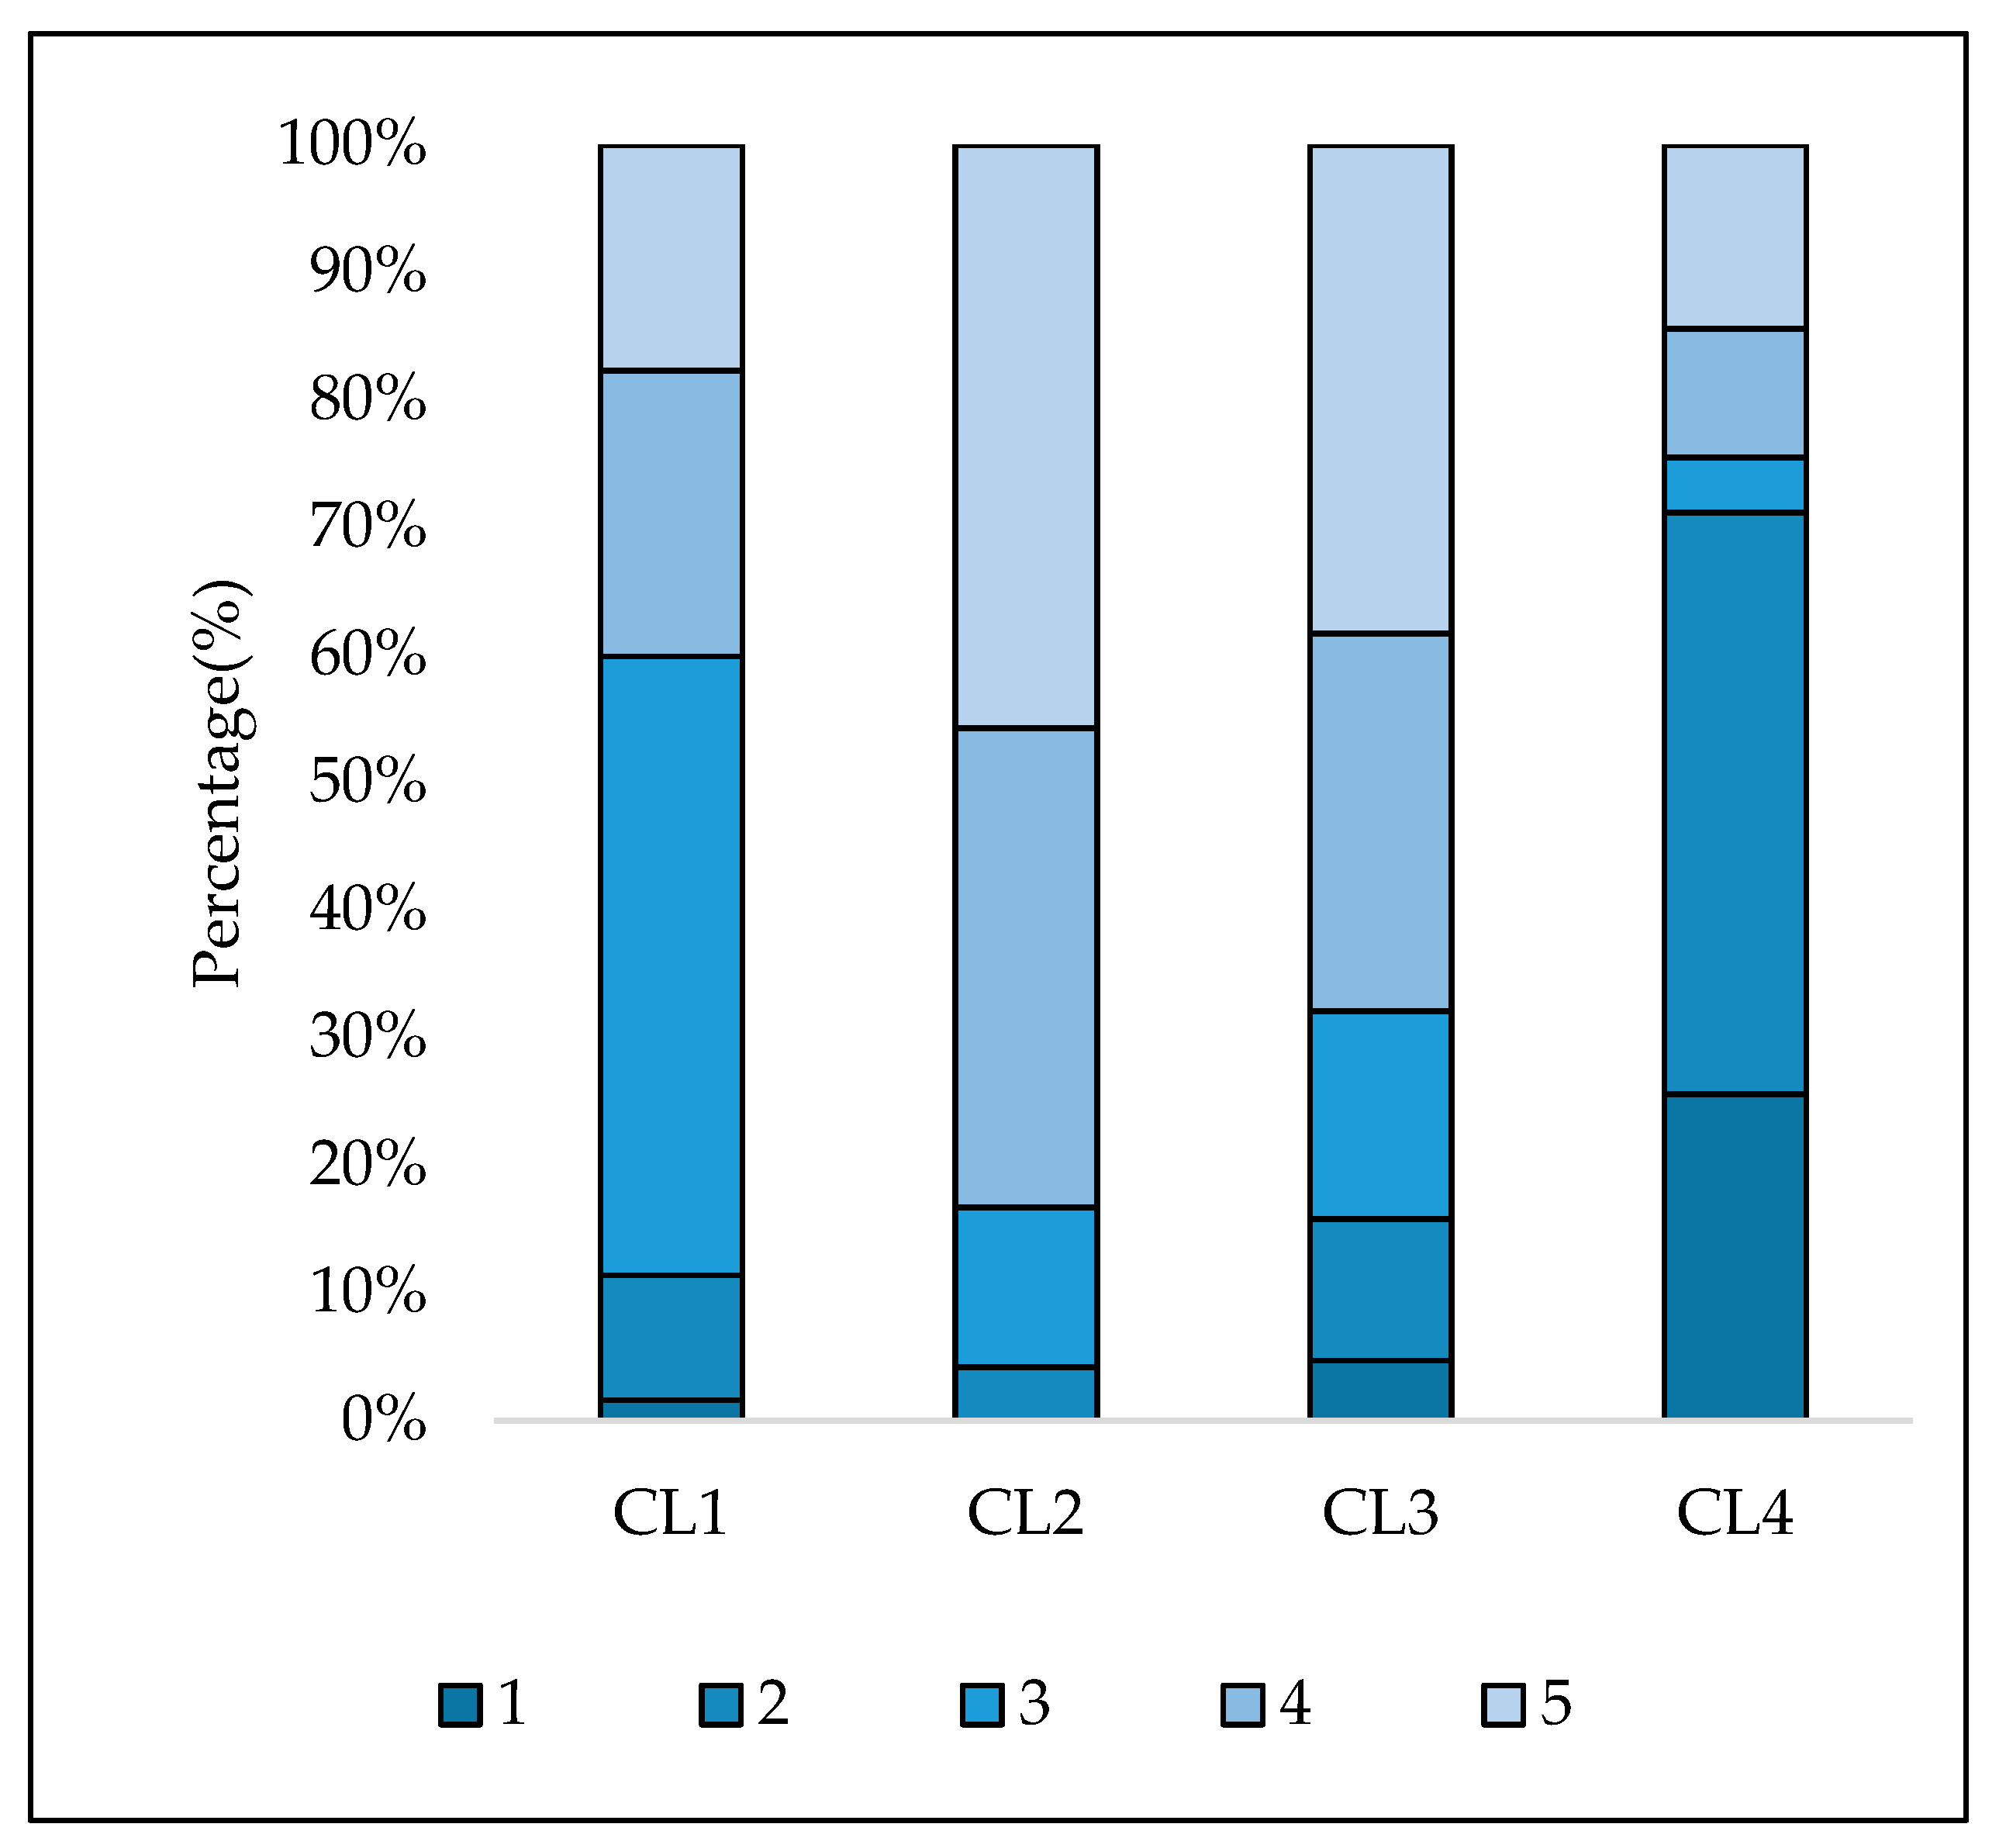
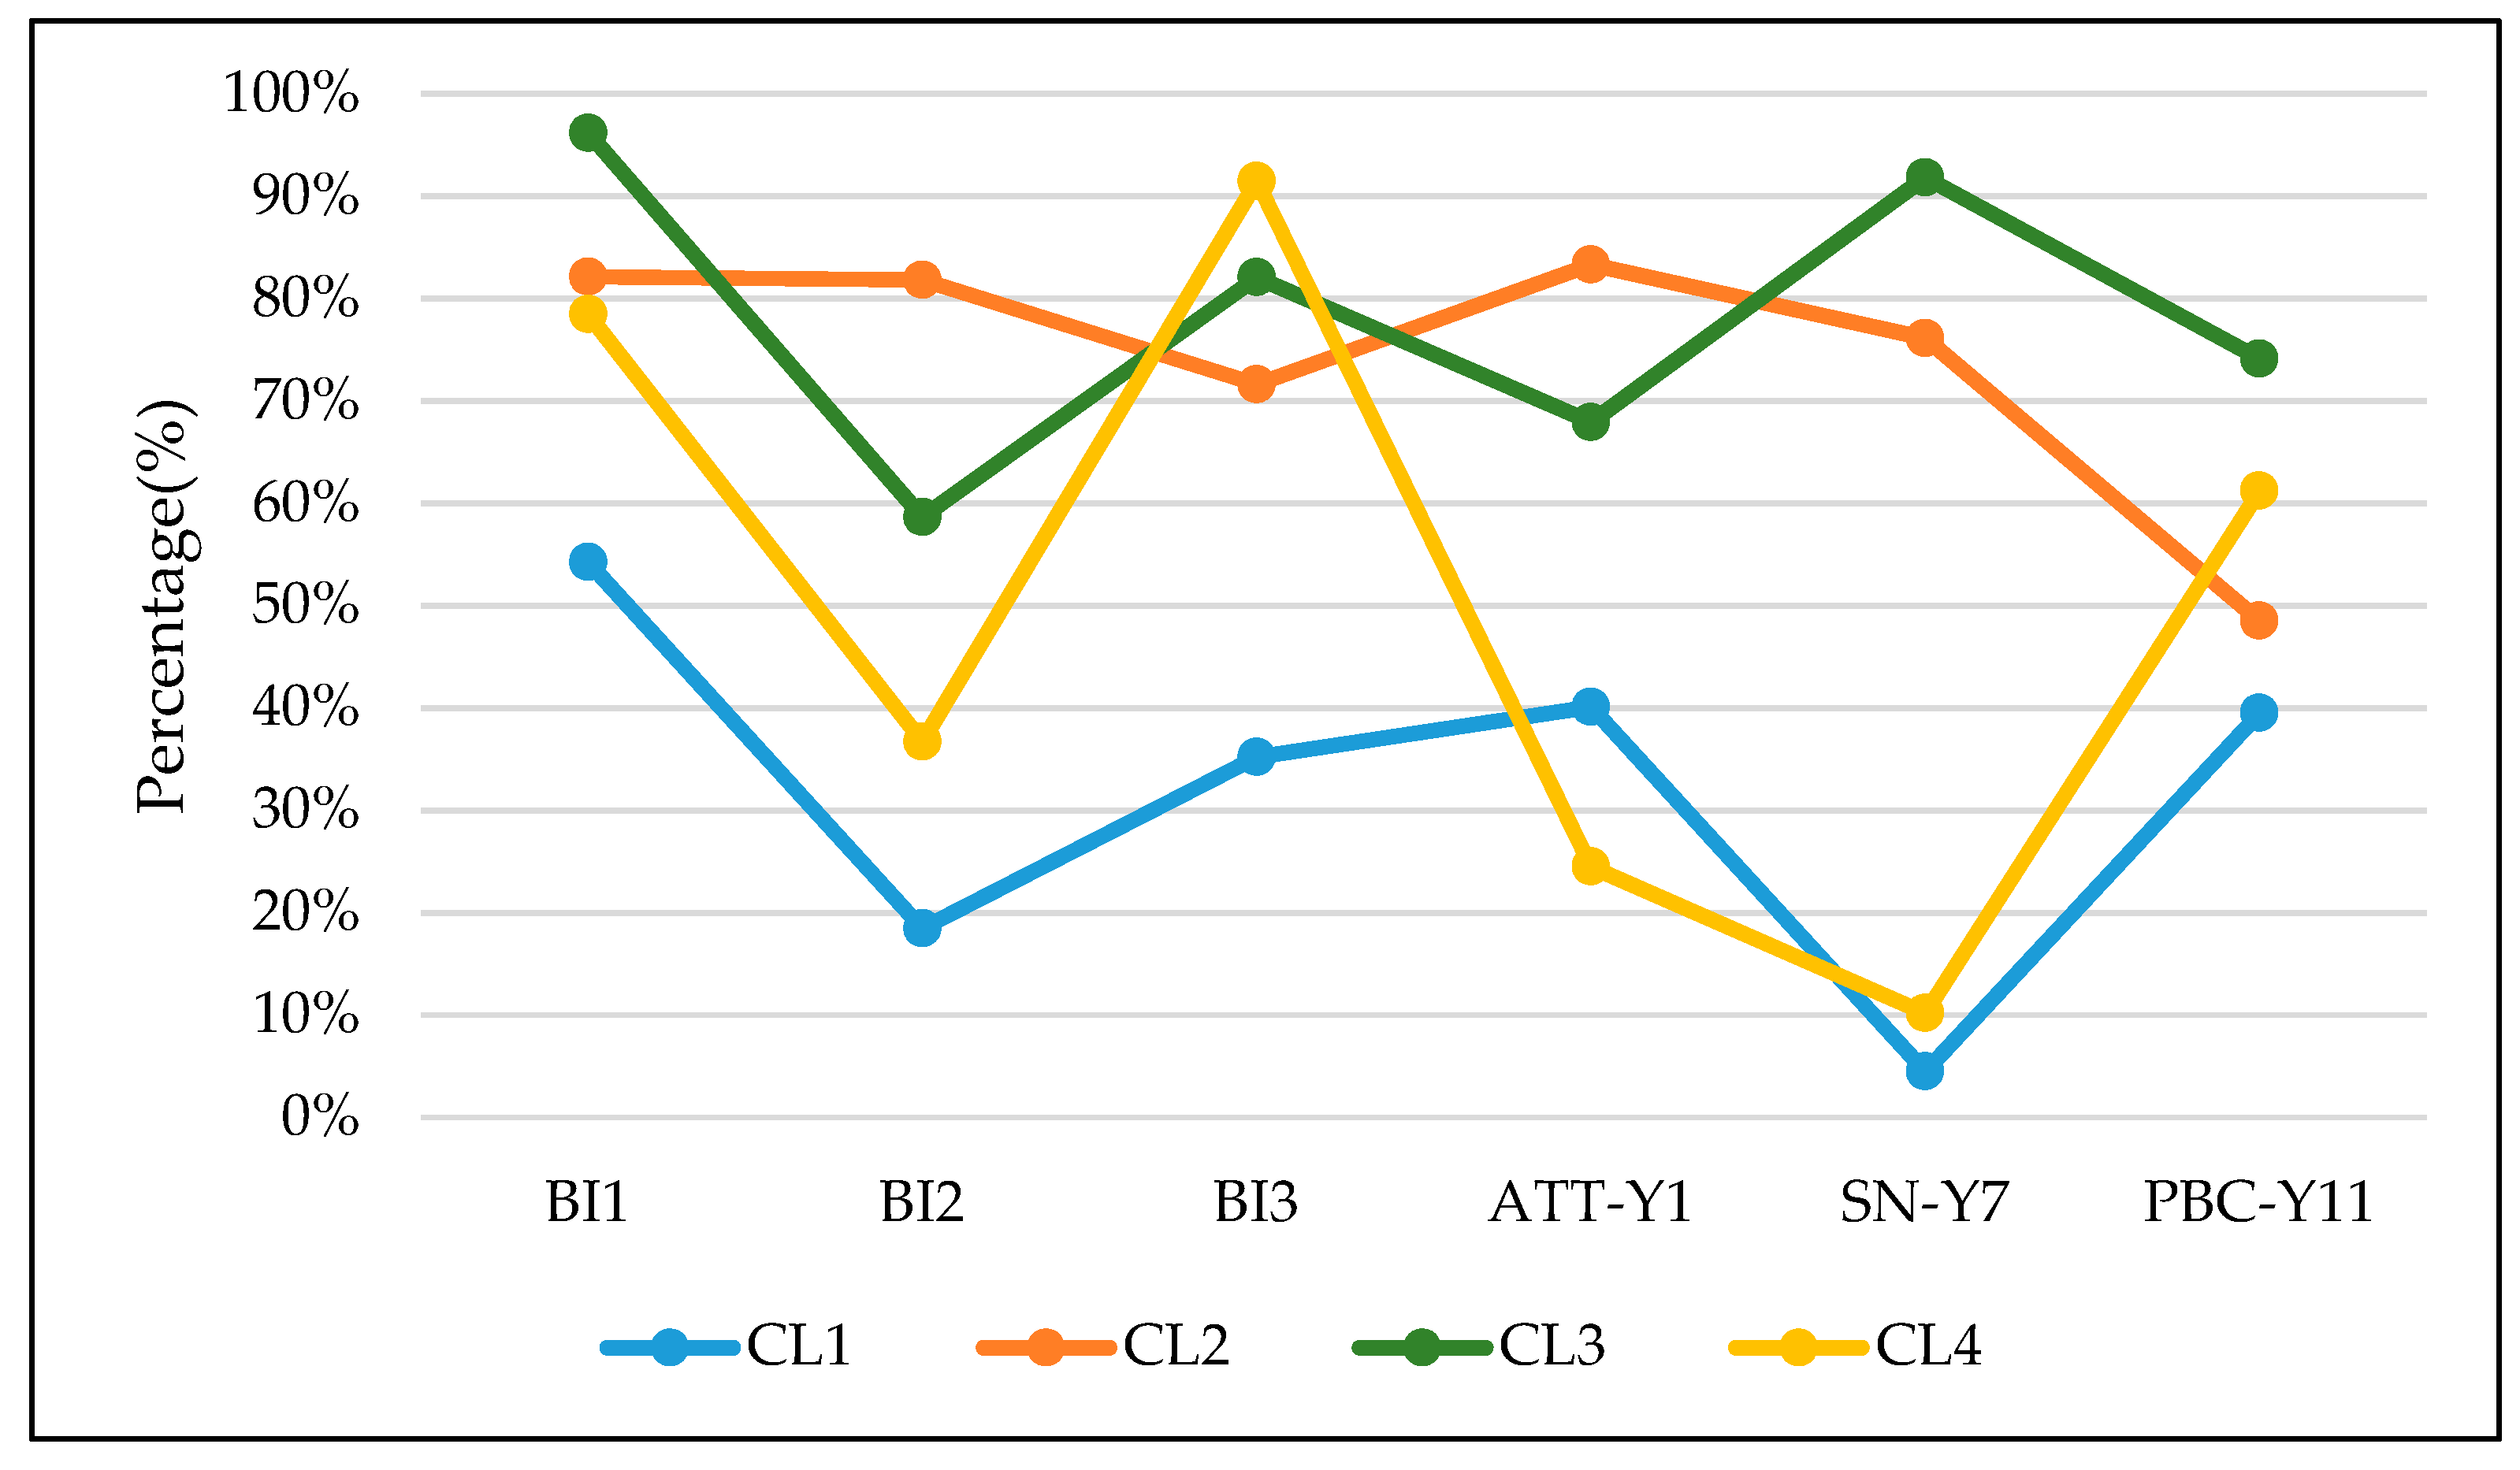
An analysis of different latent classes of observation indicators was carried out, as shown in Figure 5, Figure 6, Figure 7, Figure 8, Figure 9 and Figure 10. There are significant differences among the three observed variables of age, monthly income, and tourism group in the latent classes, as shown in Figure 5, Figure 6 and Figure 7. Three observed psychological variables, attitude (Y1), subjective norm (Y7), and perceived behavior control (Y11), are different in the latent classes, as shown in Figure 8, Figure 9 and Figure 10, which shows their distinct psychographic profiles. In addition, Figure 11 shows the distinct psychographic profiles, which differ particularly with regard to attitude (Y1), subjective norm (Y7), perceived behavior control (Y11), and the intention to choose HRAT (observed variables are Z1, Z2, Z3), for which the observed level of these psychological variables was 4 and 5.
According to the results of Figure 5, Figure 6, Figure 7, Figure 8, Figure 9, Figure 10 and Figure 11 and Table 4, we characterized the segments as follows: Segment 1 (29.5% of respondents) mainly consists of tourists who behave more neutrally. That is, they are neutral to the attitude of improving the tourism experience, the social pressure of news media, and the attraction of preferential travel cost, and we call them “neutral” type. Although neutrality is their main psychological state, nearly 40% of these respondents show obvious sensitivity to preferential travel cost. In terms of travel intention, they are more inclined to try HRAT, followed by recommending it to others, and giving priority to HRAT intention is the weakest among all segments of other classes. Members of this segment are more often young and middle-aged people younger than 44 years of age (91%), and more often have low and middle income (≤5000,74%). Their tourism group is mainly individual (46%). Members of this segment pay less attention to the travel experience and are more free and casual.
Segment 2 (33.9% of respondents) is mainly composed of people who evaluate their attitude toward improving the tourism experience highly, and the evaluation reached 83.3% at levels 4 and 5. They agree more with the subjective normative role of the news media, while their sensitivity to preferential travel cost is weaker than other categories. The intention to choose HRAT is very high, and especially the proportion willing to prioritize it is obviously higher than the other three categories. This is why we call this group the “experiential” type. Members of this segment are more often middle-aged people 35–44 years of age and middle-aged and elderly people 45–54 years of age (67.1%), and more often have middle and high income (>5000, 80%; >8000, 38.1%). Their tourism groups are mainly 2–3 people (51.6%). Members of this segment are very focused on the travel experience, but are not sensitive to preferential travel cost. They are rational and pursue quality tourism with a high-end experience, and are faithful to HRAT.
Segment 3 (16.2% of respondents) is mainly composed of people with more positive psychological characteristics. Their attitude toward improving the tourism experience is greater than that of segments 1 and 4, and weaker than that of segment 2. They are also vulnerable to pressure from the subjective norm of the news media. They are most sensitive to the attraction of preferential travel cost. The proportion of those willing to try HRAT is higher than that of other categories, and we thus call them “active” type. People in this segment are generally 24–44 and 55–65 years of age and more often have middle income. Their tourism groups are mainly individuals and 2–3 people (79.7%). In line with that, they are easily guided by external factors and are a sensitive group with HRAT potential.
Compared with other categories, people in segment 4 (20.4% of respondents) find it least important to improve the tourism experience (71.2%). Social pressure from the news media showed a random pattern, with 45.4% of them experiencing no social pressure. However, they are more sensitive to the attraction of preferential travel cost. In addition, they are more likely to recommend HRAT to friends and relatives. Their willingness to prioritize HRAT is random, and the distribution of each level is relatively balanced, which is why we call them “random” type. The majority of this segment is young people under 34 years of age (76.5%), with the highest proportion of low income (≤3000, 78.9%). Their tourism groups are mainly 4 or more people. It can be seen that this segment is a multiplayer group. Due to the large number of tourists with good planning, the mutual influences and constraints are also strong. Therefore, according to the observation results of psychological variables, the choice is random, but some groups are sensitive to preferential travel costs.
5. Conclusions and Discussion
Based on the background of holiday tourists’ travel behavior and the problem of holiday travel congestion, this paper focuses on the influencing factors of tourists’ rush-hour avoidance behavior intention and travel behavior during holidays.
First, the structural equation model is used to verify the relationship between latent psychological variables and travel behavior in terms of HRAT. Research shows the following: (1) Attitude, subjective norm, and perceived behavior control have significant positive effects on the intention to choose HRAT. (2) Perceived behavior control has the greatest effect on the intention and behavior of HRAT. Lack of abundant time is the main constraint, and preferential travel costs are the main attraction. In addition, travel congestion, travel convenience, and information guidance are also important factors. (3) Attitude has a strong influence on behavioral intention, and tourists who have a better attitude toward HRAT are more inclined to avoid rush-hour travel on holidays. (4) Subjective norm also have some influence on behavioral intention. Among them, the subjective norm of family and friends have the strongest influence, and the subjective norm of news media can also have a strong influence.
Second, in order to explore the behavioral characteristics of tourists, this paper uses the latent class model to explore the heterogeneity of tourists’ HRATB in terms of psychological factors. According to individual attributes, tourism characteristics, and psychological factors, latent classes of respondents are analyzed and modeled. Six observed variables are adopted: age, monthly income, tourism group, attitude toward improving the tourism experience, the subjective normative role of news media, and the attraction of preferential travel cost. Finally, the surveyed tourist groups are classified into four categories: neutral tourists who mainly travel alone (29.5%), faithful ones who mainly travel with family experience (33.9%), potential tourists who travel with fewer than three people (16.2%), and group planners who travel with more than four people (20.4%). The results show that for different categories of tourists, their HRAT intention and behavior are closely related to personal attributes, tourism characteristics, and psychological factors.
Therefore, in order to encourage tourists to choose HRAT, it is suggested that managers or tourism product developers can start with psychological factors such as perceived behavior control, subjective norm, and attitudes. This would strengthen the perfection and connection of holiday travel information and tourist attraction information. Tourists are provided with the convenience of HRAT through the accurate guidance of travel information at different times, thus improving travel efficiency. Meanwhile, we can vigorously develop and enrich preferential packages for families or relatives traveling at different off-peak periods so as to attract tourists to choose HRAT. In addition, dynamic ladder discounts can be implemented to encourage tourists to change their travel times and avoid the rush hour during holidays. Moreover, strengthening the propaganda of travel experiences, service quality, comfort, and the convenience of avoiding rush-hour travel will be more helpful to attract tourists to choose HRAT.
More targeted measures can be implemented for different categories of tourists:
- (1)
- For the first segment (‘neutral’ type), although they are generally neutral about avoiding rush-hour travel during holidays, some tourists (about 40%) are still sensitive to preferential travel costs and travel experiences during holidays. Due to the small groups, the travel is free and flexible, and changing travel routes is convenient. They can potentially be used to stimulate groups to choose HRAT. We can encourage them to travel at different off-peak times by increasing travel discounts and recommending high-quality travel routes.
- (2)
- For the second segment (‘experiential’ type), they attach great importance to tourism travel experience and quality. The degree of caring about the travel experience exceeds the sensitivity to travel cost. Crowded scenic spots and congested roads will directly affect their travel choices. Therefore, this segment can be regarded as a group that is faithful to HRAT. Accurate information on avoiding rush hour can be used to help this group. Meanwhile, excellent service facilities at scenic spots and roads can help improve the HRAT experience of this group.
- (3)
- For the third segment (‘active’ type), they are the potential group for HRAT. They show strong sensitivity to external influences such as news media, preferential fees, and so on. The psychological manifestation of the intention to choose HRAT is more positive. However, the attitude evaluation of HRAT is weaker than that of the second segment and the sensitivity to cost is stronger. Most of the people in this group are middle income. It is more effective to use preferential fees (such as scenic spot tickets, travel costs) to attract them to travel at different times.
- (4)
- For the fourth segment (‘random’ type), because the number of tourists in these groups is usually large, they are very restrictive toward each other. It is relatively difficult to implement holiday rush-hour avoidance travel. However, because they are sensitive to fees and most have low incomes, we can increase the discounts to avoid rush hour for group tours, such as discount tickets for group attractions and preferential road tolls for multiple people.
This paper mainly explores the influence of psychological factors on tourists’ avoidance of holiday rush-hour travel. Future research can focus on the influence of other factors and various combinations of factors. At the same time, the characteristics and rules of avoiding rush-hour travel by tourists under the influence of different measures or policies can be studied.
Author Contributions
The individual responsibilities and contribution of the authors are listed as follows: H.Z. and Y.H. conceived and designed the research, H.Z. developed the model and wrote the paper; H.G. guided the research process and revised the manuscript; W.L. and L.Z. performed the analysis of the sample and helped edit the manuscript.
Funding
This research was funded by the National Natural Science Foundation of China (Grant No. 51308015, 51338008 and 51378036).
Acknowledgments
The authors are very grateful to all the participants who filled in the questionnaire. We would like to thank the anonymous reviewers for their helpful comments and suggestions, which improved the quality greatly of this paper.
Conflicts of Interest
The authors declare no conflict of interest.
References
- Lin, X.; Susilo, Y.; Shao, C.; Liu, C. The Implication of Road Toll Discount for Mode Choice: Intercity Travel during the Chinese Spring Festival Holiday. Sustainability 2018, 10, 2700. [Google Scholar] [CrossRef]
- Bao, Y.; Xiao, F.; Gao, Z.; Gao, Z. Investigation of the traffic congestion during public holiday and the impact of the toll-exemption policy. Transp. Res. Part B Methodol. 2017, 104, 58–81. [Google Scholar] [CrossRef]
- Jin, Q.; Hu, H.; Kavan, P. Factors Influencing Perceived Crowding of Tourists and Sustainable Tourism Destination Management. Sustainability 2016, 8, 976. [Google Scholar] [CrossRef]
- AMAP. Travel Report on National Day of 2017; Travel Report AMAP: Beijing, China, 2017; pp. 1–20. [Google Scholar]
- AMAP. Travel Report on National Day of 2018; Travel Report AMAP: Beijing, China, 2018; pp. 1–15. [Google Scholar]
- Hsieh, H.; Kanda, Y.; Fujii, S. Incorporation of coping planning into the behavior change model that accounts for implementation intention. Transp. Res. Part F Traffic Psychol. Behav. 2019, 60, 228–244. [Google Scholar] [CrossRef]
- Salomon, I.; Mokhtarian, P.L. Coping with Congestion: Understanding the Gap between Policy Assumptions and Behavior. Transp. Res. Part D Trans. Environ. 1997, 2, 107–123. [Google Scholar] [CrossRef]
- Hess, S.; Daly, A.; Rohr, C.; Hyman, G. On the development of time period and mode choice models for use in large scale modelling forecasting systems. Transp. Res. Part A Policy Pract. 2007, 41, 802–826. [Google Scholar] [CrossRef] [Green Version]
- Choo, S.; Mokhtarian, P.L. Individual responses to congestion policies: Modeling the consideration of factor-based travel-related strategy bundles. KSCE J. Civ. Eng. 2012, 16, 822–834. [Google Scholar] [CrossRef]
- Alfa, A.S.; Black, J.A.; Blunden, W.R. On the Temporal Distribution of Peak Traffic Demands: A Model and Its Calibration. Aust. Road Res. Board 1985, 2, 1–18. [Google Scholar]
- Steed, J.L.; Bhat, C.R. Modeling Departure Time Choice for Home-Based Non-Work Trips; Research Report SWUTC; Southwest Region University Transportation Center, Univeristy of Texas at Austin: Austin, TX, USA, 2000. [Google Scholar]
- Ben-Elia, E.; Ettema, D. Carrots versus sticks: Rewarding commuters for avoiding the rush-hour—A study of willingness to participate. Transp. Policy 2009, 16, 68–76. [Google Scholar] [CrossRef]
- Ben-Elia, E.; Ettema, D. Changing commuters’ behavior using rewards: A study of rush-hour avoidance. Transp. Res. Part F Traffic Psychol. Behav. 2011, 14, 354–368. [Google Scholar] [CrossRef]
- Ben-Elia, E.; Ettema, D. Rewarding rush-hour avoidance: A study of commuters’ travel behavior. Transp. Res. Part A Policy Pract. 2011, 45, 567–582. [Google Scholar] [CrossRef]
- Zhang, Z.; Fujii, H.; Managi, S. How does commuting behavior change due to incentives? An empirical study of the Beijing Subway System. Transp. Res. Part F Traffic Psychol. Behav. 2014, 24, 17–26. [Google Scholar] [CrossRef] [Green Version]
- Thorhauge, M.; Cherchi, E.; Rich, J. How flexible is flexible? Accounting for the effect of rescheduling possibilities in choice of departure time for work trips. Transp. Res. Part A Policy Pract. 2016, 86, 177–193. [Google Scholar] [CrossRef] [Green Version]
- Shailes, A.; Senior, M.L.; Andrew, B.P. Tourists’ travel behaviour in response to congestion: The case of car trips to Cornwall, United Kingdom. J. Transp. Geog. 2001, 9, 49–60. [Google Scholar] [CrossRef]
- Wen, C.; Yeh, Y. Modeling air travelers’choice of flight departure and return dates on long holiday weekends. J. Air Transp. Manag. 2017, 65, 220–225. [Google Scholar] [CrossRef]
- Thorhauge, M.; Cherchi, E.; Walker, J.L.; Rich, J. The role of intention as mediator between latent effects and behavior: Application of a hybrid choice model to study departure time choices. Transportation 2017, 2017, 1–25. [Google Scholar] [CrossRef]
- Han, Y.; Guan, H.; Duan, J. Tour Route Multiobjective Optimization Design Based on the Tourist Satisfaction. Discret. Dyn. Nat. Soc. 2014, 2014, 1–8. [Google Scholar] [CrossRef] [Green Version]
- Arellana, J.; Daly, A.; Hess, S.; de Dios Ortúzar, J.; Rizzi, L.I. Development of Surveys for Study of Departure Time Choice: Two-Stage Approach to Efficient Design. Transp. Res. Rec. J. Res. Board 2012, 2303, 9–18. [Google Scholar] [CrossRef] [Green Version]
- Thorhauge, M.; Haustein, S.; Cherchi, E. Accounting for the Theory of Planned Behaviour in departure time choice. Transp. Res. Part F Traffic Psychol. Behav. 2016, 38, 94–105. [Google Scholar] [CrossRef] [Green Version]
- Haustein, S.; Thorhauge, M.; Cherchi, E. Commuters’ attitudes and norms related to travel time and punctuality: A psychographic segmentation to reduce congestion. Travel Behav. Soc. 2018, 12, 41–50. [Google Scholar] [CrossRef]
- Okazaki, S.; Campo, S.; Andreu, L.; Romero, J. A Latent Class Analysis of Spanish Travelers’ Mobile Internet Usage in Travel Planning and Execution. Cornell Hosp. Q. 2015, 56, 191–201. [Google Scholar] [CrossRef]
- Molin, E.; Mokhtarian, P.; Kroesen, M. Multimodal travel groups and attitudes: A latent class cluster analysis of Dutch travelers. Transp. Res. Part A Policy Pract. 2016, 83, 14–29. [Google Scholar] [CrossRef] [Green Version]
- Teichert, T.; Shehu, E.; von Wartburg, I. Customer segmentation revisited: The case of the airline industry. Transp. Res. Part A Policy Pract. 2008, 42, 227–242. [Google Scholar] [CrossRef] [Green Version]
- Wen, C.; Lai, S. Latent class models of international air carrier choice. Transp. Res. Part E Logist. Transp. Rev. 2010, 46, 211–221. [Google Scholar] [CrossRef]
- Greene, W.H.; Hensher, D.A. A latent class model for discrete choice analysis: Contrasts with mixed logit. Transp. Res. Part B Methodol. 2003, 37, 681–698. [Google Scholar] [CrossRef]
- Shelat, S.; Huisman, R.; van Oort, N. Analysing the trip and user characteristics of the combined bicycle and transit mode. Res. Transp. Econ. 2018, 69, 68–76. [Google Scholar] [CrossRef]
- Yanagihara, M.; Uno, N.; Nakamura, T. Latent Class Analysis for Driving Behavior on Merging Section. Transp. Res. Procedia 2015, 6, 259–271. [Google Scholar] [CrossRef] [Green Version]
- Alegre, J.; Mateo, S.; Pou, L. A latent class approach to tourists’ length of stay. Tour. Manag. 2011, 32, 555–563. [Google Scholar] [CrossRef]
- Pronello, C.; Camusso, C. Travellers’profiles definition using statistical multivariate analysis of attitudinal variables. J. Transp. Geogr. 2011, 19, 1294–1308. [Google Scholar] [CrossRef]
- Haustein, S.; Hunecke, M. Identifying target groups for environmentally sustainable transport: Assessment of different segmentation approaches Sonja Haustein1 and Marcel Hunecke2. Curr. Opin. Environ. Sustain. 2013, 5, 197–204. [Google Scholar] [CrossRef]
- Anable, J. ‘Complacent Car Addicts’ or ‘Aspiring Environmentalists’? Identifying travel behaviour segments using attitude theory. Transp. Policy 2005, 12, 65–78. [Google Scholar] [CrossRef]
- Shiftan, Y.; Outwater, M.L.; Zhou, Y. Transit market research using structural equation modeling and attitudinal market segmentation. Transp. Policy 2008, 15, 186–195. [Google Scholar] [CrossRef]
- Yang, L.; Shen, Q.; Li, Z. Comparing travel mode and trip chain choices between holidays and weekdays. Transp. Res. Part A Policy Pract. 2016, 91, 273–285. [Google Scholar] [CrossRef]
- Zhang, S.; Liu, X.; Tang, J.; Cheng, S.; Wang, Y. Urban spatial structure and travel patterns: Analysis of workday and holiday travel using inhomogeneous Poisson point process models. Comput. Environ. Urban 2019, 73, 68–84. [Google Scholar] [CrossRef]
- Wang, B.; Shao, C.; Li, J.; Weng, J.; Ji, X. Holiday travel behavior analysis and empirical study under integrated multimodal travel information service. Transp. Policy 2015, 39, 21–36. [Google Scholar] [CrossRef]
- Hunecke, M.; Haustein, S.; Böhler, S.; Grischkat, S. Attitude-Based Target Groups to Reduce the Ecological Impact of Daily Mobility Behavior. Environ. Behav. 2010, 42, 3–43. [Google Scholar] [CrossRef]
- Ajzen, I. The Theory of Planned Behavior. Org. Behav. Hum. Decis. Process. 1991, 50, 179–211. [Google Scholar] [CrossRef]
- Hess, S.; Polak, J.W.; Daly, A.; Hyman, G. Flexible substitution patterns in models of mode and time of day choice: New evidence from the UK and the Netherlands. Transportation 2007, 34, 213–238. [Google Scholar] [CrossRef]
- Oppewal, H.; Huybers, T.; Crouch, G.I. Tourist destination and experience choice: A choice experimental analysis of decision sequence effects. Tour. Manag. 2015, 48, 467–476. [Google Scholar] [CrossRef]
- Nicolau, J.L.; Más, F.J. Sequential choice behavior: Going on vacation and type of destination. Tour. Manag. 2008, 29, 1023–1034. [Google Scholar] [CrossRef]
- Van Acker, V.; Witlox, F.; Van Wee, B. The Effects of the Land Use System on Travel Behavior: A Structural Equation Modeling Approach. Transp. Plan. Technol. 2007, 30, 331–353. [Google Scholar] [CrossRef]
- Han, Y.; Li, W.; Wei, S.; Zhang, T. Research on Passenger’s Travel Mode Choice Behavior Waiting at Bus Station Based on SEM-Logit Integration Model. Sustainability 2018, 10, 1996. [Google Scholar] [CrossRef]
- López-Bonilla, L.M.; López-Bonilla, J.M. Postmodernism and Heterogeneity of Leisure Tourist Behavior Patterns. Leisure Sci. 2009, 31, 68–83. [Google Scholar] [CrossRef]
- Qiu, H.Z. Latent Class Modeling: Principles and Techniques; Educational Science Publishing House: Beijing, China, 2008. [Google Scholar]
- Ziegel, E.R. Log-Linear Models for Event Historiesby. J. Vermunt Technometrics 1998, 40, 85. [Google Scholar]
- Clogg, C.C. Some Latent Structure Models for the Analysis of Likert-Type Data. Soc. Sci. Res. 1979, 8, 287–301. [Google Scholar] [CrossRef]
- Clogg, C.C. Latent Structure Models of Mobility. Am. J. Soc. 1981, 86, 836–868. [Google Scholar] [CrossRef]
- Masiero, L.; Qiu, R.T. Modeling reference experience in destination choice. Ann. Tour. Res. 2018, 72, 58–74. [Google Scholar] [CrossRef]
Figure 1.
Model framework.

Figure 2.
Statics of travel congestion.

Figure 3.
Congestion of tourist destinations in different types.

Figure 4.
Structural equation modeling analysis results. Note: ATT, attitude; SN, subjective norm; PBC, perceived behavior control; BI, behavior intention; Behavior, holiday rush-hour avoidance travel behavior. *** means p < 0.001, the statistical significance of load factors can be tested based on p-values.

Figure 5.
Ages of tourists in the four segments.

Figure 6.
Monthly income of tourists in the four segments.

Figure 7.
Tourism group of tourist segments.

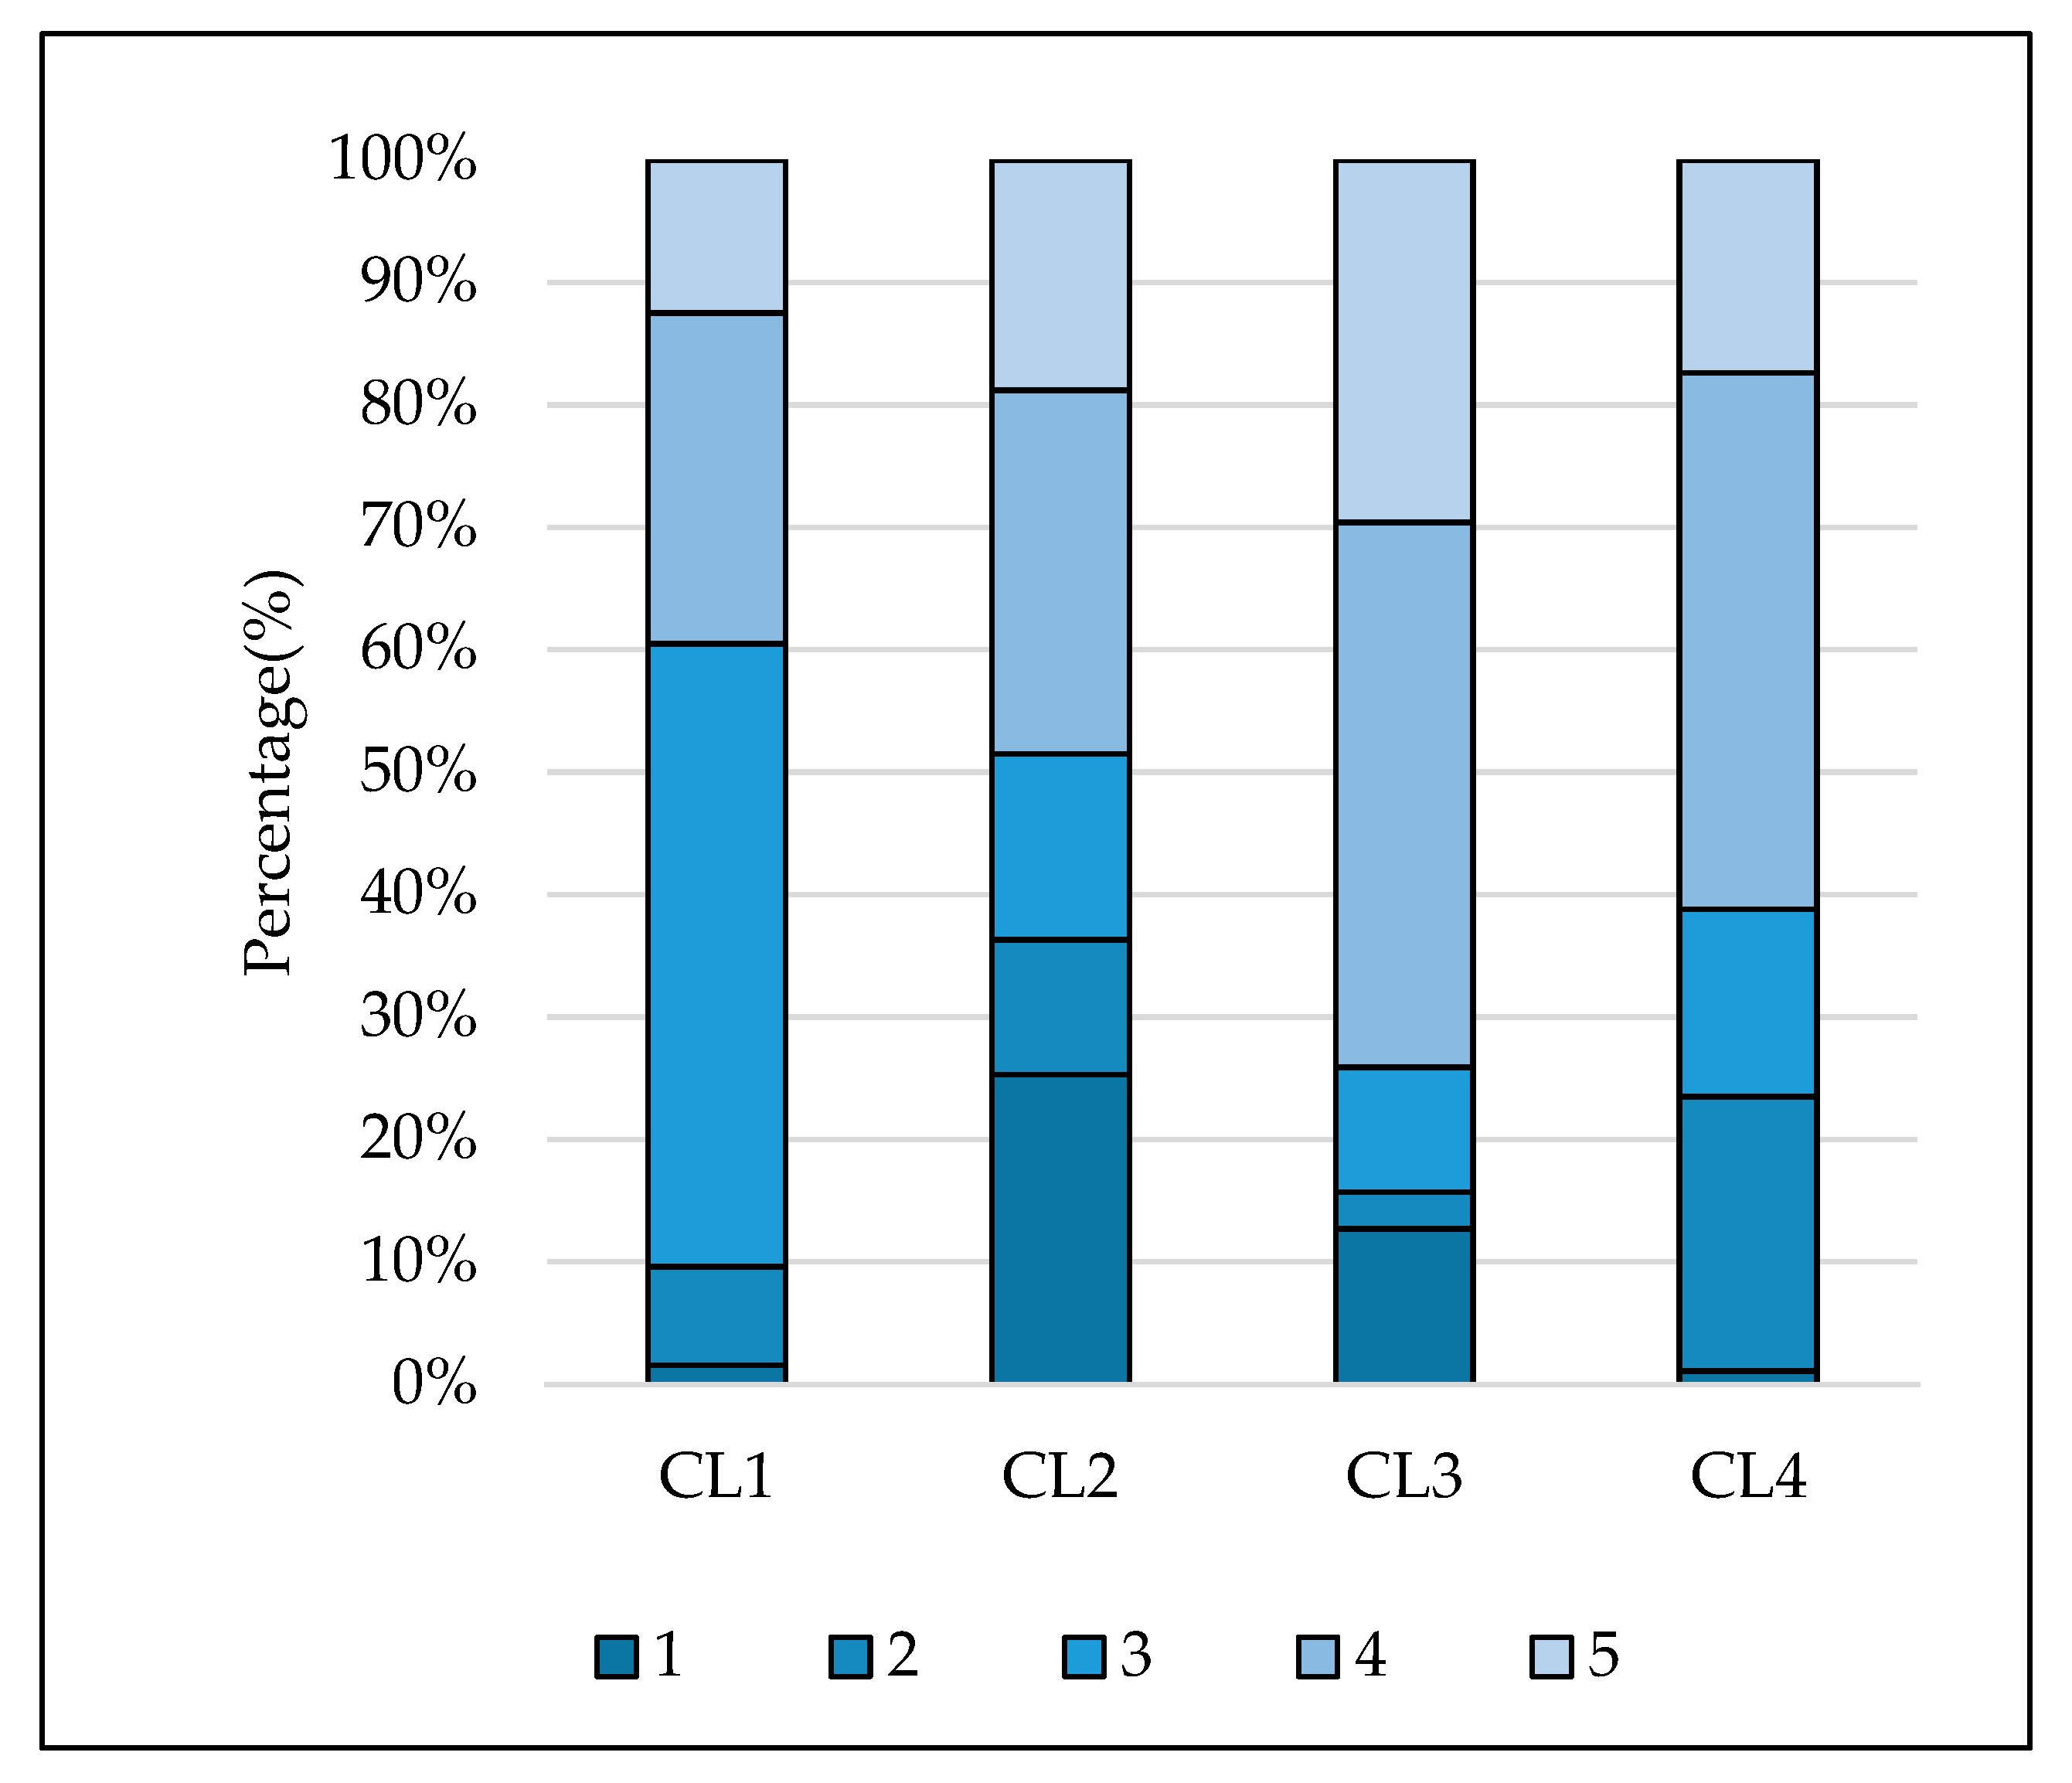
Figure 8.
ATT (Y1) of tourist segments.

Figure 9.
SN (Y7) of tourist segments.

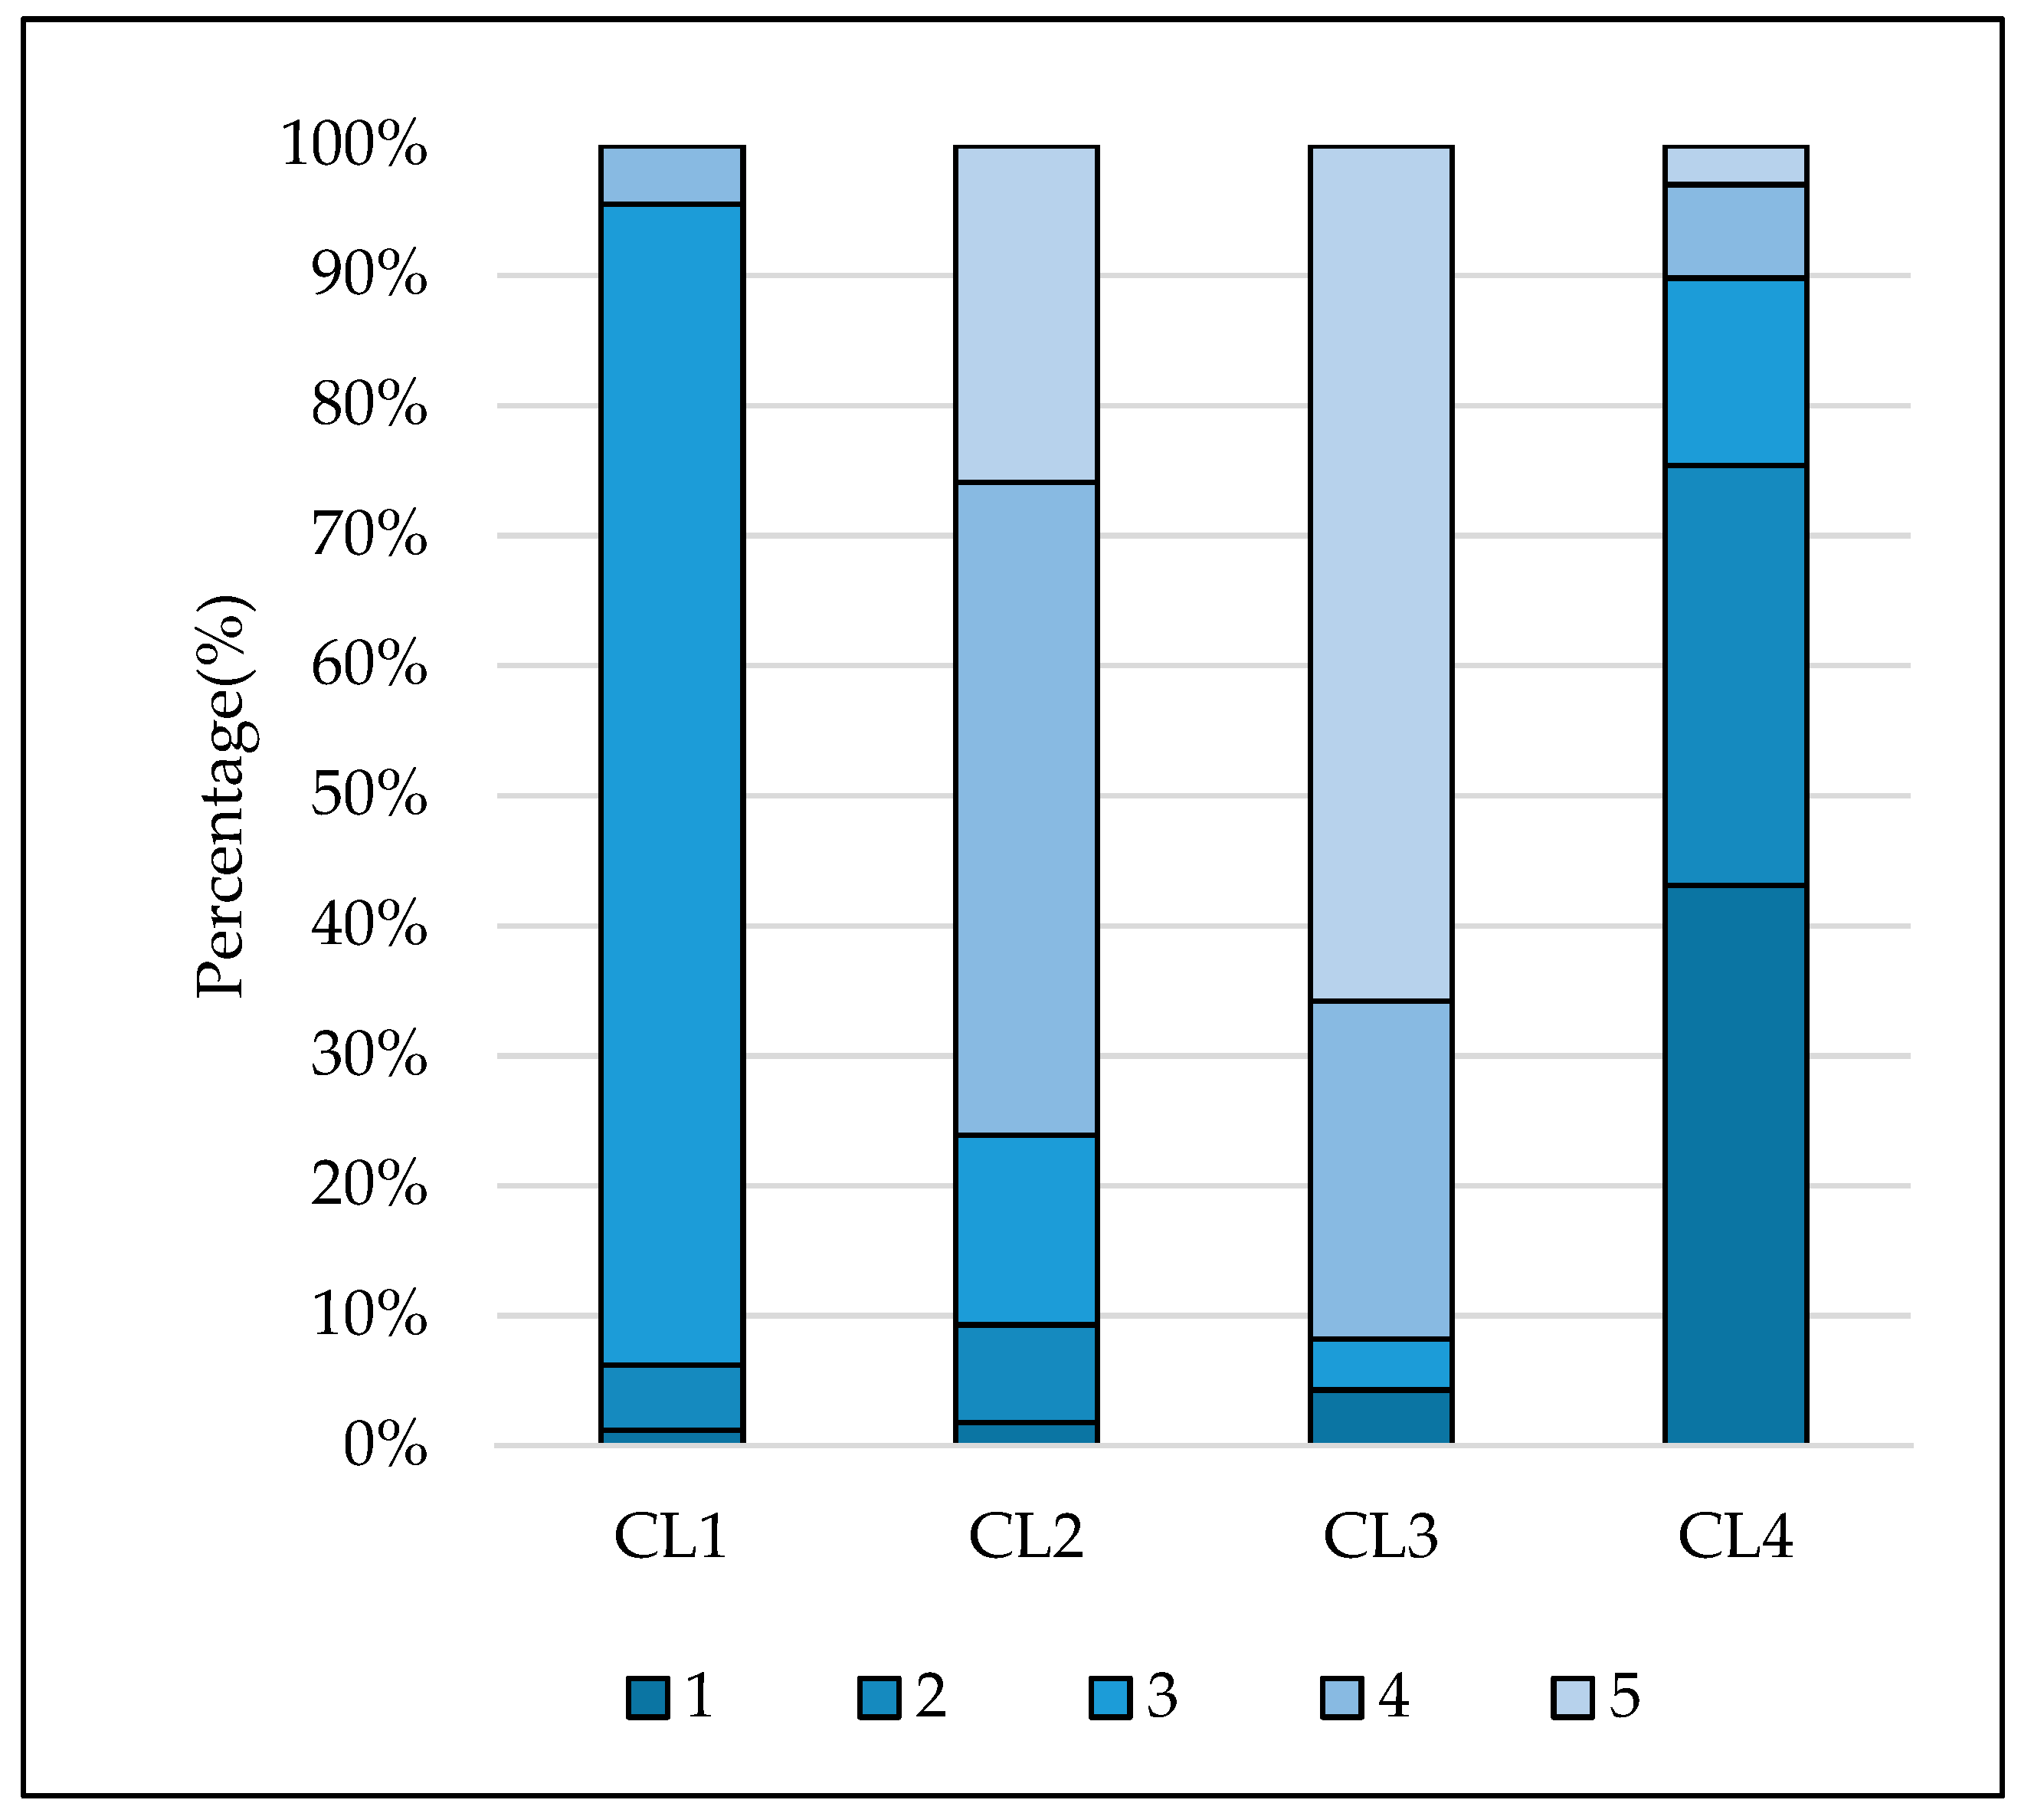
Figure 10.
PBC (Y11) of tourist segments.

Figure 11.
Psychographic profiles of segments.


Table 1.
Sociodemographic characteristics of the sample.
| Variable | Description | Percentage (%) | |
|---|---|---|---|
| Gender | Gender 1 | Male | 52.82 |
| Gender 2 | Female | 47.18 | |
| Age (years) | Age 1 | 18–23 | 18.18 |
| Age 2 | 24–34 | 49.38 | |
| Age 3 | 35–44 | 19.01 | |
| Age 4 | 45–54 | 8.68 | |
| Age 5 | 55–65 | 4.75 | |
| Occupation | Occupation 1 | Staff | 30.87 |
| Occupation 2 | Worker | 23.56 | |
| Occupation 3 | Teachers | 11.78 | |
| Occupation 4 | Student | 21.18 | |
| Occupation 5 | Retired/Unemployed | 5.58 | |
| Occupation 6 | Freelance | 5.58 | |
| Occupation 7 | Other | 1.45 | |
| Education level | Education 1 | High school or below | 5.37 |
| Education 2 | Junior college/Bachelor’s degree | 63.43 | |
| Education 3 | Master’s degree | 22.73 | |
| Education 4 | Doctorate degree | 8.47 | |
| Monthly income (RMB) | Income 1 | 3000 | 35.95 |
| Income 2 | 3000–5000 | 22.52 | |
| Income 3 | 5001–8000 | 27.27 | |
| Income 4 | 8000 | 14.26 | |
| Disposable tourism time | Time 1 | Single day off and statutory holidays | 18.18 |
| Time 2 | Two days off and statutory holidays | 25.83 | |
| Time 3 | Two days off, statutory holidays, and paid annual leave | 16.12 | |
| Time 4 | Two days off, statutory holidays, and summer/winter vacation | 23.34 | |
| Time 5 | Lots of free time | 16.53 | |
Table 2.
Descriptive analysis of observation variables.
| Latent Variables | Observed Variables | Mean | Cronbach’s α | |
|---|---|---|---|---|
| Attitude (ATT) | Y1 | Improve the tourism experience | 4.14 | 0.882 |
| Y2 | Avoid travel congestion | 3.80 | ||
| Y3 | Reduce the loss of time | 3.64 | ||
| Subjective Norm (SN) | Y4 | Behavior of people around you | 3.31 | 0.841 |
| Y5 | Advice and support from family members | 4.01 | ||
| Y6 | Suggestions from friends/classmates/colleagues | 3.98 | ||
| Y7 | News and social media promotion | 3.92 | ||
| Perceived Behavior Control (PBC) | Y8 | Free travel time constraints | 3.89 | 0.906 |
| Y9 | Accurate and perfect information guidance | 3.66 | ||
| Y10 | Concessionary attraction of tickets to scenic spots | 3.58 | ||
| Y11 | Preferential travel cost attraction | 3.76 | ||
| Y12 | Convenient transportation facilities | 3.31 | ||
| Y13 | Experience of holiday rush-hour avoidance travel | 3.25 | ||
| Behavior Intention (BI) | Z1 | Willing to try | 4.00 | 0.814 |
| Z2 | Willing to give priority | 3.33 | ||
| Z3 | Recommend it to friends and relatives | 3.83 | ||
Table 3.
Test result of structural equation model (SEM) fitting.
| Fix Index | SEM Models | Criteria of Acceptable Fit |
|---|---|---|
| CMIN/DF (Likelihood-ratio Chi-square/degrees of freedom) | 1.723 | <3 |
| RMSEA (root mean square error of approximation) | 0.039 | <0.08 |
| RMR (root mean square residual) | 0.042 | <0.05 |
| GFI (goodness-of-fit index) | 0.951 | >0.9 |
| AGFI (adjusted goodness-of-fit index) | 0.934 | >0.9 |
| NFI (normed fit index) | 0.955 | >0.9 |
| TLI (Tacker-Lewis index) | 0.977 | >0.9 |
| IFI (incremental fit index) | 0.981 | >0.9 |
| CFI (comparative fit index) | 0.981 | >0.9 |
Table 4.
Test result of latent class model (LCM) fitting.
| Number of Classes | χ2 | G2 | AIC | BIC | Entropy |
|---|---|---|---|---|---|
| 2 | 3852.799 | 1512.216 | 7433.902 | 7630.460 | 0.892 |
| 3 | 3559.240 | 1367.385 | 7313.432 | 7610.360 | 0.841 |
| 4 | 3415.039 | 1316.357 | 7262.843 | 7660.141 | 0.872 |
| 5 | 3050.608 | 1216.701 | 7266.489 | 7714.157 | 0.859 |
Table 5.
Parameter estimation results of LCM (CL1, CL2, CL3, CL4 are the four latent classes).
| Variables | Observed Variables | Level | Description | Conditional Probability of Latent Class | |||
|---|---|---|---|---|---|---|---|
| CL1 | CL2 | CL3 | CL4 | ||||
| Personal attributes | Age (years) | 1 | 18–23 | 0.254 | 0.12 | 0.114 | 0.346 |
| 2 | 24–34 | 0.498 | 0.154 | 0.358 | 0.419 | ||
| 3 | 35–44 | 0.158 | 0.377 | 0.297 | 0.04 | ||
| 4 | 45–54 | 0.074 | 0.294 | 0.154 | 0.12 | ||
| 5 | 55–65 | 0.016 | 0.055 | 0.077 | 0.075 | ||
| Monthly income (RMB) | 1 | 3000 | 0.426 | 0 | 0.313 | 0.789 | |
| 2 | 3000–5000 | 0.314 | 0.2 | 0.303 | 0.149 | ||
| 3 | 5001–8000 | 0.234 | 0.419 | 0.305 | 0.03 | ||
| 4 | 8000 | 0.026 | 0.381 | 0.079 | 0.032 | ||
| Tourism characteristics | Tourist group (N) | 1 | 1 | 0.46 | 0.115 | 0.47 | 0.112 |
| 2 | 2–3 | 0.25 | 0.516 | 0.327 | 0.064 | ||
| 3 | 4–6 | 0.168 | 0.309 | 0.063 | 0.235 | ||
| 4 | ≥7 | 0.122 | 0.06 | 0.14 | 0.589 | ||
| Psychological factors | Y1 | 1 | Strongly disagree | 0.016 | 0 | 0.047 | 0.256 |
| 2 | Disagree | 0.098 | 0.042 | 0.111 | 0.456 | ||
| 3 | Generally agree | 0.485 | 0.125 | 0.163 | 0.043 | ||
| 4 | Agree | 0.224 | 0.376 | 0.296 | 0.101 | ||
| 5 | Strongly agree | 0.177 | 0.457 | 0.383 | 0.144 | ||
| Y7 | 1 | Strongly disagree | 0.012 | 0.018 | 0.043 | 0.131 | |
| 2 | Disagree | 0.05 | 0.075 | 0 | 0.323 | ||
| 3 | Generally agree | 0.893 | 0.146 | 0.039 | 0.144 | ||
| 4 | Agree | 0.045 | 0.502 | 0.26 | 0.372 | ||
| 5 | Strongly agree | 0 | 0.259 | 0.658 | 0.03 | ||
| Y11 | 1 | Strongly disagree | 0.016 | 0.253 | 0.127 | 0.011 | |
| 2 | Disagree | 0.08 | 0.11 | 0.03 | 0.224 | ||
| 3 | Generally agree | 0.509 | 0.152 | 0.102 | 0.153 | ||
| 4 | Agree | 0.27 | 0.297 | 0.445 | 0.438 | ||
| 5 | Strongly agree | 0.125 | 0.188 | 0.296 | 0.174 | ||
| Probability of latent class | 0.295 | 0.339 | 0.162 | 0.204 | |||
© 2019 by the authors. Licensee MDPI, Basel, Switzerland. This article is an open access article distributed under the terms and conditions of the Creative Commons Attribution (CC BY) license (http://creativecommons.org/licenses/by/4.0/).
Share and Cite
MDPI and ACS Style
Zhu, H.; Guan, H.; Han, Y.; Li, W. A Study of Tourists’ Holiday Rush-Hour Avoidance Travel Behavior Considering Psychographic Segmentation. Sustainability 2019, 11, 3755. https://0-doi-org.brum.beds.ac.uk/10.3390/su11133755
AMA Style
Zhu H, Guan H, Han Y, Li W. A Study of Tourists’ Holiday Rush-Hour Avoidance Travel Behavior Considering Psychographic Segmentation. Sustainability. 2019; 11(13):3755. https://0-doi-org.brum.beds.ac.uk/10.3390/su11133755
Chicago/Turabian StyleZhu, Haiyan, Hongzhi Guan, Yan Han, and Wanying Li. 2019. "A Study of Tourists’ Holiday Rush-Hour Avoidance Travel Behavior Considering Psychographic Segmentation" Sustainability 11, no. 13: 3755. https://0-doi-org.brum.beds.ac.uk/10.3390/su11133755
Note that from the first issue of 2016, this journal uses article numbers instead of page numbers. See further details here.