Investigation of the Optical, Physical, and Chemical Interactions between Diammonium Hydrogen Phosphate (DAP) and Pigments


Abstract
:1. Introduction
- Can DAP be considered as a potential precursor for a surface treatment of wall paintings (mainly fresco) and other monumental painted architectural surfaces?
- Is there any obvious color change of pigments after contact with DAP solutions?
- Are any chemical or morphological changes occurring?
- What are the possible mechanisms leading to color change and/or other forms of physical and chemical phase transformation?
2. Materials and Methods
2.1. Materials
2.2. Characterization of Pigment–DAP Interaction
3. Results and Discussion
3.1. Cinnabar, French Ochre, Lapis Lazuli
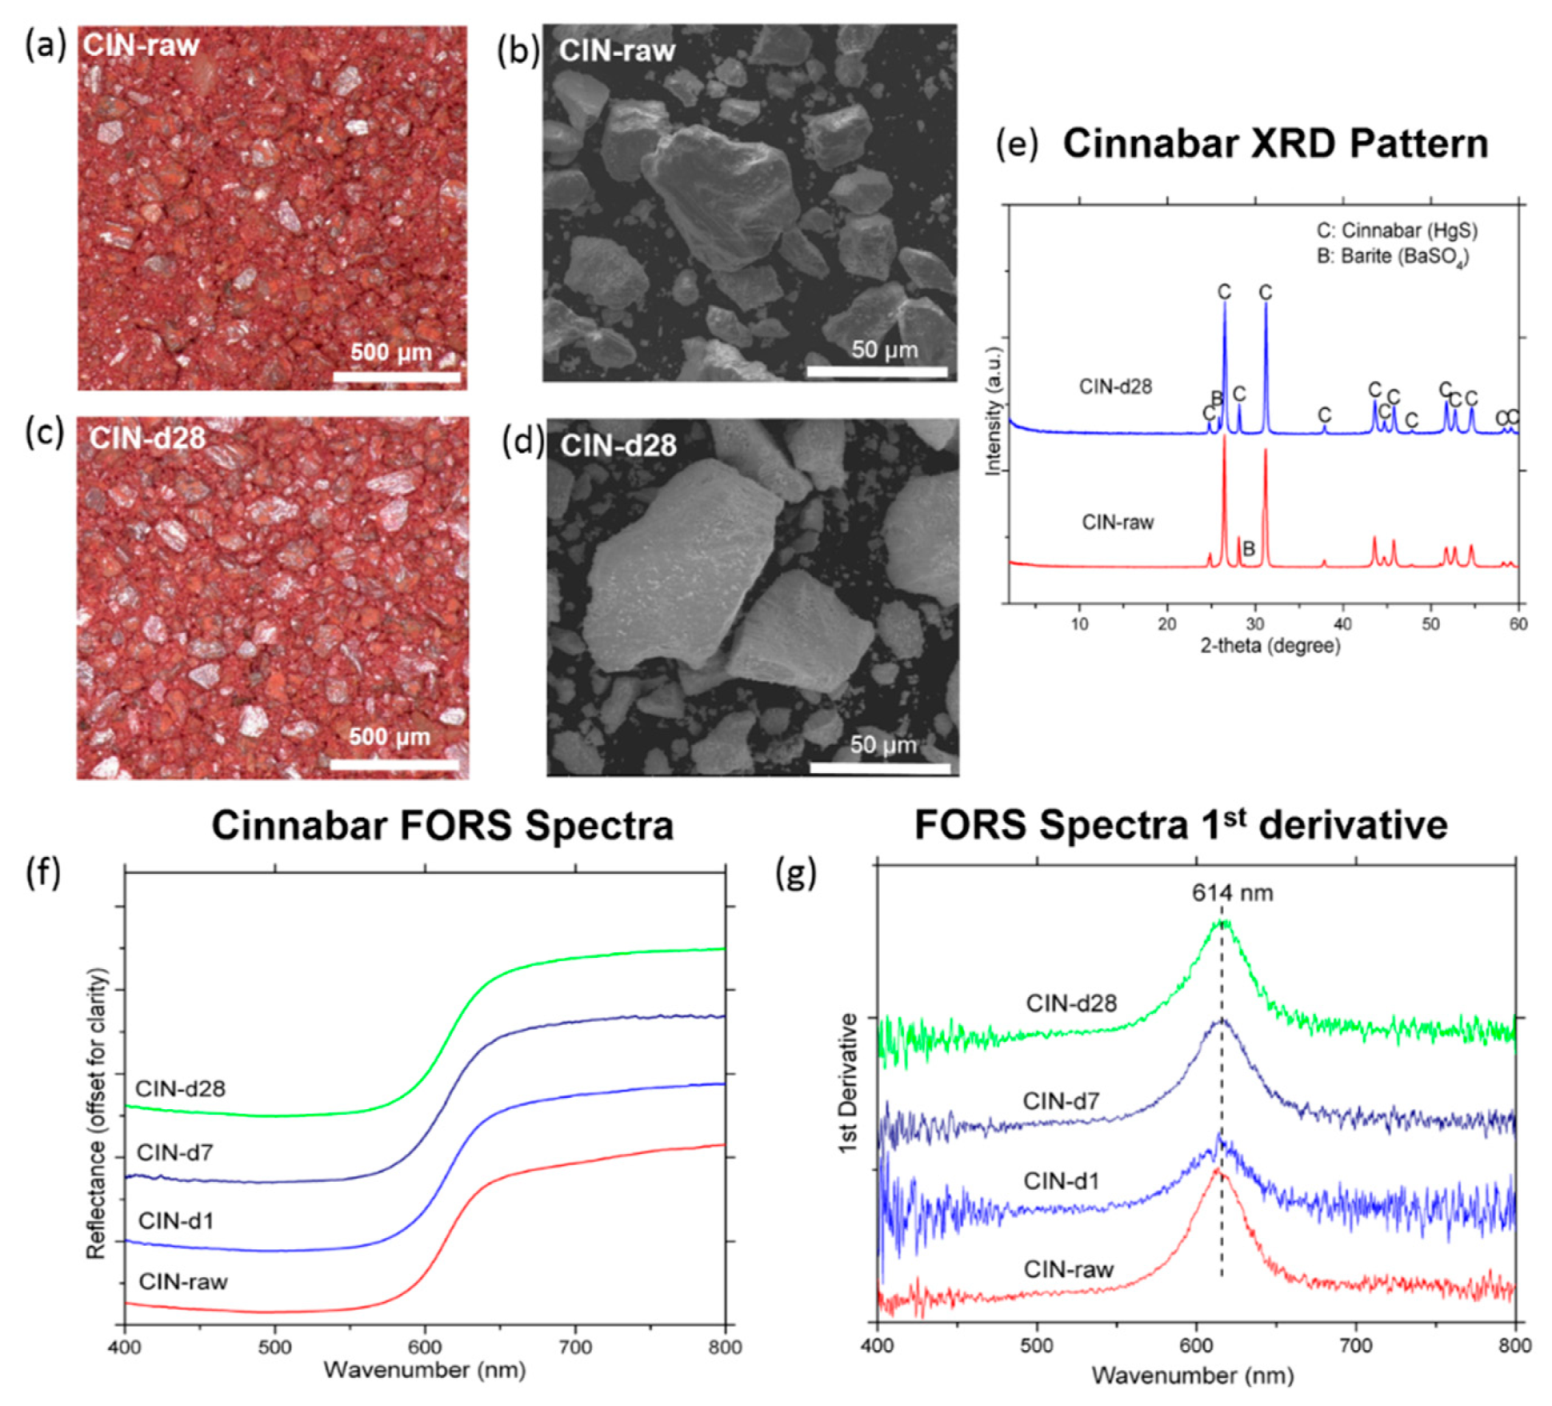
3.1.1. Cinnabar
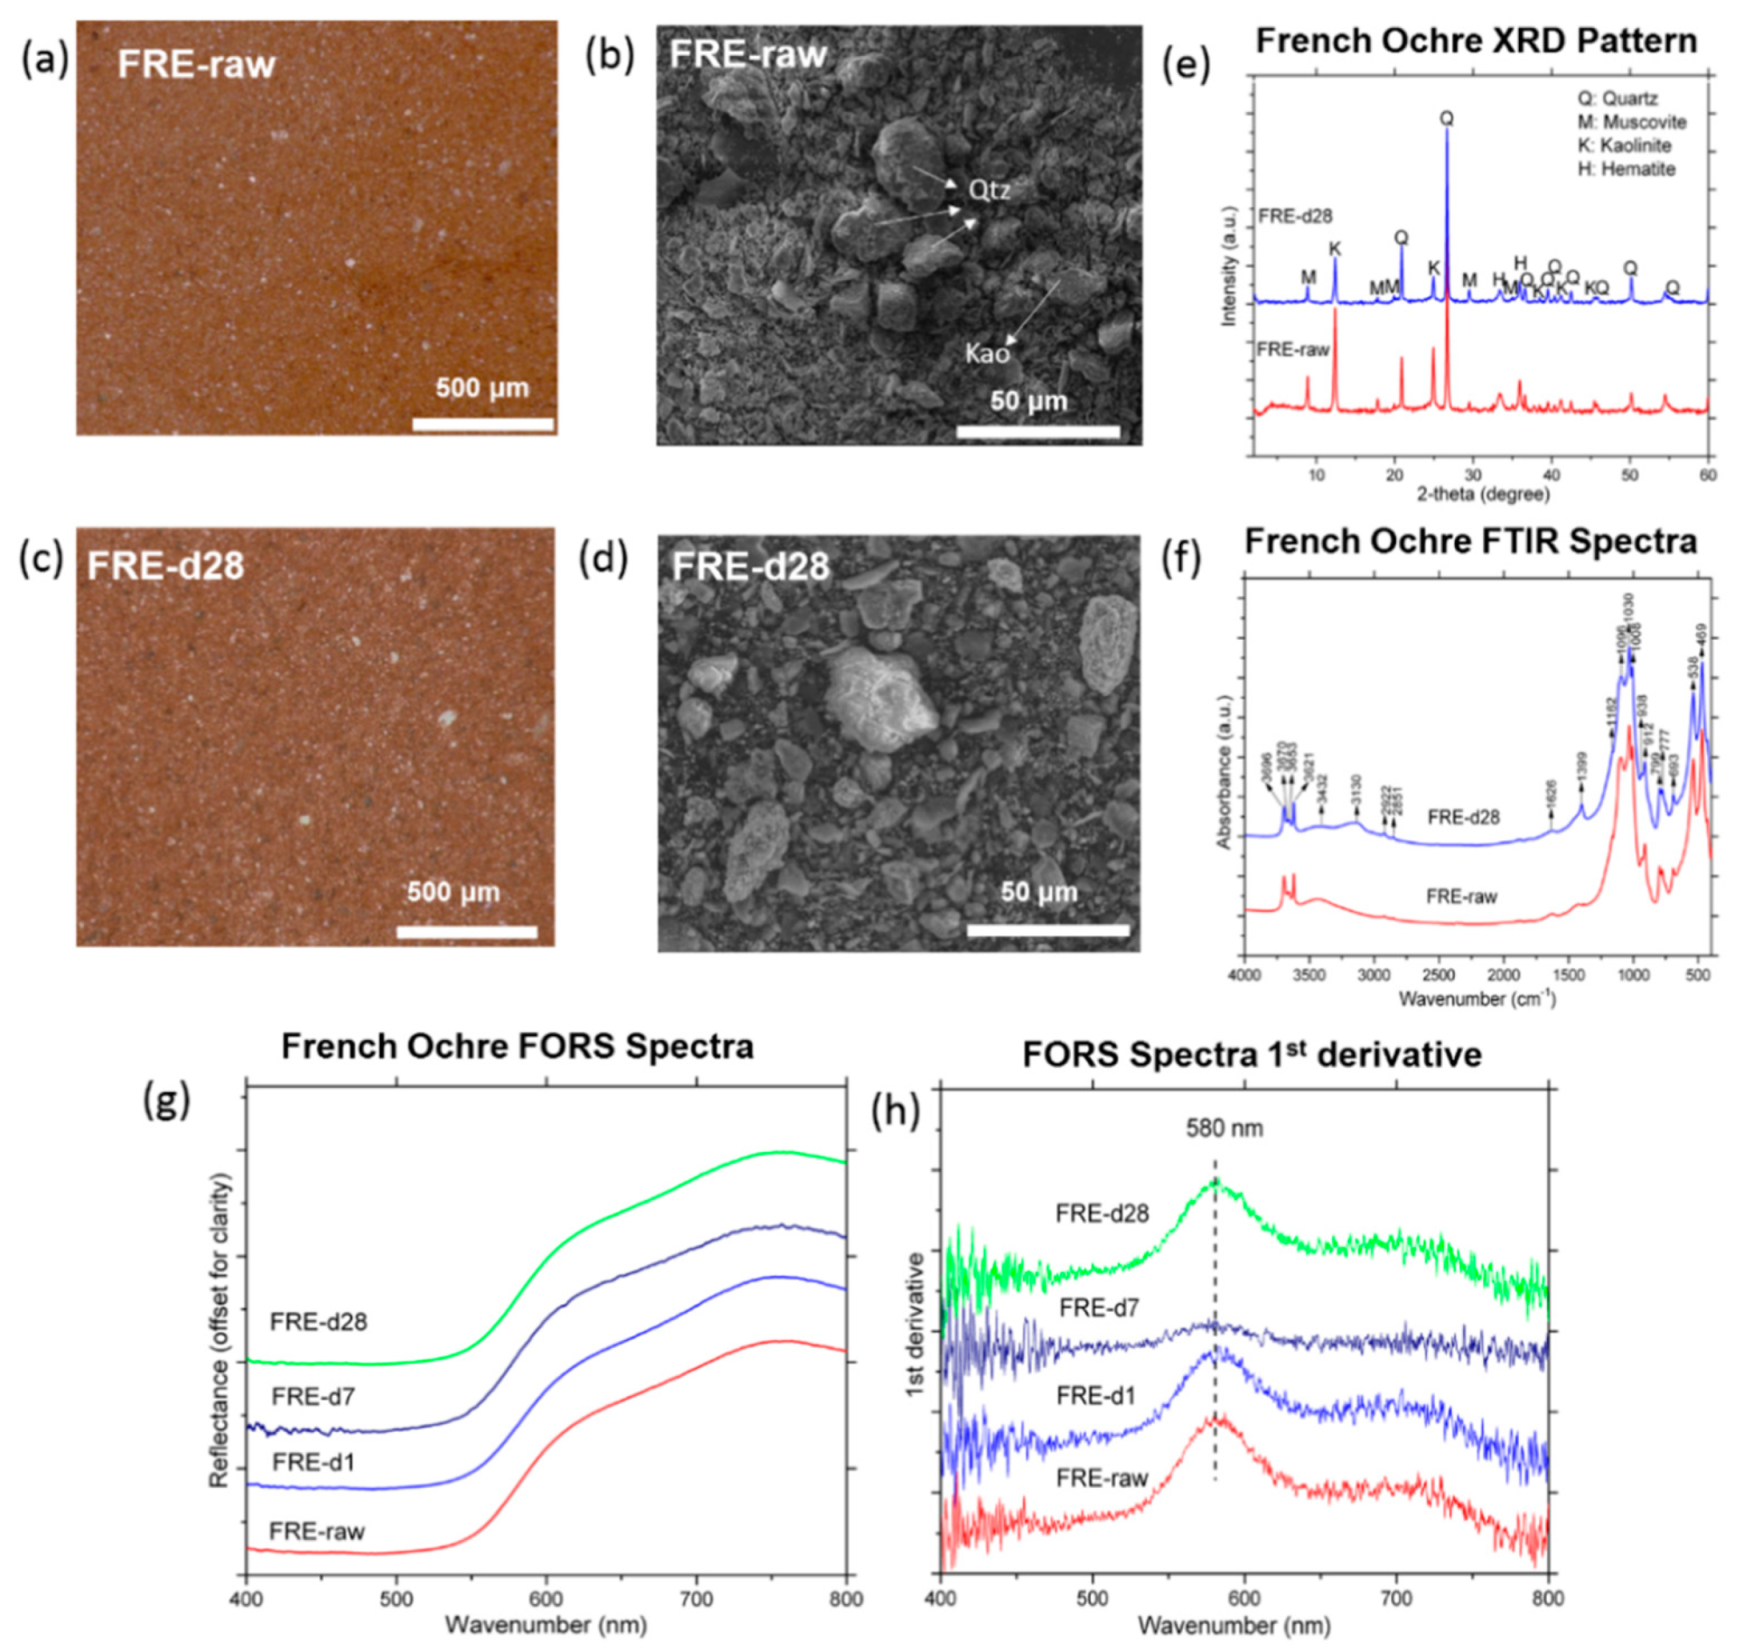
3.1.2. French Ochre
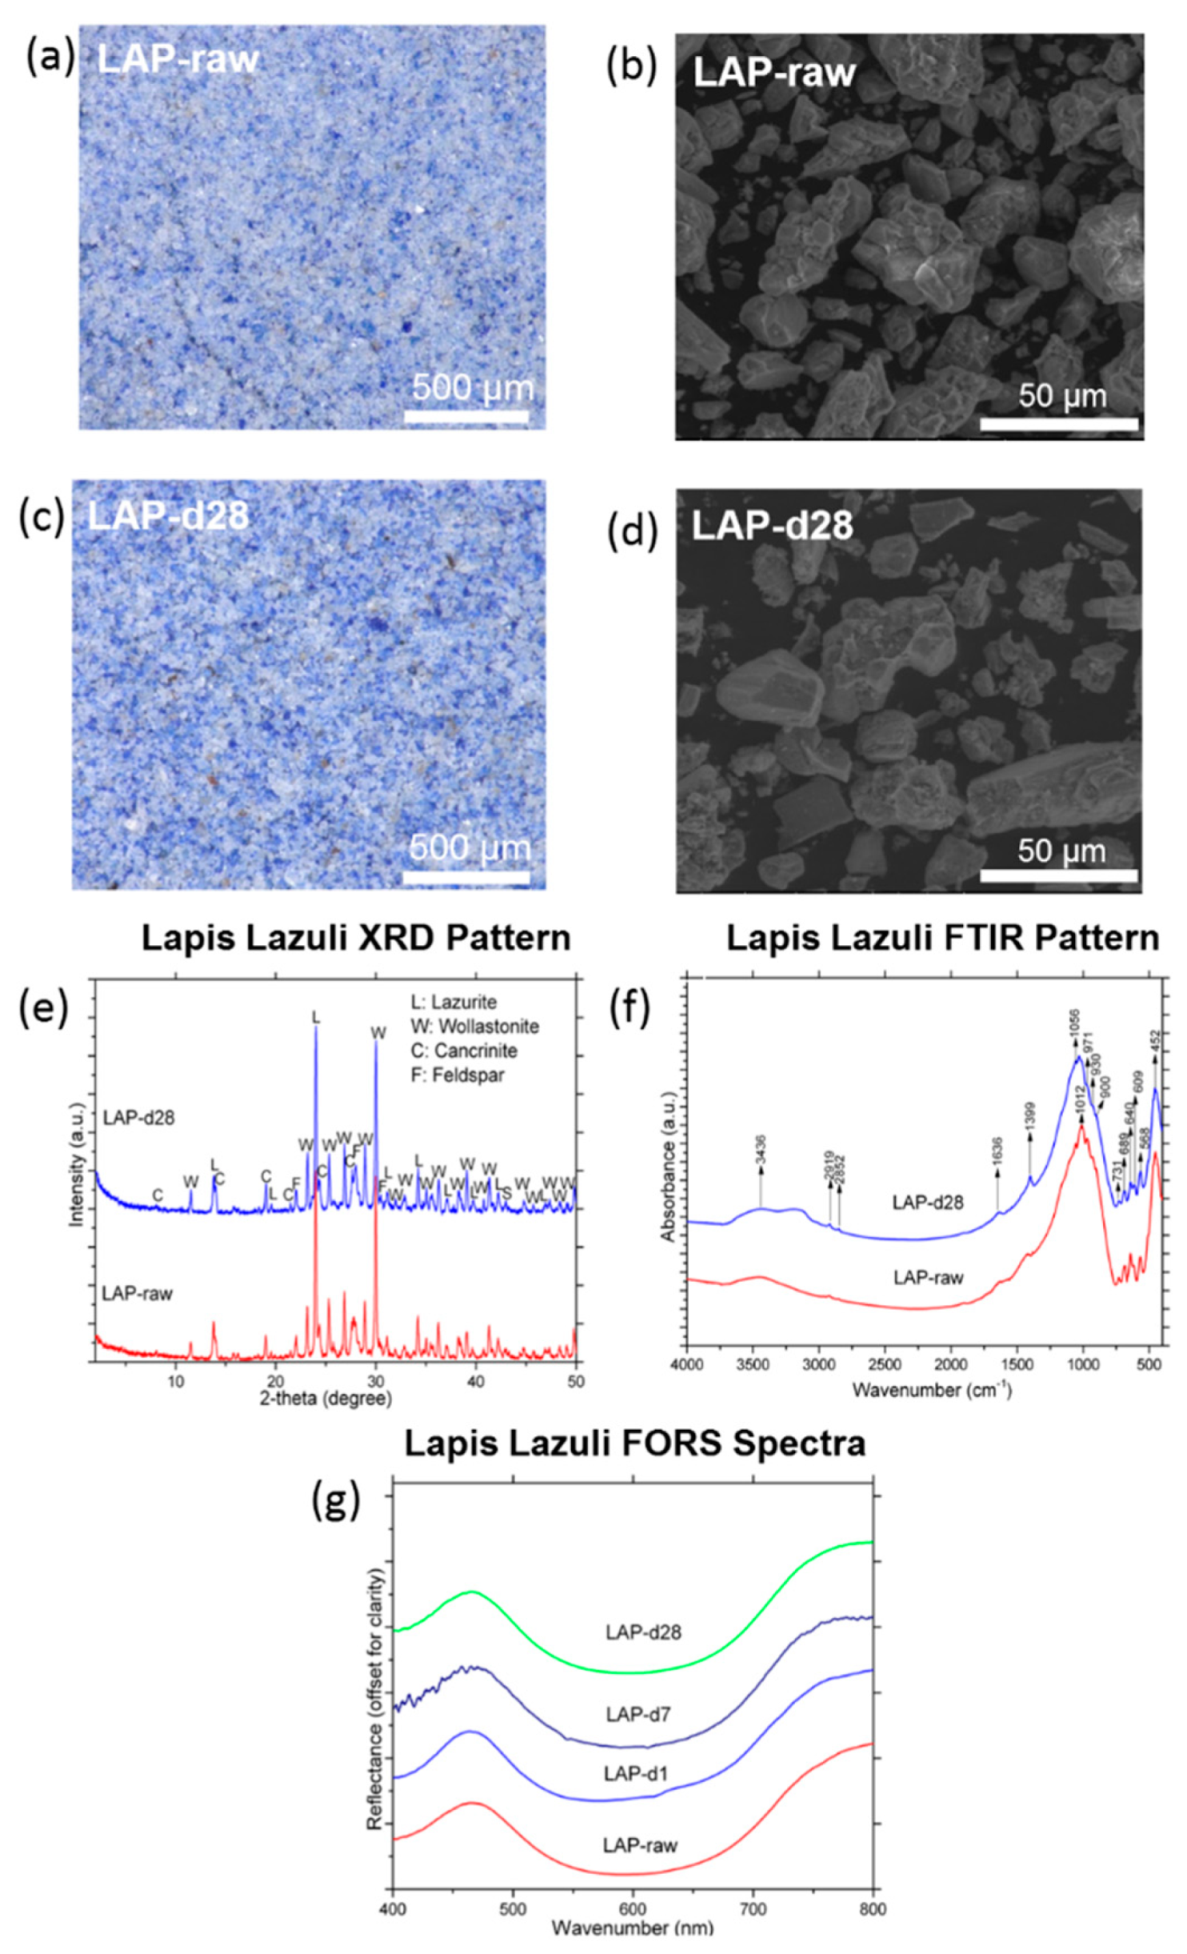
3.1.3. Lapis Lazuli
3.2. Chalk, Sienna, Burnt Umber
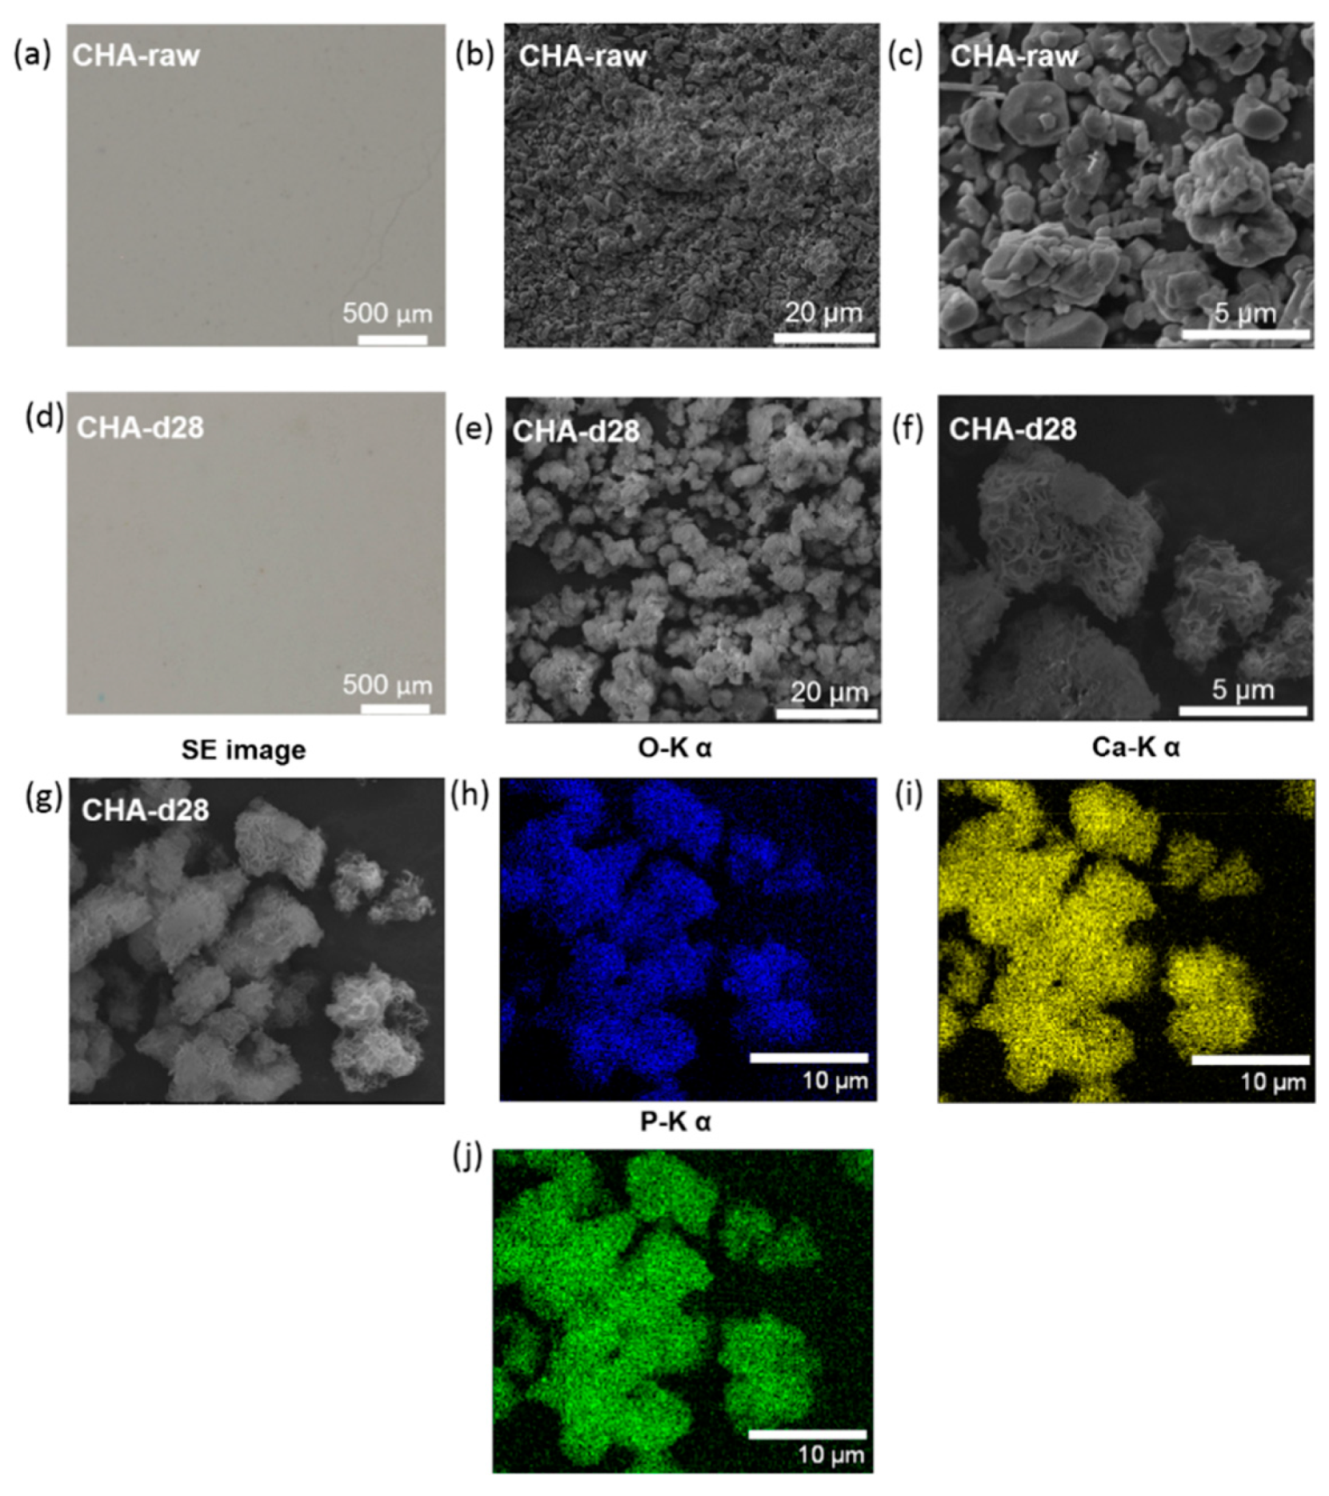
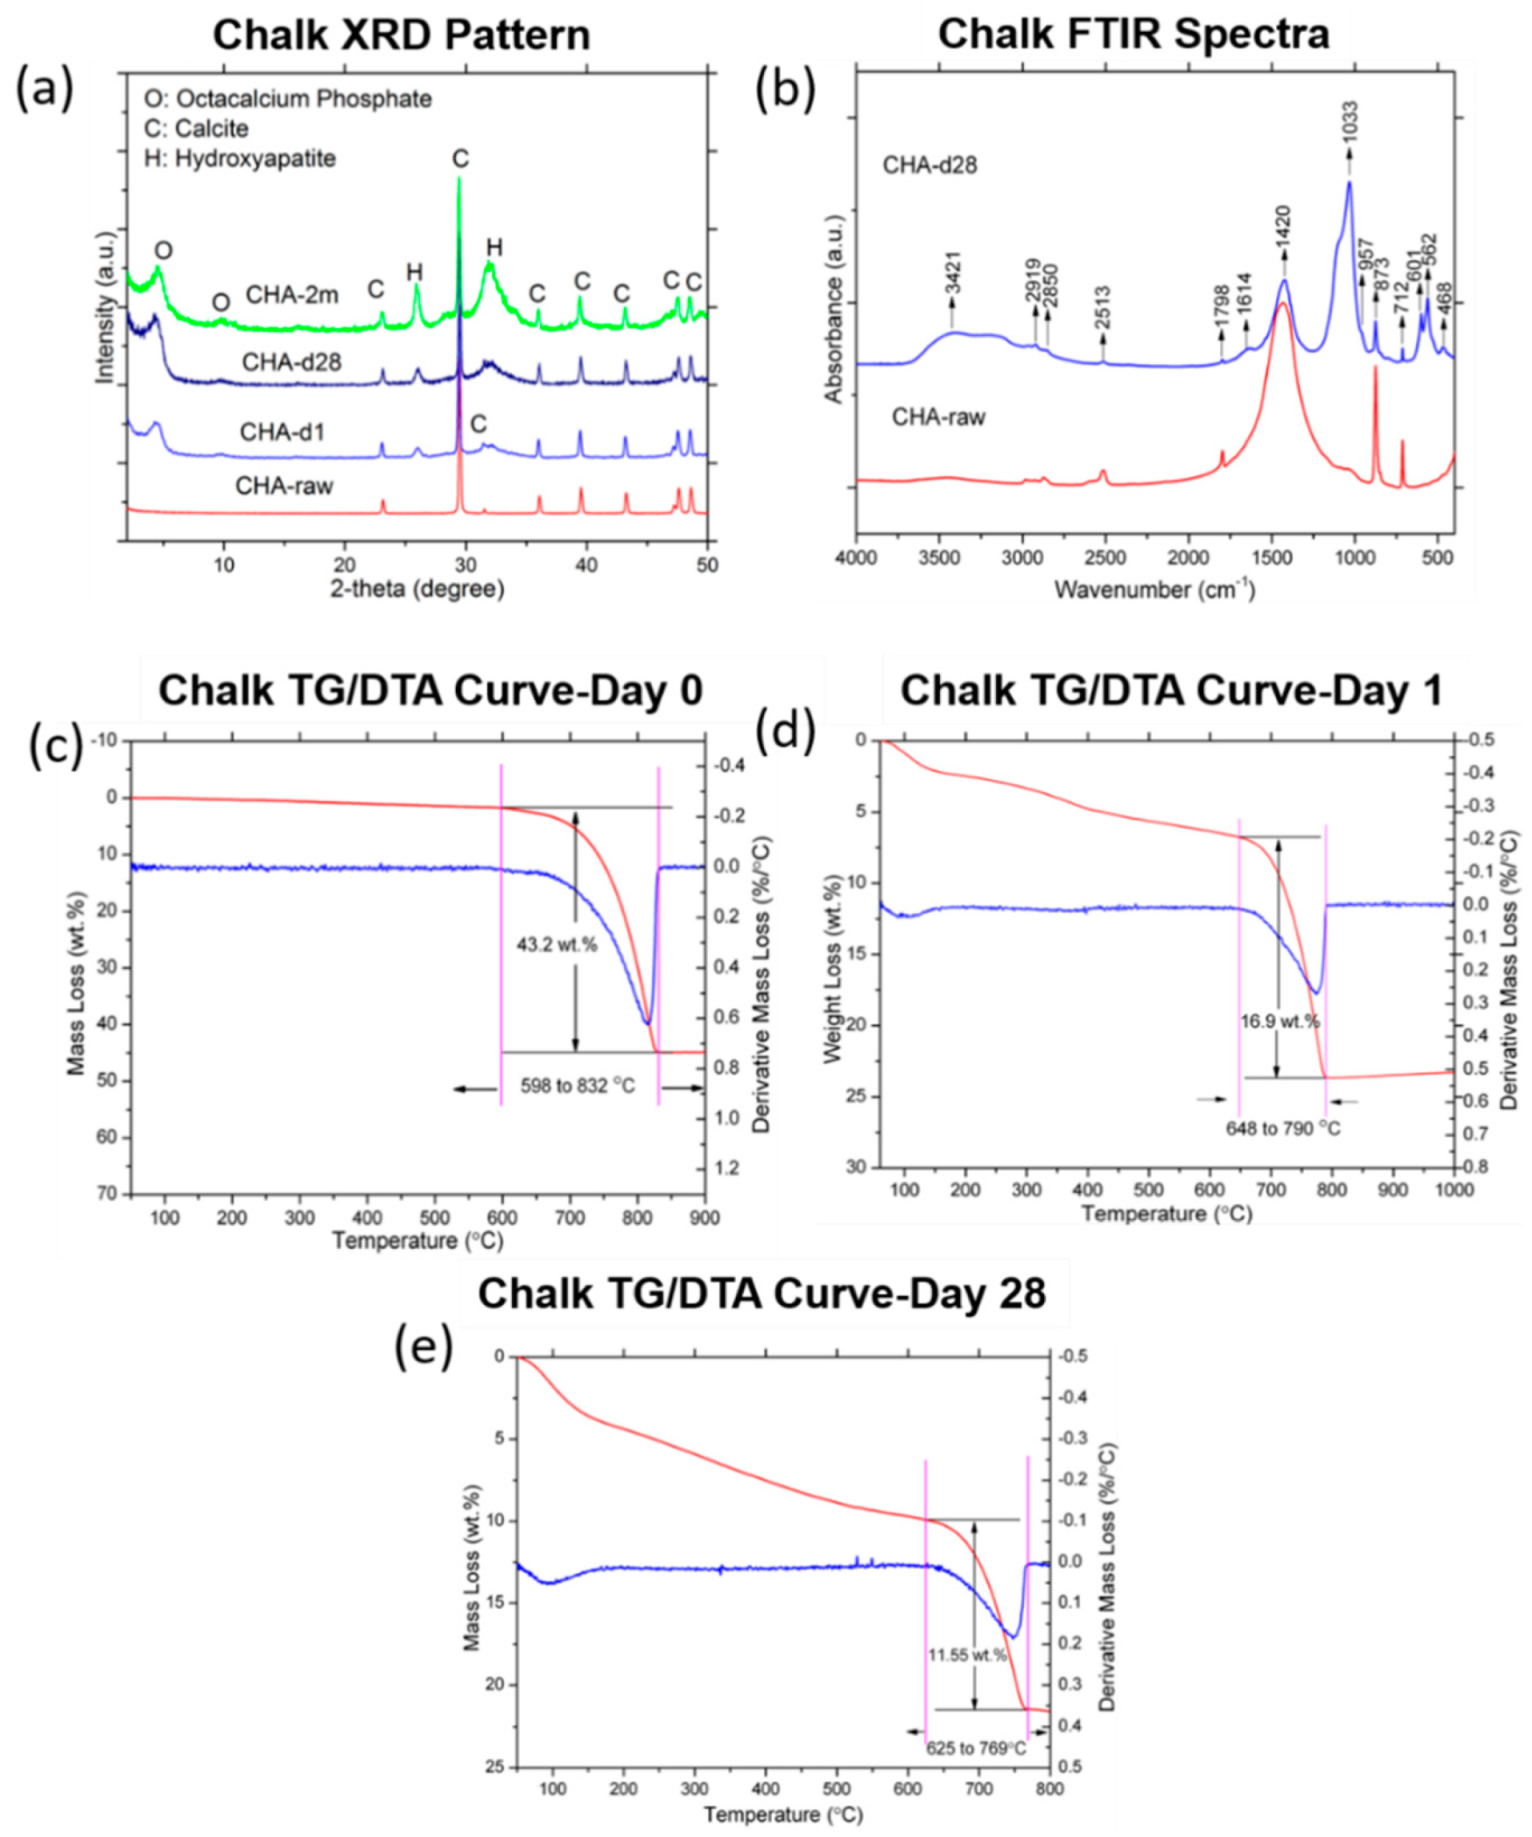
3.2.1. Chalk
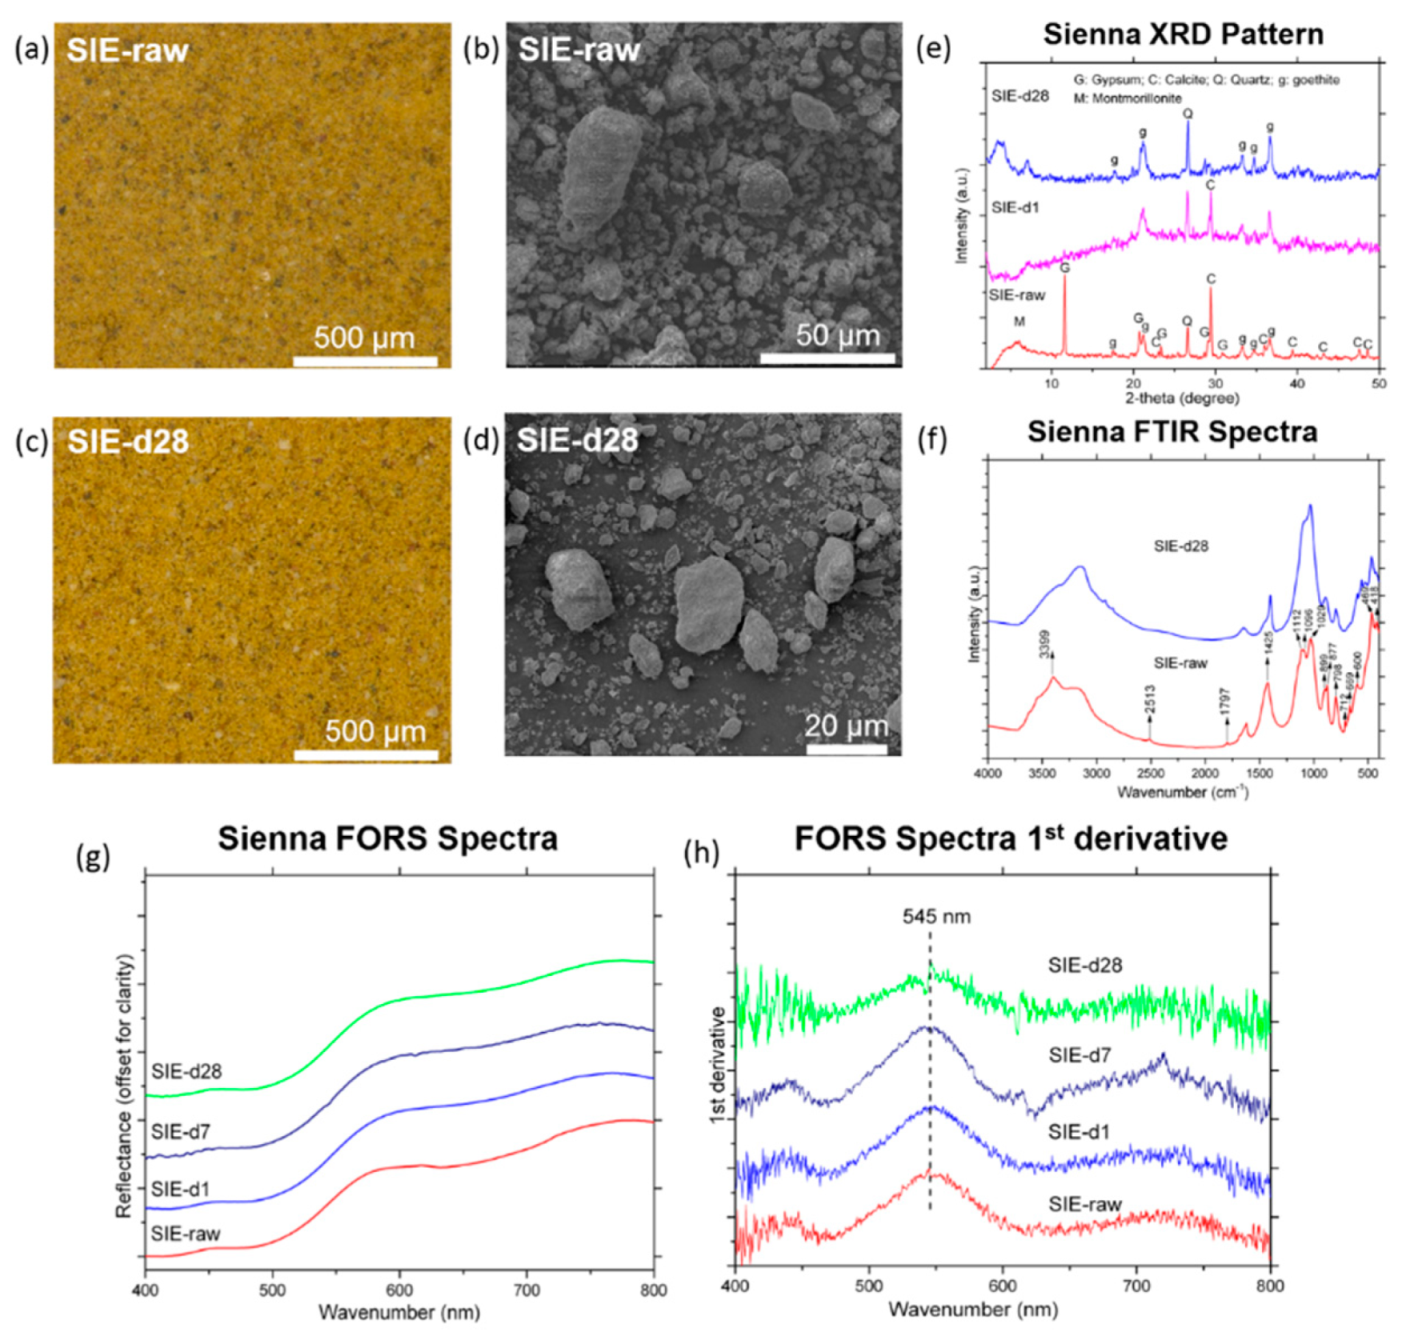
3.2.2. Raw Sienna
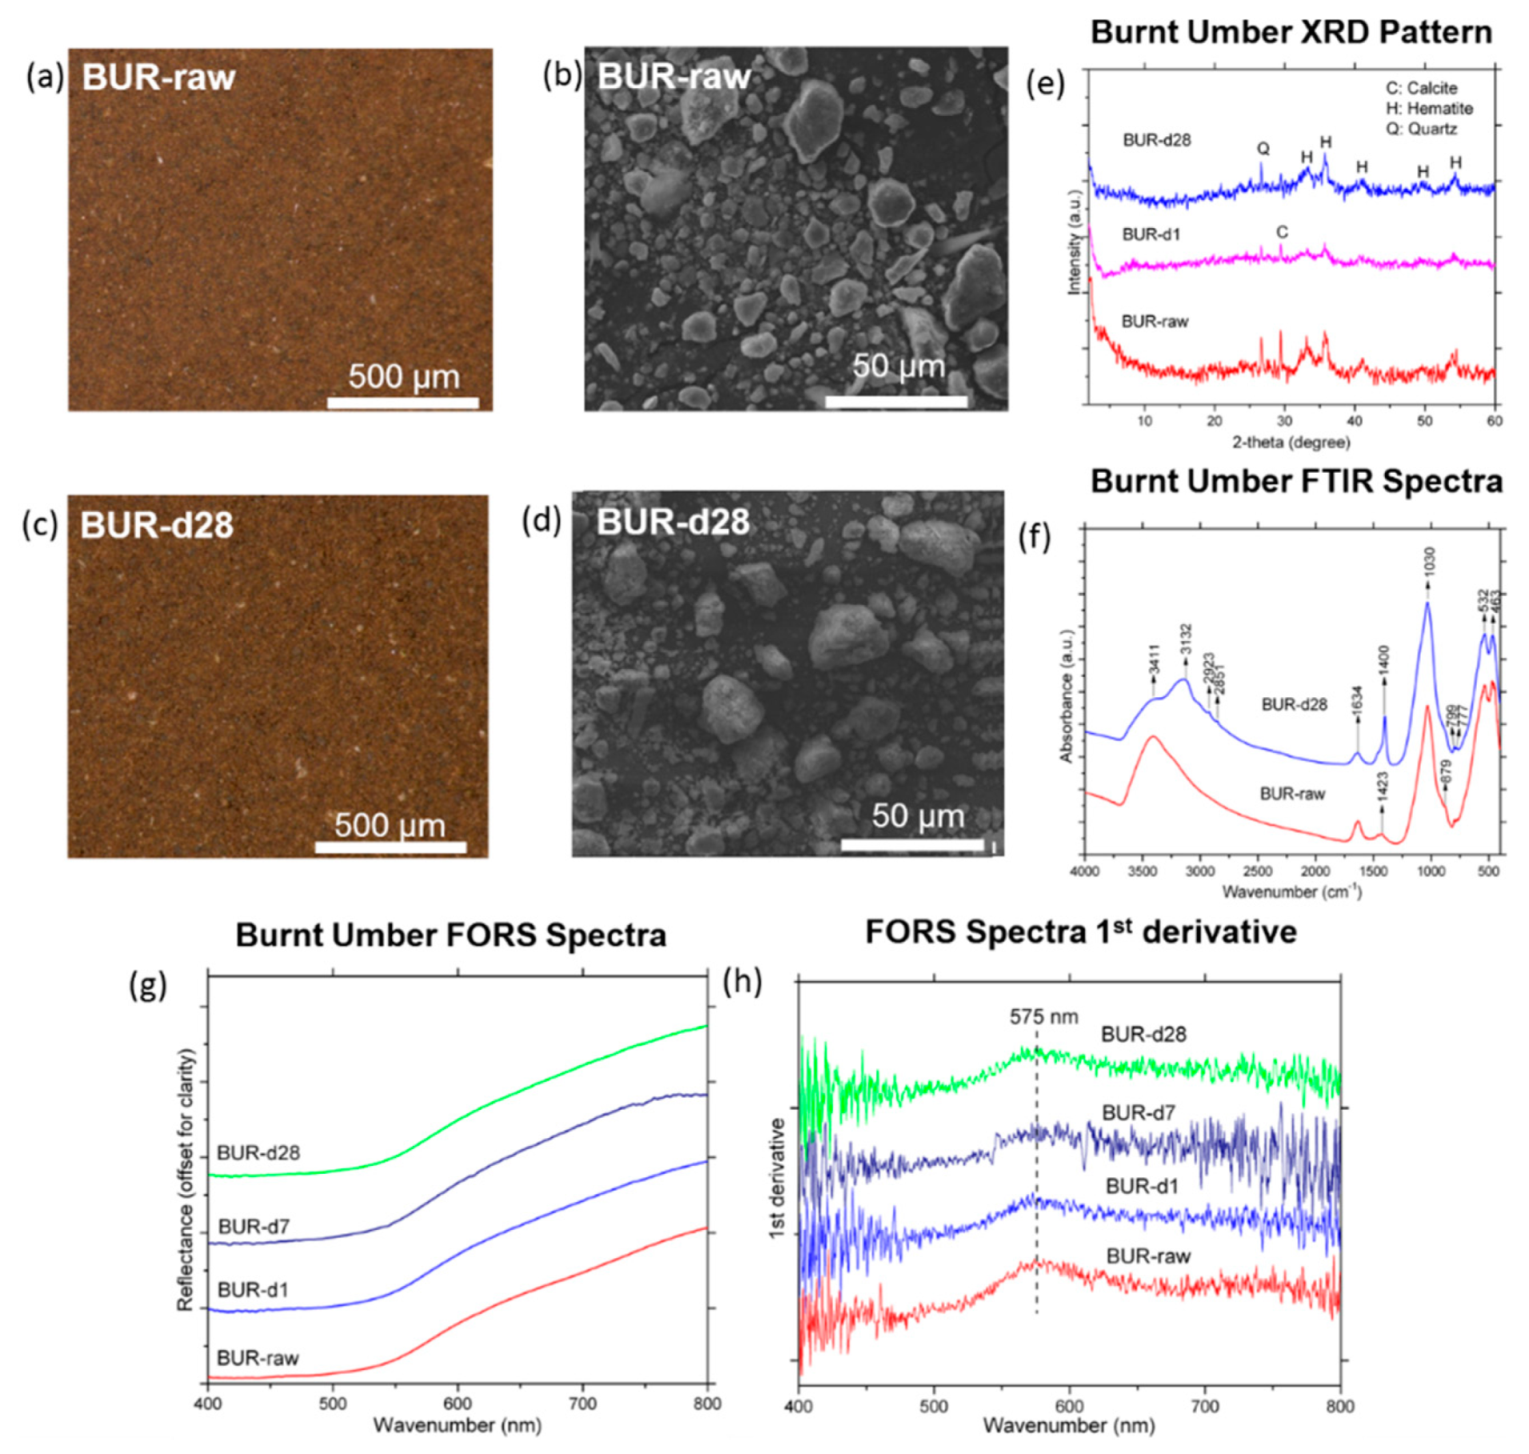
3.2.3. Burnt Umber
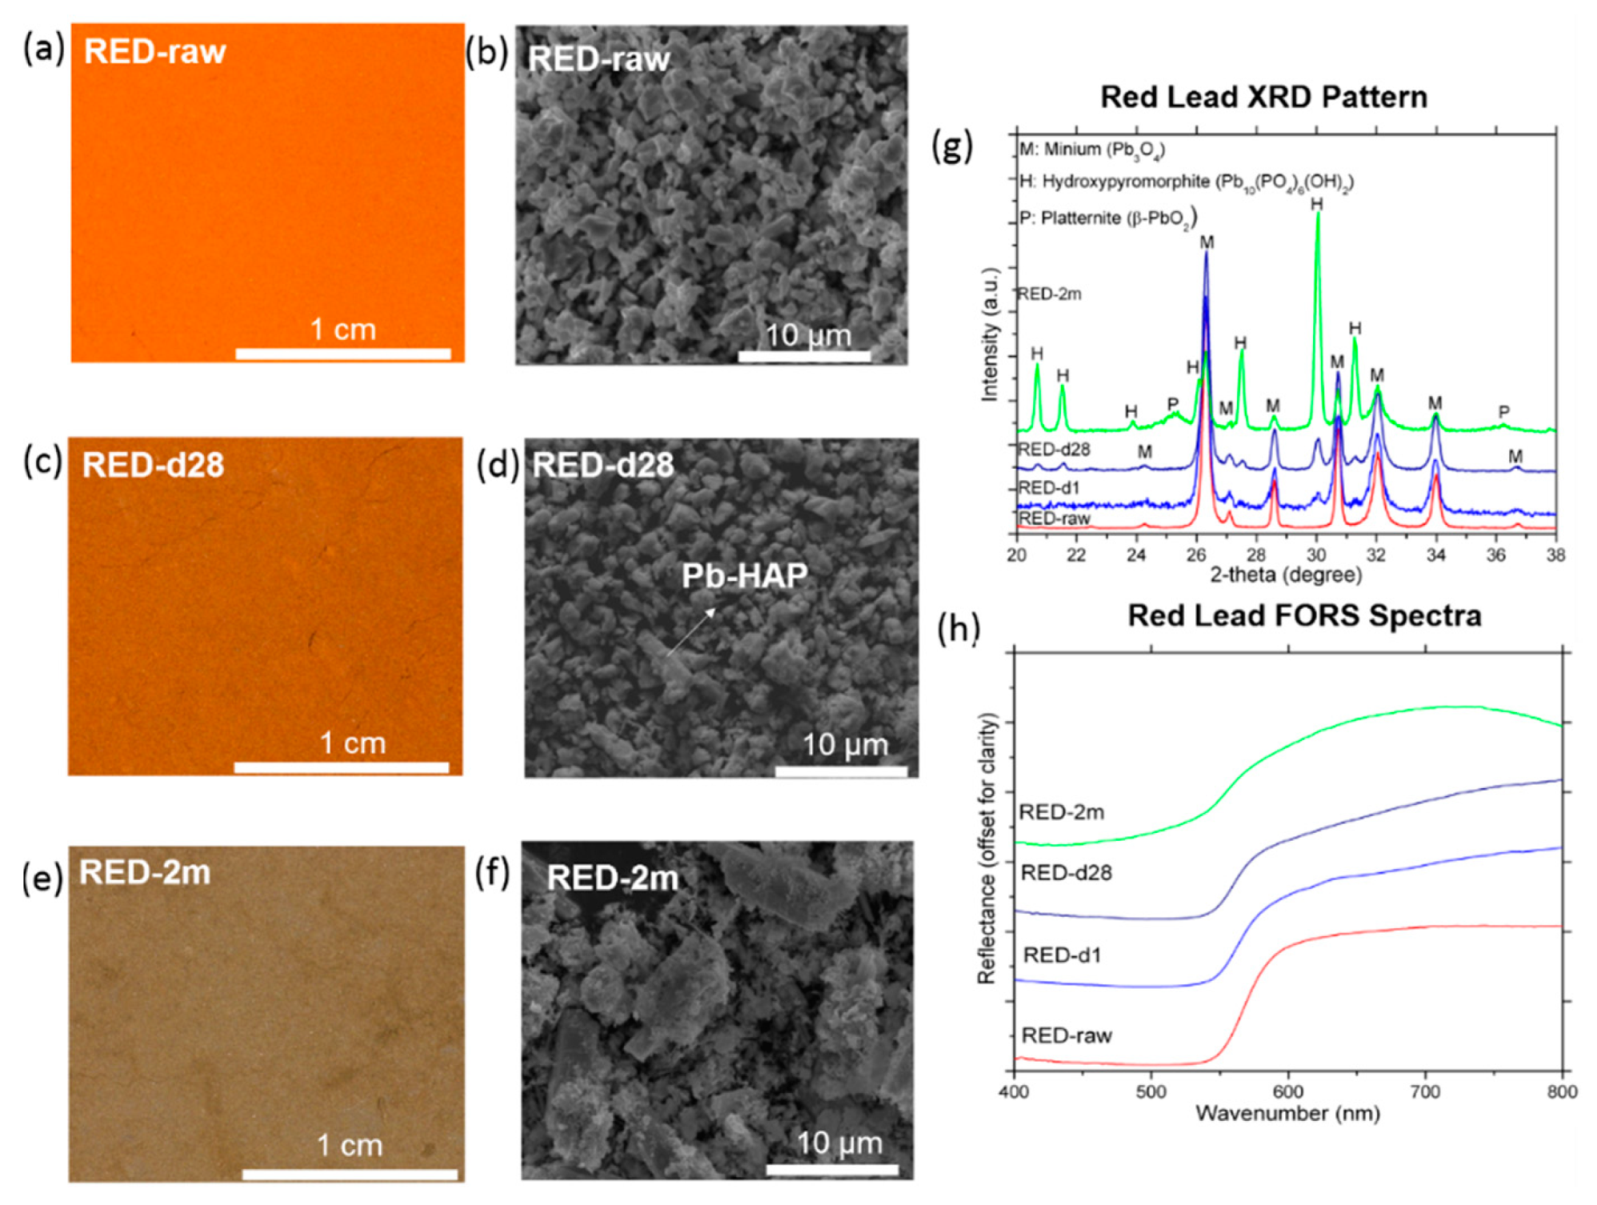
3.3. Red Lead
- (1)
- The unstable PbO2 fragments formed from the dissolution of Pb3O4 are reduced to Pb2+, as suggested by the Reaction 4.
- (2)
- The nucleation of a newly stable β-PbO2 from Pb2+ ions, as suggested by the Reaction 5:
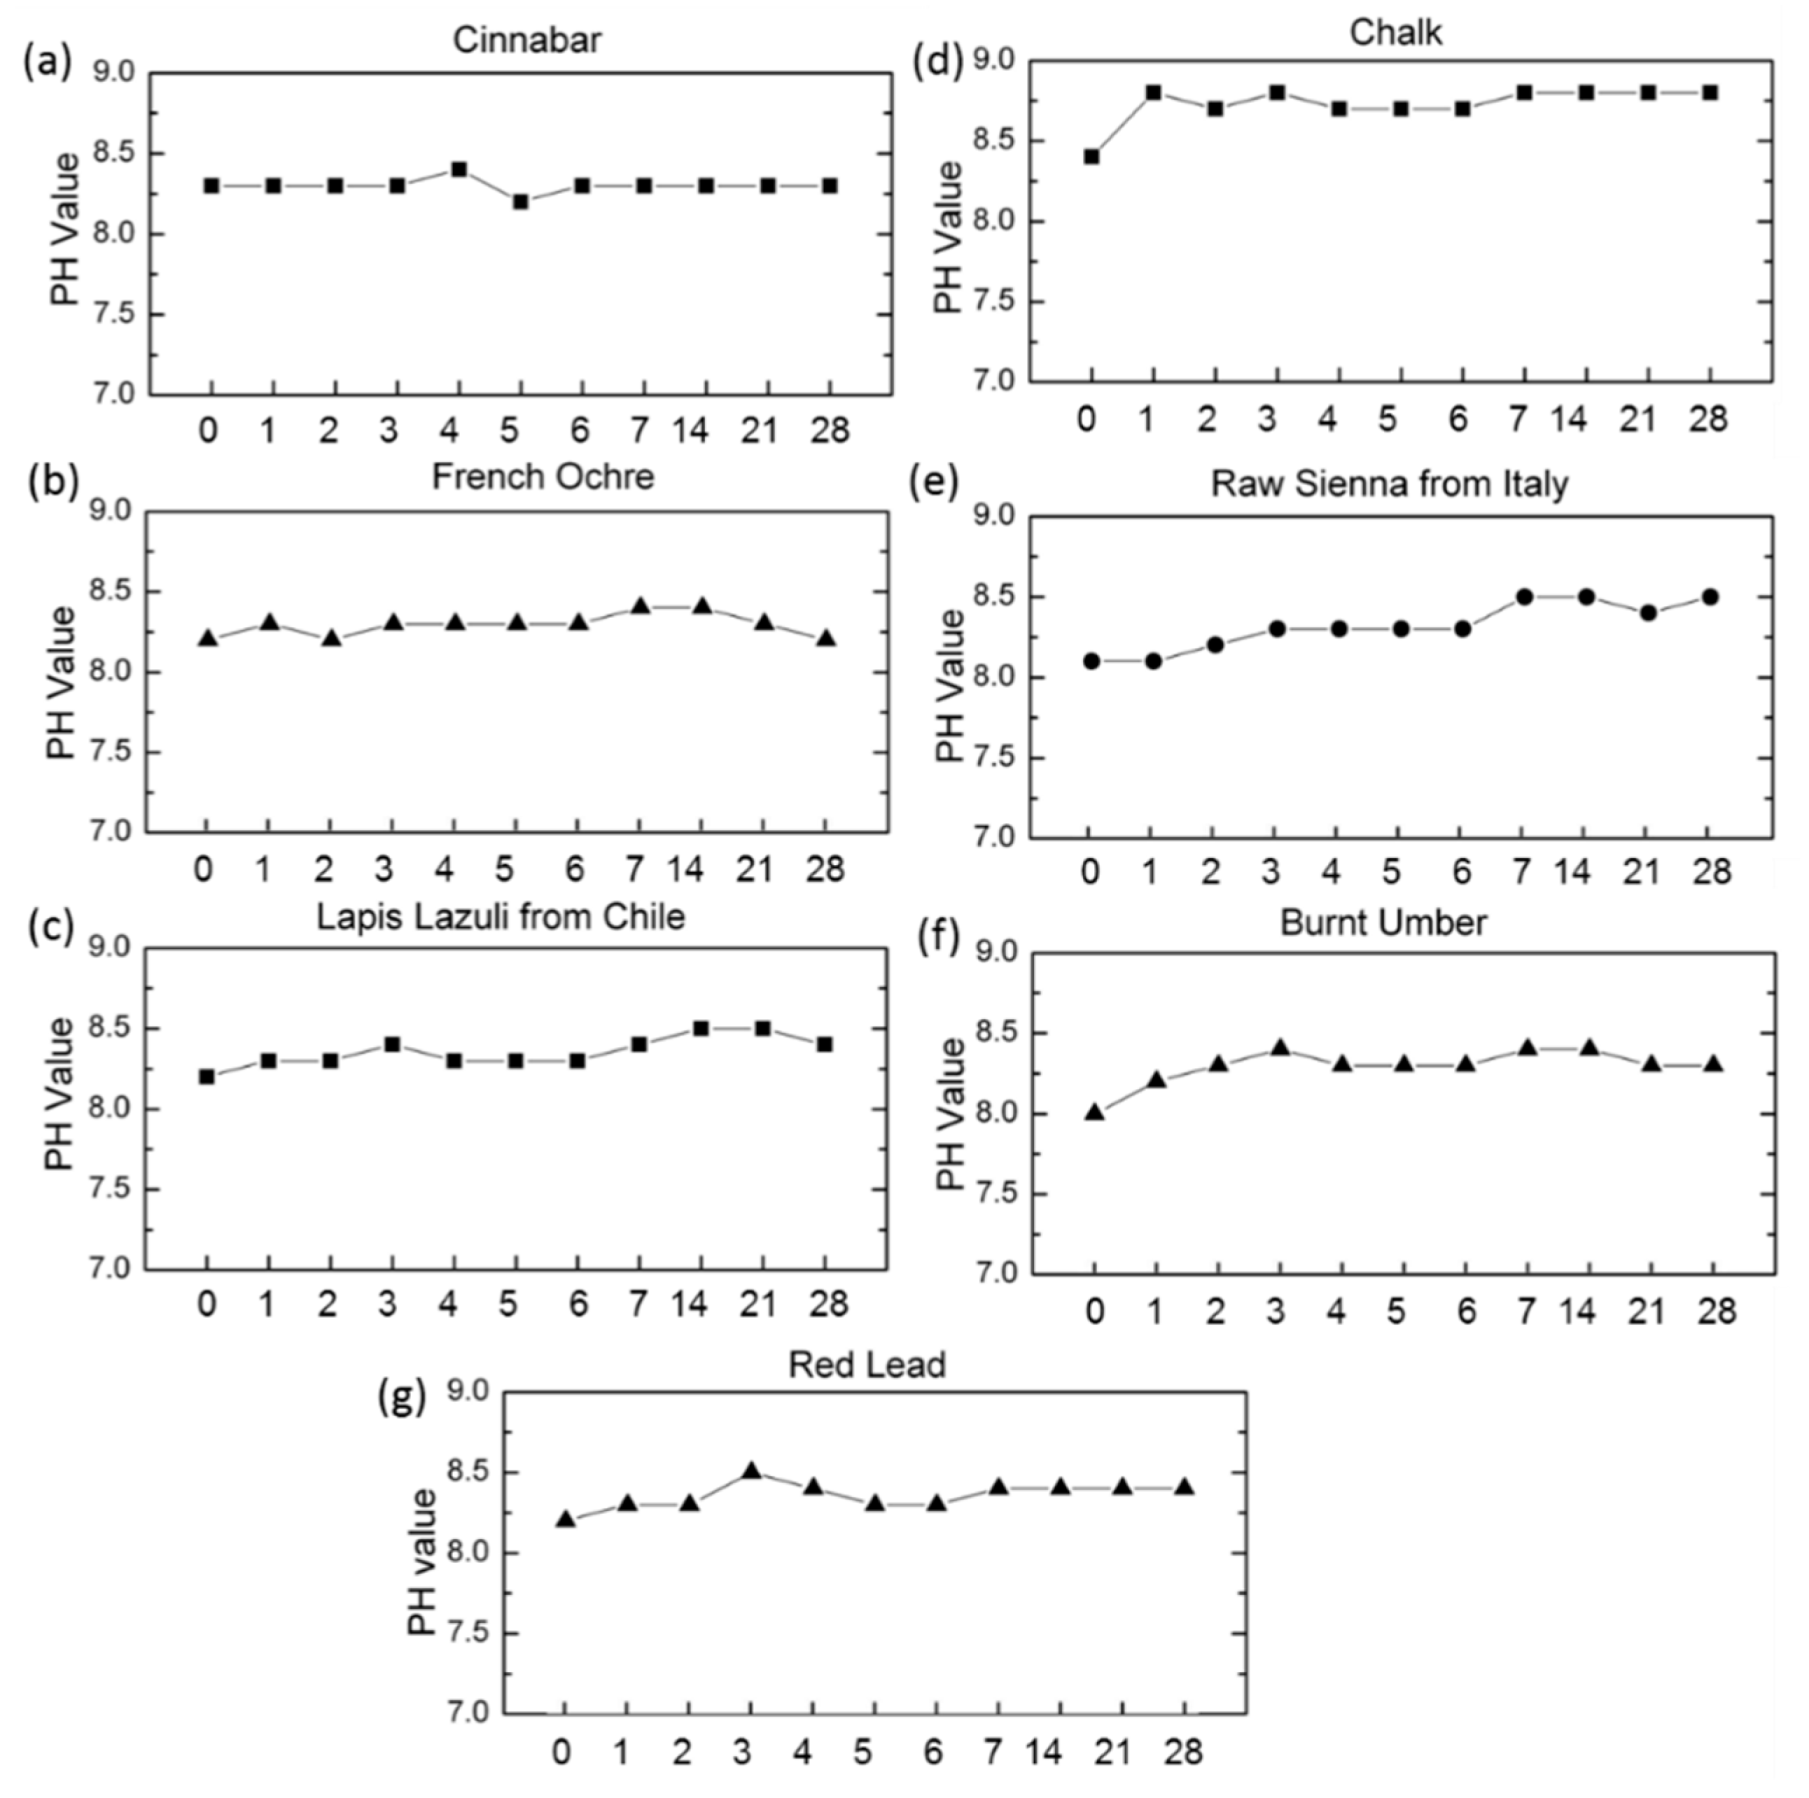
3.4. pH Value of the Supernantant Solutions
3.5. Summary of Color and Phase Changes in the Pigments
4. Conclusions
Author Contributions
Funding
Acknowledgments
Conflicts of Interest
References
- Neiman, M.K.; Balonis, M.; Kakoulli, I. Cinnabar alteration in archaeological wall paintings: An experimental and theoretical approach. Appl. Phys. A 2015, 121, 915–938. [Google Scholar] [CrossRef]
- Al-Emam, E.; El-Gohary, M.; El Hady, M.A. The paint layers of mural paintings at Abydos Temples-Egypt: A closer look at the materials used. Mediterr. Archaeol. Archaeom. 2015, 15, 113–121. [Google Scholar]
- Kamel, A.M.A. Dehydration of gypsum component of plasters and stuccos in some Egyptian archaeological buildings and evaluation of K2SO4 activator as a consolidant. Sci. Cult. 2019, 5, 49–59. [Google Scholar]
- Ferroni, E.; Malaguzzi-Valerj, V.; Rovida, G. Experimental study by diffraction of heterogeneous systems as a preliminary to the proposal of a technique for the restoration of gypsum polluted murals. In Proceedings of the Reports, Plenary Meeting, Amsterdam, Netherlands, 1969-ICOM Committee for Conservation, Amsterdam, The Netherlands, 15–19 September 1969. [Google Scholar]
- Matteini, M. In Review: An Assessment of Florentine Methods of Wall Painting Conservation Based. In The Conservation of Wall Paintings; Getty Conservation Institute: Los Angeles, CA, USA, 1991; pp. 137–148. [Google Scholar]
- Giorgi, R.; Dei, L.; Baglioni, P. A New Method for Consolidating Wall Paintings Based on Dispersions of Lime in Alcohol. Stud. Conserv. 2000, 45, 154–161. [Google Scholar]
- Baglioni, P.; Carretti, E.; Dei, L.; Giorgi, R. Nanotechnology in Wall Painting Conservation; IOS Press Ohmsha: Amsterdam, The Netherlands, 2003. [Google Scholar]
- Baglioni, P.; Giorgi, R. Soft and hard nanomaterials for restoration and conservation of cultural heritage. Soft Matter 2006, 2, 293–303. [Google Scholar] [CrossRef]
- Giorgi, R.; Ambrosi, M.; Toccafondi, N.; Baglioni, P. Nanoparticles for cultural heritage conservation: Calcium and barium hydroxide nanoparticles for wall painting consolidation. Chem. A Eur. J. 2010, 16, 9374–9382. [Google Scholar] [CrossRef] [PubMed]
- Giorgi, R.; Baglioni, M.; Berti, D.; Baglioni, P. New Methodologies for the Conservation of Cultural Heritage: Micellar Solutions, Microemulsions, and Hydroxide Nanoparticles. Acc. Chem. Res. 2010, 43, 695–704. [Google Scholar] [CrossRef] [PubMed]
- Chelazzi, D.; Poggi, G.; Jaidar, Y.; Toccafondi, N.; Giorgi, R.; Baglioni, P. Hydroxide nanoparticles for cultural heritage: Consolidation and protection of wall paintings and carbonate materials. J. Colloid Interface Sci. 2013, 392, 42–49. [Google Scholar] [CrossRef] [PubMed]
- Balonis, M. Mineral Inorganic Treatments. In The Encyclopedia of Archaeological Sciences; Varela, S.L.L., Ed.; Wiley-Blackwell: Hoboken, NJ, USA, 2018. [Google Scholar]
- Borgia, G.C.; Camaiti, M.; Cerri, F.; Fantazzini, P.; Piacenti, F. Hydrophobic Treatments for Stone Conservation: Influence of the Application Method on Penetration, Distribution and Efficiency. Stud. Conserv. 2003, 48, 217–226. [Google Scholar] [CrossRef]
- Liu, Q.; Zhang, B.J. Synthesis and Characterization of a Novel Biomaterial for the Conservation of Historic Stone Buildings and Sculptures. Adv. Mater. Sci. Technol. 2011, 675–677, 317–320. [Google Scholar] [CrossRef]
- Yang, F.; Zhang, B.; Liu, Y.; Wei, G.; Zhang, H.; Chen, W.; Xu, Z. Biomimic conservation of weathered calcareous stones by apatite. New J. Chem. 2011, 35, 887–892. [Google Scholar] [CrossRef]
- Sassoni, E.; Naidu, S.; Scherer, G.W. The use of hydroxyapatite as a new inorganic consolidant for damaged carbonate stones. J. Cult. Herit. 2011, 12, 346–355. [Google Scholar] [CrossRef]
- Sassoni, E.; Naidu, S.; Scherer, G.W. Preliminary results of the use of hydroxyapatite as a consolidant for carbonate stones. In Proceedings of the Materials Research Society Fall Meeting 2010, Boston, MA, USA, 29 November–2 December 2010. [Google Scholar]
- Matteini, M.; Rescic, S.; Fratini, F.; Botticelli, G. Ammonium Phosphates as Consolidating Agents for Carbonatic Stone Materials Used in Architecture and Cultural Heritage: Preliminary Research. Int. J. Archit. Herit. 2011, 5, 717–736. [Google Scholar] [CrossRef]
- Sassoni, E.; Franzoni, E.; Scherer, G.W.; Naidu, S. Consolidation of a porous limestone by means of a new treatment based on hydroxyapatite. In Proceedings of the 12th International Congress on Deterioration and Conservation of Stone, New York, NY, USA, 21–25 October 2012. [Google Scholar]
- Sassoni, E.; Franzoni, E.; Pigino, B.; Scherer, G.W.; Naidu, S. Consolidation of calcareous and siliceous sandstones by hydroxyapatite: Comparison with a TEOS-based consolidant. J. Cult. Herit. 2013, 14, e103–e108. [Google Scholar] [CrossRef]
- Balonis-Sant, M.; Ma, X.; Kakoulli, I. Preliminary Results on Biomimetic Methods Based on Soluble Ammonium Phosphate Precursors for the Consolidation of Archaeological Wall Paintings. In Archaeological Chemistry VIII; ACS Symposium Series; American Chemical Society: Washington, DC, USA, 2013; pp. 420–447. [Google Scholar]
- Sassoni, E.; Franzoni, E. Sugaring marble in the Monumental Cemetery in Bologna (Italy): Characterization of naturally and artificially weathered samples and first results of consolidation by hydroxyapatite. Appl. Phys. A 2014, 117, 1893–1906. [Google Scholar] [CrossRef]
- Sassoni, E.; Graziani, G.; Franzoni, E. Repair of sugaring marble by ammonium phosphate: Comparison with ethyl silicate and ammonium oxalate and pilot application to historic artifact. Mater. Des. 2015, 88, 1145–1157. [Google Scholar] [CrossRef]
- Ma, X.; Balonis, M.; Pasco, H.; Toumazou, M.; Counts, D.; Kakoulli, I. Evaluation of hydroxyapatite effects for the consolidation of a Hellenistic-Roman rock-cut chamber tomb at Athienou-Malloura in Cyprus. Constr. Build. Mater. 2017, 150, 333–344. [Google Scholar] [CrossRef]
- Sassoni, E. Hydroxyapatite and Other Calcium Phosphates for the Conservation of Cultural Heritage: A Review. Materials 2018, 11, 557. [Google Scholar] [CrossRef]
- Kamiya, M.; Hatta, J.; Shimida, E.; Ikuma, Y.; Yoshimura, M.; Monma, H. AFM analysis of initial stage of reaction between calcite and phosphate. Mater. Sci. Eng. B 2004, 111, 226–231. [Google Scholar] [CrossRef]
- Matteini, M. Inorganic treatments for cleaning, consolidation and protection of mural paintings: Tradition and innovation. In Proceedings of the Works of Art&Conservation Science Today, Thessaloniki, Greece, 26–28 November 2010. [Google Scholar]
- Scherer, G.W.; Flatt, R.; Wheeler, G. Materials science research for the conservation of sculpture and monuments. Mrs Bull. 2001, 26, 44–50. [Google Scholar] [CrossRef]
- Wang, Q.; Dove, S.; Shearman, F.; Smirniou, M. Evaluation of methods of chloride ion concentration determination and effectiveness of desalination treatments using sodium hydroxide and alkaline sulphite solutions. Conservator 2008, 31, 67–74. [Google Scholar] [CrossRef]
- Dorozhkin, S.V. Calcium orthophosphates in nature, biology and medicine. Materials 2009, 2, 399–498. [Google Scholar] [CrossRef]
- Lide, D.R. CRC Handbook of Chemistry and Physics, 85th ed.; CRC Press: Boca Raton, FL, USA, 2004. [Google Scholar]
- Mathew, M.; Takagi, S. Structures of Biological Minerals in Dental Research. J. Res. Natl. Inst. Stand. Technol. 2001, 106, 1035–1044. [Google Scholar] [CrossRef]
- Maslen, E.; Streltsov, V.; Streltsova, N.; Ishizawa, N. Electron density and optical anisotropy in rhombohedral carbonates. III. Synchrotron X-ray studies of CaCO3, MgCO3 and MnCO3. Acta Crystallogr. Sect. B Struct. Sci. 1995, 51, 929–939. [Google Scholar] [CrossRef]
- Chow, L. Solubility of calcium phosphates. In Octacalcium Phosphate; Karger Publishers: Berlin, Germany, 2001; Volume 18, pp. 94–111. [Google Scholar]
- Eighmy, T.T.; Eusden, J.D. Phosphate stabilization of municipal solid waste combustion residues: Geochemical principles. Geol. Soc. Lond. Spec. Publ. 2004, 236, 435–473. [Google Scholar] [CrossRef]
- Valsami-Jones, E.; Ragnarsdottir, K.; Putnis, A.; Bosbach, D.; Kemp, A.; Cressey, G. The dissolution of apatite in the presence of aqueous metal cations at pH 2–7. Chem. Geol. 1998, 151, 215–233. [Google Scholar] [CrossRef]
- Chou, L.; Garrels, R.M.; Wollast, R. Comparative study of the kinetics and mechanisms of dissolution of carbonate minerals. Chem. Geol. 1989, 78, 269–282. [Google Scholar] [CrossRef]
- Salama, K.K.; Ali, M.F.; El-Sheikh, S.M. The different influence on nano materials on pigments. Sci. Cult. 2018, 4, 1–7. [Google Scholar]
- McLaren, K. XIII—The development of the CIE 1976 (L* a* b*) uniform colour space and colour-difference formula. J. Soc. Dye. Colour. 1976, 92, 338–341. [Google Scholar] [CrossRef]
- Wojciech Mokrzycki, M.T. Color difference Delta E—A survey. Mach. Graph. Vis. 2011, 20, 383–411. [Google Scholar]
- Miliani, C.; Velo-Simpson, M.L.; Scherer, G.W. Particle-modified consolidants: A study on the effect of particles on sol–gel properties and consolidation effectiveness. J. Cult. Herit. 2007, 8, 1–6. [Google Scholar] [CrossRef]
- Sasse, H.R.; Snethlage, R. Methods for the Evaluation of Stone Conservation Treatments. In Report of Dahlem Workshop on Saving our Architectural Heritage-Conservation of Historic Stone Structures; Baer, N.S., Snethlage, R., Eds.; John Wiley & Sons: Berlin, Germany, 1996; pp. 223–227. [Google Scholar]
- Duchêne, S.; Detalle, V.; Favaro, M.; Ossola, F.; Tomasin, P.; De Zorzi, C.; El Habra, N. Nanomaterials for consolidation of marble and wall paintings. In Proceedings of the 12th International Congress on the Deterioration and Conservation of Stone, New York, NY, USA, 22–26 October 2012. [Google Scholar]
- Natali, I.; Tomasin, P.; Becherini, F.; Bernardi, A.; Ciantelli, C.; Favaro, M.; Favoni, O.; Pérez, V.J.F.; Olteanu, I.D.; Sanchez, M.D.R. Innovative consolidating products for stone materials: Field exposure tests as a valid approach for assessing durability. Herit. Sci. 2015, 3, 6. [Google Scholar] [CrossRef]
- Martinez, P.; Soto, M.; Zunino, F.; Stuckrath, C.; Lopez, M. Effectiveness of tetra-ethyl-ortho-silicate (TEOS) consolidation of fired-clay bricks manufactured with different calcination temperatures. Constr. Build. Mater. 2016, 106, 209–217. [Google Scholar] [CrossRef]
- Becherini, F.; Durante, C.; Bourguignon, E.; Vigni, M.L.; Detalle, V.; Bernardi, A.; Tomasin, P. Aesthetic compatibility assessment of consolidants for wall paintings by means of multivariate analysis of colorimetric data. Chem. Cent. J. 2018, 12, 98. [Google Scholar] [CrossRef] [PubMed]
- Bourguignon, E.; Tomasin, P.; Detalle, V.; Vallet, J.-M.; Labouré, M.; Olteanu, I.; Favaro, M.; Chiurato, M.A.; Bernardi, A.; Becherini, F. Calcium alkoxides as alternative consolidants for wall paintings: Evaluation of their performance in laboratory and on site, on model and original samples, in comparison to conventional products. J. Cult. Herit. 2018, 29, 54–66. [Google Scholar] [CrossRef]
- García, O.; Malaga, K. Definition of the procedure to determine the suitability and durability of an anti-graffiti product for application on cultural heritage porous materials. J. Cult. Herit. 2012, 13, 77–82. [Google Scholar] [CrossRef]
- Aceto, M.; Agostino, A.; Fenoglio, G.; Idone, A.; Gulmini, M.; Picollo, M.; Ricciardi, P.; Delaney, J.K. Characterisation of colourants on illuminated manuscripts by portable fibre optic UV-visible-NIR reflectance spectrophotometry. Anal. Methods 2014, 6, 1488–1500. [Google Scholar] [CrossRef]
- Bougeard, D.; Smirnov, K.S.; Geidel, E. Vibrational spectra and structure of kaolinite: A computer simulation study. J. Phys. Chem. B 2000, 104, 9210–9217. [Google Scholar] [CrossRef]
- Genestar, C.; Pons, C. Earth pigments in painting: Characterisation and differentiation by means of FTIR spectroscopy and SEM-EDS microanalysis. Anal. Bioanal. Chem. 2005, 382, 269–274. [Google Scholar] [CrossRef]
- Spence, A.; Kelleher, B.P. FT-IR spectroscopic analysis of kaolinite–microbial interactions. Vib. Spectrosc. 2012, 61, 151–155. [Google Scholar] [CrossRef]
- Muüller, C.M.; Molinelli, A.; Karlowatz, M.; Aleksandrov, A.; Orlando, T.; Mizaikoff, B. Infrared attenuated total reflection spectroscopy of quartz and silica micro-and nanoparticulate films. J. Phys. Chem. C 2011, 116, 37–43. [Google Scholar] [CrossRef]
- Müller, C.M.; Pejcic, B.; Esteban, L.; Delle Piane, C.; Raven, M.; Mizaikoff, B. Infrared attenuated total reflectance spectroscopy: An innovative strategy for analyzing mineral components in energy relevant systems. Sci. Rep. 2014, 4, 6764. [Google Scholar] [CrossRef]
- Saikia, B.J.; Parthasarathy, G.; Sarmah, N. Fourier transform infrared spectroscopic estimation of crystallinity in SiO2 based rocks. Bull. Mater. Sci. 2008, 31, 775–779. [Google Scholar] [CrossRef]
- Bikiaris, D.; Daniilia, S.; Sotiropoulou, S.; Katsimbiri, O.; Pavlidou, E.; Moutsatsou, A.; Chryssoulakis, Y. Ochre-differentiation through micro-Raman and micro-FTIR spectroscopies: Application on wall paintings at Meteora and Mount Athos, Greece. Spectrochim. Acta Part A Mol. Biomol. Spectrosc. 2000, 56, 3–18. [Google Scholar] [CrossRef]
- Gautier, M.; Muller, F.; Le Forestier, L.; Beny, J.-M.; Guégan, R. NH4-smectite: Characterization, hydration properties and hydro mechanical behaviour. Appl. Clay Sci. 2010, 49, 247–254. [Google Scholar] [CrossRef]
- Pironon, J.; Pelletier, M.; De Donato, P.; Mosser-Ruck, R. Characterization of smectite and illite by FTIR spectroscopy of interlayer NH4+ cations. Clay Miner. 2003, 38, 201–211. [Google Scholar] [CrossRef]
- Mortland, M.; Fripiat, J.; Chaussidon, J.; Uytterhoeven, J. Interaction between ammonia and the expanding lattices of montmorillonite and vermiculite. J. Phys. Chem. 1963, 67, 248–258. [Google Scholar] [CrossRef]
- Elias, M.; Chartier, C.; Prévot, G.; Garay, H.; Vignaud, C. The colour of ochres explained by their composition. Mater. Sci. Eng. B 2006, 127, 70–80. [Google Scholar] [CrossRef]
- Dai, Q.; Dong, F.; Zhao, Y.; Deng, J.; Lu, J. Reciprocity effect between silicate bacterium and wollastonite. In Proceedings of the 11th International Congress for Applied Mineralogy (ICAM), Mianyang, China, 5–10 July 2013; pp. 59–69. [Google Scholar]
- Sitarz, M.; Mozgawa, W.; Handke, M. Vibrational spectra of complex ring silicate anions—Method of recognition. J. Mol. Struct. 1997, 404, 193–197. [Google Scholar] [CrossRef]
- Paluszkiewicz, C.; Blażewicz, M.; Podporska, J.; Gumuła, T. Nucleation of hydroxyapatite layer on wollastonite material surface: FTIR studies. Vib. Spectrosc. 2008, 48, 263–268. [Google Scholar] [CrossRef]
- Salvadó, N.; Butí, S.; Aranda, M.A.; Pradell, T. New insights on blue pigments used in 15th century paintings by synchrotron radiation-based micro-FTIR and XRD. Anal. Methods 2014, 6, 3610–3621. [Google Scholar] [CrossRef] [Green Version]
- Gunasekaran, S.; Anbalagan, G.; Pandi, S. Raman and infrared spectra of carbonates of calcite structure. J. Raman Spectrosc. 2006, 37, 892–899. [Google Scholar] [CrossRef]
- Koutsopoulos, S. Synthesis and characterization of hydroxyapatite crystals: A review study on the analytical methods. J. Biomed. Mater. Res. 2002, 62, 600–612. [Google Scholar] [CrossRef] [PubMed]
- Wang, L.; Nancollas, G.H. Calcium orthophosphates: Crystallization and dissolution. Chem. Rev. 2008, 108, 4628–4669. [Google Scholar] [CrossRef] [PubMed]
- Miers, H.A. Mineralogy: An Introduction to the Scientific Study of Minerals; Macmillan and Company: London, UK, 1902. [Google Scholar]
- Liu, Y.; Wang, A.; Freemen, J. Raman, MIR, and NIR spectroscopic study of calcium sulfates: Gypsum, bassanite, and anhydrite. In Proceedings of the Lunar and Planetary Science Conference, Woodlands, TX, USA, 23–27 March 2009; p. 2128. [Google Scholar]
- Takahashi, H.; Maehara, I.; Kaneko, N. Infrared reflection spectra of gypsum. Spectrochim. Acta Part A Mol. Spectrosc. 1983, 39, 449–455. [Google Scholar] [CrossRef]
- Martin, M.A.; Childers, J.W.; Palmer, R.A. Fourier Transform Infrared Photoacoustic Spectroscopy characterization of sulfur-oxygen species resulting from the reaction of SO2 with CaO and CaCO3. Appl. Spectrosc. 1987, 41, 120–126. [Google Scholar] [CrossRef]
- Madejova, J.; Komadel, P. Baseline studies of the clay minerals society source clays: Infrared methods. Clays Clay Miner. 2001, 49, 410–432. [Google Scholar] [CrossRef]
- Ruan, H.; Frost, R.L.; Kloprogge, J.T.; Duong, L. Infrared spectroscopy of goethite dehydroxylation: III. FT-IR microscopy of in situ study of the thermal transformation of goethite to hematite. Spectrochim. Acta Part A Mol. Biomol. Spectrosc. 2002, 58, 967–981. [Google Scholar] [CrossRef]
- Blanchard, M.; Balan, E.; Giura, P.; Béneut, K.; Yi, H.; Morin, G.; Pinilla, C.; Lazzeri, M.; Floris, A. Infrared spectroscopic properties of goethite: Anharmonic broadening, long-range electrostatic effects and Al substitution. Phys. Chem. Miner. 2014, 41, 289–302. [Google Scholar] [CrossRef]
- Parfitt, R.L.; Russell, J.D.; Farmer, V.C. Confirmation of the surface structures of goethite (α-FeOOH) and phosphated goethite by infrared spectroscopy. J. Chem. Soc. Faraday Trans. 1 Phys. Chem. Condens. Phases 1976, 72, 1082–1087. [Google Scholar] [CrossRef]
- Salama, W.; El Aref, M.; Gaupp, R. Spectroscopic characterization of iron ores formed in different geological environments using FTIR, XPS, Mössbauer spectroscopy and thermoanalyses. Spectrochim. Acta Part A Mol. Biomol. Spectrosc. 2015, 136, 1816–1826. [Google Scholar] [CrossRef] [PubMed]
- Guo, D.; Robinson, C.; Herrera, J.E. Mechanism of dissolution of minium (Pb3O4) in water under depleting chlorine conditions. Corros. Sci. 2016, 103, 42–49. [Google Scholar] [CrossRef]
- Kang, Z.; Machesky, L.; Eick, H.; Eyring, L. The solvolytic disproportionation of mixed-valence compounds: III. Pb3O4. J. Solid State Chem. 1988, 75, 73–89. [Google Scholar] [CrossRef]
- Xie, Y. Dissolution, Formation, and Transformation of the Lead Corrosion Product PbO2: Rates and Mechanisms of Reactions that Control Lead Release in Drinking Water Distribution Systems; Washington University in St. Louis: St. Louis, MO, USA, 2010. [Google Scholar]
- Lin, Y.-P.; Valentine, R.L. The release of lead from the reduction of lead oxide (PbO2) by natural organic matter. Environ. Sci. Technol. 2008, 42, 760–765. [Google Scholar] [CrossRef] [PubMed]
- El-Sheikh, S.M.; Ali, M.F.; Salama, K.K. Low cost pulps with microemulsions for cleaning of fresco painting surfaces. Sci. Cult. 2017, 3, 41–46. [Google Scholar]


| Pigment Name | Value Change after 28 Days Reaction with DAP | Change in Color ΔE* | ||
|---|---|---|---|---|
| ΔL | Δa* | Δb* | ||
| Cinnabar | −1.759 | −1.874 | −2.429 | 3.5 |
| French Ochre | −1.043 | −0.399 | −3.201 | 3.4 |
| Lapis Lazuli | −2.844 | 1.246 | 2.773 | 4.2 |
| Chalk | −4.424 | 0.508 | −2.028 | 4.9 |
| Raw Sienna | 1.989 | −1.48 | −0.629 | 2.6 |
| Burnt Umber | −0.865 | 1.224 | 0.709 | 1.7 |
| Red lead | −10.492 | −18.057 | −22.425 | 30.6 |
© 2019 by the authors. Licensee MDPI, Basel, Switzerland. This article is an open access article distributed under the terms and conditions of the Creative Commons Attribution (CC BY) license (http://creativecommons.org/licenses/by/4.0/).
Share and Cite
Ma, X.; Pasco, H.; Balonis, M.; Kakoulli, I. Investigation of the Optical, Physical, and Chemical Interactions between Diammonium Hydrogen Phosphate (DAP) and Pigments. Sustainability 2019, 11, 3803. https://0-doi-org.brum.beds.ac.uk/10.3390/su11143803
Ma X, Pasco H, Balonis M, Kakoulli I. Investigation of the Optical, Physical, and Chemical Interactions between Diammonium Hydrogen Phosphate (DAP) and Pigments. Sustainability. 2019; 11(14):3803. https://0-doi-org.brum.beds.ac.uk/10.3390/su11143803
Chicago/Turabian StyleMa, Xiao, Hélène Pasco, Magdalena Balonis, and Ioanna Kakoulli. 2019. "Investigation of the Optical, Physical, and Chemical Interactions between Diammonium Hydrogen Phosphate (DAP) and Pigments" Sustainability 11, no. 14: 3803. https://0-doi-org.brum.beds.ac.uk/10.3390/su11143803