Urban Form Compaction and Energy Use Intensity in New Social Housing Neighborhoods in the UAE


1
Emirates Center of Energy and Environment Research, United Arab Emirates University, Al Ain 15551, UAE
2
Architecture Engineering Department, College of Engineering, United Arab Emirates University, Al Ain 15551, UAE
*
Author to whom correspondence should be addressed.
Sustainability 2019, 11(14), 3815; https://0-doi-org.brum.beds.ac.uk/10.3390/su11143815
Submission received: 13 June 2019
/
Revised: 9 July 2019
/
Accepted: 11 July 2019
/
Published: 11 July 2019
(This article belongs to the Collection Sustainable Built Environment)
Abstract
:With increasing global awareness of sustainable development, federal and local authorities in the UAE have developed agendas for energy efficiency in all development sectors, especially for buildings and urban development. With the belief that urban form is integral to urban sustainability, several recently developed single-family social housing neighborhoods in the UAE have shifted from conventional sprawling urban forms to more compact ones. Unfortunately, the impact of this shift on operational and cooling energy use intensities (EUIs) is unknown. Adopting a comparative computational method, this study investigates the effect of compact urban morphologies on EUIs. In addition to a case study representing conventional urban sprawls, six recently designed housing neighborhoods in Abu Dhabi, Dubai, and Al Ain were selected to represent new compact urban forms. This study uncovered an inconsistent relationship between floor area ratio (FAR) and average housing operational and cooling EUIs. To justify these results, the effects of increased lot coverage area, street grid patterns, building configurations, and climate zone on operational and cooling EUIs were studied, and all except climate zone were proven effective. This study concludes that the current design philosophy of compacting the urban form has not successfully met the Emirates Green Building Council’s (GBC) sustainable operational EUI benchmark of 90 kWh/m2/y. While further urban compactness (i.e., increased FARs) is needed, the other urban morphological measures examined in this study should be considered for achieving a more sustainable urban form for social housing.
Keywords:
urban form; compact; energy efficiency; energy use Intensity; social housing; neighborhood; UAE1. Introduction
It is estimated that cities consume almost two-thirds of the world’s energy and a significant portion of this energy goes to operate buildings [1]. Accordingly, global efforts have been focused on reducing energy consumption and its associated carbon emissions in the built environment sector. These efforts are increasingly reflected in the current green building design codes and practices while both present-day and predicted targets for reducing energy consumption and CO2 emissions have been set worldwide to meet this goal [2]. However, most of this attention is directed to the buildings themselves with little focus on urban-scale energy analysis [1], although building energy is influenced not only by building design but also urban form, which have been little discussed so far [3]. Currently, there is a lack of energy modeling at the urban scale and sometimes even the available urban data required for urban energy modeling is inconsistent [4,5].
Actually, sustainable urbanism could be attained by developing a compact urban form [6,7] because compact urban forms would significantly decrease the high energy consumption rates, pollution levels, and the negative environmental effects that have resulted from the urban sprawl of many existing urban areas [8]. Accordingly, it would be more environmentally and economically sustainable to provide and maintain services like water, sewers, electricity, communications, and other amenities and utilities in compact neighborhoods than in dispersed communities [9]. The compaction of urban forms requires increasing both built up area density—expressed in floor area ratio (FAR), the gross floor area permitted on a site divided by the total net area of the site [10]—and residential population density—expressed in person per hectare (pph). This would conserve building energy and strengthen the various social, cultural, and economic activities within this compacted urban environment.
Examining the effect of compacting urban forms on energy consumption as an approach for realizing sustainable urbanism has been a growing locus of research work [11]. For example, it was revealed that US cities with a density of 10 pph or less usually use about five times more energy per capita in gasoline than the cities of Europe, which are, on average, about five times denser [12]. While it became evident that a compact urban form with a reliable walkable infrastructure and public transport system would positively contribute to environmental sustainability, there is still no single ideal “model” of a sustainable urban form that could be easily replicated. This is because any such form is a product of the specific local characteristics of its urban environment [13,14,15]. In addition to the West, investigating the effect of urban forms on energy efficiency has also started to draw the attention of international institutions and aid agencies in the MENA (Middle East and North Africa) region. In one of the very few studies undertaken by the Energy Efficiency in the Construction Sector in the Mediterranean (MED-ENEC) [16], the relationship between urban form and energy consumption was studied by examining the impact of three main urban morphological measures of energy use intensity (EUI), the energy consumed by all buildings in an urban area in units of kWh/m2 of floor area, which is often used for comparing the energy performance of buildings (within urban systems) across sizes, types, and locations [17]. The first morphological aspect investigated was the buildings’ massing, where it was revealed that the configuration of the building mass within a specific climatic context influences both indoor and outdoor comfort. So, developing certain buildings’ mass morphologies could decrease the cooling load by, for example, increased shading and natural ventilation. Second, the study examined outdoor space and street grids, where it recommended that their configuration should support appropriate catchment distances and pedestrian networks should provide comfortable access to services and amenities easily without depending on private cars. Third, its examination of parcellation suggested that residential plots should be resilient enough to accommodate various building forms, such as courtyard buildings that help enhance natural light and vegetation. Although this study managed to pinpoint some important measures of urban form, it was limited in its scope and findings. Thus, more work is still needed, especially in the MENA region.
In the UAE, statistics indicate that buildings consume up to 70%–80% of the country’s total generated electricity. Most of this energy is consumed by the high cooling load in this region, which reaches about 6262 annual cooling degree days (CDD) compared with only 38 heating degree days (HDD) [18]. The UAE’s federal and local governments have introduced action plans for reducing this high rate of energy consumption to mitigate the country’s greenhouse gas (GHG) emissions and reduce the carbon footprint as part of the international efforts related to the United Nations Framework Convention on Climate Change [19]. In response, achieving energy efficiency in all sectors of development, especially in building and urban development, has become a national priority in the UAE in the last few years. Several initiatives have been launched recently in the country, including, but not exclusive to, the Estidama Pearl rating system for buildings (PBRS) [20], Estidama Pearl community rating system (PCRS) [21], Dubai Green Building Code, Dubai’s Initiative for Creating Sustainable Communities [22], Dubai Supreme Council of Energy (DSCE) [18], and Abu Dhabi National Housing Guidelines for Integrated Communities [23]. In all these initiatives, the efforts exerted to achieve energy efficient buildings far exceed those exerted to achieve energy efficiency on the urban scale. One recent effort in this direction has been the shift from the conventional “unsustainable” sprawling urban form, which was the norm for most residential urban developments, to the more “compact” urban form of several recent social housing projects.
2. Research Objectives and Questions
The new, more compact urban forms of social housing neighborhoods in the UAE are claimed to be more environmentally sustainable when in reality, there is no reliable evidence that supports this claim, especially regarding the effect of these new morphologies on energy efficiency in general and on cooling energy demands specifically. As this study attempts to bridge this gap, its main objective is threefold. The first aim is to define the relationship between urban form compaction, represented by the FAR, and housing operational and cooling EUIs for selected neighborhoods representing the more compact urban forms of recently developed social housing in the UAE. The operational energy here represents the yearly use of energy for operating all the buildings in the neighborhood, while the cooling energy is the energy needed to meet the cooling demand of the buildings; both are expressed in kWh/m2. Second, this study aims to define the influential urban morphology-related measures that may affect housing operational and cooling EUIs. And third, this study aims to define a set of recommendations for achieving more sustainable urban forms for social housing neighborhoods in the UAE. To achieve these objectives, this study posed the following set of questions: First, what are the housing operational and cooling EUIs of the new and more compact urban morphologies of recently developed neighborhoods in the UAE? Second, have these neighborhoods managed to achieve the sustainable benchmark of 90 kWh/m2, as set by the Emirates GBC in 2017 [18]? Third, what is the relationship between urban form compaction, represented in FAR, and the housing operational and cooling EUIs in these selected neighborhoods? Finally, what are the urban morphology measures that might have considerable effects on the energy efficiency of different urban forms? Answering these questions is expected to help develop alternative strategies and urban design/planning guidelines that could achieve better energy efficiency in the UAE’s social housing sector.
3. Research Method and Tools
Investigating the effect of urban form compaction on the operational and cooling EUIs was accomplished through computational simulations for six selected case studies. These case studies include Al Falah South (N2) and Al Falah North (N3) in Abu Dhabi, Al Ghreiba (N4) in Al Ain, Oud Al Muteena (N5) in Dubai, Shubat Al Woutah (N6) in Al Ain, and Watani 1 (N7) in Abu Dhabi. Selection criteria were, first, to be a recent development that claimed to be more sustainable. Second, each was chosen to represent different urban morphologies. Falah South and Shaubat Al Wuttah have orthogonal morphology, Falah North and Watani 1 have curvilinear morphology, and Al Gheriba and Oud Al Muteena have a mixture of both orthogonal and curvilinear morphologies. Third, these case studies were chosen to represent the prevailing trends of social housing development within the specific climatic conditions of the three main cities of the UAE: Abu Dhabi, Dubai, and Al Ain. Finally, the criteria dictated that case studies represent various degrees of urban form compaction (represented in FAR). The selection of these case studies followed the conduction of field surveys for the urban morphology patterns of all recently developed neighborhoods in the UAE, especially those associated with declared local sustainability agendas. In these surveys, satellite images were carefully examined to help define the status quo of the urban massing and the outdoor spaces/street grid patterns. In addition, updated maps were obtained from the local municipalities when available, and frequent site visits were conducted to update the land use along with building forms, types, and heights.
The urban modelling interface (UMI) V.2 software was used for the computational simulations for all buildings and all housing operational and cooling EUIs. The UMI is a Rhino-based design environment for modelling the environmental performance of neighborhoods and cities with respect to operational and embodied energy use [24]. In this research, the UMI was first used to determine the FAR for each of the six selected neighborhoods, and Al Dhaher neighborhood (N1) that represents the urban sprawl. Afterwards, the UMI tool was used to simulate operational and cooling EUIs for each neighborhood in addition to the embodied energy representing all non-renewable fuel consumption measured over a 50-year period of the buildings’ use. The tool also defines the CO2 emissions expressed in kg CO2/m2 during the same period for each of the studied neighborhoods. The calculation of the operational and cooling EUIs is influenced by the buildings’ geographical location, physical properties, window–wall ratio (WWR), mass geometry, used material, orientation, and operating hours (usually determined through the building use). All these measures were customized in the UMI software tool before conducting the energy simulations, as detailed later.
Once the UMI simulations were completed, the results were reviewed and interpreted with a valid and scientifically supported benchmark. For the single-family housing type—nearly the only developed form of social housing in the UAE—some global benchmarks for the targeted EUI have been set. For example, the Architecture 2030 Challenge determined the site EUI for single-family detached homes in 2015 to be 41.3 kWh/m2/yr [25], while in other references the EUI in the 2030 Challenge target is estimated to be 57 kWh/m2/yr [2]. Locally in the UAE, two benchmarks have been individually set for single-family homes. The first is a “current” energy performance index of 140 kWh/m2/year determined by the Ministry of Energy and Industry in the UAE [26], and the second is defined by the Emirates GBC as 90 kWh/m2/yr for energy-efficient and sustainable buildings, including single-family homes [18]. In this study, the 140 kWh/m2/yr EUI benchmark is considered the current target for social housing neighborhoods, while an EUI of 90 kWh/m2/yr is considered the sustainable target for the recently developed more compact neighbourhoods.
4. From Sprawling to Compact: Six Recently Developed Case Studies
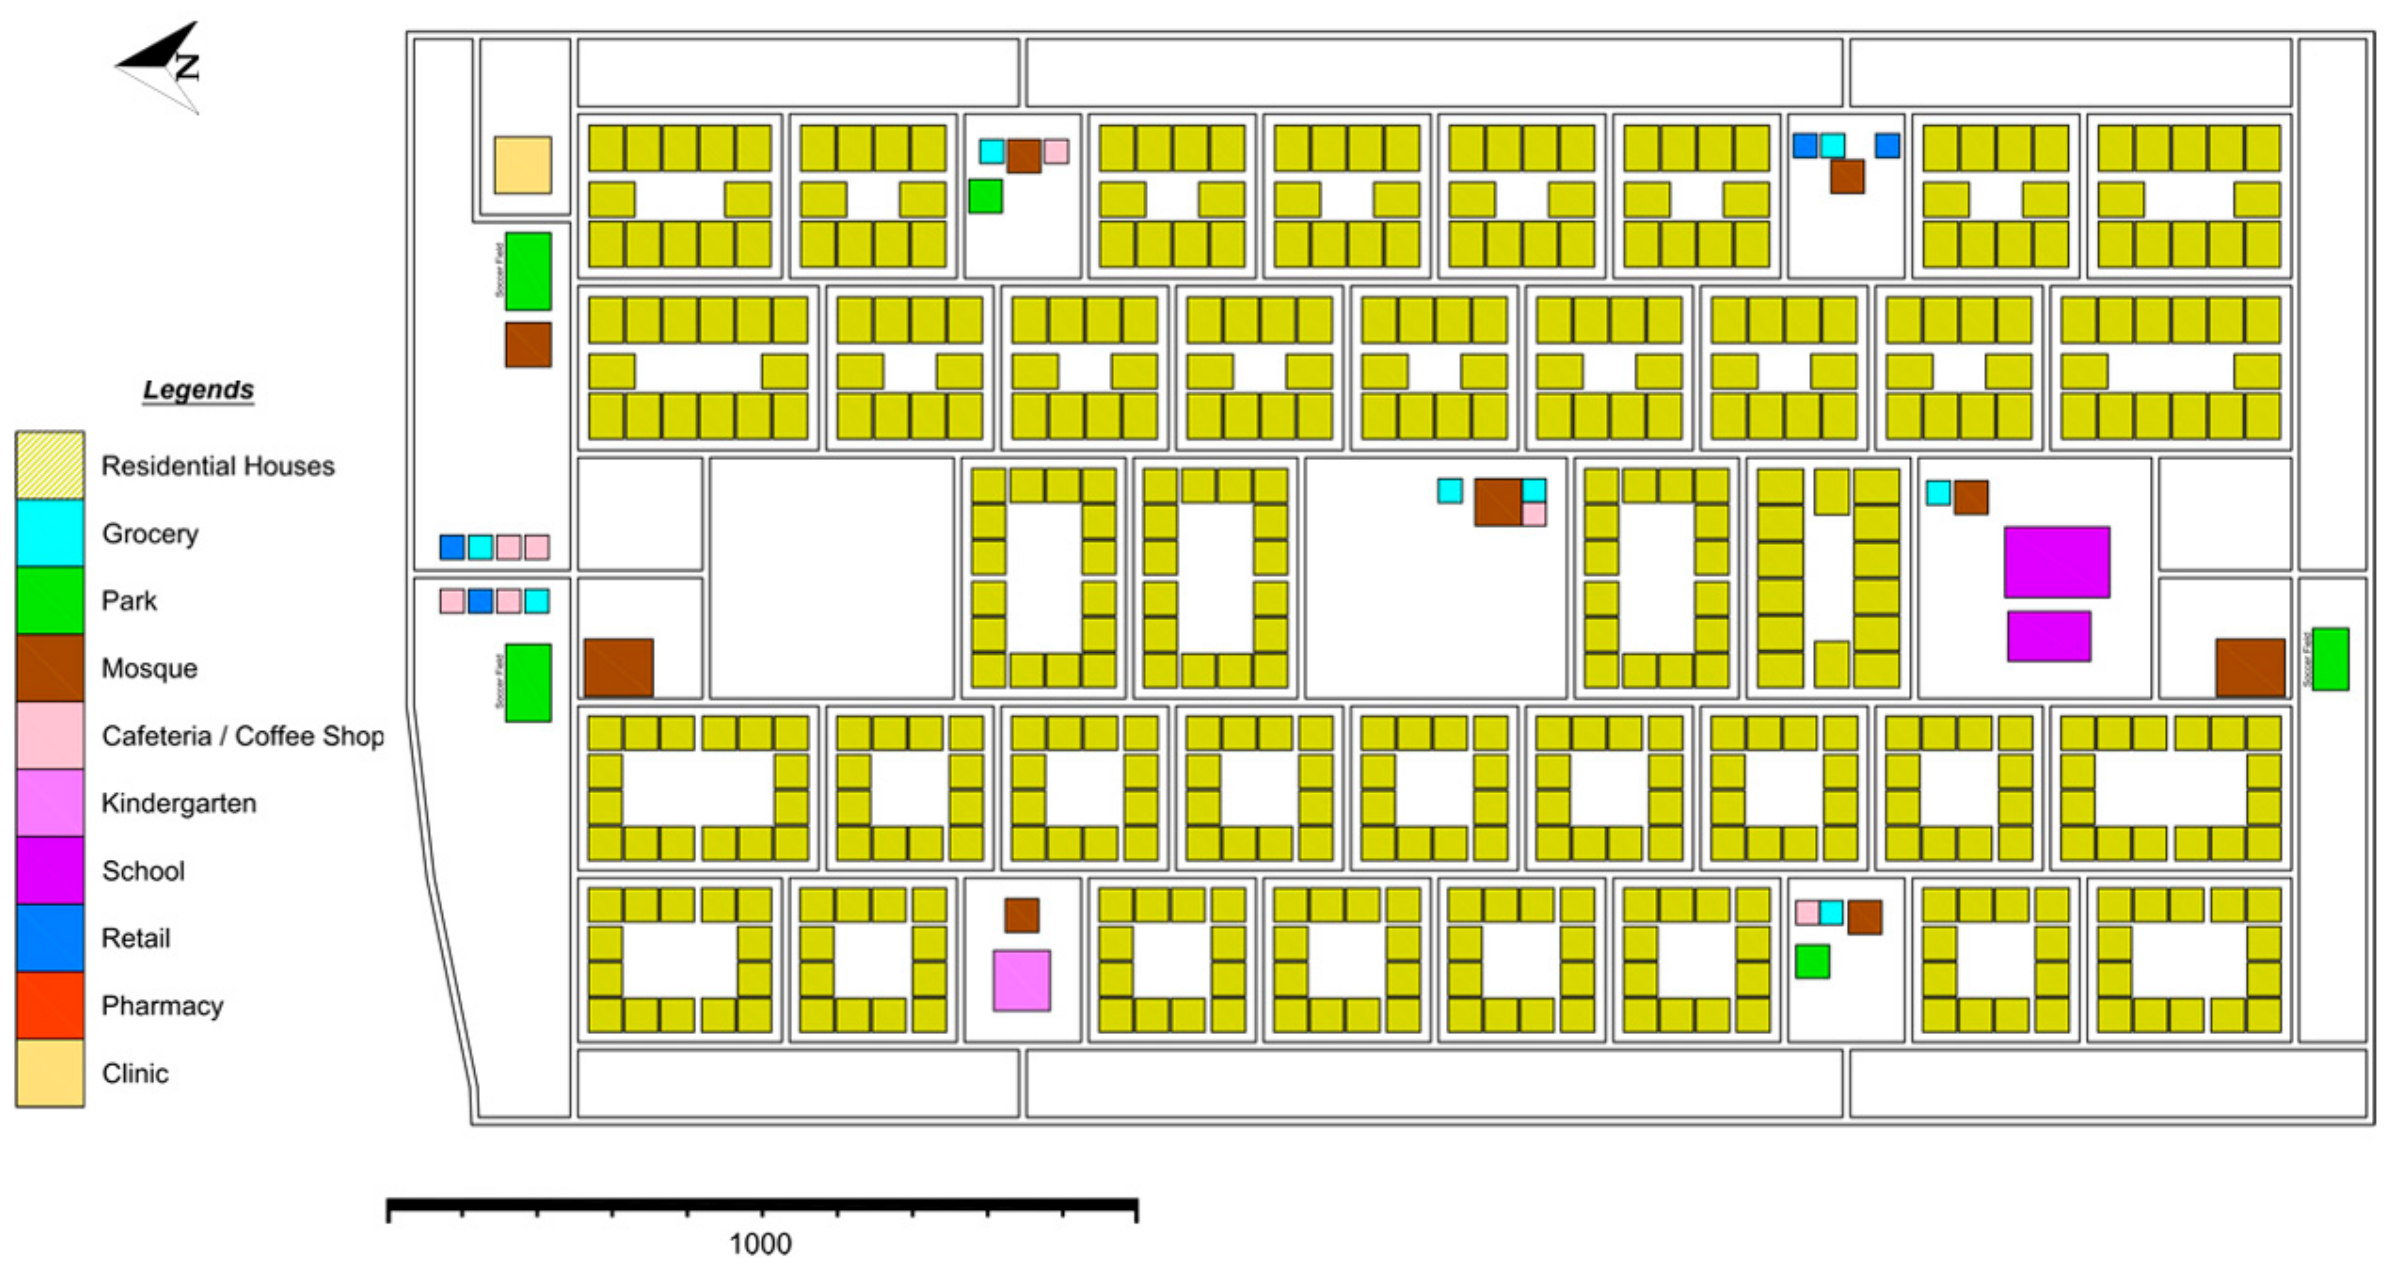
An example of the conventional sprawling urban forms, which were widely developed in the UAE, is the Al Dhaher neighborhood in Al Ain (cited in this research as N1 neighborhood). It represents a repeatedly adopted design for social housing neighborhoods, especially in Abu Dhabi Emirate (Figure 1).
Developed in 2002, this neighborhood occupies a rectangular-shaped lot of about 1230 m × 2280 m with a gross area of about 285 hectares. It contains 460 plots for two-story single-family housing with a total population of 3312 people and a gross population density of only 11.02 pph. The urban form of this neighborhood was conceptualized as clusters of 10, 12, 14, and 16 housing plots grouped around communal open spaces. The house plot area is either a 45 m × 60 m or 45 m × 45 m. Meanwhile, the main services and amenities, such as mosques, schools, a clinic, and retail shops, were located on both the longitudinal center of the neighborhood and on its outer edges. The neighborhood was conventionally designed as a “self-contained” community providing the envisaged services and amenities of residents; however, not all the planned amenities have been provided, most likely due to the low population density. The FAR of the neighborhood is only 0.11, which reflects a low urban compactness ratio that resulted from the adopted sprawling urban form of the neighborhood.
This and similar social housing neighborhood models have been developed since the 1970s, but with the dawn of the new millennium and the adoption of sustainability agendas, such urban sprawls were slowly replaced by more compact urban forms. As explained above, the following six neighborhoods, with varying but more compact urban morphologies, were selected to represent and evaluate this urban housing trend.
Case Study 1, N2-Al Falah South neighborhood in Abu Dhabi is an Emirati social single-family housing neighborhood developed by the Abu Dhabi Municipality. It was completed in 2005. Its total area is about 538 hectares with a total number of 785 houses. The total population is 5652 people with a gross density of 10.51 pph. The neighborhood only contains two-story single-family houses with total built up areas of 963 m2 or 1181 m2. Similar to the Al Dhaher neighborhood, the housing plots measure 45 m × 45 m or 45 m × 60 m. The neighborhood has many fewer public open spaces and less space in between houses if compared with conventional sprawling neighborhoods. It has a FAR of 0.18, and its street grid pattern is orthogonal with back-to-back plots arrangement (Figure 2A).
Case Study 2, N3-Al Falah North neighborhood (New Al Falah, Village 3) in Abu Dhabi is a single-family housing neighborhood designed by Aldar Properties and GHM Design and developed by the Abu Dhabi Municipality. This neighborhood is the third out of five single-family house neighborhoods (Villages) developed as part of the New Al Falah Project. Construction work was launched in 2009, and the first handover of houses started by the end of 2012. The masterplan for Al Falah was designed to provide full community facilities for Emirati citizens. The planning concept was meant to be modern and sustainable, and yet reflect a strong sense of local identity and community [27]. The total neighborhood area is about 352 hectares with a total population of 7272 people. The gross density reached about 20.66 pph. The neighborhood has 1010 two-story single-family housing plots with three different built up areas of 582 m2, 501 m2, and 477 m2. The plot areas decreased significantly to range between 30 m × 32 m and 30 m × 45 m with a FAR of 0.18. The neighborhood has a curvilinear street grid pattern and a back-to-back plot arrangement (Figure 2B).
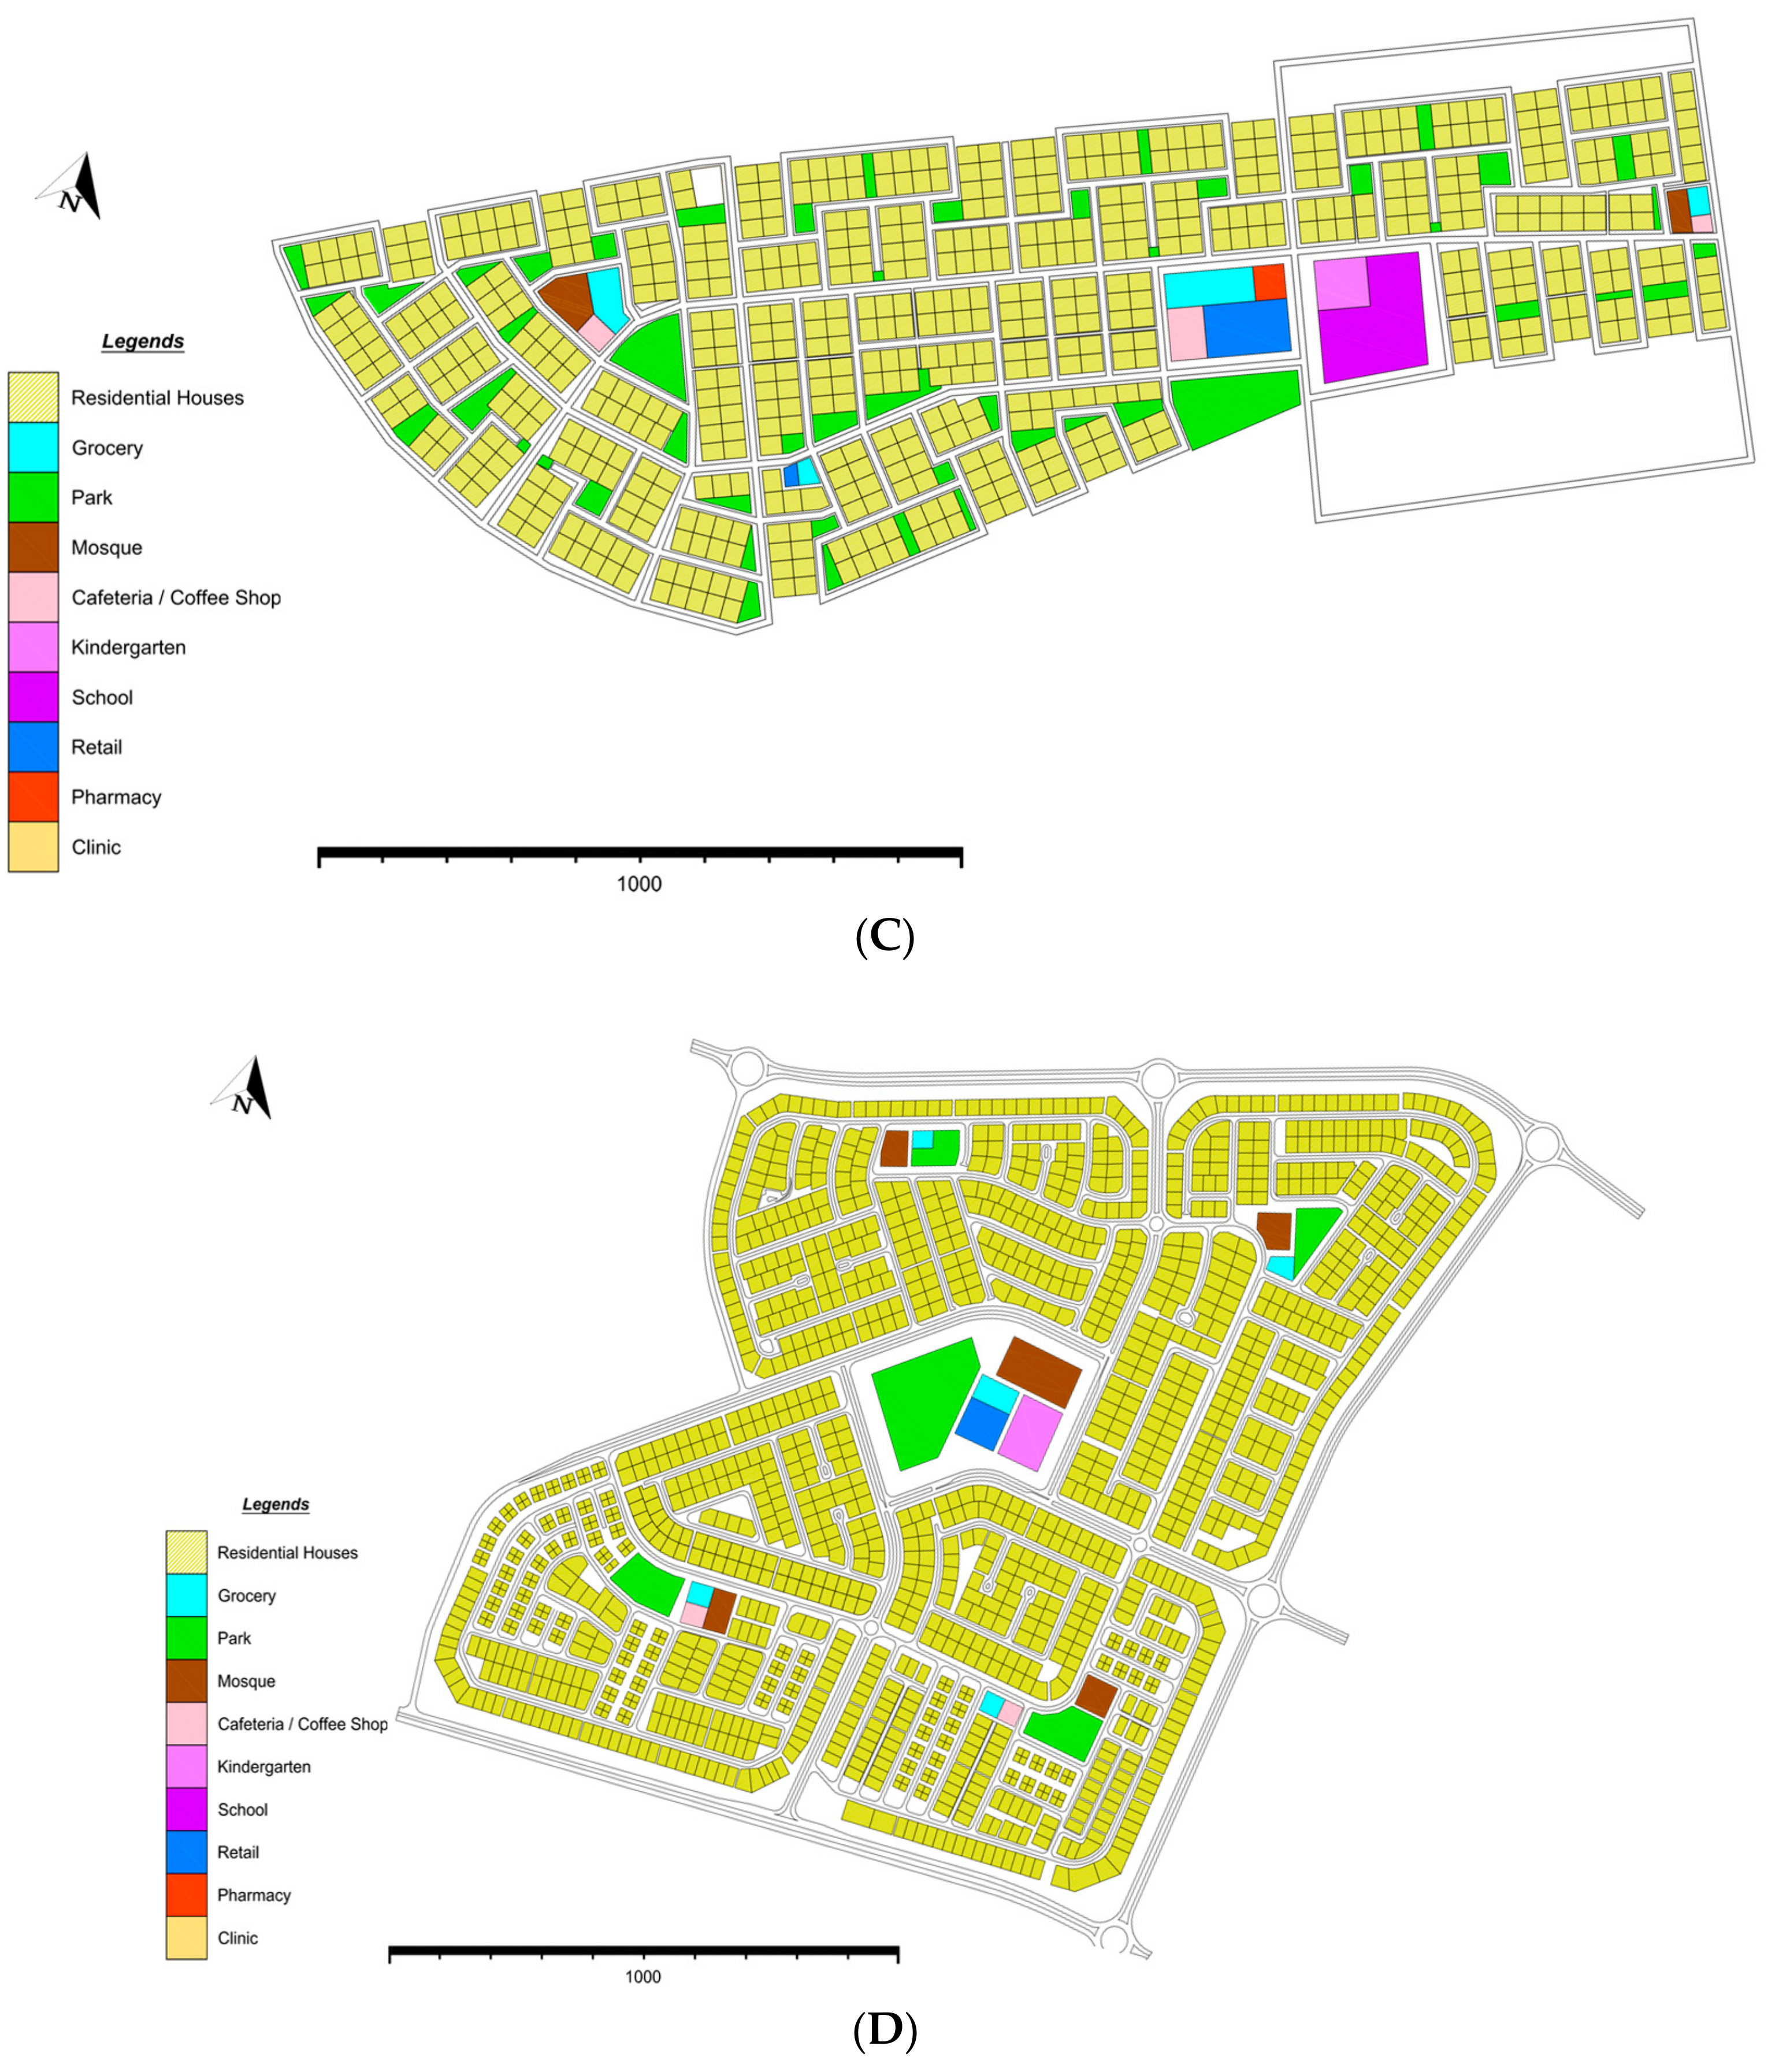
Case Study 3, N4-Al Ghreiba neighborhood in Al Ain is the first Emirati housing project designed to achieve the second level (2 pearls) in the Estidama (meaning sustainability in Arabic) building and community rating systems in the Abu Dhabi Emirate [28]. Its site is located approximately 10 km south-west of Al Ain city center and is zoned as a “low-density villa residential” under the future Plan Al Ain 2030 [29]. To resonate with traditional Emirati neighborhoods, known as fareej, pocket parks represented the baraha (traditional small open space), while linear parks represented the sikka (traditional name for a 2 m to 6 m wide linear pedestrian access). The neighborhood consists of 636 single-family housing plots on a 139.96-hectares site with a total population of 4579 people. The gross population density is 32.72 pph. The neighborhood contains only two-story single-family homes with two different built up areas of 500 m2 and 420 m2. In response to the desire for achieving a more compact urban form, the housing plot area has significantly decreased to only 30 m x 36 m with a higher FAR of 0.26. The street pattern is mostly orthogonal with some curvilinear streets in the lower left side. The plots alternate between a back-to-back arrangement and clustering around pocket parks (Figure 2C).
Case Study 4, N5-Oud Al Muteena neighborhood in Dubai is an Emirati citizens’ single-family housing neighborhood developed by the Muhammed Bin Rashid Housing Establishment. Its construction started in early 2007 and was almost completed by 2016. The neighborhood design aimed to reflect local architectural heritage and unique architectural elements such as carvings, inscriptions, and local motifs, as well as the calm sandy colors derived from the local environment [30]. The total area of the neighborhood is about 238.89 hectares with an average population of 11,491 people and a gross population density of 48.11 pph. The total number of housing units is 1596, divided into two housing types. The first includes two-story single-family homes with three different built-up areas of 554 m2, 445 m2, and 309 m2, and the second type is two-story town houses with two built-up areas of 337 m2 and 203 m2. The areas of the single-family plots range between 25 m × 30 m and 25 m × 35 m, while the town houses are built on an area of about 12 m × 14 m each. The FAR is 0.26, and the street pattern is mainly orthogonal, with a partial curvilinear pattern. The plots are arranged back-to-back (Figure 2D).
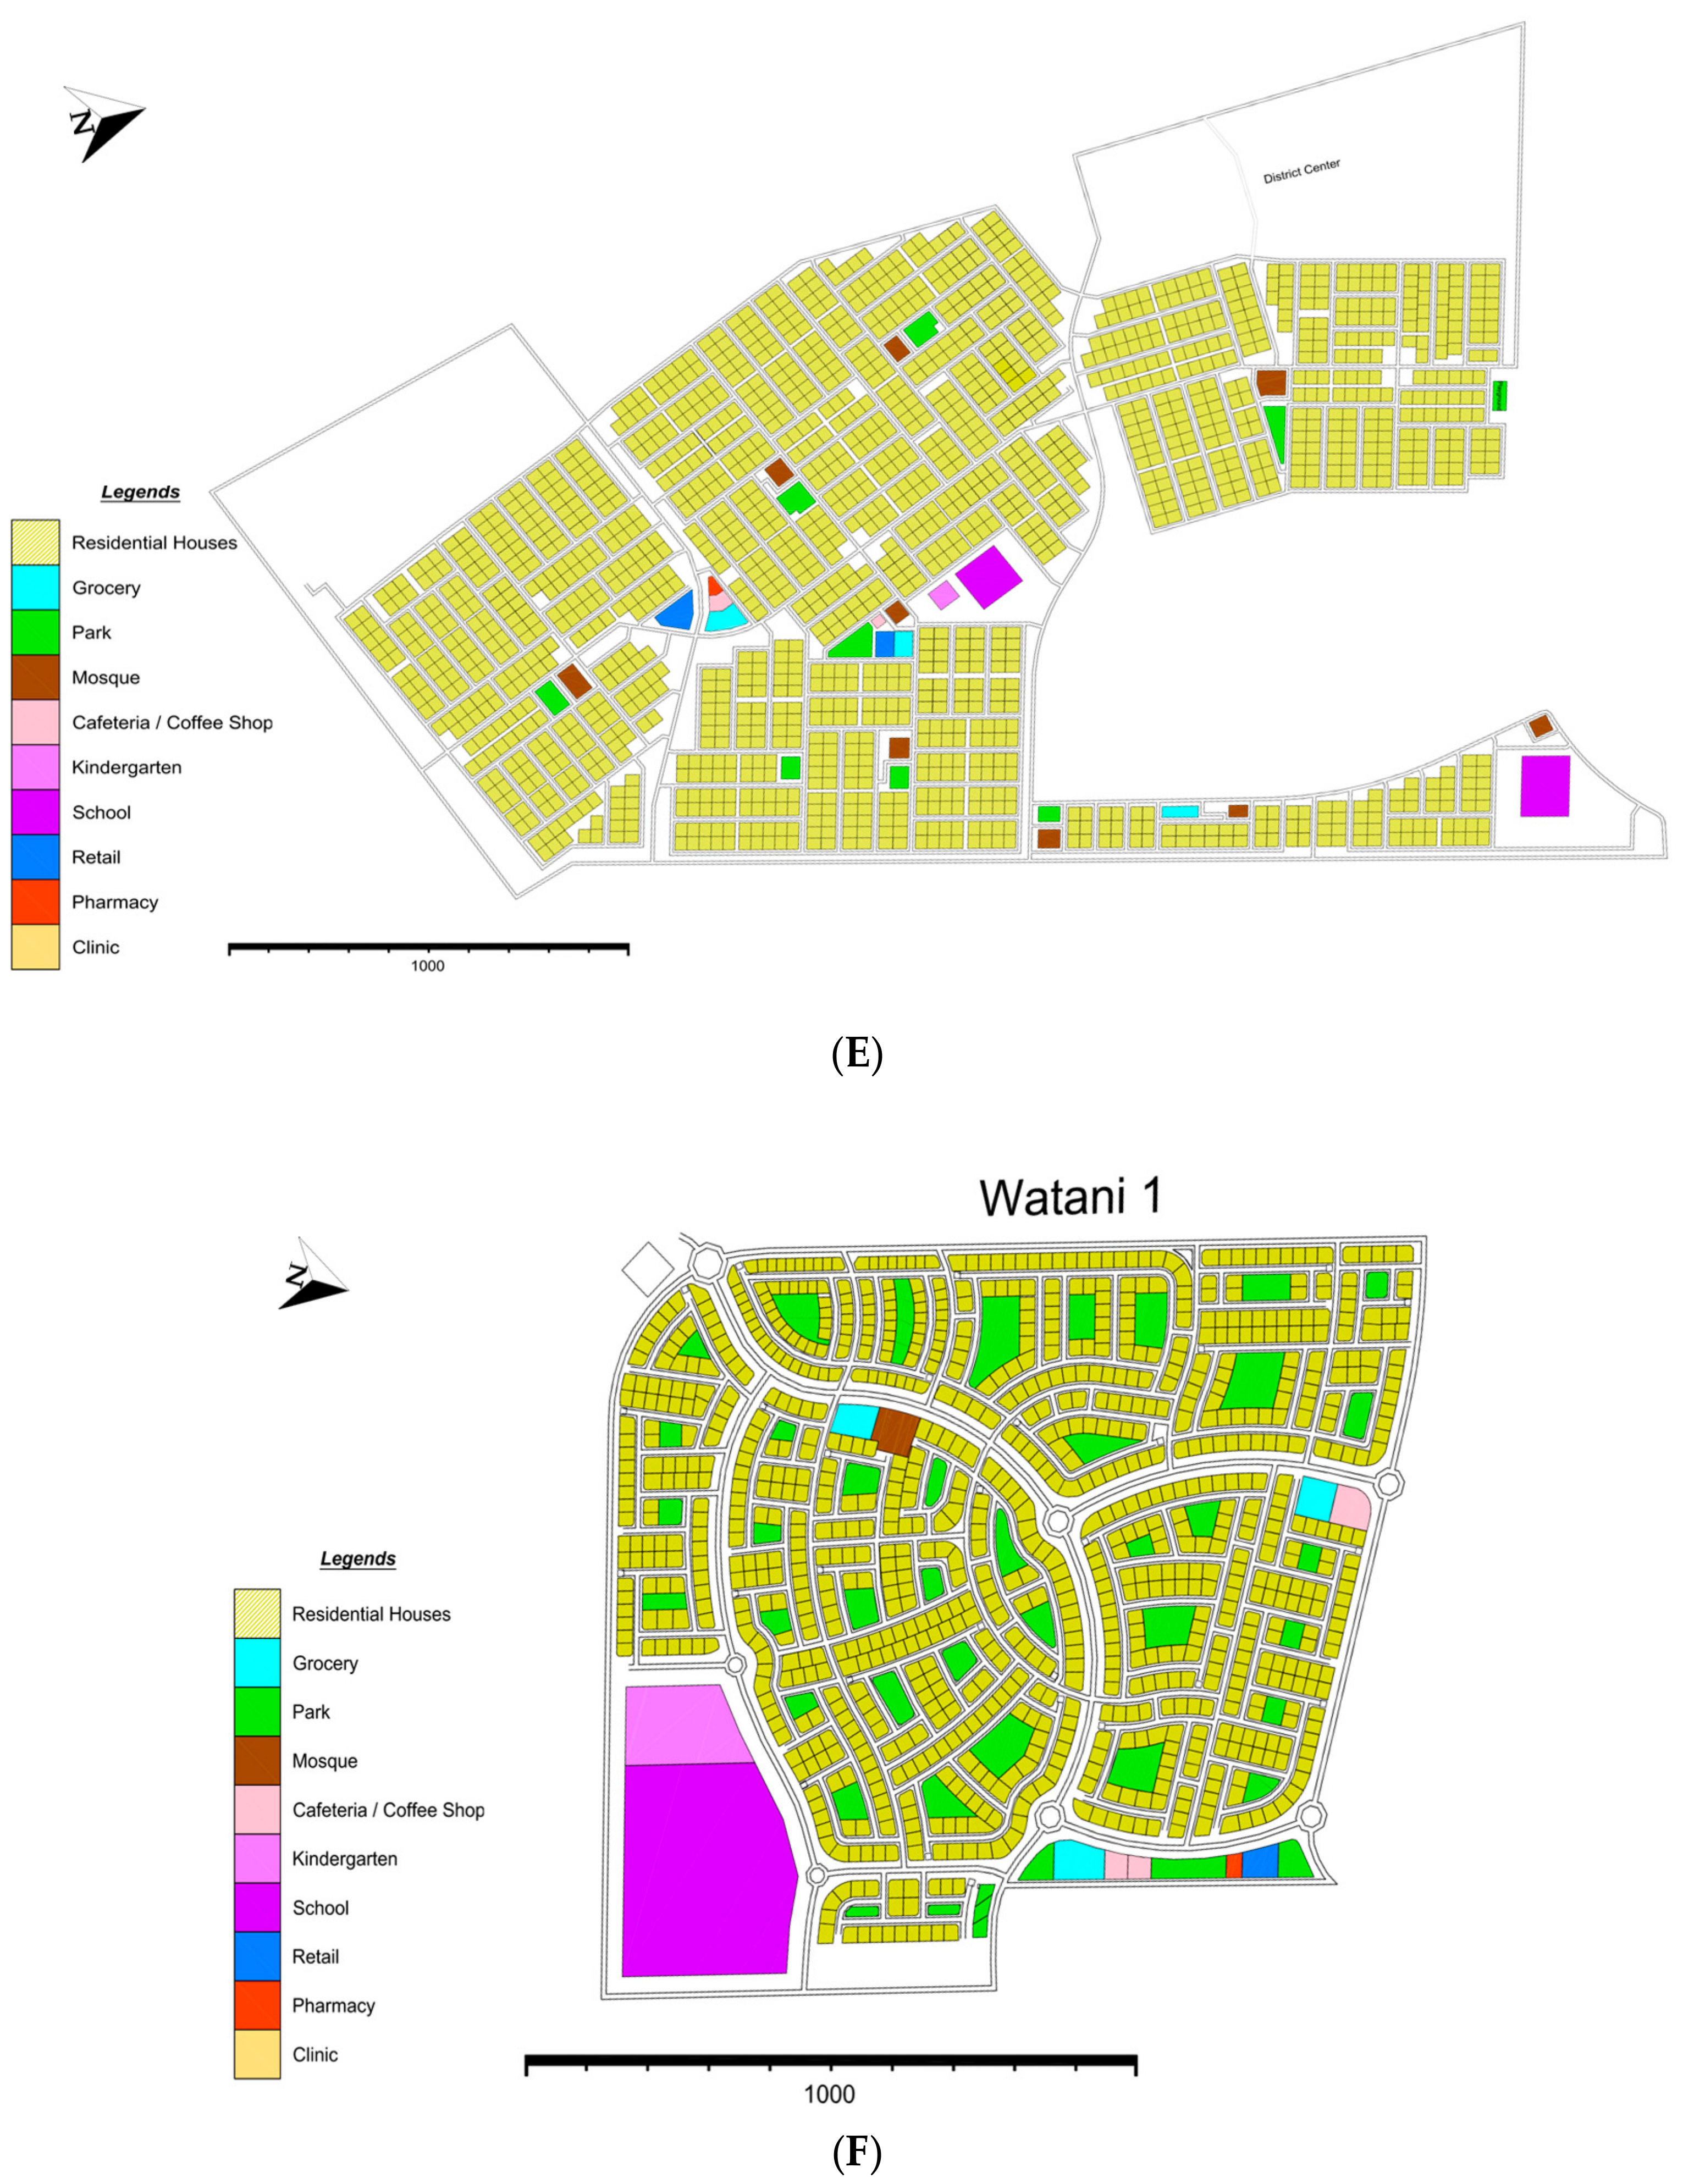
Case Study 5, N6-Shubat Al Woutah neighborhood in Al Ain is a social housing project developed by the Al Ain Municipality in coordination with ALDAR Properties (Figure 2E).
The project was launched in 2011 and its infrastructure was completed by 2016. The single-family housing units have been developed since then. The project was conceived as a reflection of Al Ain Vision 2030 through the provision of the best designs, necessary services, and entertainment facilities in an integrated and sustainable manner [31]. The total site area is 465.23 hectares, and the number of houses is 1647 with a total population of 12,188 people. The gross density is about 26.20 pph. It contains only single-family homes with two built up areas of 952 m2 and 1012 m2 and a plot area of 30 m × 36 m. The FAR is 0.38, and the street pattern is mainly orthogonal, with some limited curvilinear streets. The plots are arranged back-to-back.
Case Study 6, N7-Watani 1 neighborhood in Abu Dhabi is a social housing project developed by both the Abu Dhabi Municipality and Sorouh Properties. It was completed in 2015. It is claimed that the project is designed in response to the social lifestyle of UAE citizens [32]. The total site area is 144.20 hectares with 968 housing plots and a total population of 6970 people. The gross population density is 48.34 pph. The neighborhood has one main housing type; semi-detached two-story single-family homes with three different built up areas of 611 m2, 512 m2, and 395 m2. The plot areas are 25 m × 28 m and 20 m × 25 m with a FAR of 0.41, the highest among all selected case studies. The street pattern is mainly curvilinear, with a mixture of plots arranged back-to-back and clustered around communal open spaces (Figure 2F).
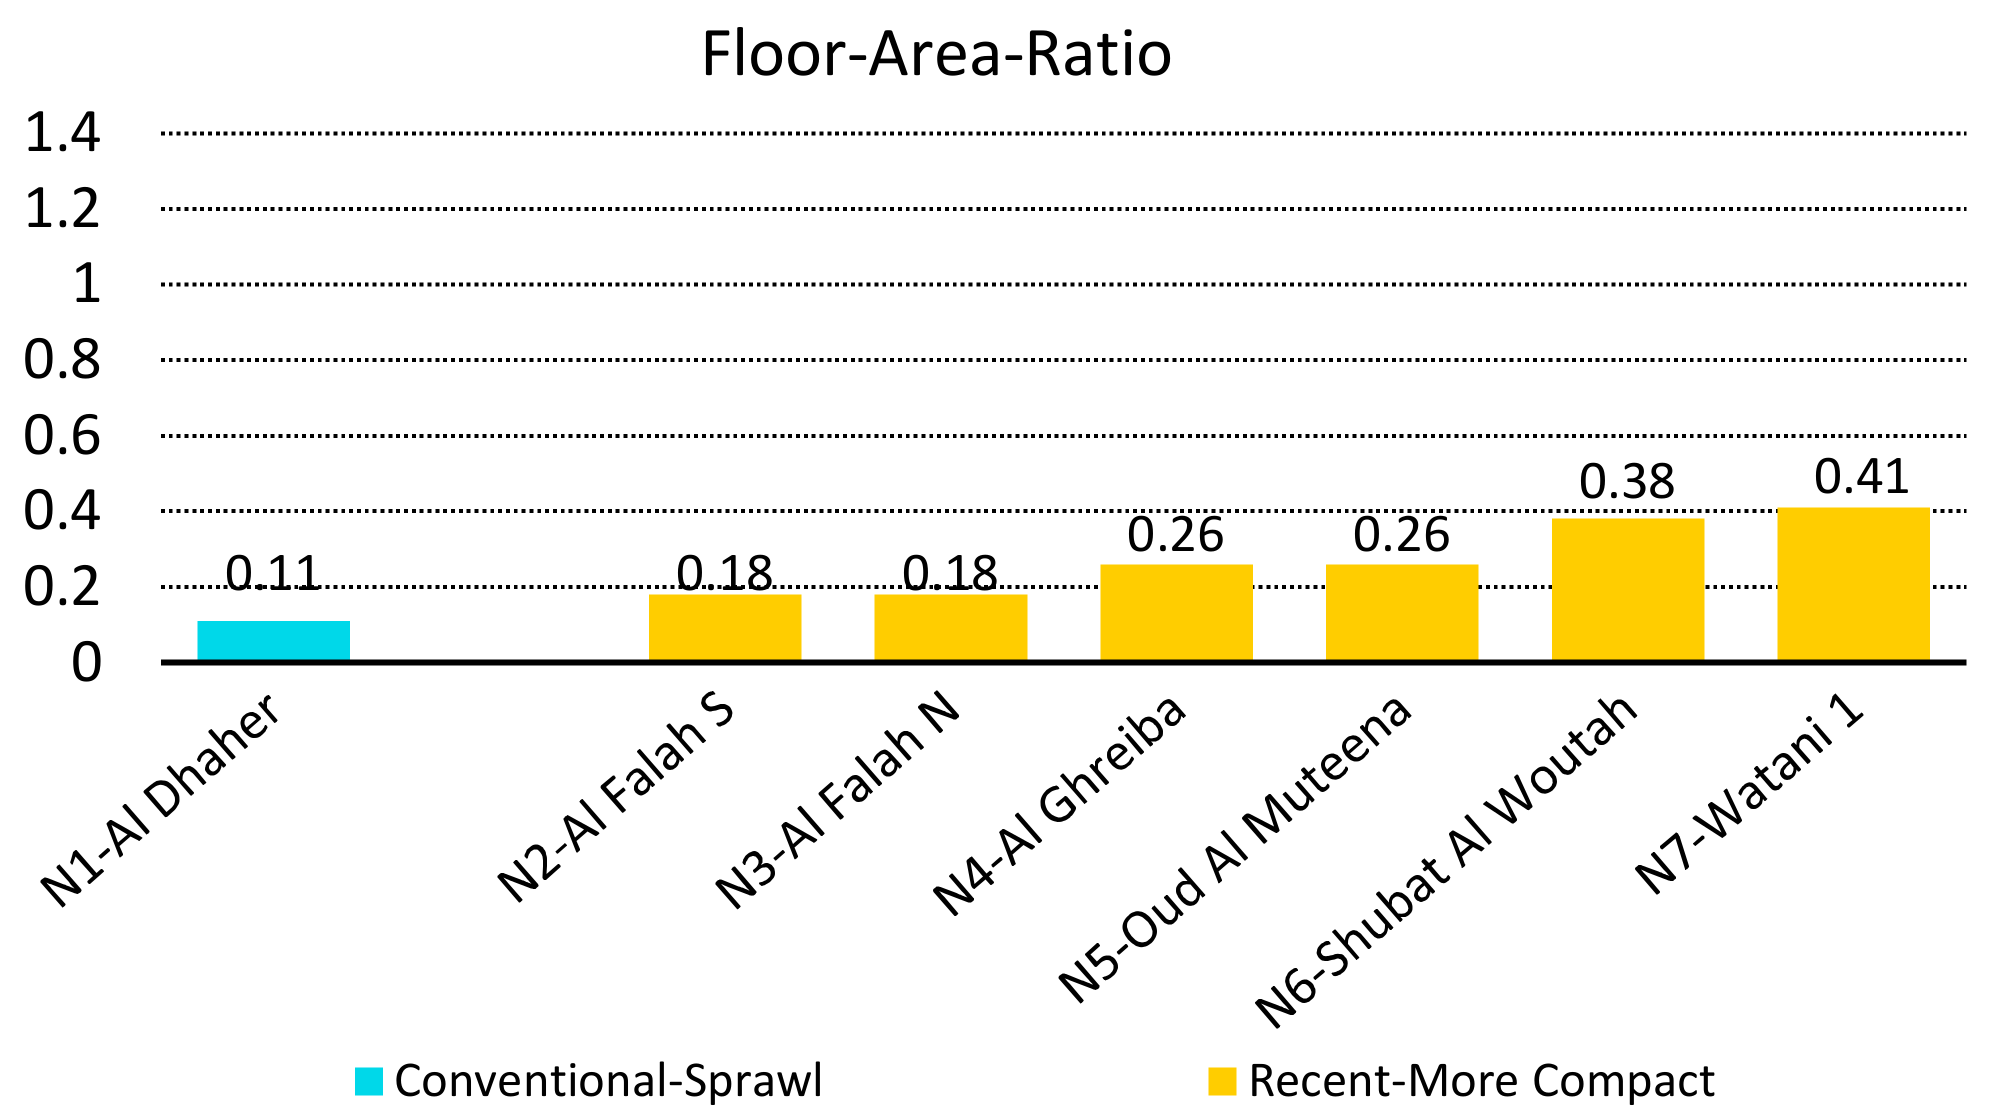
All these new neighborhoods incorporated a more compact design than the sprawl of conventionally designed neighbourhoods, for example, Al Dhaher with its low FAR of 0.11. However, the compaction ratios varied greatly among the six neighborhoods, as they ranged from 0.18 for N2 and N3 (Al Falah South and Al Falah North neighborhoods) up to 0.41 in N7 (Watani 1 neighborhood) (Figure 3).
5. Preparation for Computational Analysis
Before performing the UMI computational analysis of the six neighborhoods, digital models for the housing clusters, groupings of housing clusters, and the overall neighborhoods were initiated. These digital models show the building masses and the open space/street grid of each case study. The selected neighborhoods were first modelled in a 2D format on AutoCAD 2018, where separate layers were assigned to building types, street networks, neighborhood parks, and neighborhood boundaries. The boundaries of every building in each neighborhood, which appeared later as a solid mass in Rhino 5 and in the UMI Bundle, were represented by a single enclosed polyline in AutoCAD. Subsequently, the completed 2D models of the neighborhoods—with their overall layered building outlines, street networks, parks, and neighborhood land boundary—were exported to Rhino 5 for developing the 3D format of the neighborhoods, and then uploaded into the UMI bundle for undertaking the computational analysis of the operational and cooling EUIs.
In the UMI bundle, the default building template was customized using the template library editor for each service building and house in each of the analyzed neighborhoods. In these customized building templates, the locally used structure systems and construction materials, as well as local occupancy rate and schedules, the air conditioning and hot water supply system schedules throughout the year, as experienced in the UAE, were defined and saved in a customized building template library file (Table 1). Also, some local building types/uses were added, namely a mosque, a school, and a clinic, and their occupancy schedules were defined. All building performance parameters are specified in the UMI’s building template and are affected by the uploaded weather file. These include the infiltration rate, the cooling setpoint, ventilation, etc. Table 2 shows the occupancy schedule as an example of the scheduling in the customized building templates library.
While the FAR calculation is a straightforward process, the simulations for the operational and cooling EUIs, as well as for the embodied energy and CO2 emissions, required first the definition of the geographical location of the analyzed neighborhoods. The weather information files of Dubai/Abu Dhabi, Al Ain, and Fujairah (in an epw file format) were uploaded in the UMI bundle for each neighborhood according to its own location.
6. Analysis of the EUI for Operational, Cooling, and Embodied energy
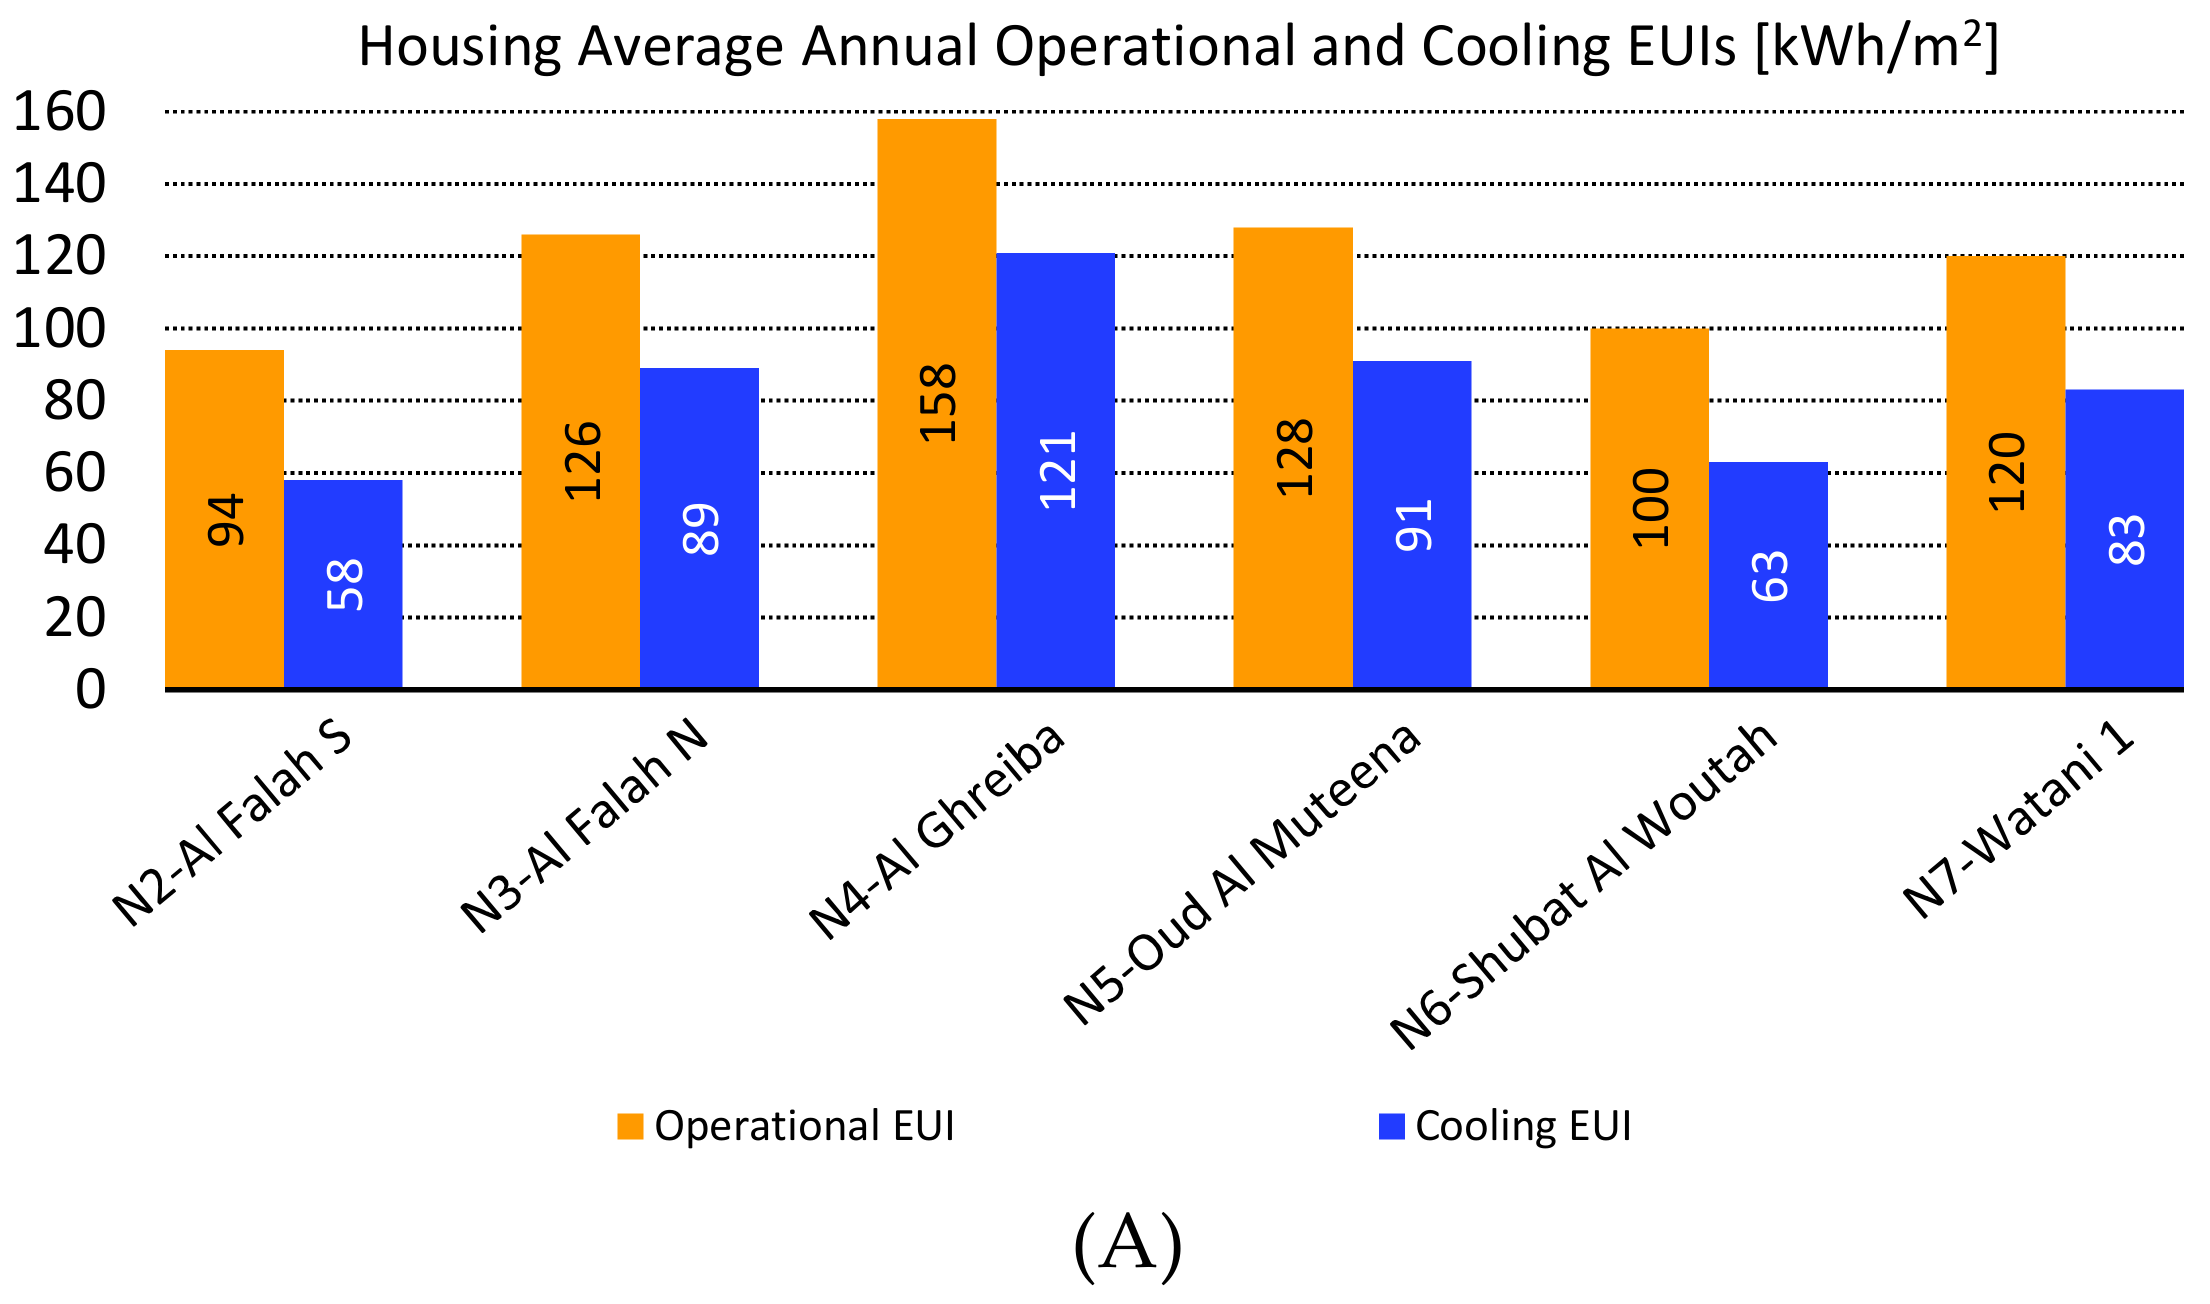
As revealed in the analysis (Figure 4 and Table 3), the average housing operational EUIs for all the studied compact neighborhoods were below the average set by the electricity performance index of single-family houses of 140 kWh/m2/year [26], except N4-Al Ghreiba neighborhood that reached 158 kWh/m2/year. However, none of the neighborhoods achieved the sustainable benchmark of 90 kWh/m2/year or less [18], with varying degrees of differences that ranged between 94 kWh/m2/year for N2-Al Falah South neighborhood to 158 kWh/m2/year for Al Ghreiba.
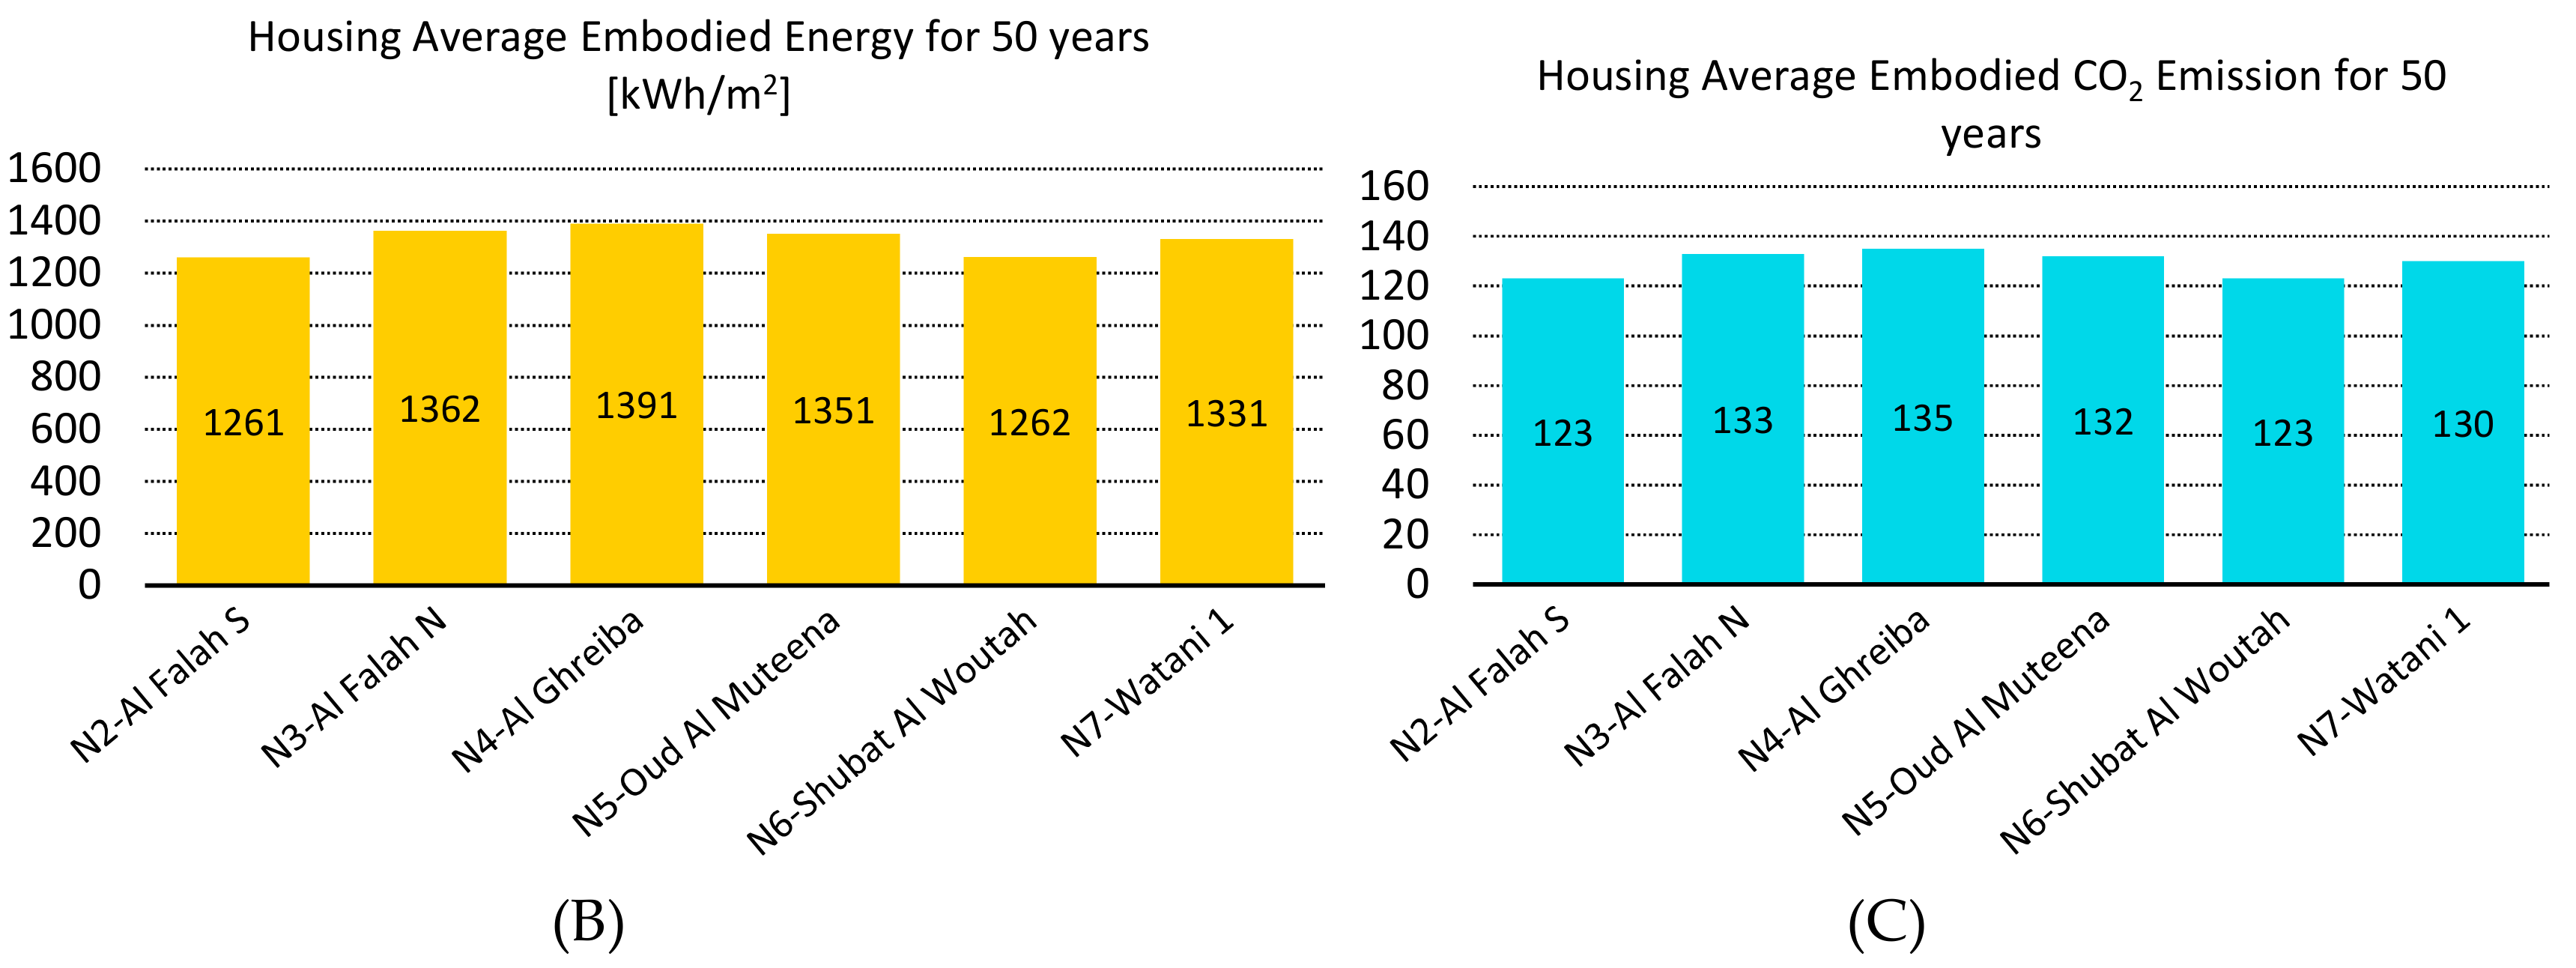
N2-Al Falah South neighborhood was close to the sustainability benchmark with an operational EUI of 96 kwh/m2, followed by N6-Shubat Al Woutah neighborhood with an operational EUI of 100 kwh/m2. Table 3 comparatively illustrates the results of the operational and cooling EUIs analysis, obtained through the UMI simulations for the six studied neighborhoods. The results are for all buildings—including service and facilities buildings—in the neighborhoods, but the main focus of this research is on housing buildings. In addition to the EUIs results, the table also illustrates the average annual embodied energy as well as the CO2 emissions, both calculated for a 50-year period. Meanwhile, Figure 5A–C depict the bar charts for the comparative results of the housing units.
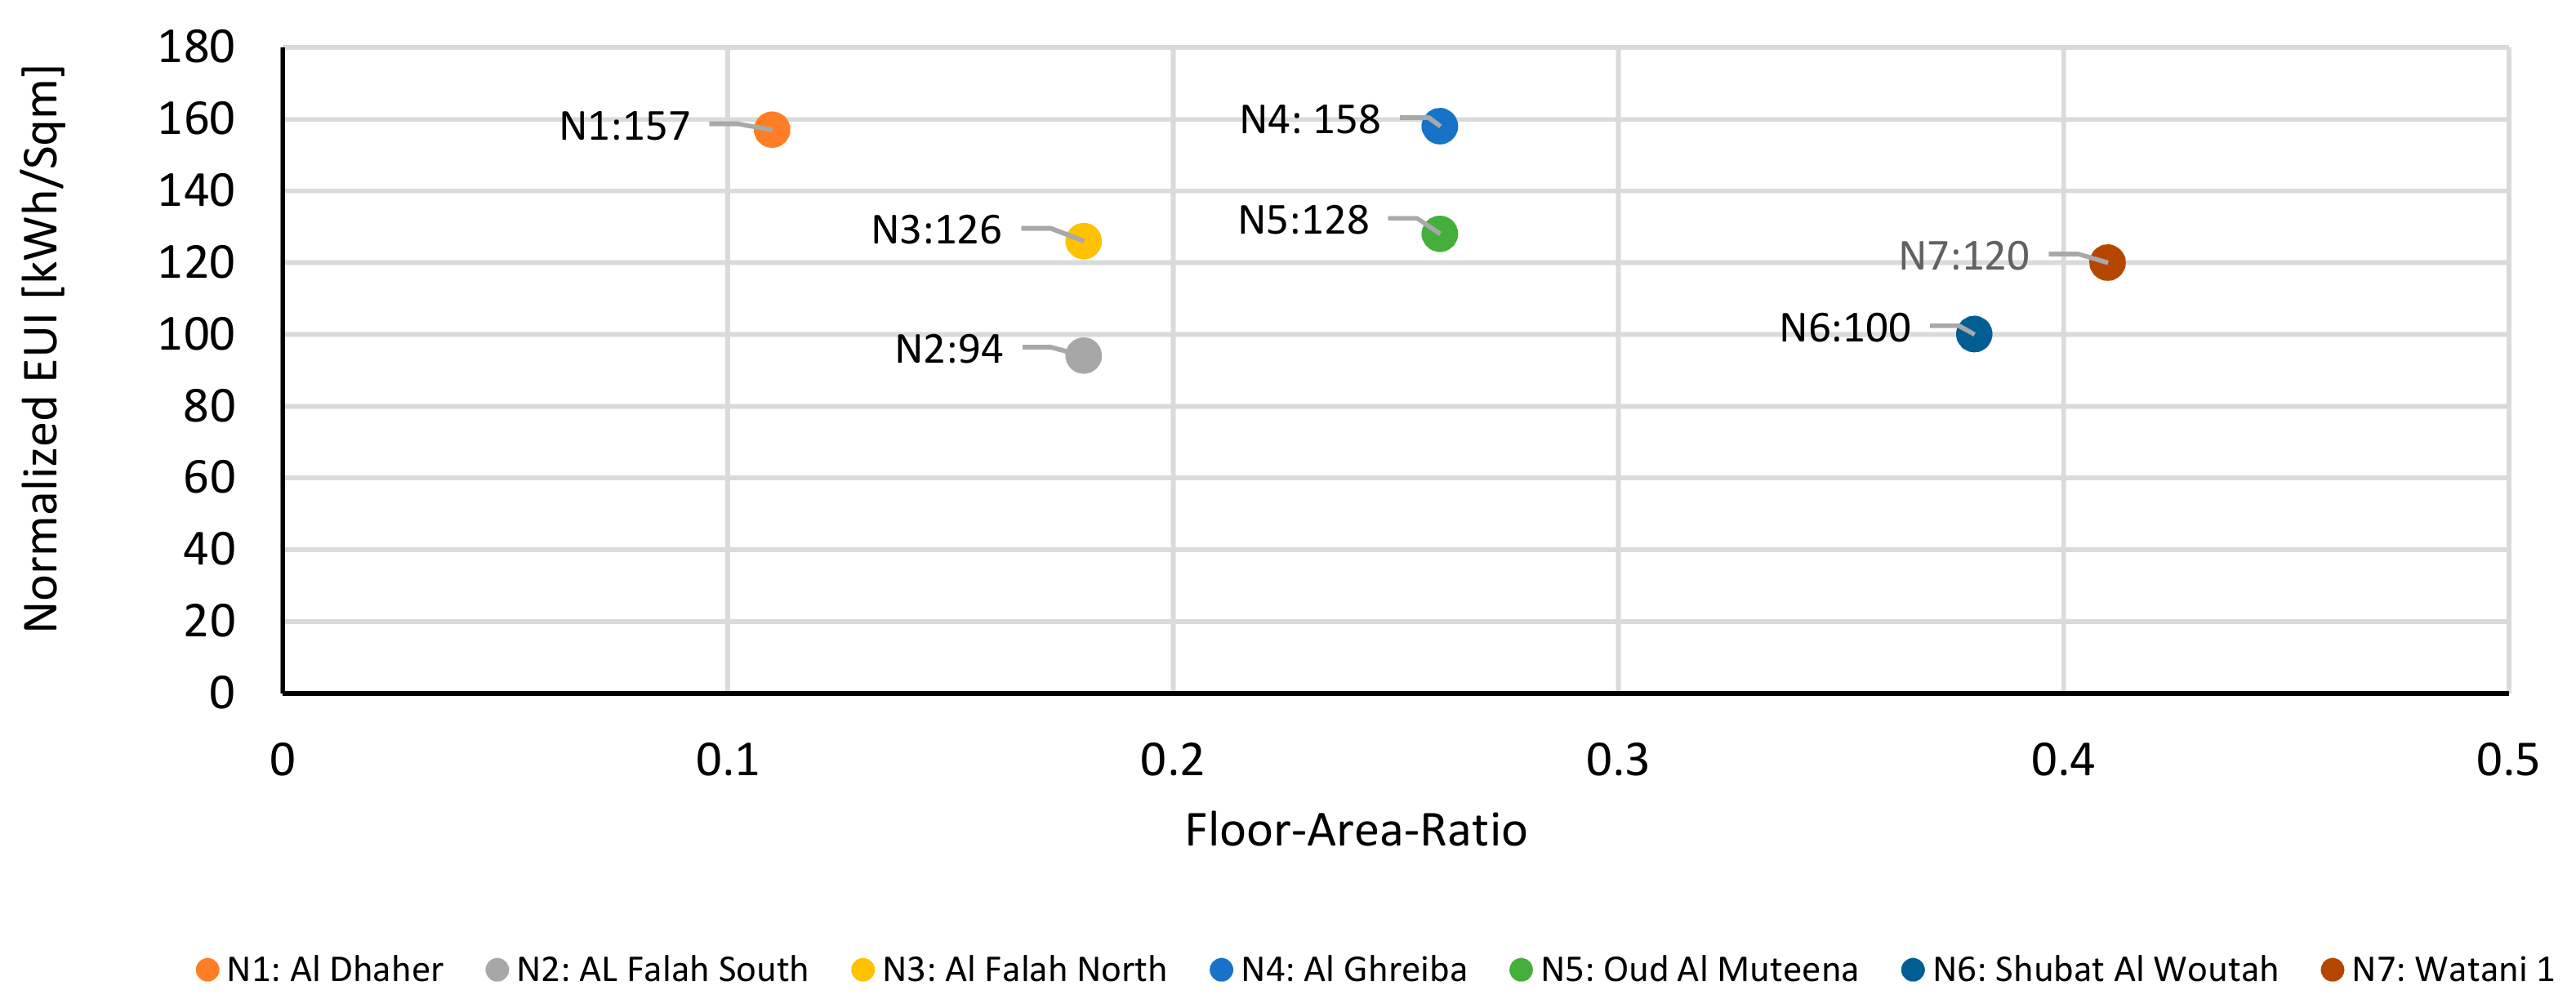
The correlation between the FAR and the operational EUI for housing in the studied neighborhoods (Figure 6) revealed that increasing compaction (FAR) did not necessarily decrease the operational EUI as expected. Increasing the FAR to 0.26 in N4, Al Ghreiba neighborhood showed nearly the same operational EUI as the conventional urban sprawl of N1-Al Dhaher neighborhood, with its very low FAR of 0.11. Meanwhile, N5-Oud Al Muteena neighborhood, with the same FAR of 0.26, achieved a decreased operational EUI of 128 kwh/m2. In addition, the most compact neighborhood of N7-Watani 1, with a FAR of 0.41, did not have the lowest operational EUI value (116 kwh/m2), while other less compact neighborhoods—N6-Shubat Al Woutah and N2-Al Falah South, with FARs of 0.38 and 0.18, respectively—had lower operational EUI values of 100 and 96 kwh/m2. The best-performing neighborhood was N2-Al Falah South, with an operational EUI of 96 kwh/m2, while its FAR was just 0.18.
These results explicitly indicate that the increased degree of compactness of the recent so-called sustainable neighborhoods has not been sufficient in lowering the operational EUI, including both the cooling EUI and the embodied energy consumption, despite adopting more compact urban forms with much higher FARs. Therefore, if urban compaction (FAR) is not the most significant influencing factor for yearly operational and cooling EUIs, the urban morphology measures that actually influence the EUIs need to be defined. This is discussed in the following section.
7. Justification of Results
To justify the results and define the real influencing housing urban morphology measures that affect operational and cooling EUIs, four experiments were tailored for and implemented in the selected neighborhoods. The measures addressed in the experiments are as follows: Lot coverage, street grid pattern, building mass geometry, and climate zone. In each of these four experiments, one of the measures was set as the “variable,” and the remaining influential measures were set as “constant” amongst the compared case studies. Accordingly, the impact of each of the four examined measures could be clearly determined. Table 4, Table 5, Table 6 and Table 7 provide a detailed description of how each of the experiments was performed.
7.1. Results of Experiment 1
A significant decrease in the average annual operational and cooling EUIs was observed for all neighborhoods after considerably increasing their FAR in the build-out area case, which is defined as developing the housing plot to its full potential or theoretical capacity as permitted under current planning or zoning designations [33]. In this case, the lot coverage is set to be equal to the maximum buildable floor areas for the houses, according to the applied setback regulations in the UAE—6 m from the front, 4 m from the back, and 3 m from the two sides. This actually entails decreasing the open spaces on the whole neighborhood level as the main purpose of this experiment is to explore the effect of more ‘compaction’ of the urban form, i.e., less open and in-between spaces on the EUIs. It was expected that with the more built-up area, more total energy would be required because of the increase of the cooling loads, but what happened is that the cooling energy dropped significantly per square meter, which indicates that the compacted forms have helped cast more shade over the buildings and hence the cooling load dropped considerably.
Table 8 illustrates the operational and cooling EUI values before and after applying the maximum lot coverage, which implied a significant increase in the FARs. For example, the FAR of the N3 case study (Al Falah North) significantly increased from 0.18 to 0.32, resulting in a dramatic decrease in its average annual housing operational EUI from 126 to 94 kWh/m2—close to the Emirates GBC sustainable benchmark of 90 kWh/m2—while the average housing annual cooling EUI decreased from 89 to 53 kWh/m2. The same results were recorded for the other two neighborhoods in Abu Dhabi—N2-Al Falah South and N7-Watani 1. These results suggest that the more the lot coverage area increases (i.e., the less urban open space), the more the average housing annual operational and cooling EUIs decrease. Thus, increasing the lot coverage to the maximum buildable area of the housing lot would significantly decrease the operational and cooling EUIs.
7.2. Results of Experiment 2
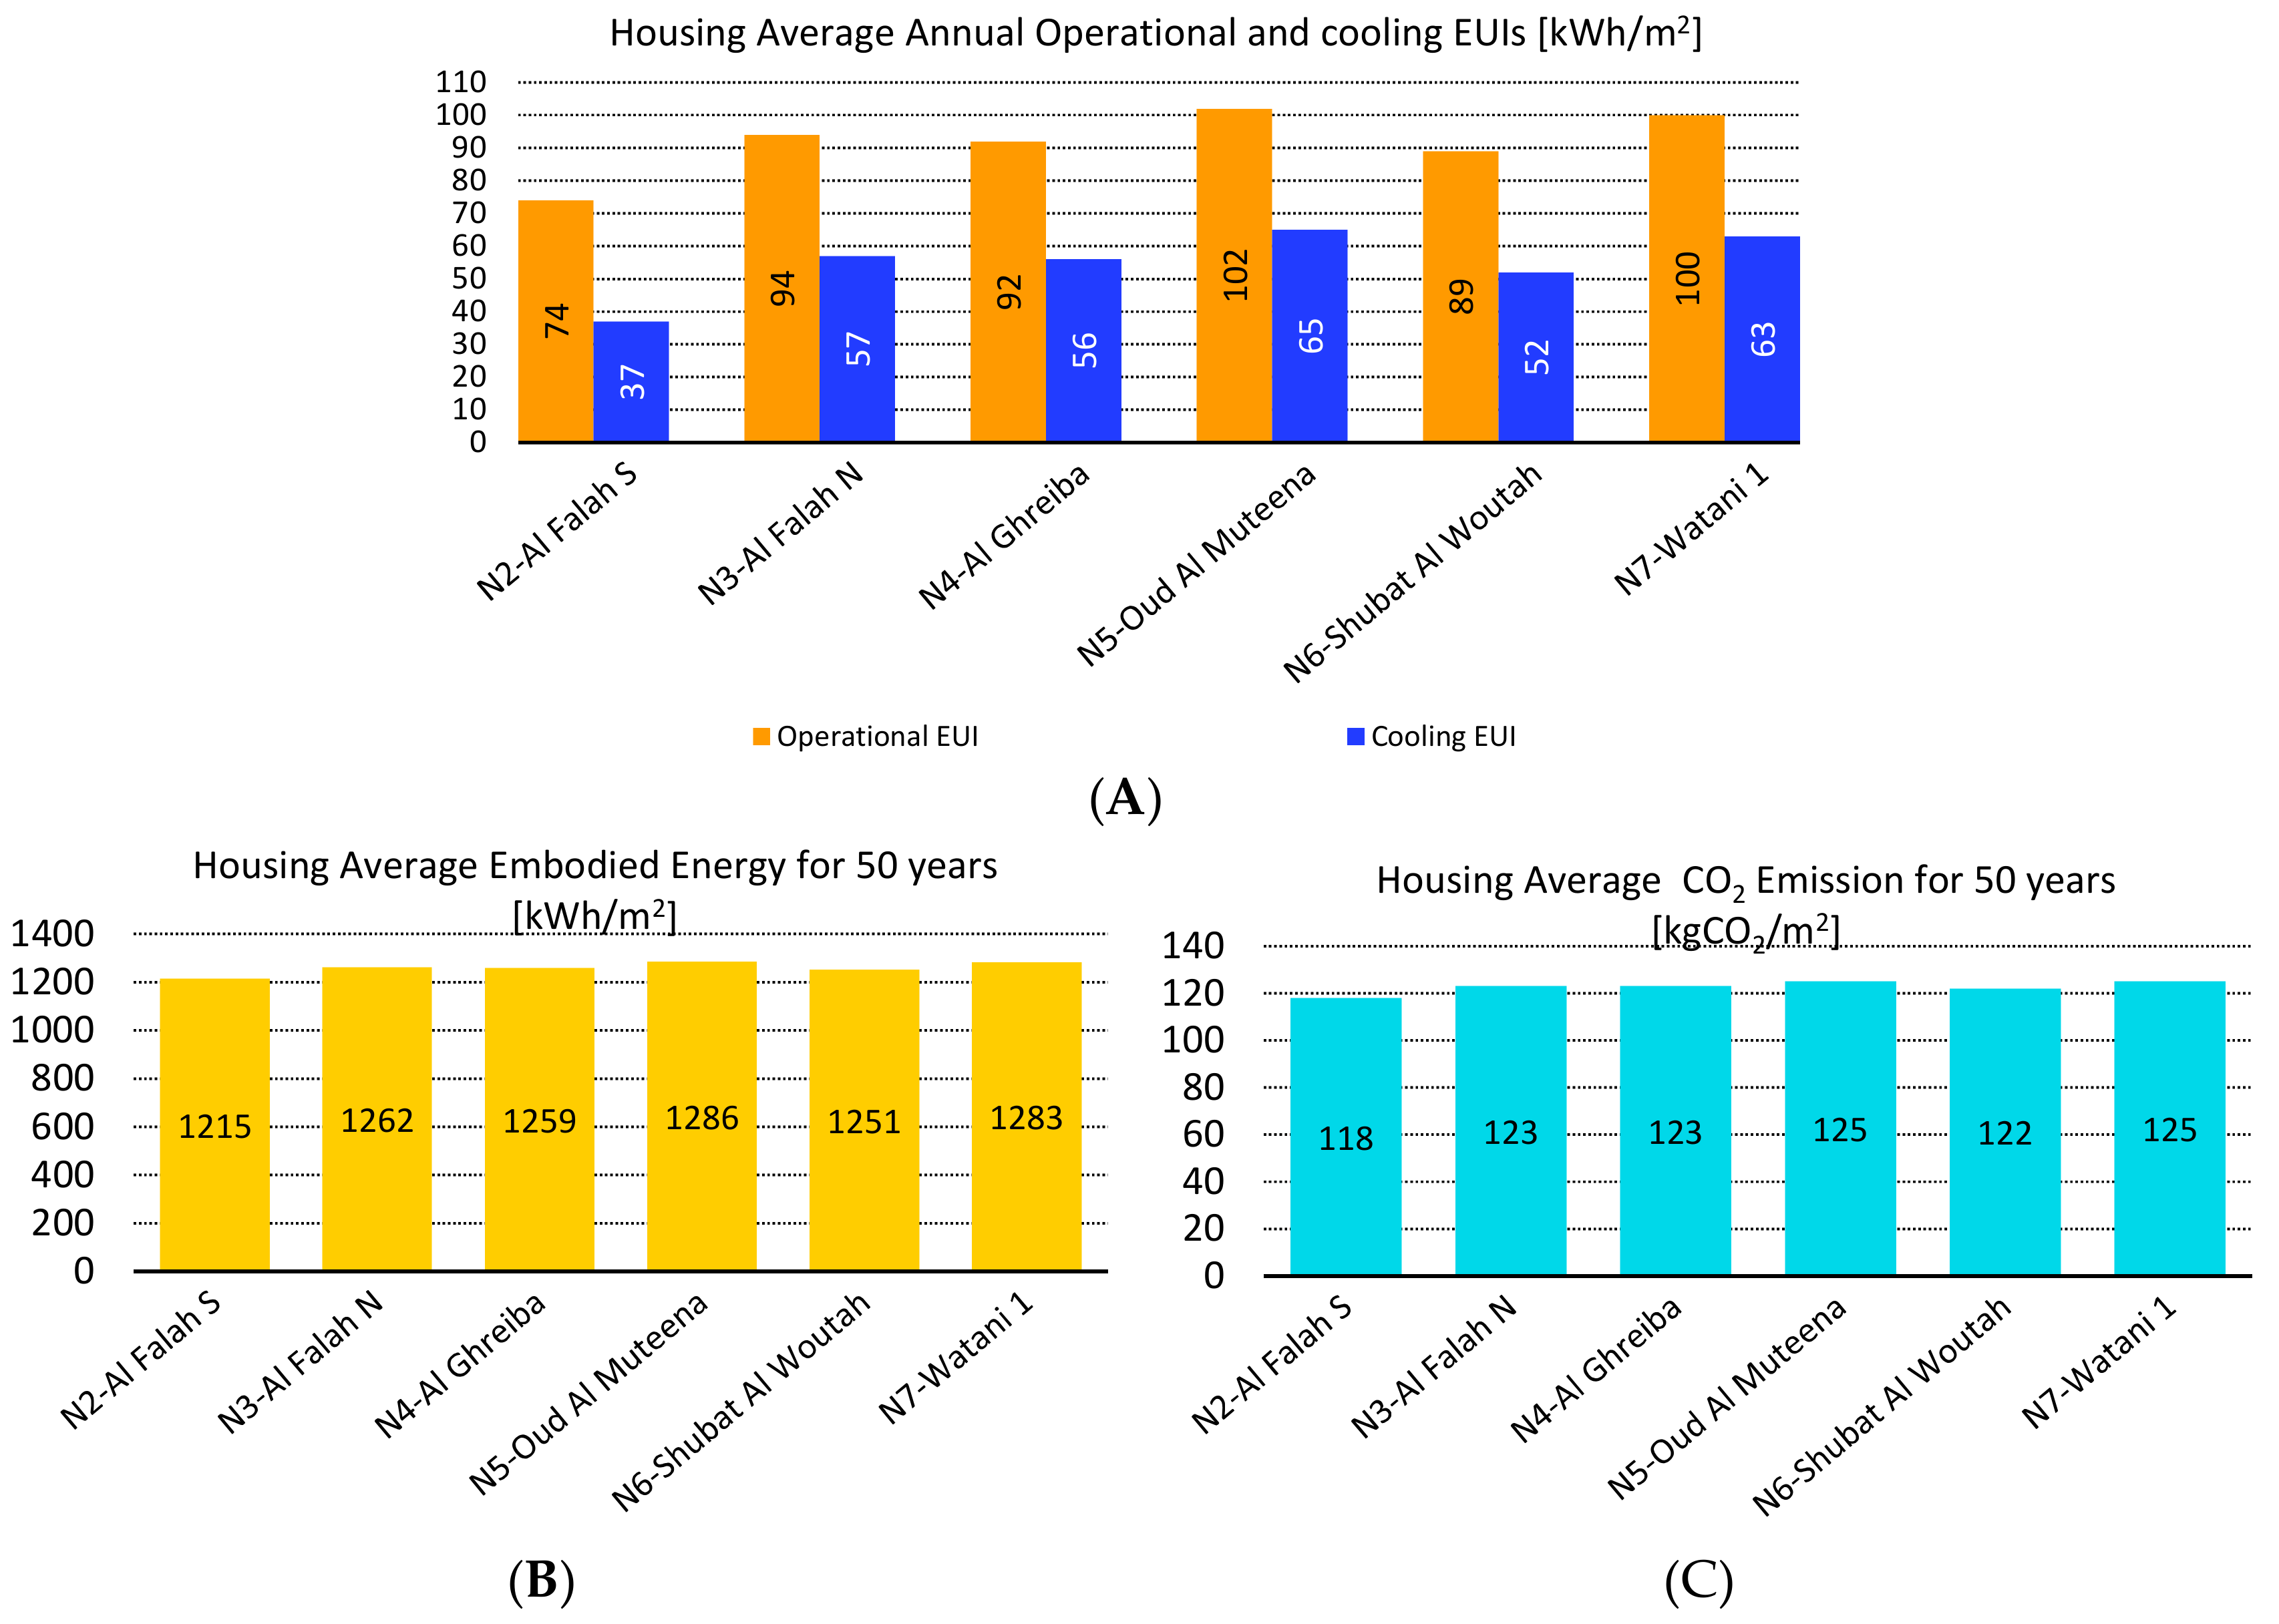
In order to evaluate the effect of the configuration of the street grid pattern on the operational and cooling EUIs, the six neighborhoods were reanalyzed after unifying all other factors including the lot coverage, the building mass geometry, and the climate. Masses for the houses in all cases were converted into simplified four square-shaped forms with a build-out area equal to the maximum allowable buildable area for houses after leaving out the setbacks, according to the regulations. Increasing the lot coverage to the maximum with the same setbacks in all neighbourhoods alienated the effect of open and in-between spaces, except that which resulted from the configuration of the street grid itself. The weather file of Abu Dhabi was used for all neighbourhoods to exclude the effect of weather. Thus, the only variable affecting the measured operational and cooling EUIs would be the street grid pattern.
As mentioned above, the rerun of the UMI simulation showed a significant increase in FARs and a drop in the operational and cooling EUIs in all cases. However, as for the effect of the street grid pattern as illustrated in Table 9 and Figure 7A–C, all neighborhoods with mostly curvilinear street grid networks—N5-Oud Al Muteena, N7-Watani 1, and N3-Al Falah North—achieved the highest average housing operational EUIs of 102, 100, and 94 kWh/m2/y, respectively, followed by the neighborhoods with partially curvilinear street networks—N4-Al Ghreiba and N6-Shubat Al Wuttah—with average housing operational EUIs of 92 and 89 kWh/m2/y, respectively. Meanwhile, N2-Al Falah South neighborhood, with its mostly orthogonal street networks, achieved the lowest average housing operational EUI of 74 kWh/m2/y. This average EUI is significantly below the Emirates GBC sustainable benchmark of 90 kWh/m2/y. In conclusion, it is evident that the street grid pattern can significantly affect the operational and cooling EUIs of the neighborhoods; the more orthogonal the street network, the lower the average housing operational and cooling EUIs.
Another aspect revealed by the street grid pattern analysis was the effect of the housing block length. The results show that the shorter the block length is, the higher the average housing operational and cooling EUIs will be. For example, for almost the same orthogonal street grid patterns in both N2-Al Falah South and N4-Al Ghreiba neighborhoods, the former achieved much lower operational and cooling EUIs than the later. The housing blocks in N2-Al Falah South neighborhood are mostly composed of 5, 6, and 10 housing plots with block lengths ranging between 300 m, 365 m, and 545 m, respectively. This far exceeds those of N4-Al Ghreiba neighborhood with its housing blocks composed of only 2, 3, 4, and 5 housing plots with block lengths ranging between 60 m, 90 m, 120 m, and 150 m, respectively.
7.3. Results of Experiment 3
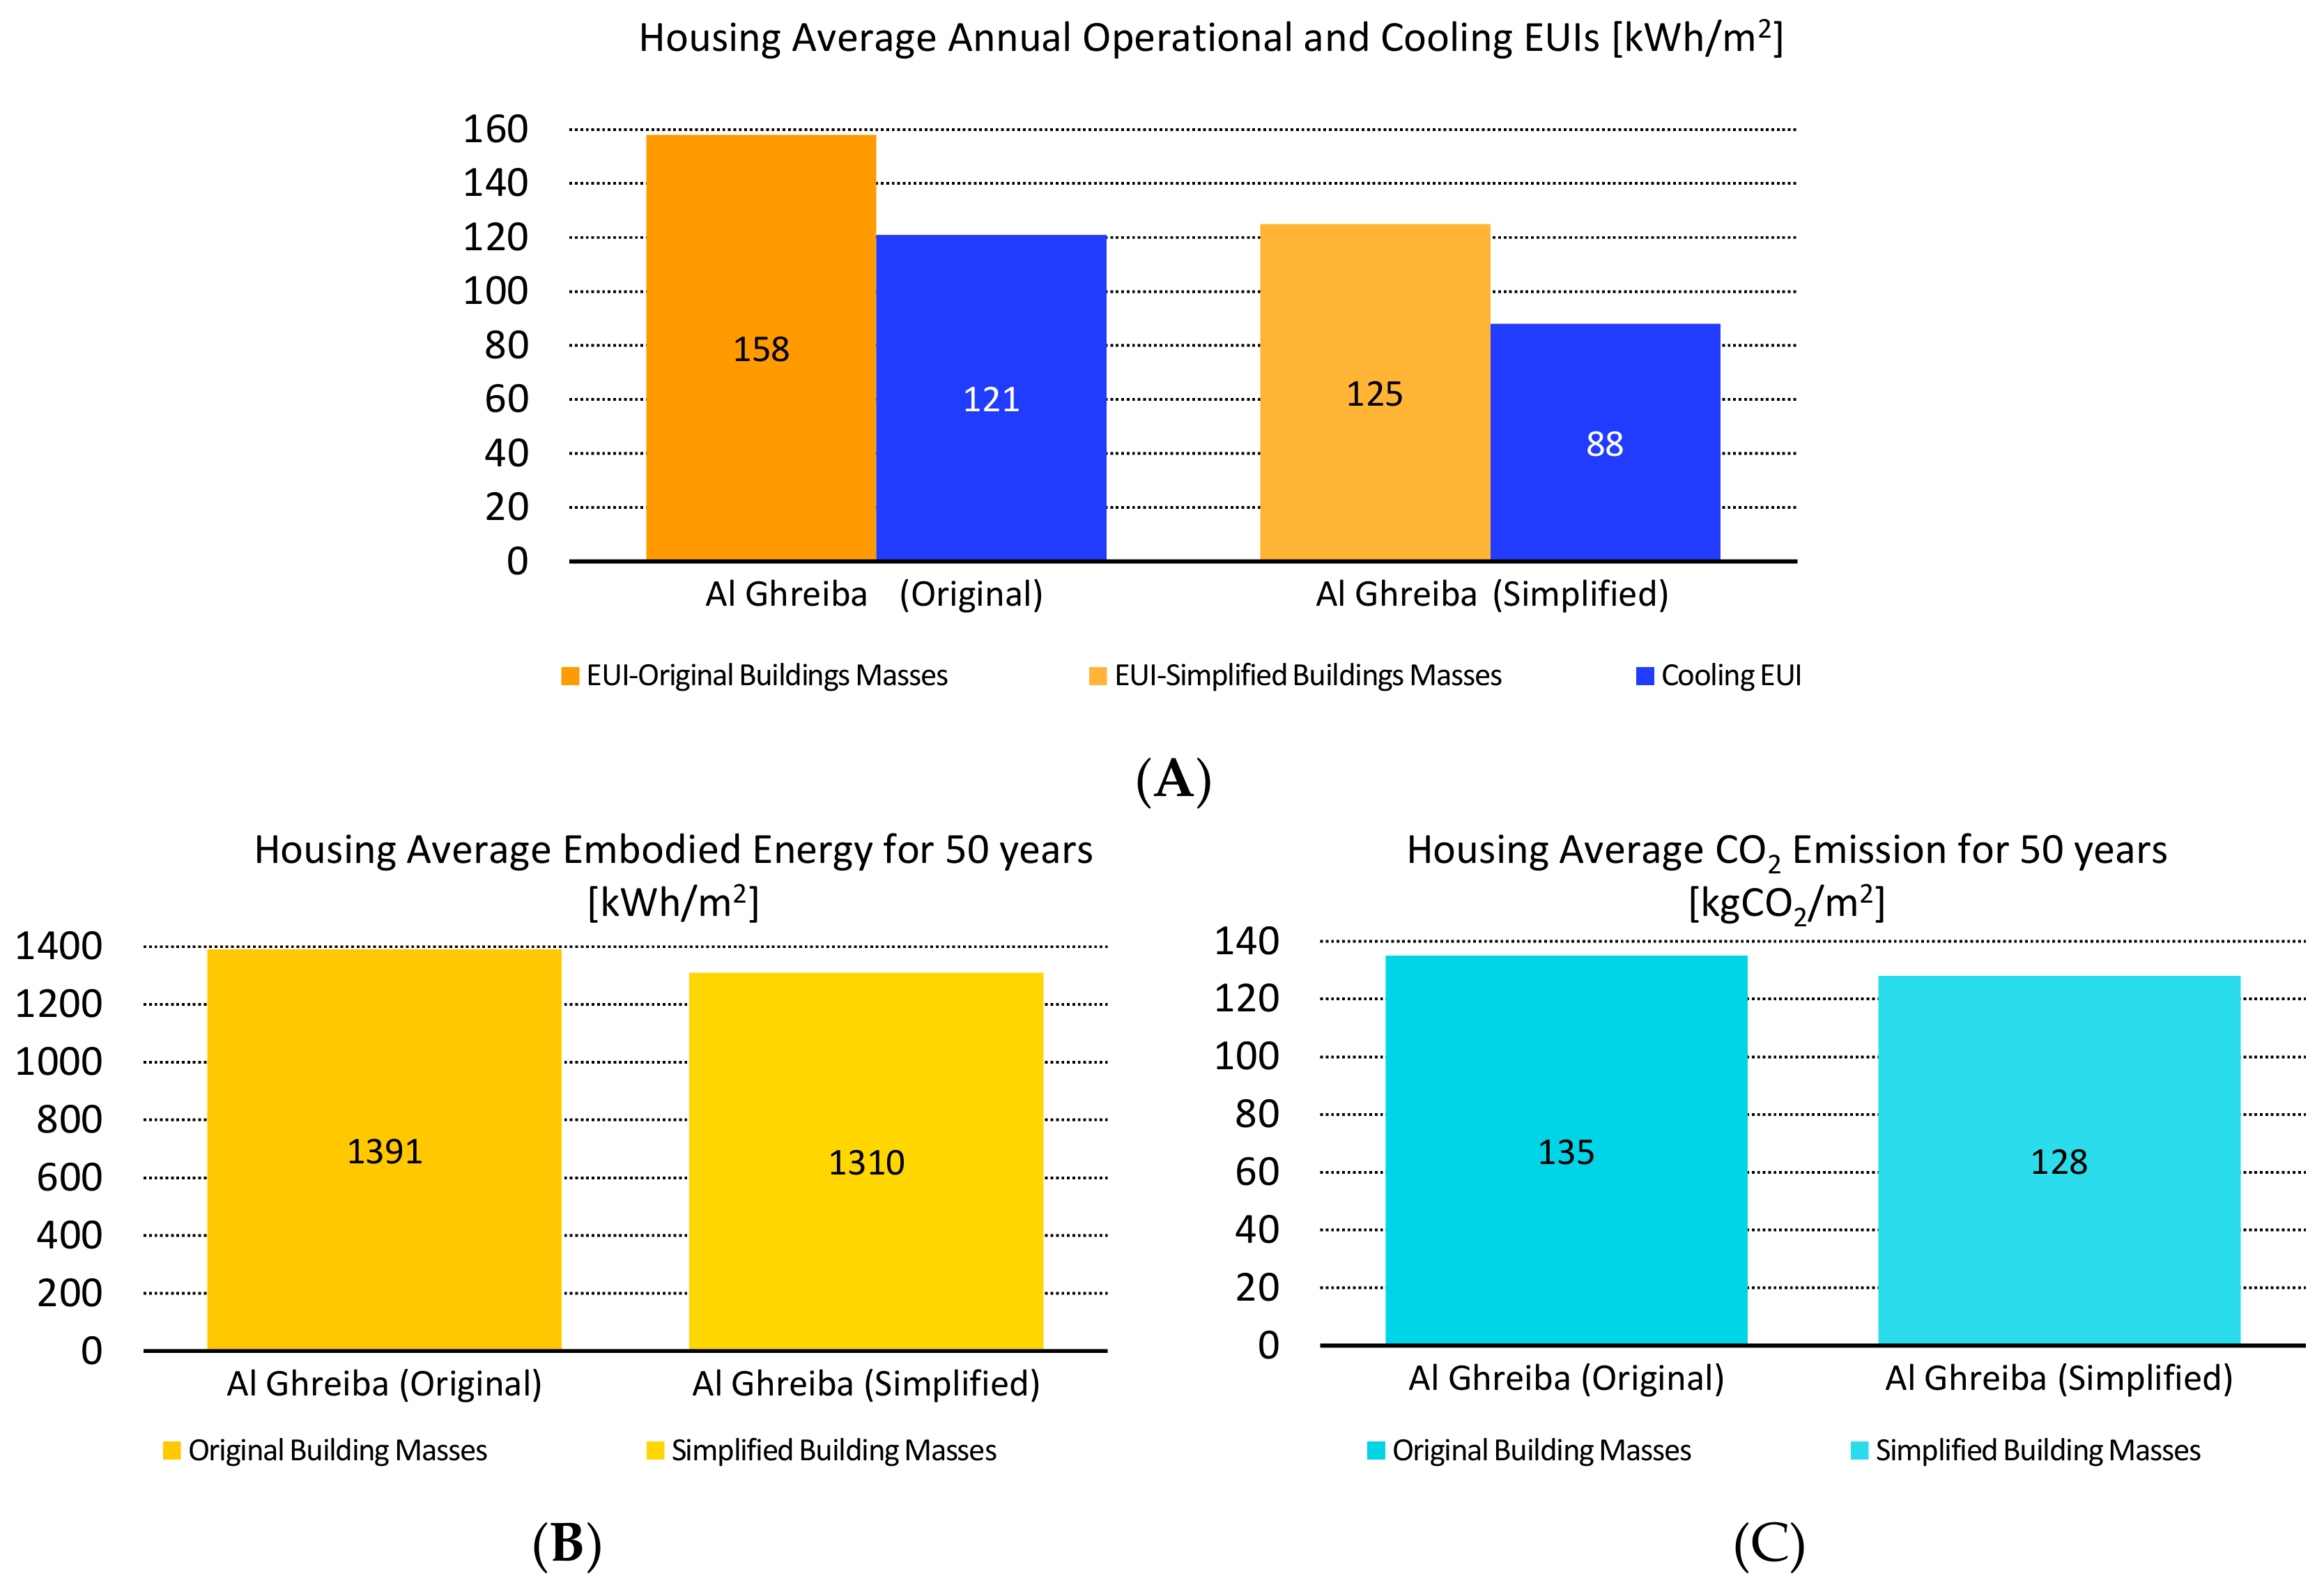
To clarify the effect of the building mass geometry on the operational and cooling EUIs, a rerun of the UMI simulation was performed for two cases in N4-Al Ghreiba neighborhood after eliminating the effects of the different street grid patterns, lot coverage, and climate zone. While using the same original street grid pattern of the neighborhood, two versions of building mass geometries were compared—the original one and a simplified four-square shape, both with exactly the same built-up area and height. As for the geometric simplification, the “square root” of the original house area was calculated and hence used to define the four-square footprint outlines of the simplified form. This has ultimately resulted in the formation of simplified four-square-shaped masses. The comparative UMI simulations for these two cases in N4-Al Ghreiba neighborhood showed that the building mass geometry has a noticeable effect on the operational and cooling EUIs (Table 10 and Figure 8A–C).
For the simplified building form, the housing operational EUI decreased from 158 to 125 kWh/m2/y on average, while the cooling energy decreased from 121 to 88 kWh/m2/y on average. The same trend appeared for the average embodied energy and the CO2 emissions for 50 years, as shown in Table 10 and Figure 8B,C. This means that the simpler the buildings mass geometry is, the lower average operational and cooling EUIs are.
7.4. Results of Experiment 4
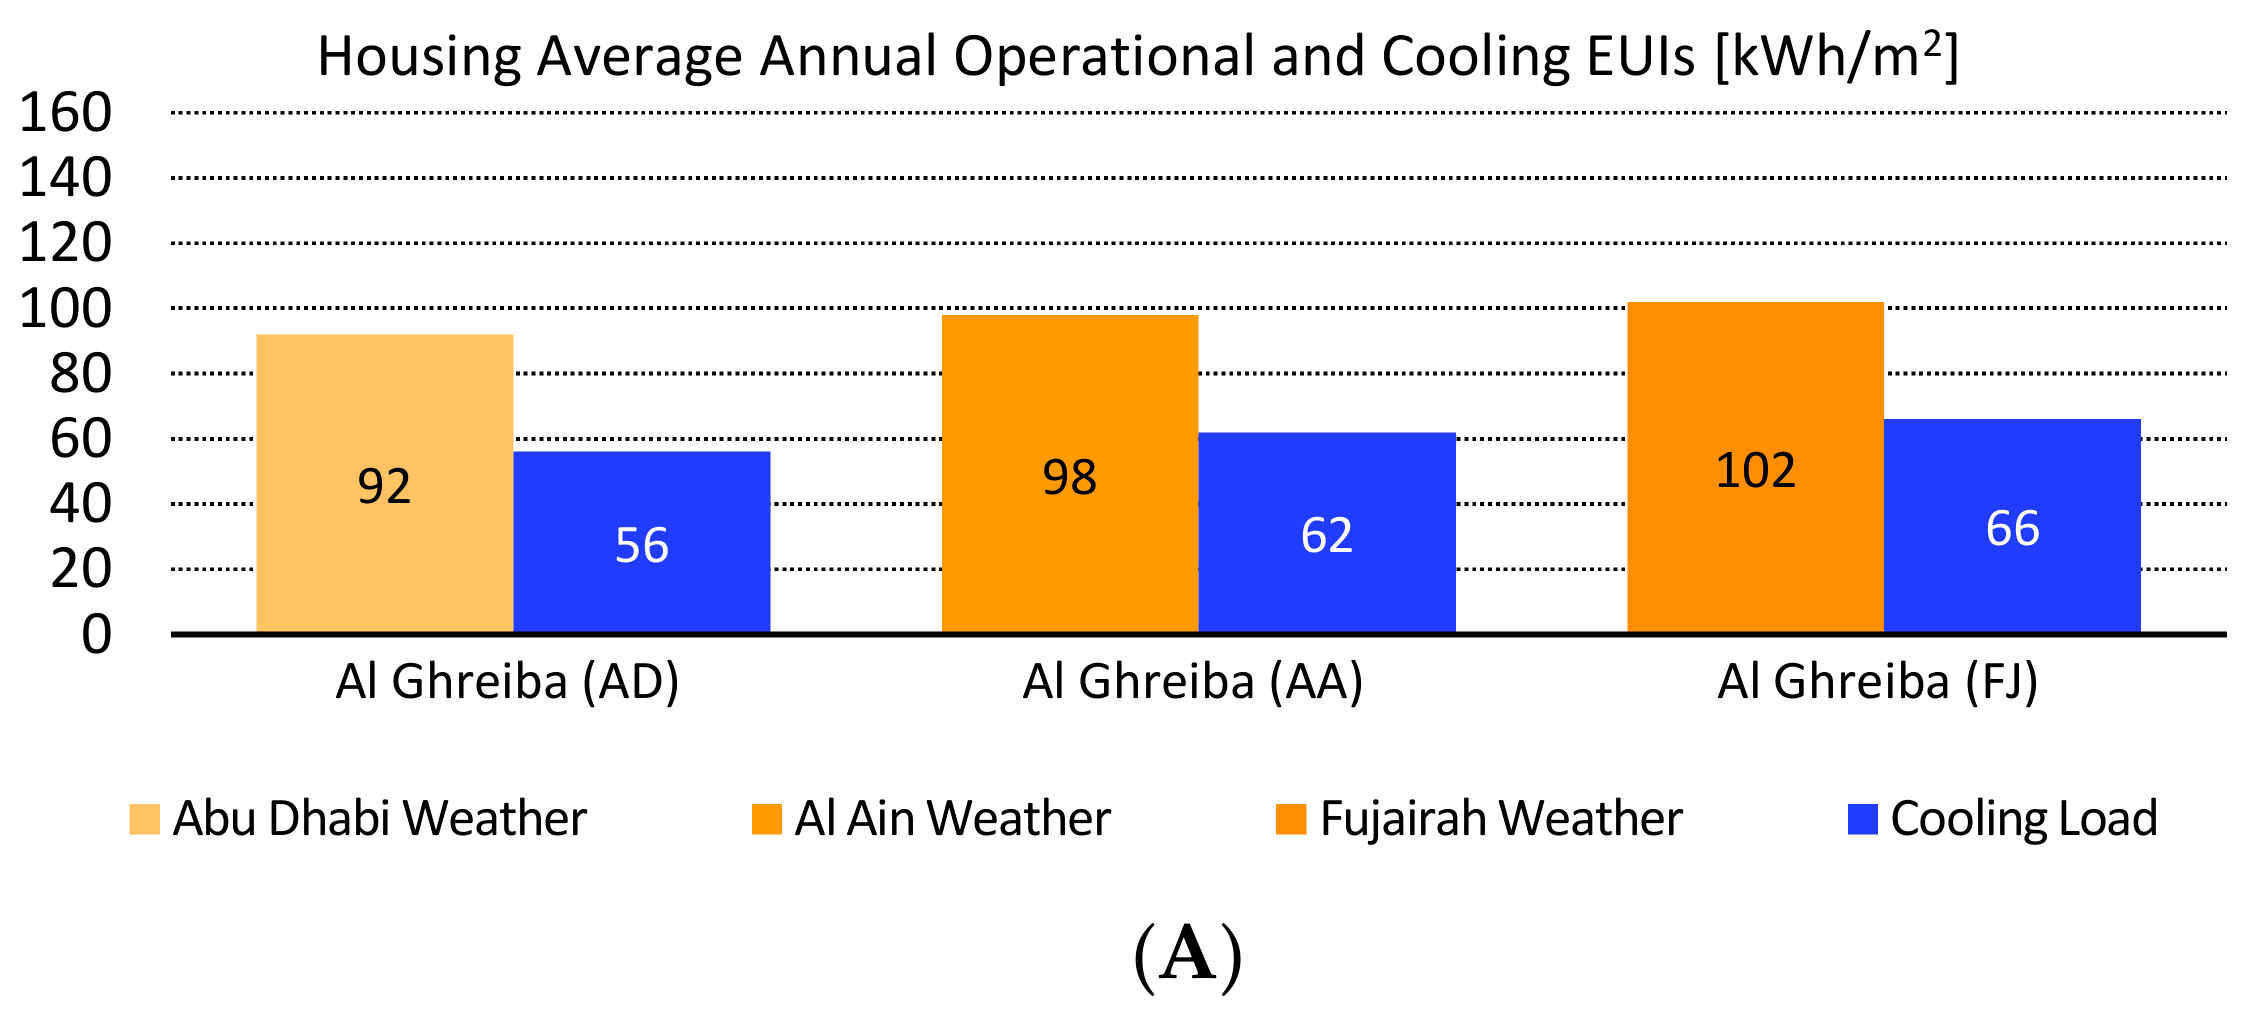
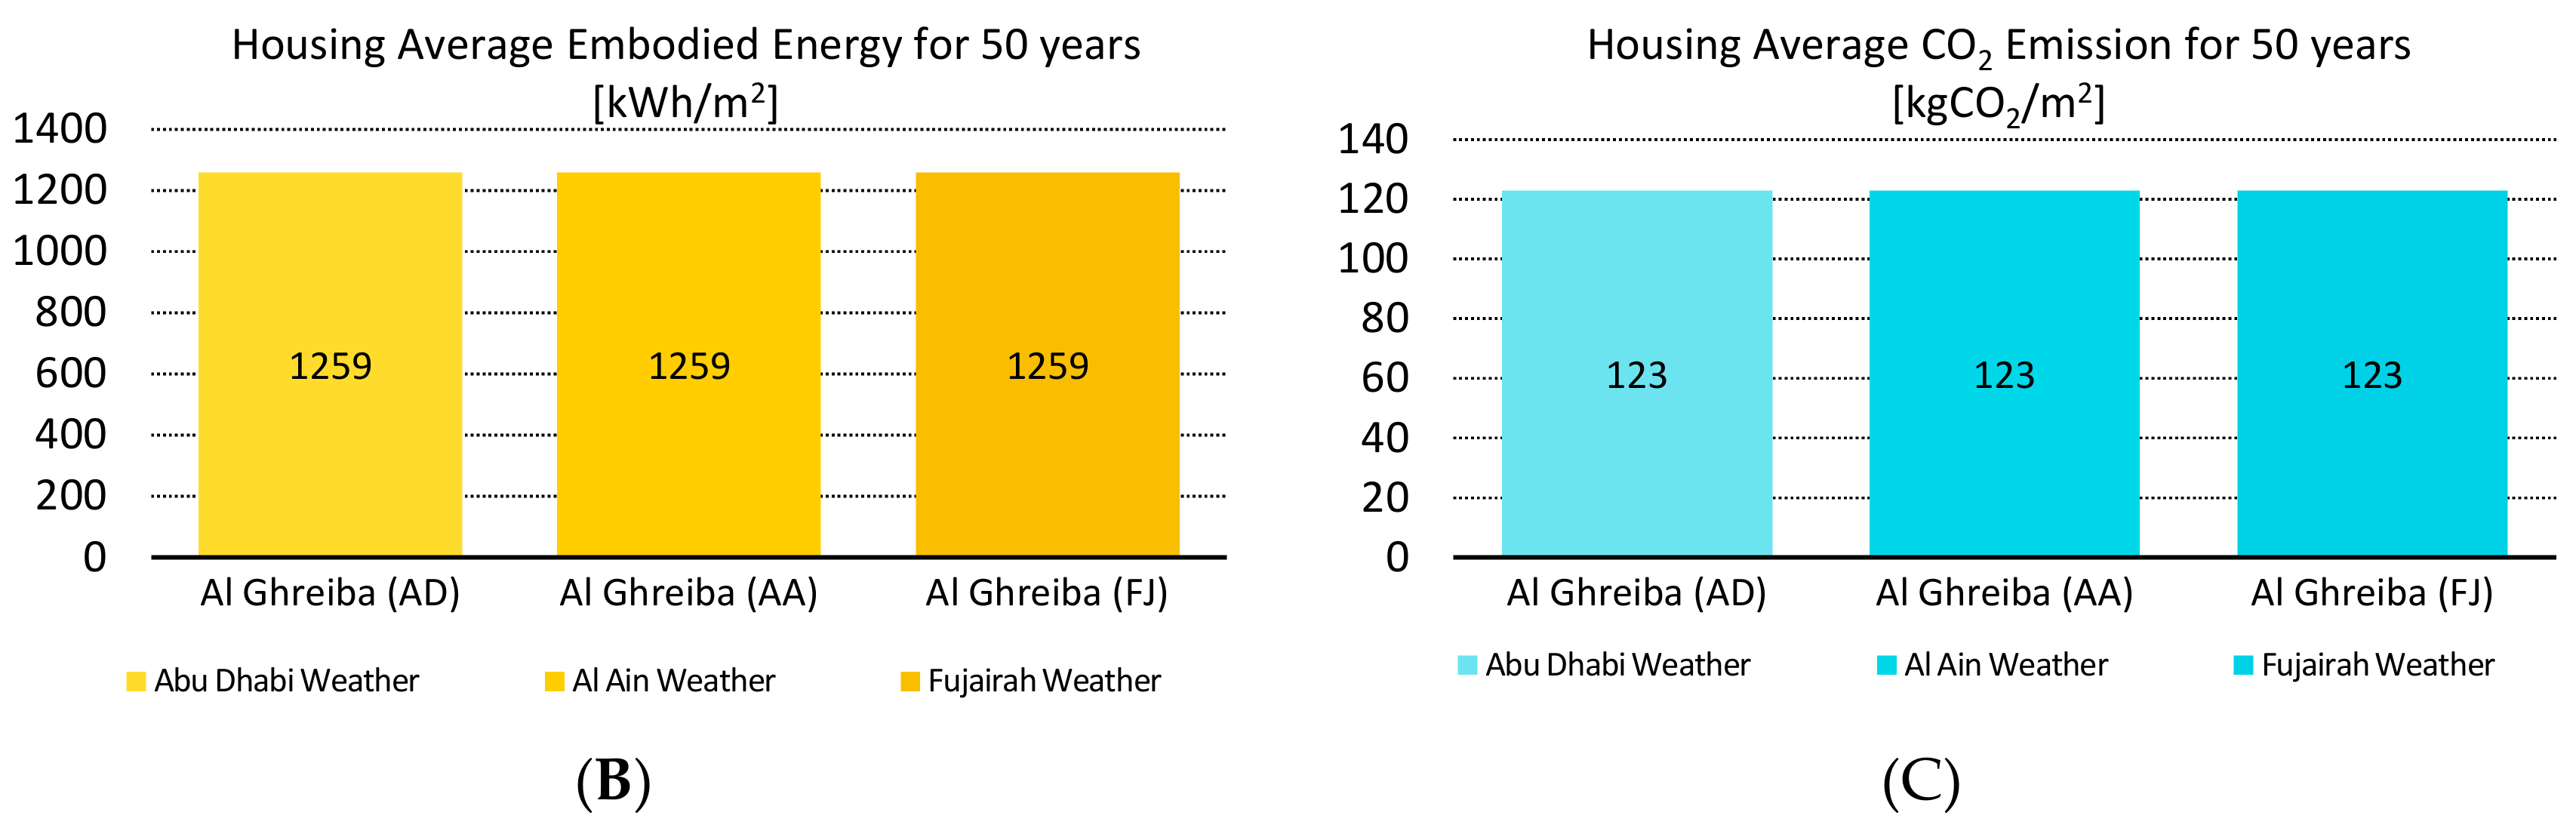
In this experiment, the N4-Al Ghreibah neighborhood was simulated under three different climate zones for the four cities of Abu Dhabi, Dubai, Al Ain, and Al Fujairah. The climate of Dubai is similar to Abu Dhabi, so the same weather file was used for the neighborhoods in Dubai and Abu Dhabi. As shown in Table 11 and Figure 9A–C, climate zone seems to have a slight impact on the average housing operational and cooling EUIs. The effect of the weather conditions in Abu Dhabi and Dubai on the average housing operational EUI was slightly better than that of Al Ain (92 vs. 98 kWh/m2/y), and the effect of weather conditions in Al Ain was slightly better than that of Al Fujairah (98 vs. 102 kWh/m2/y). The same pattern was observed for the average cooling EUI, where Al Ain recorded 62 kWh/m2/y on average and Abu Dhabi/Dubai recorded 56 kWh/m2/y on average, while Al Fujairah recorded 66 kWh/m2/y on average. This means that the climate of different UAE cities, depending on their geographical locations, may have a slight impact on the average housing operational and cooling EUIs of residential neighborhoods.
8. Discussion and Conclusions
Recently designed social housing neighborhoods in the UAE have reflected the awareness that urban sprawl hinders the achievement of sustainable urbanism. Accordingly, the urban sprawl of conventionally designed social housing neighborhoods has been converted into more compact urban forms, mainly by decreasing the housing plot sizes from an average of 45 m × 45 m to about 30 m × 32 m. This has resulted in an increase in the FAR from, for example, only 0.11 in N1—the conventional sprawling neighborhood—to 0.18 in neighborhoods N2 and N3, 0.26 in neighborhoods N4 and N5, 0.38 in neighborhood N6, and a maximum of 0.41 in neighborhood N7. Unfortunately, such a shift from the conventional paradigm of sprawling urban design to more compact urban forms occurred without sufficient evidence on the resulting operational and cooling EUIs. The computational analysis of six recently developed neighborhoods with more compact urban forms, representing different street grid patterns and geographical distribution, surprisingly revealed an inconsistent relationship between the FAR and the neighborhood’s average annual housing operational and cooling EUIs. The results showed that a neighborhood with nearly double the FAR of the conventional sprawling urban neighborhood achieved almost the same housing operational EUI, while another neighborhood with the same FAR achieved a much lower EUI. The neighborhood with the maximum FAR of 0.41 did not achieve the best energy performance; instead, it was achieved by a neighborhood with a much lower FAR. Another important finding is that, despite their more compact urban forms, all studied neighborhoods have not succeeded in meeting the Emirates GBC’s sustainability benchmark EUI of 90 kWh/m2/y [18], which itself is still far from both the Architecture 2030 Challenge of 41.3 kWh/m2/yr [25] and the sustainability 2030 Challenge of 57 kWh/m2/yr [2].
Based on these results and in order to reveal the factors related to urban form that affect the operational and cooling EUIs, beyond merely increasing the FAR through limiting the housing plot area, four measures—lot coverage, street grid pattern, building mass geometry, and climate zone—were defined and studied through four tailored simulation experiments. The results of the computational simulations of these experiments indicated that the first three measures do have a significant effect on the average housing operation and cooling EUIs of urban neighborhoods. First, increasing the lot coverage area to the maximum buildable area after leaving setbacks (build-out area) led to a significant increase in the urban form compactness ratio, causing remarkable reductions in the operational and cooling EUIs for all buildings. Normally, when the built-up area increases, the chance of buildings mutually casting shadows on one another increases, causing less energy demand for cooling, which normally consumes most of the operational energy. Second, the orthogonal grid pattern of the streets (and urban spaces) performed better than curvilinear spaces in terms of reducing the operational and cooling EUIs. This is possibly due to buildings/houses’ greater exposure to the sun rays. This increased exposure results from the wider space shapes of the plots and the vacant “triangular” spaces left with no apparent use. These unidentified land shapes, especially at the end of housing blocks, reduce the effects of compactness and leave several houses unshaded. Third, longer block lengths resulted in enhanced energy use performance. This is because the linear spaces between the housing blocks—pedestrian pathway, street, etc.—decrease the chance for the mutual shading of housing masses. Still, it is important that the block lengths are not too long, as this would discourage walkability and therefore increase reliance on private cars and the energy consumed by car fuels. Fourth, simplified building mass geometry, with its reduced outer perimeter and, thus, its lessened exposure to outside environmental conditions, resulted in lower operational and cooling EUIs. Only the effect of climate zone in the four different UAE cities proved to be less significant on the average annual housing operational and cooling EUIs.
Therefore, the computational analysis of the four experiments suggests that, to achieve an operational EUI in single-family social housing neighborhoods in the UAE that is close to or better than the operational EUI of the Emirates GBC sustainability benchmark of 90 kWh/m2/y, the following actions should be considered:
First: Increasing the lot coverage of houses to the maximum buildable area on both floors according to the commonly applied setback regulations in the UAE—6 m from the front, 4 m from the back, and 3 m from both sides of the housing plot. This implies a considerable increase in the FAR that exceeds what has been achieved so far in neighborhood design in the UAE. To avoid the counter effect of the increase of the built-up area that might lead to the increase in total energy use, the house lot area could be divided to accommodate two semi-detached houses instead of one detached house. This will keep the benefit of the increased lot coverage feasible despite the increase in the built-up area. Or, which might be even more practical, to keep the FAR high through decreasing house lot area and, thus, the whole neighborhood open spaces while still building on the maximum allowable area on each housing plot. To overcome the resulting decrease in open green spaces, the setback open spaces, especially the front and backyards, could be planted with trees that increase the chance for shading and therefore enhance the energy performance and air quality. The current wide open spaces, originally planned as green areas (but are usually left vacant!) in many neighborhoods in the UAE’s harsh weather context, have negative impact on energy performance beside that the amount of irrigation water needed to maintain such wide green areas, if developed, are costly and unsustainable. Therefore, developing limited green areas with native plant species and trees within the setback spaces are more appropriate from sustainability point of view. This deserves an investigation in a separate study.
Second: Avoiding the curvilinear street grid pattern and utilizing the orthogonal pattern as much as possible. It seems that the curvilinear street grid form (and its associated increased urban open spaces) results in higher operational and cooling EUIs. Nonetheless, studying other effects of preferring the orthogonal over the curvilinear street grid patterns especially on the ease of vehicular mobility and livability is another important point for further research especially in terms of safety issues including drivers’ sightlines and so on.
Third: Avoiding short housing block lengths. The shorter the block length, the higher the average housing operational and cooling EUI will be in the neighborhood. While longer block lengths enhance energy efficiency, still, this should be carefully studied as increasing a block length to a certain limit might hinder walkability.
Fourth: Simplifying the building mass forms as much as possible because the simpler the building mass geometry is, the less the average operational and cooling EUI. Simplifying building mass geometry would require more effort from the designers to keep attractiveness and acceptability, while enhancing energy performance.
In conclusion, the main contribution of this study is a call for urban planners and designers to think beyond the compaction of urban form through simply decreasing the housing plot area when it comes to achieving sustainable urban forms in the UAE. While achieving greater urban compactness (i.e., much higher FARs) is still necessary, other essential urban morphological measures—such as lot coverage area, street grid patterns, and building mass geometries—should be considered to achieve more sustainable urban forms. In addition, the climate zone effect, albeit not that significant, should be considered when the federal or local social housing authorities prepare new social housing neighborhood designs in different cities in the UAE.
It is worth mentioning here that the recommendations of this study can be accepted only as a theoretical exercise that might need further validation in reality. Further research could be extended to include the effect of street space orientation, walkability and its effect on energy consumed in car movement inside neighborhoods, and other factors that were not investigated in this study. Adding these future investigations to the findings of this study would ultimately help create a roadmap for the design of appropriate urban forms and morphologies that cater to realizing sustainable urban communities in the UAE and potentially in other neighboring countries.
Author Contributions
K.G.A. conceived and designed the experiments, S.M.H.A. performed the experiments, K.G.A. and S.M.H.A. analyzed the data, and K.G.A. wrote the paper.
Funding
This research was funded by the Emirates Center of Energy and Environment Research (ECEER), United Arab Emirates University, grant number 31R104. The APC was funded by the ECEER, UAEU.
Acknowledgments
The researchers would like to thank the Research Office at the UAEU for facilitating all the activities of this funded project under the Centre-based Interdisciplinary Grant Program.
Conflicts of Interest
The authors declare no conflict of interest.
References
- Six Metrics Every Architect Should Know. Available online: https://blog.sketchup.com/article/six-metrics-every-architect-should-know-and-how-use-them (accessed on 14 August 2018).
- Sun, Y.; Silva, E.A.; Tian, W.; Choudhary, R.; Leng, H. An Integrated Spatial Analysis Computer Environment for Urban-Building Energy in Cities. Sustainability 2018, 10, 4235. [Google Scholar] [CrossRef]
- Quana, S.J. Energy efficient neighborhood design under residential zoning regulations in Shanghai. Energy Procedia 2017, 143, 865–872. [Google Scholar] [CrossRef]
- Chen, Y.; Hong, T.; Piette, M.A. Automatic Generation and Simulation of Urban. Building Energy Models Based on City Datasets for City-Scale Building Retrofit Analysis; Lawrence Berkeley National Laboratory: Berkeley, CA, USA, 2018. [Google Scholar]
- Quan, S.J.; Li, Q.; Augenbroe, G.; Brown, J.; Yang, P.P. Urban Data and Building Energy Modeling: A GIS-Based Urban Building Energy Modeling System Using the Urban-EPC Engine. In Planning Support Systems and Smart Cities; Geertman, S., Ed.; Springer International Publishing: Basel, Switzerland, 2015. [Google Scholar] [CrossRef]
- Urban Form and Sustainability. Available online: http://www.rtpi.org.uk/media/1360966/urban%20form%20and%20sustainability%20briefing.pdf (accessed on 24 June 2018).
- Burton, E.; Jenks, M.; Williams, K. Achieving Sustainable Urban Form; Routledge: London, UK, 2013. [Google Scholar]
- Coppolaa, P.; Papab, E.; Angielloc, G.; Carpentieric, G. Urban Form and Sustainability: The Case Study of Rome. Procedia Soc. Behav. Sci. 2014, 160, 557–566. [Google Scholar] [CrossRef]
- Smart Growth Principles. Available online: http://smartgrowth.org/smart-growthprinciples/ (accessed on 29 August 2018).
- The Institute for Local Government. Understanding the Basics of Land Use and Planning: Glossary of Land Use and Planning Terms; The Institute for Local Government: Sacramento, CA, USA, 2010. [Google Scholar]
- International Seminar on Urban Form. Available online: http://www.urbanform.org/about.html (accessed on 16 June 2018).
- Center for Liveable Cities. 10 Principles for Liveable High-Density Cities; Centre for Liveable Cities and Urban Land Institute: Singapore, 2013.
- Neuman, M. The Compact City Fallacy. J. Plan. Edu. R. 2005, 25, 11–26. [Google Scholar] [CrossRef]
- Jenks, M.; Burgess, R. (Eds.) Compact Cities: Sustainable Urban. Forms for Developing Countries; Spon Press: London, UK, 2000. [Google Scholar]
- Sustainable Cities or Sustainable Urbanization? Perspective. Available online: http://www.ucl.ac.uk/sustainable-cities (accessed on 23 March 2018).
- Energy Efficiency Urban Planning Guidelines for MENA Region. Available online: http://www.med-enec.eu/sites/default/files/user_files/downloads/2013.12.10%20-EE %20EE%20Urban%20Planning%20brochure.pdf (accessed on 3 October 2018).
- Aydin, E.E.; Jakubiec, A. Sensitivity Analysis of Sustainable Urban Design Parameters: Thermal Comfort, Urban Heat Island, Energy, Daylight, and Ventilation in Singapore. In Proceedings of the Building Simulation and Optimization 2018 Conference, Cambridge, UK, 11–12 September 2018. [Google Scholar]
- Emirates Green Building Council. Defining Nearly Zero Energy Buildings in the UAE. Available online: http://emiratesgbc.org/wp-content/uploads/2017/03/Defining-nZEBs-in-the-UAE-2017.pdf (accessed on 10 October 2018).
- United Nations Framework Convention on Climate Change. Available online: https://unfccc.int/resource/docs/convkp/conveng.pdf (accessed on 14 August 2018).
- The Pearl Rating System. Available online: http://estidama.upc.gov.ae/template/estidama/docs/PBRS%20Version%201.0.pdf (accessed on 13 November 2018).
- Abu Dhabi Urban Planning Council. The Pearl Community Rating System. Available online: http://estidama.upc.gov.ae/template/estidama/docs/PCRS%20Version%201.0.pdf (accessed on 6 June 2018).
- 22-Creating Sustainable Communities: Dubai’s Initiative for Sustainable Real Estate. Available online: http://www.dubailand.gov.ae/Arabic/Pages/Tashjee/_DSCI_pages_english_November%2010%202016.pdf (accessed on 30 October 2018).
- Abu Dhabi Housing Authority (ADHA). Abu Dhabi National Housing Guidelines for Integrated Communities: PLANNING GUIDELINE, Version 1.0; ADHA: Abu Dhabi, UAE, 2016.
- The Urban Modeling Interface (UMI). Available online: http://web.mit.edu/sustainabledesignlab/projects/umi/index.html, first accessed 29-8-2017 (accessed on 15 September 2018).
- US National Average Site EUI and LPD. Available online: https://2030ddx.aia.org/helps/National%20Avg%20EUI (accessed on 3 October 2018).
- Ministry of Energy and Industry in UAE: Home Guide to Electrical Efficiency. Available online: https://www.moei.gov.ae/en/home.aspx (accessed on 12 November 2018).
- Emirati Citizens Housing in Abu Dhabi. Available online: https://www.alittihad.ae/article/14726/2016/8-آلاف-فيلا-حصة-الدار-من-مشاريع-مساكن-المواطنين-بأبوظبي (accessed on 5 December 2018).
- Sustainable Homes See Green Building Take Shape in the UAE. Available online: https://www.thenational.ae/business/sustainable-homes-see-green-building-take-shape-in-the-uae-1.370253 (accessed on 1 October 2018).
- Plan Al Ain 2030 Urban Structure Framework Plan. Available online: http://faculty.uaeu.ac.ae/abintouq/GEO_Fall_2015/PlanAlAin2030.pdf (accessed on 12 December 2018).
- Oud Al Muteena Housing. Available online: https://www.albayan.ae/across-the-uae/news-and-reports/2018-02-15-1.3186844 (accessed on 2 September 2018).
- Shubat Al Woutah Infrastructure Completed. Available online: https://www.alittihad.ae/article/21480/2016/إنجاز-البنية-التحتية-لمنطقة-شعبة-الوطاه-بالعين (accessed on 3 October 2018).
- Watani Housing Project. Available online: https://www.emaratalyoum.com/local-section/other/2015-05-27-1.788076 (accessed on 30 June 2018).
- Understanding the Basics of Land Use and Planning: Glossary of Land Use and Planning Terms. Available online: https://www.ca-ilg.org/sites/main/files/file-attachments/2010_-_landuseglossary.pdf (accessed on 30 June 2018).
Figure 1.
Land use and the urban form of the Al Dhaher neighborhood (N1), a design model of the conventionally developed sprawling urban form.
Figure 1.
Land use and the urban form of the Al Dhaher neighborhood (N1), a design model of the conventionally developed sprawling urban form.

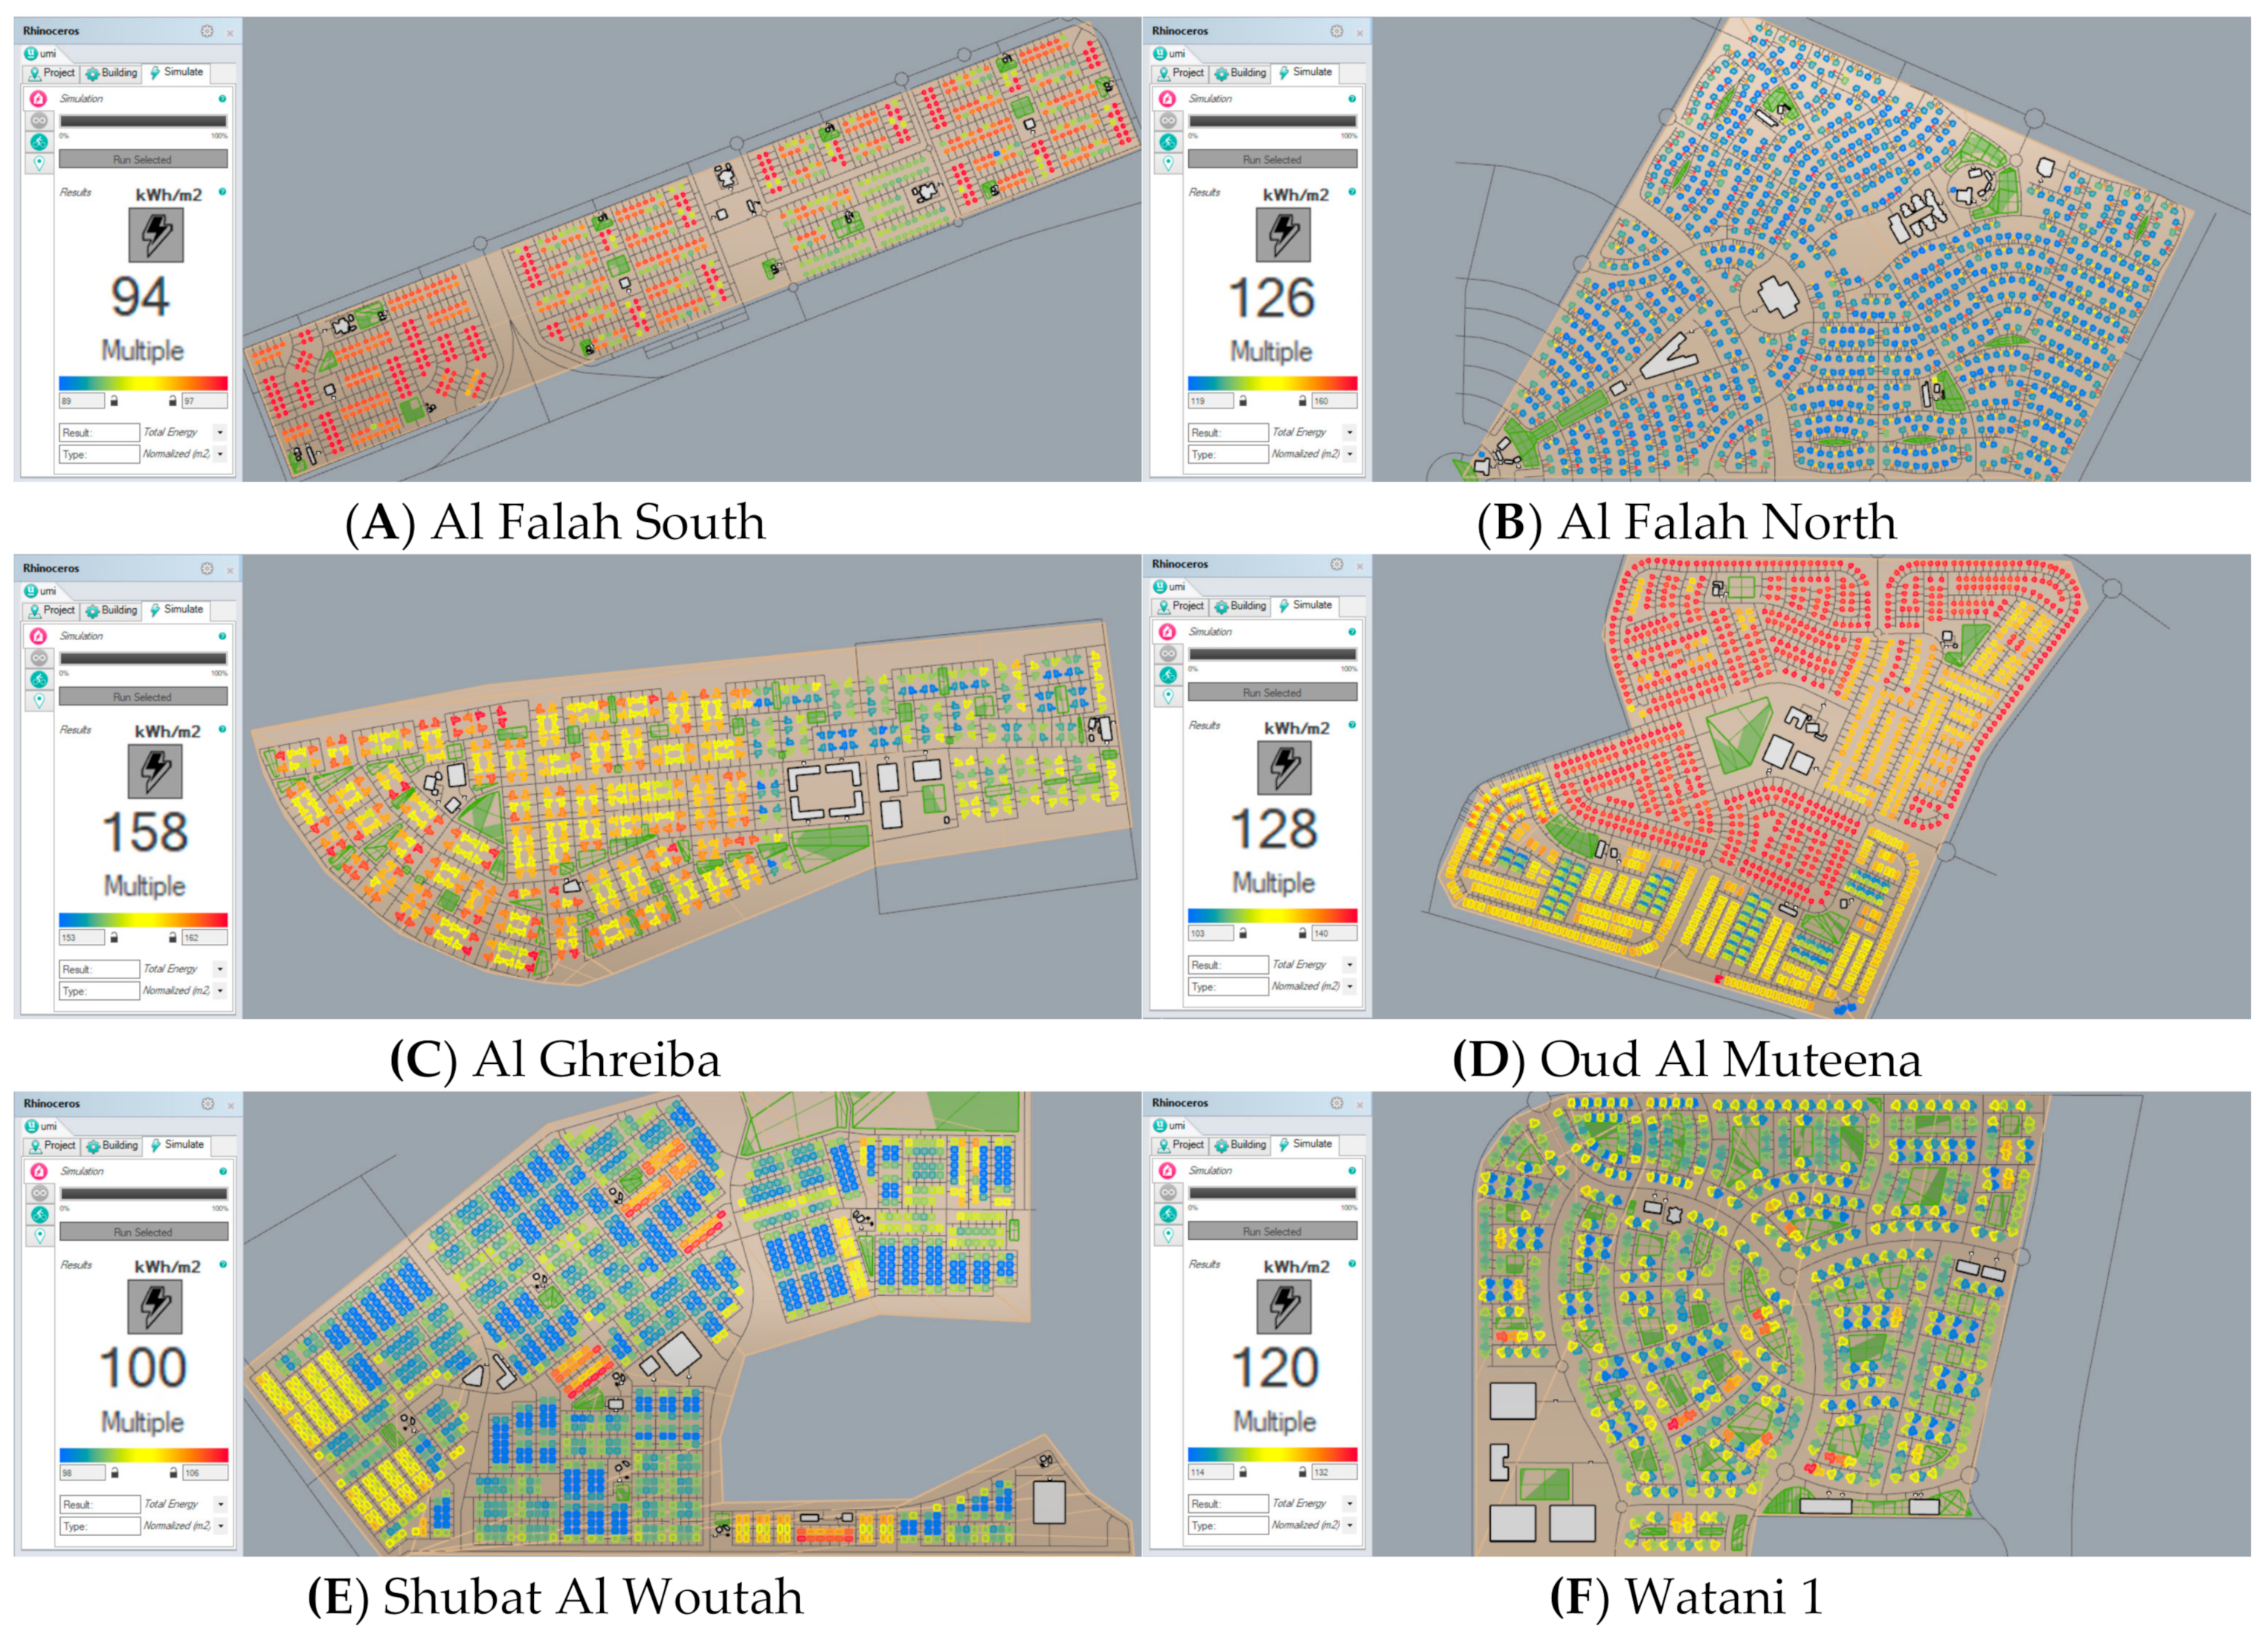
Figure 2.
(A) Land use and urban morphology of N2-Al Falah South neighborhood, Abu Dhabi. (B) Land use and urban morphology of N3—Al Falah North neighborhood, Abu Dhabi. (C) Land use and urban form of N4—Al Ghreiba neighborhood, Al Ain. (D) Land use and urban form of N5—Oud Al Muteena neighborhood, Dubai. (E) Land use and urban form of N6—Shubat Al Woutah neighborhood, Al Ain. (F) Land use and urban form of N7-Watani 1 neighborhood, Abu Dhabi.


Figure 3.
The floor area ratios (FARs) of conventional sprawling vs more compact neighborhoods.

Figure 4.
Results of the average housing annual operational energy use intensities (EUIs) for the studied neighborhoods.
Figure 4.
Results of the average housing annual operational energy use intensities (EUIs) for the studied neighborhoods.

Figure 5.
(A) Average housing annual operational and cooling EUIs for the six case studies; (B,C) Average housing embodied energy for 50 years (B), and CO2 emission for 50 years (C) for the six case studies.
Figure 5.
(A) Average housing annual operational and cooling EUIs for the six case studies; (B,C) Average housing embodied energy for 50 years (B), and CO2 emission for 50 years (C) for the six case studies.


Figure 6.
The correlation between the FARs and average housing annual operational EUIs for all neighborhoods.
Figure 6.
The correlation between the FARs and average housing annual operational EUIs for all neighborhoods.

Figure 7.
(A). Experiments 1 and 2—average housing annual operational and cooling EUIs. (B,C), Experiments 1 and 2—average housing embodied energy for 50 years (B), and CO2 emission for 50 years (C).
Figure 7.
(A). Experiments 1 and 2—average housing annual operational and cooling EUIs. (B,C), Experiments 1 and 2—average housing embodied energy for 50 years (B), and CO2 emission for 50 years (C).

Figure 8.
(A). Experiment 3—average housing annual operational and cooling EUIs. Experiment 3—average housing embodied energy for 50 years (B), and average housing CO2 emission for 50 years (C).
Figure 8.
(A). Experiment 3—average housing annual operational and cooling EUIs. Experiment 3—average housing embodied energy for 50 years (B), and average housing CO2 emission for 50 years (C).

Figure 9.
(A). Experiment 4—average housing annual operational and cooling EUIs. Experiment 4—average housing embodied energy for 50 years (B), and average housing CO2 emission for 50 years (C).
Figure 9.
(A). Experiment 4—average housing annual operational and cooling EUIs. Experiment 4—average housing embodied energy for 50 years (B), and average housing CO2 emission for 50 years (C).


Table 1.
Customized building template library: Buildings’ construction details.
| No | Building Type | Residential | School/Kindergarten | Mosques | Retail (Shop & Retail Centers) | Office (Commercial) | Clinic (Health-Care) | |
|---|---|---|---|---|---|---|---|---|
| Construction | ||||||||
| 1 | Floor-to-Floor Height | 3.50 m | 3.50 m | 3.50 m | Stand-alone Shops: 3.50 m Retail Centers: 6.00 m | 3.50 m | 3.50 m | |
| 2 | Window-Wall Ratio | 20% | 40% | 40% | 40% | 40% | 40% | |
| 3 | Partition Ratio | 30% | 15% | 15% | 15% | 35% | 35% | |
| 4 | Structure | Reinforced Concrete (Dense) | ||||||
| 5 | Windows | Double-Glazed (0.003 m each), Air-filled (0.006 m) | ||||||
| 6 | Facade | Cement Plaster (0.02 m), Concrete Blocks (0.20 m), Cement Plaster (0.02 m) | ||||||
| 7 | Partition | Cement Plaster (0.02 m), Concrete Blocks (0.20 m), Cement Plaster (0.02 m) | ||||||
| 8 | Ground Floor | Ceramic tile (0.01 m), Cement Plaster (0.03 m), Concrete Light (0.05 m), Reinforced Concrete (0.15 m), Insulation (0.02 m) | ||||||
| 9 | Interior Floor | Residential | Ceramic tile (0.01 m), Cement Plaster (0.03 m), Concrete Light (0.05 m), Reinforced Concrete (0.15 m), Cement Plaster (0.02 m) | |||||
| Non-Residential | Ceramic tile (0.01 m), Cement Plaster (0.03 m), Concrete Light (0.05 m), Reinforced Concrete (0.15 m), Cement Plaster (0.02 m), Air-Floor (0.60 m), Gypsum Plaster (0.02 m) | |||||||
| 10 | Roof | Residential | Ceramic tile (0.01 m), Cement Plaster (0.03 m), Concrete Light (0.05 m), Fiberglass Batts (0.05 m), Insulation (0.01 m), Reinforced Concrete (0.12 m), Cement Plaster (0.02 m) | |||||
| Non-Residential | Ceramic tile (0.01 m), Cement Plaster (0.03 m), Concrete Light (0.05 m), Fiberglass Batts (0.05 m), Insulation (0.01 m), Reinforced Concrete (0.12 m), Cement Plaster (0.02 m), Air-Floor (0.50 m), Gypsum Plaster (0.02 m) | |||||||
Table 2.
Customized building template library: Occupancy schedule.
| No | Building Type | Occupancy Schedule 1 | Occ. Rate | |
|---|---|---|---|---|
| Yearly | Yearly | |||
| 1 | Residential | All Year Round Week-Days Week-Ends | 08:00–18:00 | %37 |
| 19:00–07:00 | Full | |||
| 11:00–21:00 | %55 | |||
| 22:00–10:00 | Full | |||
| 2 | School/Kindergarten | Academic Year Week-Days Week-Ends Holidays 2 | 06:00 | %20 |
| 07:00–17:00 | Full | |||
| 17:00–20:00 | %30 | |||
| 20:00–05:00 | OFF | |||
| 06:00–18:00 | %10 | |||
| 18:00–05:00 | OFF | |||
| All Day Long | %10 | |||
| 3 | Mosque | All Year Round * Sat–Thr Fridays Jum’a Prayer > | Prayer Times: | |
| 05:00, 12:00 | Full | |||
| 16:00, 19:00 | Full | |||
| 21:00 | Full | |||
| 05:00, 16:00 | Full | |||
| 19:00, 21:00 | Full | |||
| 12:00–13:00 | Full | |||
| * an hour before & after | %30 | |||
| each prayer | ||||
| * other times | OFF | |||
| 4 | Retail (Shops & Retail Centers) | All Year Round Week-Days Week-Ends | 08:00–21:00 * | %61 |
| 12:00–17:00 * Peak | %80 | |||
| 22:00–07:00 | OFF | |||
| 10:00–19:00 ** | %28 | |||
| 13:00–17:00 ** Peak | %40 | |||
| 20:00–09:00 | OFF | |||
| 5 | Office (Commercial) | All Year Round Week-Days Week-Ends | 07:00–08:00 | %15 |
| 09:00–17:00 * | Full | |||
| 13:00 * Lunch Break | %50 | |||
| 18:00–20:00 | %20 | |||
| 20:00–06:00 | OFF | |||
| 07:00–20:00 | %10 | |||
| 18:00–05:00 | OFF | |||
| 6 | Clinic (Health-Care) | All Year Round Sat–Thr * *Emergency > Fridays [Emergency] | 07:00 | %70 |
| 08:00–22:00 | Full | |||
| 23:00–06:00 | %30 | |||
| All Day Long | %30 | |||
1 Other schedules—i.e., Air-Conditioning, Domestic Hot Water, etc.—are scheduled accordingly; and Heating is not considered for UAE. 2 Summer: 1 July–31 August; New-Year Vacation:16 December–31 December; Spring Vacation: 16 March–31 March.
Table 3.
The results for the full urban modelling interface (UMI) computational analysis of the six case studies.
Table 3.
The results for the full urban modelling interface (UMI) computational analysis of the six case studies.
| Ref. | Analysis Neighborhood | FAR | Operational EUI (kWh/m2) | Cooling EUI (kWh/m2) | Embodied Energy for 50 years (kWh/m2) | CO2 Emission for 50 years (kgCO2/m2) |
|---|---|---|---|---|---|---|
| N2 | Al Falah South (Abu Dhabi) | 0.18 | Total: 89–300 Avg: 96 Housing: 89–97 Avg: 94 | Total: 36–205 Avg: 56 Housing: 52–61 Avg: 58 | Total: 1041–1748 Avg: 1238.8 Housing: 1248–1265 Avg: 1261.17 | Total: 100–167 Avg: 120.4 Housing: 121–123 Avg: 122.75 |
| N3 | Al Falah North (Abu Dhabi) | 0.18 | Total: 89–278 Avg: 126 Housing: 119–160 Avg: 126 | Total: 33–201 Avg: 83 Housing: 82–124 Avg: 89 | Total: 1031–1927 Avg: 1313.42 Housing: 1331–1927 Avg: 1362.38 | Total: 99–187 Avg: 127.88 Housing: 130–187 Avg: 132.91 |
| N4 | Al Ghreiba (Al Ain) | 0.26 | Total: 98–229 Avg: 154 Housing: 153–162 Avg: 158 | Total: 41–161 Avg: 113 Housing: 117–125 Avg: 121 | Total: 1045–1712 Avg: 1351.5 Housing: 1389–1392 Avg: 1390.74 | Total: 101–164 Avg: 131.19 Housing: 135–136 Avg: 135.41 |
| N5 | Oud Al Muteena (Dubai) | 0.26 | Total: 95–212 Avg: 128 Housing: 103–140 Avg: 128 | Total: 38–126 Avg: 90 Housing: 66–103 Avg: 91 | Total: 1066–1680 Avg: 1347.23 Housing: 1268–1390 Avg: 1351.08 | Total: 101–156 Avg: 131.27 Housing: 123–136 Avg: 131.82 |
| N6 | Shubat Al Woutah (Al Ain) | 0.38 | Total: 85–259 Avg: 100 Housing: 98–106 Avg: 100 | Total: 29–191 Avg: 62 Housing: 61–69 Avg: 63 | Total: 1031–1817 Avg: 1250.03 Housing: 1261–1273 Avg: 1261.9 | Total: 99–161 Avg: 121.48 Housing: 123–124 Avg: 122.82 |
| N7 | Watani 1 (Abu Dhabi) | 0.41 | Total: 88–199 Avg: 116 Housing: 114–132 Avg: 120 | Total: 32–116 Avg: 76 Housing: 78–95 Avg: 83 | Total: 1044–1668 Avg: 1293.45 Housing: 1329–1345 Avg: 1330.73 | Total: 99–154 Avg: 125.67 Housing: 130–131 Avg: 129.83 |
Table 4.
Experiment 1: Impact of lot coverage on the EUI.
| Measures | Description | |
|---|---|---|
| Variable Measure | Lot Coverage Original Vs. Build-Out Area | The simulation comparison between the original lot coverage in each of the three neighborhoods in Abu Dhabi—N2, N3, and N7—and the maximum allowable lot coverage (all buildable area) for the houses according to the commonly applied setback regulations in the UAE—6 m front/4 m back/3 m sides—to eliminate the effect of differences in the setbacks. (Note: Abu Dhabi neighborhoods N2, N3, and N7 were selected to eliminate the effects of Climate Zone). |
| Constant Measures | Street Grid Pattern | The street grid pattern will not change for each of the three single-family housing neighborhoods in Abu Dhabi: N2, N3, and N7. |
| Building Mass Geometry | Four square-shaped building masses for simulating the maximum Lot Coverage case in each neighborhood. (Note: Effect of building geometry might exist, but it is precisely investigated later in Experiment 3). | |
| Climate Zone | Using Abu Dhabi weather file for the three neighborhoods—N2, N3, and N7—to eliminate the effect of Climate Zone. | |
Table 5.
Experiment 2: Impact of the street grid pattern on the EUI.
| Measures | Description | |
|---|---|---|
| Variable Measure | Street Grid Pattern: Orthogonal Vs. Curvilinear | The simulation is performed for all six single-family house neighborhoods with their different street grid patterns. |
| Constant Measures | Lot Coverage | The maximum buildable area on ground for the houses according to the commonly applied setback regulations in the UAE—6 m front/4 m back/3 m sides—to eliminate the effect of differences in the setbacks. |
| Building Mass Geometry | Four square-shaped building masses to eliminate the effect of the building geometry. | |
| Climate Zone | Using a unified weather file for all neighborhoods (Abu Dhabi Weather) to eliminate the effect of Climate. | |
Table 6.
Experiment 3: Impact of the building mass geometry on the EUI.
| Measures | Description | |
|---|---|---|
| Variable Measure | Building Mass Geometry: Original Vs. Simplified (with the same lot coverage and built-up area) | The simulation comparison is to be conducted between the original irregular geometry of buildings and the simplified foursquare masses to examine the effect of the Building Mass Geometry. |
| Constant Measures | Lot Coverage area and total built-up area | The area of the buildings (built-up and footprint area) remained constant when compared to the original forms. |
| Street Grid Pattern | The experiment is to be conducted for N4 neighborhood (Al Ghreiba) to eliminate the effect of street grid pattern. | |
| Climate Zone | Using the weather file of Al Ain to eliminate the effect of Climate. | |
Table 7.
Experiment 4: Impact of the climate zone on the EUI.
| Measures | Description | |
|---|---|---|
| Variable Measure | Climate Zone: Abu Dhabi (Dubai)/Al Ain/ Fujairah | Simulations are to be performed using the three different weather files for Abu Dhabi / Al Ain and Fujairah cities for a single case study (N4-Al Ghreiba neighborhood) to evaluate the effect of the different climate zones. |
| Constant Measures | Lot Coverage | The maximum allowable ground floor area for the houses according to the applied setback regulations in the UAE—6 m front/4 m back/3 m sides—to eliminate the effect of differences in the setbacks. |
| Street Grid Pattern | The experiment to be conducted for one case study (N4-Al Ghreiba neighborhood) to eliminate the effect of the street grid pattern. | |
| Building Mass Geometry | Four square-shaped building masses to eliminate the effect of the building geometry. | |
Table 8.
The results of studying the effect of the lot coverage on the EUI.
| Ref | Analysis Neighborhood | FAR | Operational EUI (kWh/m2) | Cooling EUI (kWh/m2) | Embodied Energy for 50 years (kWh/m2) | CO2 Emission for 50 years (kgCO2/m2) |
|---|---|---|---|---|---|---|
| N2 | Before: Al Falah South Abu Dhabi (Abu Dhabi Weather) | 0.18 | Total: 89–300 Avg: 96 Housing: 89–97 Avg: 94 | Total: 36–205 Avg: 56 Housing: 52–61 Avg: 58 | Total: 1041–1748 Avg: 1238.8 Housing: 1248–1265 Avg: 1261.17 | Total: 100–167 Avg: 120.4 Housing: 121–123 Avg: 122.75 |
| After: Al Falah South Abu Dhabi (Abu Dhabi Weather) | 0.50 | Total: 71–300 Avg: 75 Housing: 71–77 Avg: 74 | Total: 34–205 Avg: 38 Housing: 34–41 Avg: 37 | Total: 1041–1748 Avg: 1209.73 Housing: 1208–1219 Avg: 1215.2 | Total: 100–167 Avg: 117.49 Housing: 117–118 Avg: 118.07 | |
| N3 | Before: Al Falah North Abu Dhabi (Abu Dhabi Weather) | 0.18 | Total: 89–278 Avg: 126 Housing: 119–160 Avg: 126 | Total: 33–201 Avg: 83 Housing: 82–124 Avg: 89 | Total: 1031–1927 Avg: 1313.42 Housing: 1331–1927 Avg: 1362.38 | Total: 99–187 Avg: 127.88 Housing: 130–187 Avg: 132.91 |
| After: Al Falah North Abu Dhabi (Abu Dhabi Weather) | 0.32 | Total: 89–277 Avg: 98 Housing: 91–98 Avg: 94 | Total: 32–201 Avg: 57 Housing: 54–61 Avg: 57 | Total: 1031–1748 Avg: 1244.9 Housing: 1261.59 (all) Avg: 1261.59 | Total: 99–167 Avg: 121.05 Housing: 122.79 (all) Avg: 122.79 | |
| N7 | Before: Watani 1 Abu Dhabi (Abu Dhabi Weather) | 0.41 | Total: 88–199 Avg: 116 Housing: 114–132 Avg: 120 | Total: 32–116 Avg: 76 Housing: 78–95 Avg: 83 | Total: 1044–1668 Avg: 1293.45 Housing: 1329–1345 Avg: 1330.73 | Total: 99–154 Avg: 125.67 Housing: 130–131 Avg: 129.83 |
| After: Watani 1 Abu Dhabi (Abu Dhabi Weather) | 0.53 | Total: 88–199 Avg: 100 Housing: 90–120 Avg: 100 | Total: 32–118 Avg: 60 Housing: 54–83 Avg: 63 | Total: 1044–1668 Avg: 1260.55 Housing: 1262–1328 Avg: 1282.85 | Total: 99–154 Avg: 122.41 Housing: 123–130 Avg: 124.95 |
Table 9.
The results of studying the effect of street grid patterns on EUI.
| Ref | Analysis | FAR | Operational EUI (kWh/m2) | Cooling EUI (kWh/m2) | Embodied Energy for 50 years (kWh/m2) | CO2 Emission for 50 years (kgCO2/m2) | |
|---|---|---|---|---|---|---|---|
| Neighborhood | |||||||
| N2 | Al Falah South (Abu Dhabi Weather) Abu Dhabi | 0.50 | Total: 71–300 Avg: 75 Housing: 71–77 Avg: 74 | Total: 34–205 Avg: 38 Housing: 34–41 Avg: 37 | Total: 1041–1748 Avg: 1209.73 Housing: 1208–1219 Avg: 1215.2 | Total: 100–167 Avg: 117.49 Housing: 117–118 Avg: 118.07 | |
| N3 | Al Falah North (Abu Dhabi Weather) Abu Dhabi | 0.32 | Total: 89–277 Avg: 98 Housing: 91–98 Avg: 94 | Total: 32–201 Avg: 57 Housing: 54–61 Avg: 57 | Total: 1031–1748 Avg: 1244.9 Housing: 1261.59 (all) Avg: 1261.59 | Total: 99–167 Avg: 121.05 Housing: 122.79 (all) Avg: 122.79 | |
| N4 | Al Ghreiba (Abu Dhabi Weather) Al Ain | 0.51 | Total: 90–216 Avg: 95 Housing: 90–96 Avg: 92 | Total: 39–148 Avg: 56 Housing: 54–59 Avg: 56 | Total: 1045–1712 Avg: 1257.26 Housing: 1259–1262 Avg: 1259.3 | Total: 101–164 Avg: 122.23 Housing: 122.56 (all) Avg: 122.56 | |
| N5 | Oud Al Muteena (Abu Dhabi Weather) Dubai | 0.45 | Total: 95–212 Avg: 103 Housing: 95–115 Avg: 102 | Total: 38–126 Avg: 65 Housing: 59–78 Avg: 65 | Total: 1066–1680 Avg: 1285.5 Housing: 1278–1337 Avg: 1285.84 | Total: 101–156 Avg: 125.13 Housing: 124–131 Avg: 125.26 | |
| N6 | Shubat Al Woutah (Abu Dhabi Weather) Al Ain | 0.47 | Total: 84–245 Avg: 90 Housing: 87–92 Avg: 89 | Total: 27–177 Avg: 51 Housing: 50–56 Avg: 52 | Total: 1021–1663 Avg: 1241.35 Housing: 1251–1254 Avg: 1251.2 | Total: 98–159 Avg: 120.69 Housing: 121.73 (all) Avg: 121.73 | |
| N7 | Watani 1 (Abu Dhabi Weather) Abu Dhabi | 0.53 | Total: 88–199 Avg: 100 Housing: 90–120 Avg: 100 | Total: 32–118 Avg: 60 Housing: 54–83 Avg: 63 | Total: 1044–1668 Avg: 1260.55 Housing: 1262–1328 Avg: 1282.85 | Total: 99–154 Avg: 122.41 Housing: 123–130 Avg: 124.95 | |
Table 10.
The results of studying the impact of the building mass geometry on operational and cooling EUIs.
Table 10.
The results of studying the impact of the building mass geometry on operational and cooling EUIs.
| Ref | Analysis | FAR | Operational EUI (kWh/m2) | Cooling EUI (kWh/m2) | Embodied Energy for 50 years (kWh/m2) | CO2 Emission for 50 years (kg CO2/m2) | |
|---|---|---|---|---|---|---|---|
| Neighborhood | |||||||
| N4 | Al Ghreiba Original Form | 0.25 | Total: 98–229 Avg: 154 Housing: 153–162 Avg: 158 | Total: 41–161 Avg: 113 Housing: 117–125 Avg: 121 | Total: 1045–1712 Avg: 1351.5 Housing: 1389–1392 Avg: 1390.74 | Total: 101–164 Avg: 131.19 Housing: 135–136 Avg: 135.41 | |
| N4 | Al Ghreiba Simplified Form | 0.25 | Total: 98–229 Avg: 126 Housing: 121–132 Avg: 125 | Total: 41–161 Avg: 85 Housing: 84–95 Avg: 88 | Total: 1045–1712 Avg: 1300.48 Housing: 1305–1322 Avg: 1310.27 | Total: 101–164 Avg: 126.34 Housing: 127–129 Avg: 127.74 | |
Table 11.
The results for studying the impact of the climate zone on operational and cooling EUIs.
| Ref. | Analysis | FAR | Operational EUI (kWh/m2) | Cooling EUI (kWh/m2) | Embodied Energy/m2 for 50 years (kWh/m2] | CO2 Emission for 50 years (kgCO2/m2) | |
|---|---|---|---|---|---|---|---|
| Neighborhood | |||||||
| 1 | Al Ghreiba (Abu Dhabi/Dubai Weather file) | 0.51 | Total: 90–216 Avg: 95 Housing: 90–96 Avg≈ 92 | Total: 39–148 Avg: 56 Housing: 54–59 Avg: 56 | Total: 1045–1712 Avg: 1257.26 Housing: 1259–1262 Avg: 1259.3 | Total: 101–164 Avg: 122.23 Housing: 122.56 (all) Avg: 122.56 | |
| 2 | Al Ghreiba (Al Ain Weather file) | 0.51 | Total: 96–229 Avg: 101 Housing: 96–102 Avg: 98 | Total: 41–161 Avg: 62 Housing: 59–66 Avg: 62 | Total: 1045–1712 Avg: 1258.18 Housing: 1259–1262 Avg: 1259.3 | Total: 101–164 Avg: 122.25 Housing: 122.56 (all) Avg: 122.56 | |
| 3 | Al Ghreiba (Fujairah Weather file) | 0.51 | Total: 100–245 Avg: 105 Housing: 100–107 Avg: 102 | Total: 51–177 Avg: 66 Housing: 63–70 Avg: 66 | Total: 1045–1788 Avg: 1259.1 Housing: 1259–1262 Avg: 1259.3 | Total: 101–171 Avg: 122.34 Housing: 122.56 (all) Avg: 122.56 | |
© 2019 by the authors. Licensee MDPI, Basel, Switzerland. This article is an open access article distributed under the terms and conditions of the Creative Commons Attribution (CC BY) license (http://creativecommons.org/licenses/by/4.0/).
Share and Cite
MDPI and ACS Style
Galal Ahmed, K.; Alipour, S.M.H. Urban Form Compaction and Energy Use Intensity in New Social Housing Neighborhoods in the UAE. Sustainability 2019, 11, 3815. https://0-doi-org.brum.beds.ac.uk/10.3390/su11143815
AMA Style
Galal Ahmed K, Alipour SMH. Urban Form Compaction and Energy Use Intensity in New Social Housing Neighborhoods in the UAE. Sustainability. 2019; 11(14):3815. https://0-doi-org.brum.beds.ac.uk/10.3390/su11143815
Chicago/Turabian StyleGalal Ahmed, Khaled, and S. M. Hossein Alipour. 2019. "Urban Form Compaction and Energy Use Intensity in New Social Housing Neighborhoods in the UAE" Sustainability 11, no. 14: 3815. https://0-doi-org.brum.beds.ac.uk/10.3390/su11143815
Note that from the first issue of 2016, this journal uses article numbers instead of page numbers. See further details here.