Towards Sustainable Urban Logistics: Creating Sustainable Urban Freight Transport on the Example of a Limited Accessibility Zone in Gdansk


Department of Transport Policy, Faculty of Economics, University of Gdansk, Armii Krajowej 119/121, 81-824 Sopot, Poland
Sustainability 2019, 11(14), 3879; https://0-doi-org.brum.beds.ac.uk/10.3390/su11143879
Submission received: 11 June 2019
/
Revised: 11 July 2019
/
Accepted: 15 July 2019
/
Published: 17 July 2019
(This article belongs to the Collection Sustainable Smart Cities and Villages)
Abstract
:The purpose of the article is to identify the conditions for the implementation of deliveries in the Limited Accessibility Zone (LAZ) in Gdansk, based on interviews conducted among suppliers in October 2018. Another goal is to identify guidelines for the need to create a new transport policy for cities, which will be in line with sustainable urban logistics. The presented analysis is not an economic or technical analysis of an executive nature. It focuses on indicating the nature of the impact of factors conditioning further actions related to the discussed area. To define a sustainable urban logistics plan road map, the desk research method was used. It involved analyzing, verifying and merging existing data and information from the results of European projects. The paper can be used as a road map to proceed with planning urban logistics in the city and to create a document of Sustainable Urban Logistics Plan (SULP). This is the first study carried out in the LAZ of Gdansk since its introduction in 2014, therefore conclusions can be used by scientists and the creators of urban transport policy to create limited accessibility zones.
1. Introduction
In the Crowdsourced Delivery Report from Business Insider Intelligence of 2018, the cost of delivery includes collection share—4%, sorting—6%, line haul—37% and last mile delivery—53% [1]. Last mile constitutes such a large share of the costs as it is the most time-consuming and, at the same time, the most sophisticated part of the delivery process. This is mainly due to the many obstacles experienced throughout the process. Whereas in rural areas deliveries are more effective, cities are obstructed by road congestion, multiple narrow streets and lack of parking space. In addition, these problems are intensified by the continuous growth of e-commerce in retail, which significantly increases the number of shipments delivered each day.
In cities, interests of suppliers, city authorities and residents clash. For urban freight planning to be effective, communication and compromise between these entities is necessary. Delivery companies usually already have their deliveries optimized in terms of routes and storage locations, so the costs need to be optimized elsewhere.
The organization of the cargo transport system in cities should be based on the use of experience of modern logistics in the field of supply chain management. Consistent urban economic and transport policy, as well as appropriate market conditions, favoring the cooperation between the entities competing for access to limited resources of the urban transport system, are necessary. Local spatial conditions which affect the degree of concentration of recipients, and the size of the area that can be efficiently served without threatening the frequency and timeliness of deliveries, are also of great importance [2].
2. Transport Policy of European Cities in the Near Future
There is limited potential for reducing the negative effects resulting from the transport congestion from the European Commission level. The strongest instrument for limiting and counteracting these phenomena is within the responsibilities of local authorities, which, for political reasons, are not willing to take comprehensive and long-term actions in this area. The European Commission has therefore created an additional mechanism to encourage local authorities to take more comprehensive action in shaping urban mobility. The Urban Mobility Package [3] has been subordinated to this objective. With the Urban Mobility Package, the Commission reinforces its supporting measures in the area of urban transport by:
- -
- Sharing experiences, show-casing best practices, and fostering cooperation;
- -
- providing targeted financial support;
- -
- Focusing research and innovation on delivering solutions for urban mobility challenges;
- -
- Involving the Member States and enhancing international cooperation.
The Commission identifies Sustainable Urban Mobility Plans (SUMPs) as a horizontal priority for integrating these issues. They should be interdisciplinary and therefore cover transport, land-use and environmental issues, economic and social development, health and road safety. One of the basic features that distinguishes SUMPs from other urban transport policy documents is the wide range of public participation. This means identifying the main stakeholders on the supply and demand side of the transport market and involving them in the planning process from the outset. Cities in countries with a developed and well-established culture of social dialogue, such as the Netherlands, Denmark, Sweden or Germany, have particularly positive experiences in this respect [4]. The main objective of SUMP is to improve the accessibility of urban areas and to ensure high quality, sustainable mobility and transport to, through and within urban areas.
The plan takes into consideration the needs of the “functioning city” and its facilities, not the administrative region. The SUMP contains a new or existing long-term strategy for the future development of the urban area, and therefore for the future development of transport infrastructure, services and mobility. It also contains a short-term plan for the implementation of the strategy with a timetable, a clear division of responsibilities and information on the resources as well as financial means required.
Gdansk, like many European towns and cities, suffers from chronic traffic congestion, and a high share of all CO2 emissions from transport. In order to make Gdansk more habitable and safe, city authorities have attempted to reach the 60% reduction in greenhouse gas emissions called for by the Commission’s White Paper on Transport by creating a sort of Limited Emission Zone (LEZ) and introducing Sustainable Urban Mobility Plans that define the need to create a Sustainable Urban Logistics Plan. LEZs are implemented in areas where air pollution levels are dangerous to health and traffic congestion is so heavy that it impacts daily functioning of the area. Often, LEZs are introduced in historical areas to protect historical buildings as the ground vibrations caused by traffic can impact the buildings’ stability.
A dozen of European cities with over 300,000 inhabitants have already implemented their SUMPs and another several dozen cities are in the process of preparing theirs. In the European project ENCLOSE [5], the Sustainable Urban Logistic Plan (SULP) was defined. SULP is supposed to be one of the essential parts of the town mobility plan and has since been popularized as a tool of the European Commission towards the zero-emission logistics (as one of the goals of the White Paper on Transport), in the SULPITER project [6]. Through communication and information activities of the project’s results, the European Commission intends to encourage cities to implement measures for effective urban freight movement. SULP is a specific plan for designing solutions within mid-term horizon and managing urban freight processes. SULP methodology was defined following the SUMP approach. SULP is a tool for [7]:
- Defining the common vision, needs and priority lines;
- Designing a set of suitable measures/solutions/services;
- Reducing air and noise pollution as well as energy consumption;
- Creating a consensus among different stakeholders;
- Defining a road map for a possible adoption at Institutional Level.
In the SUMP for Gdansk, which was published in 2018, city logistics is mentioned briefly as the will to take the following actions:
- Establishment of a Team for the Development of SULP (representatives of municipal units, experts and stakeholders-suppliers of goods, logistics centers operators, etc.);
- Regular meetings of the Team, under which principles will be developed to manage the transport of goods in Gdansk (period of work of around 2 years);
- Creation of the SULP which forms the basis of the transport management system in Gdansk.
To fully understand the possibilities for mitigating urban freight flows and to solve the problem holistically, there is a need to tackle urban freight on the level of entire supply chain (including enterprise’s strategies) and from the perspective of a given urban area, which in this case is Gdansk.
Table 1 shows the comparison between the traditional approach to transport policy and the modern approach.
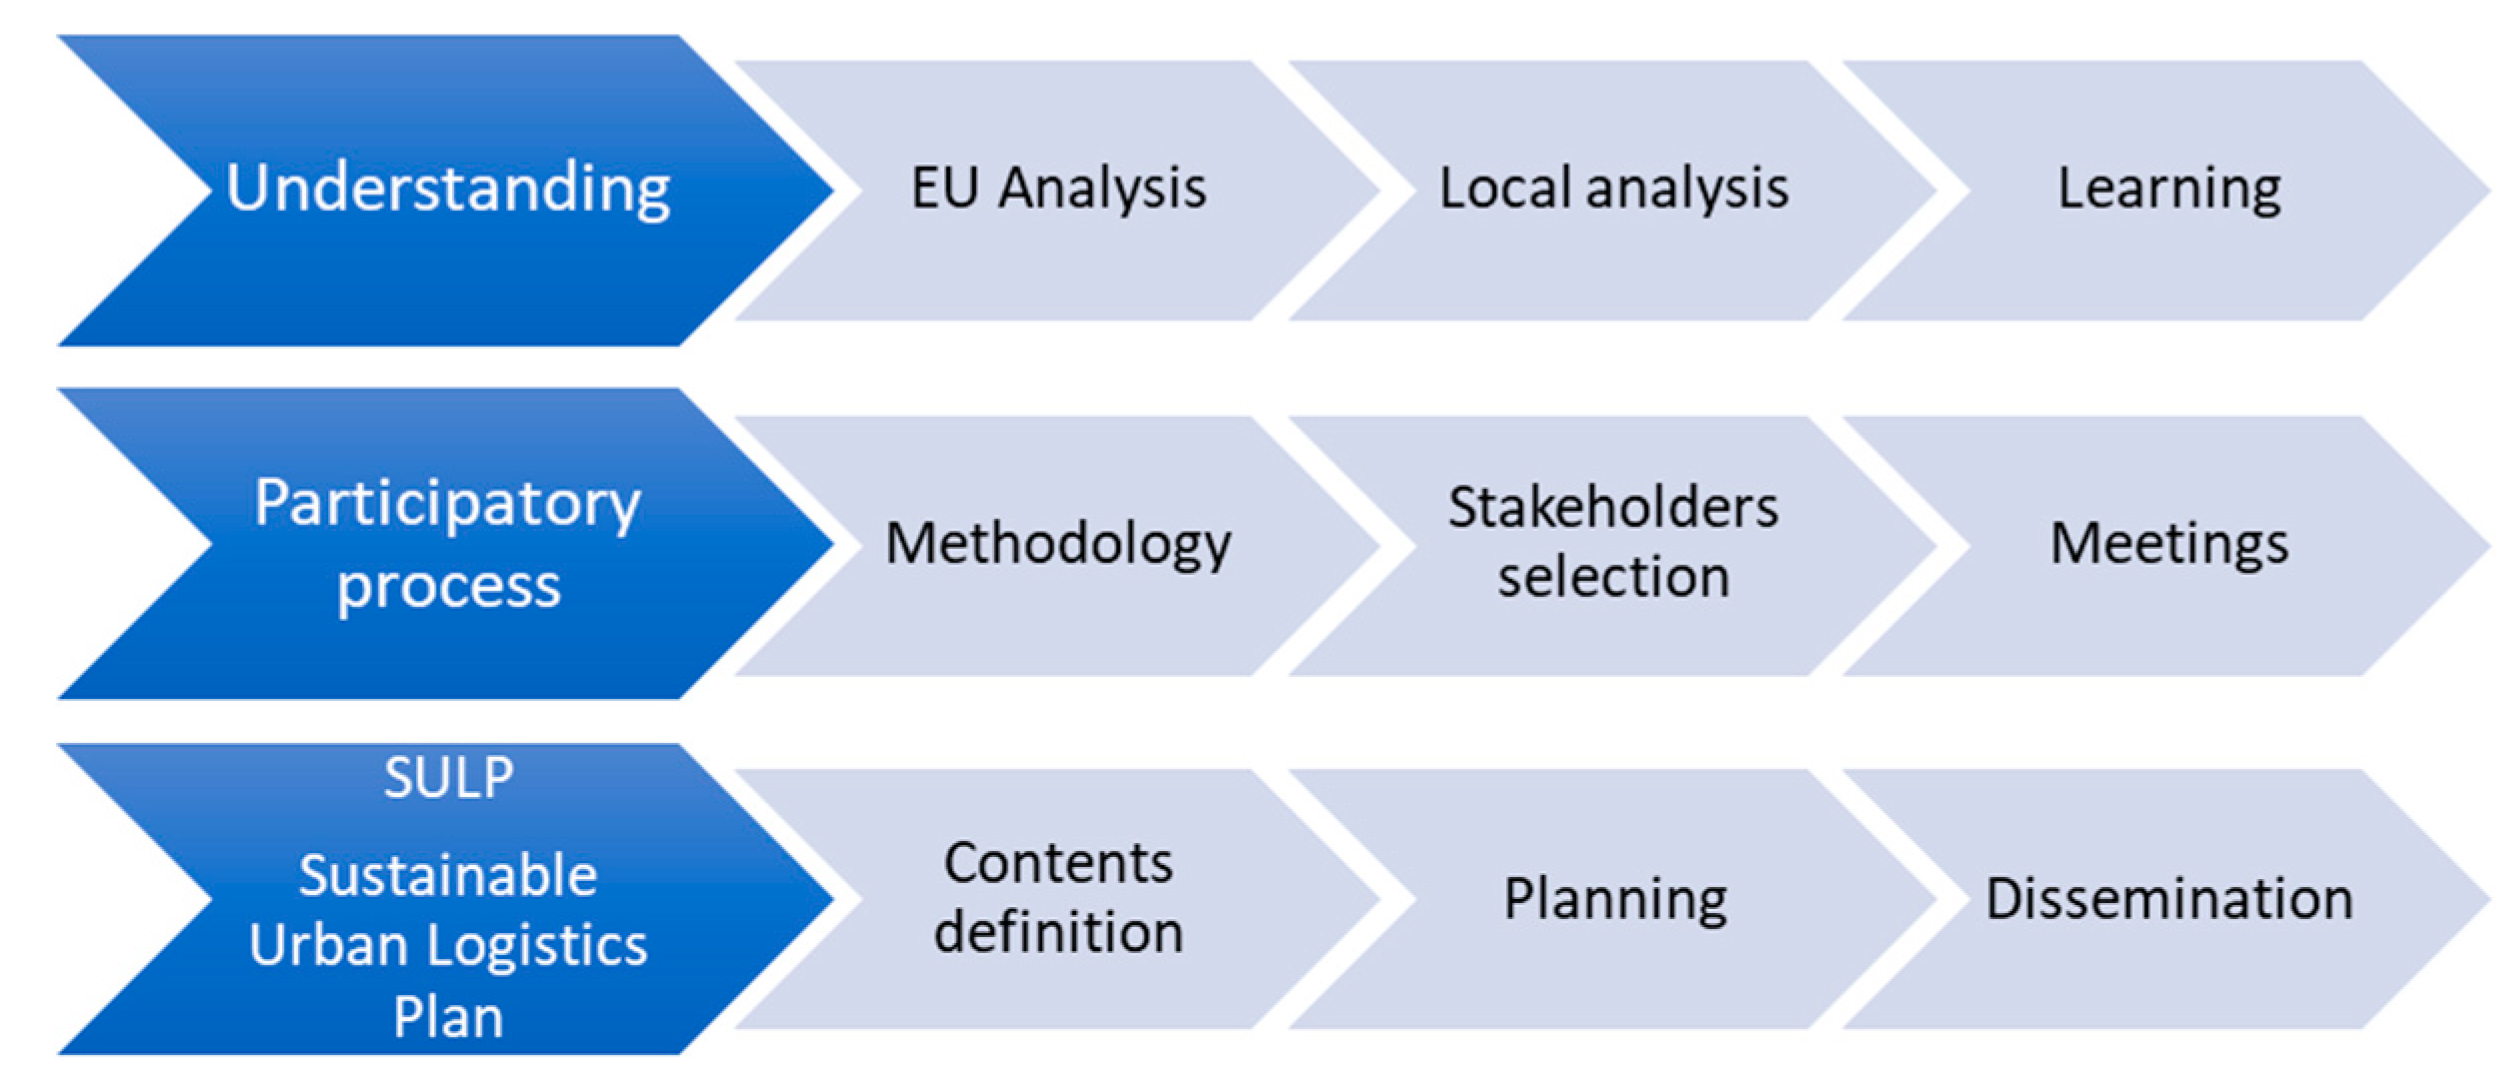
The future SULP should not only establish goals, but also make stakeholders change their habits. It should assume the sealing of a low emission zone, create a common platform for suppliers and recipients and spread awareness among stakeholders and citizens about the importance of logistics in the lives of all of us. Figure 1 shows the stages of work under the preparation of SULP.
3. Drafting SULP
- STRATEGY
- Defining the problems and needs of Freight Urban Area (FUA) by taking into consideration the needs of all stakeholders.
- Analyzing the logistics context and processes:
- Analyzing current logistics situation-knowledge and knowing users’ needs;
- Technical analysis-knowledge about infrastructure, traffic flows, cargo flows;
- Survey-knowledge about the acceptance level of proposed measures (decreases the risk of failure).
- Inclusion of goals into the transport policy and making it public.
- Prioritizing Sustainable Urban Logistics with local authorities and policymakers.
- Starting communication and raising awareness.
- ROAD MAP
- Identification, visions and goals, who, why, what, when.
- Steps and suitable measures.
- Starting public debate.
- Establishing a team with stakeholders and scientists.
- Corroborating data with findings.
- Cost-benefit analysis, SWOT (Strenghts, Weaknesses, Opportunities, Threats) analysis, risk management, timetable.
- Responsibility allocation.
- Services/Solutions Assessment and Impacts.
- DECISION-SULP PREPARATION.
- Defining all collected data and knowledge into the document that can be used as an operating manual.
- Creating opportunities for interaction between policymakers, stakeholders and the public.
- SOLUTION–SULP IMPLEMENTATION.
- SULP guidelines are embedded in the policy and implemented in the functioning of FUA.
- The changes implemented by SULP result in reduced congestion and pollution.
After defining FUA borders, the measures suitable for the FUA should be chosen. Among the latest sustainable solutions, one can distinguish:
3.1. Infrastructure and Its Use
- Multifunctional lanes, e.g., bus passes;
- Dedicated and planned loading zones;
- Urban Consolidation Centre (UCC);
- Cargo tram that uses existing infrastructure (there is a tram line in Gdansk);
- Bus stops used as loading zones.
3.2. ICT Solutions
- Other software solutions, e.g., sensory network for parking, smartphones apps used for parking, booking etc.;
- Load-sharing based on UCC and e-platform;
- Benchmarking (which involves a need for sharing some company information);
- Electronic platform combining transport demand and supply to increase the delivery efficiency and also requires sharing some company data;
- A system of monitoring the delivery drivers’ decisions that supports proper behavior in the city center (e.g., CCTV);
- Metropolitan ITS System “Tristar” used for Urban Freight Transport (UFT), e.g., CCTV cameras recognizing the license plates of the delivery cars and automatically charging for the entrance to the LEZ;
- Interactive city map with live information about the traffic and available parking spots.
3.3. Other Popular Sustainable Solutions for Urban Freight Transport in Europe (UFT)
- Night deliveries;
- Last mile deliveries operated by eco vehicles (Electric Vehicles—EV, Compressed Natural Gas—CNG driven vehicles, hybrid, hydrogen, cargo bikes, electric scooters);
- Low Emission Zone (LEZ)/Zero Emission Zone (ZEZ);
- Pilot project using latest technologies for UFT for testing their potential use (drones for delivery, autonomic cars);
- Inevitability of financial fines for unauthorized entry to LEZ/ZEZ;
- Inevitability of financial fines for parking delivery vehicles in prohibited places.
By now, nine European cities (Lucca, Trondheim, Hertogenbosh, Burgos, Almada, Dundee, Alba Julia, Serres, Balchik) have already introduced their SULPs and seven (Bologna, Budapest, Brescia, Maribor, Poznan, Rijeka, Stuttgart) are in the process of introducing it. Besides this, most cities do not hold data on how many trucks are operating within the cities, the origins, destinations, routes of trucks, nor on the number of business deliveries made [10]. At the same time, in the case of closed Low Emission Zones (LEZ), collecting data does not seem to be a complex undertaking. This lack of data requires significant commitment and awareness of individual entities in the field of shared responsibility for city development. Therefore, the presented analysis is not an economic or technical analysis of an executive nature. It focuses on indicating the nature of the impact of factors conditioning further actions related to the discussed area. Some cities have introduced limited accessibility zones. The purpose of the article is to identify the conditions for the implementation of deliveries in the Limited Accessibility Zone (LAZ) in Gdansk, based on interviews conducted among suppliers in October 2018.
4. Gdansk—Characteristics of the Studied Area
Gdansk is a city with over a thousand years of history, constituting a cultural, scientific and economic center and hub of northern Poland. Some Gdansk data: [11,12,13]:
- Population is 464,254;
- Active population is 274,719;
- Total area 262 km2, of which urban area constitutes 177 km2, rural area covers 85 km2;
- Type of distribution–diffused;
- GDP-4 512 093 EUR;
- Main economic sectors-construction, trade, processing, seaport, IT, real estate, gastronomy, fashion industry;
- Length of road infrastructure—976 km, in which national roads—27.4 km, county roads 57.7 km and provincial roads—711.3 km;
- Overall number of circulating vehicles—275,418;
- Number of commercial vehicles—37,938;
- Extension of limited traffic zones-1;
- Good infrastructure but lack of tributary roads from “bedroom” suburbs;
- Mobility habits (trip home-work/school): 32.1% of the citizens of Gdansk travel by public transport, 41.2% travel by car, 20.8% walk, and 5.9% travel by bike compared to average of 10 selected European cities according to CIVITAS it is respectively—30.3%, 32.8%, 24% and 12.9%.
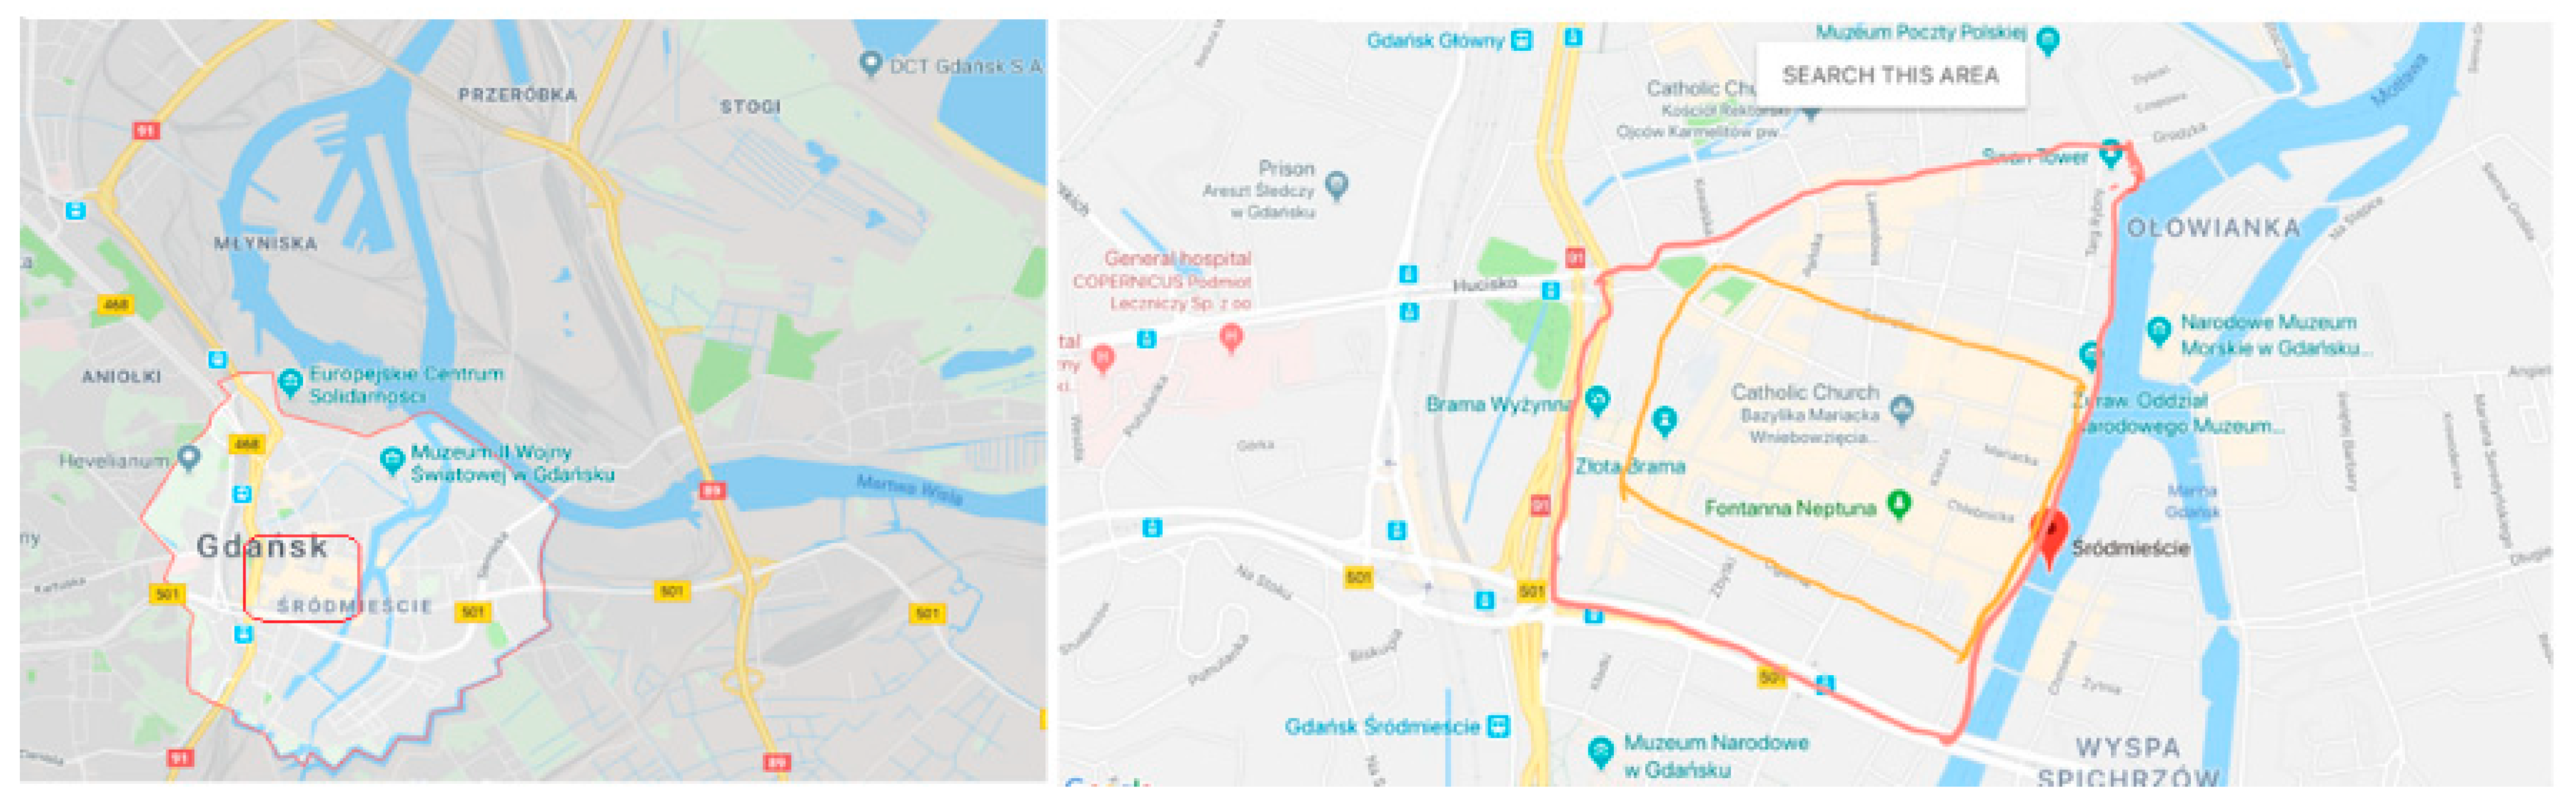
The most important historic complex of the city, the administrative city and provincial authorities are located in this area. In the Downtown area, which is 5.56 km2, that is 2.2% of the total area of Gdansk, there lives approximately 36 thousand inhabitants and there are 75 thousand jobs. The attractiveness of the region concentrates social and service activities in this particular place. The supply chain has to be adapted to the location, regardless of the location of the raw materials and factories, although the historic buildings were created thanks to the sales-generating transport function. From an economic point of view, the city creates a demand for a specific activity, creating conditions for the supply, and thanks to this the functional structure of the city is shaped. In this perspective, in the area covered by this work, current demand is the primary factor in relation to supply [14]. The city center includes the Old Town and the Main Town, limited by the district with the old buildings, concentrating social activity as well as service and administration facilities in the fields of trade, craft, gastronomy, culture, entertainment and administration.
The Main Town (Figure 2, right), which is the subject of this article, is a representative part of the Downtown (Figure 2, left), forming a compact historic complex. The buyers of goods and services are residents, tourists and tenants of premises; their demand determines the size of supply and the standard of services.
While analyzing the measures described in Table 1, it can be concluded that Freight Planning in Gdansk is in its basic stage. In the Sustainable Urban Mobility Plan for Gdansk published in 2016, there is a chapter devoted to goods, but it only specifies the problem recognition and a plan to set up a logistics team and create a Sustainable Urban Logistics Plan [16].
In 2013, in the described area in Gdansk, resulting from the research carried out by the author under the honorary patronage of the then President of Gdansk, chaos and arbitrariness prevailed in the field of supply. The deliveries were not organized in any way [17]. In 2014, the President of the City of Gdansk established the Limited Accessibility Zone (LAZ) in the center of Gdansk, covering the area of 20 ha inside the Main Town area. LAZ is a kind of LEZ, but the entry criterion is not the type of vehicle, but the profile of the driver. Only the following may enter LAZ: residents of real estate located in the Zone, owners and tenants of premises, vehicles of cultural, educational and health institutions located in the LAZ area, vehicles of municipal services performing municipal services, press, radio and television. These entities must have a sticker on the vehicle obtained from the City. Access to the Limited Accessibility Zone without an identifier is also valid for guests of the hotels located in the Zone. In this case, the inspection authorities must be provided with a valid printed booking. The traffic ban does not apply to taxis, public transport buses, bicycles and mopeds, official Police and City Guard vehicles, ambulances and Post Office cars.
The need to undertake urban freight activities has only recently been recognized in Gdansk. Table 2 presents the categorization of freight program created by the Transportation Research Board, measures of which were compared with the situation in Gdansk.
Delivery vehicles with a maximum authorized weight of up to 3.5 tons can enter the Zone without an identifier between 6:00 a.m. and 11:00 a.m. At the request of the inspection bodies—Police and Municipal Guards—suppliers are obliged to present their current order or waybill.
LAZ was created without prior public consultation and without a partnership with the logistics service providers. This could be the reason why the Zone does not function in the prescribed way—delivery trucks can be found in the Zone during the day, after the hours in which they have the right to enter. In order to find the reasons for the lack of proper functioning of the LAZ, a study was conducted, the results of which are presented in this text.
Although it is necessary to define a functional urban area and its’ traffic counts, logistics service providers and infrastructure, it is also important to get to know the initial status and position of the working bodies closest to the problems—representatives of logistics service providers, i.e., drivers of delivery vehicles. The author decided to investigate the causes of improper functioning of the Zone and the direct opinions of the involved parties themselves. The set of questions was selected based on the previous research by the author [18].
5. Methodology and Summary of the Obtained Results
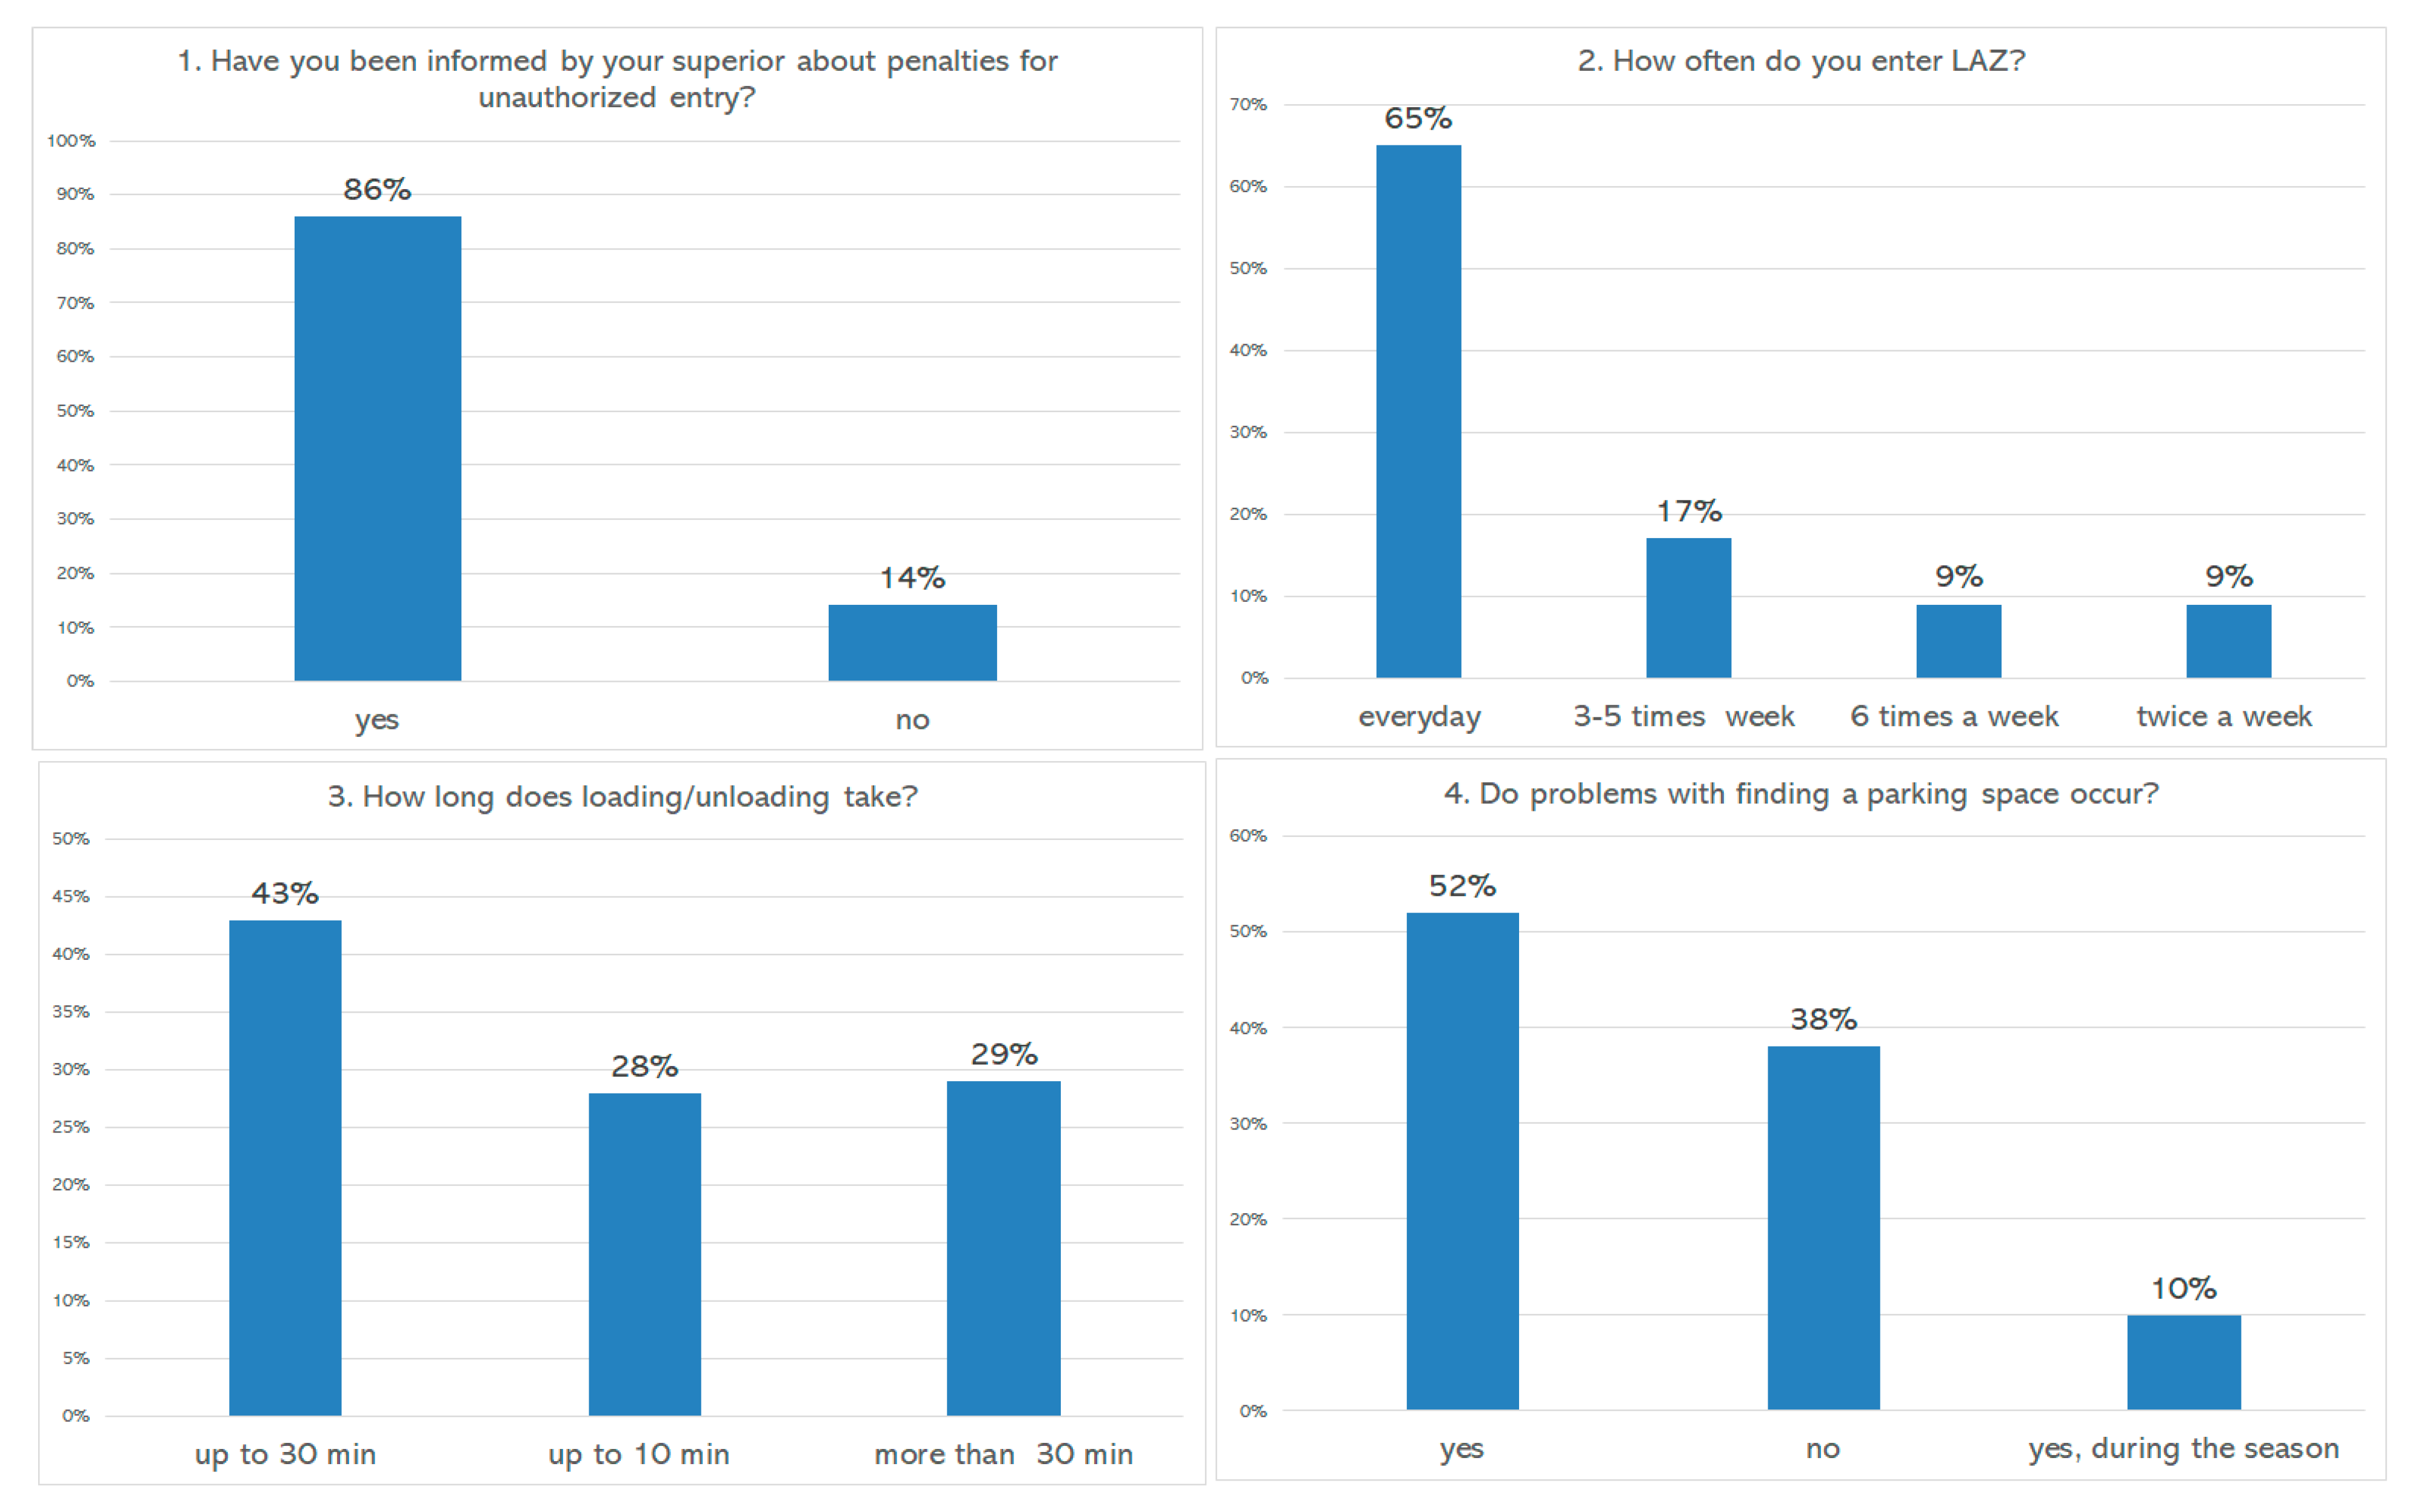
There are 100–120 HoReCa premises, as well as small groceries, cosmetic and souvenir shops and pharmacies in LAZ. For the needs of the study, 35 drivers were questioned in direct interviews during seven weekdays of October 2018. The drivers were asked the questions during their work on the streets of the LAZ region without prior arrangement. Suppliers were carrying vegetables, pre-packaged food and frozen food. All the vehicles were delivery vehicles of up to 3.5 tons. Some of them were vehicles with a refrigerated trailer. The respondents were asked 17 questions about the functioning of the Zone. Figures 3, 4, 6 and 7 show the survey results.
The result showed that 86% of the drivers declared that they had been informed by the employer about the restrictions in force in LAZ, which proves a good flow of information between the authorities and enterprises (Figure 3, question 1). It was observed that 65% of the surveyed suppliers enter LAZ on a daily basis, others a few times a week (Figure 3, question 2). The respondents revealed that 71% of the suppliers need less than 10–30 min to unload the delivery (of which 28% less than 10 min), so deliveries are small (Figure 3, question 3). Half of the respondents admitted that they had problems finding a parking space that allowed unloading (Figure 3, question 4), which means that despite of the introduction of LAZ, there are no unloading bays available exclusively for them in the hours up to 11 a.m. Although only residents can enter the Zone, in Gdansk there are 570 cars for 1000 inhabitants, much more than e.g., in Germany or the Netherlands. Social awareness of mobility is just developing in Poland, and attempts are being made to overcome the belief prevailing since the fall of the Polish People’s Republic 30 years ago (in 1989) that the car is a sign of success and social status.
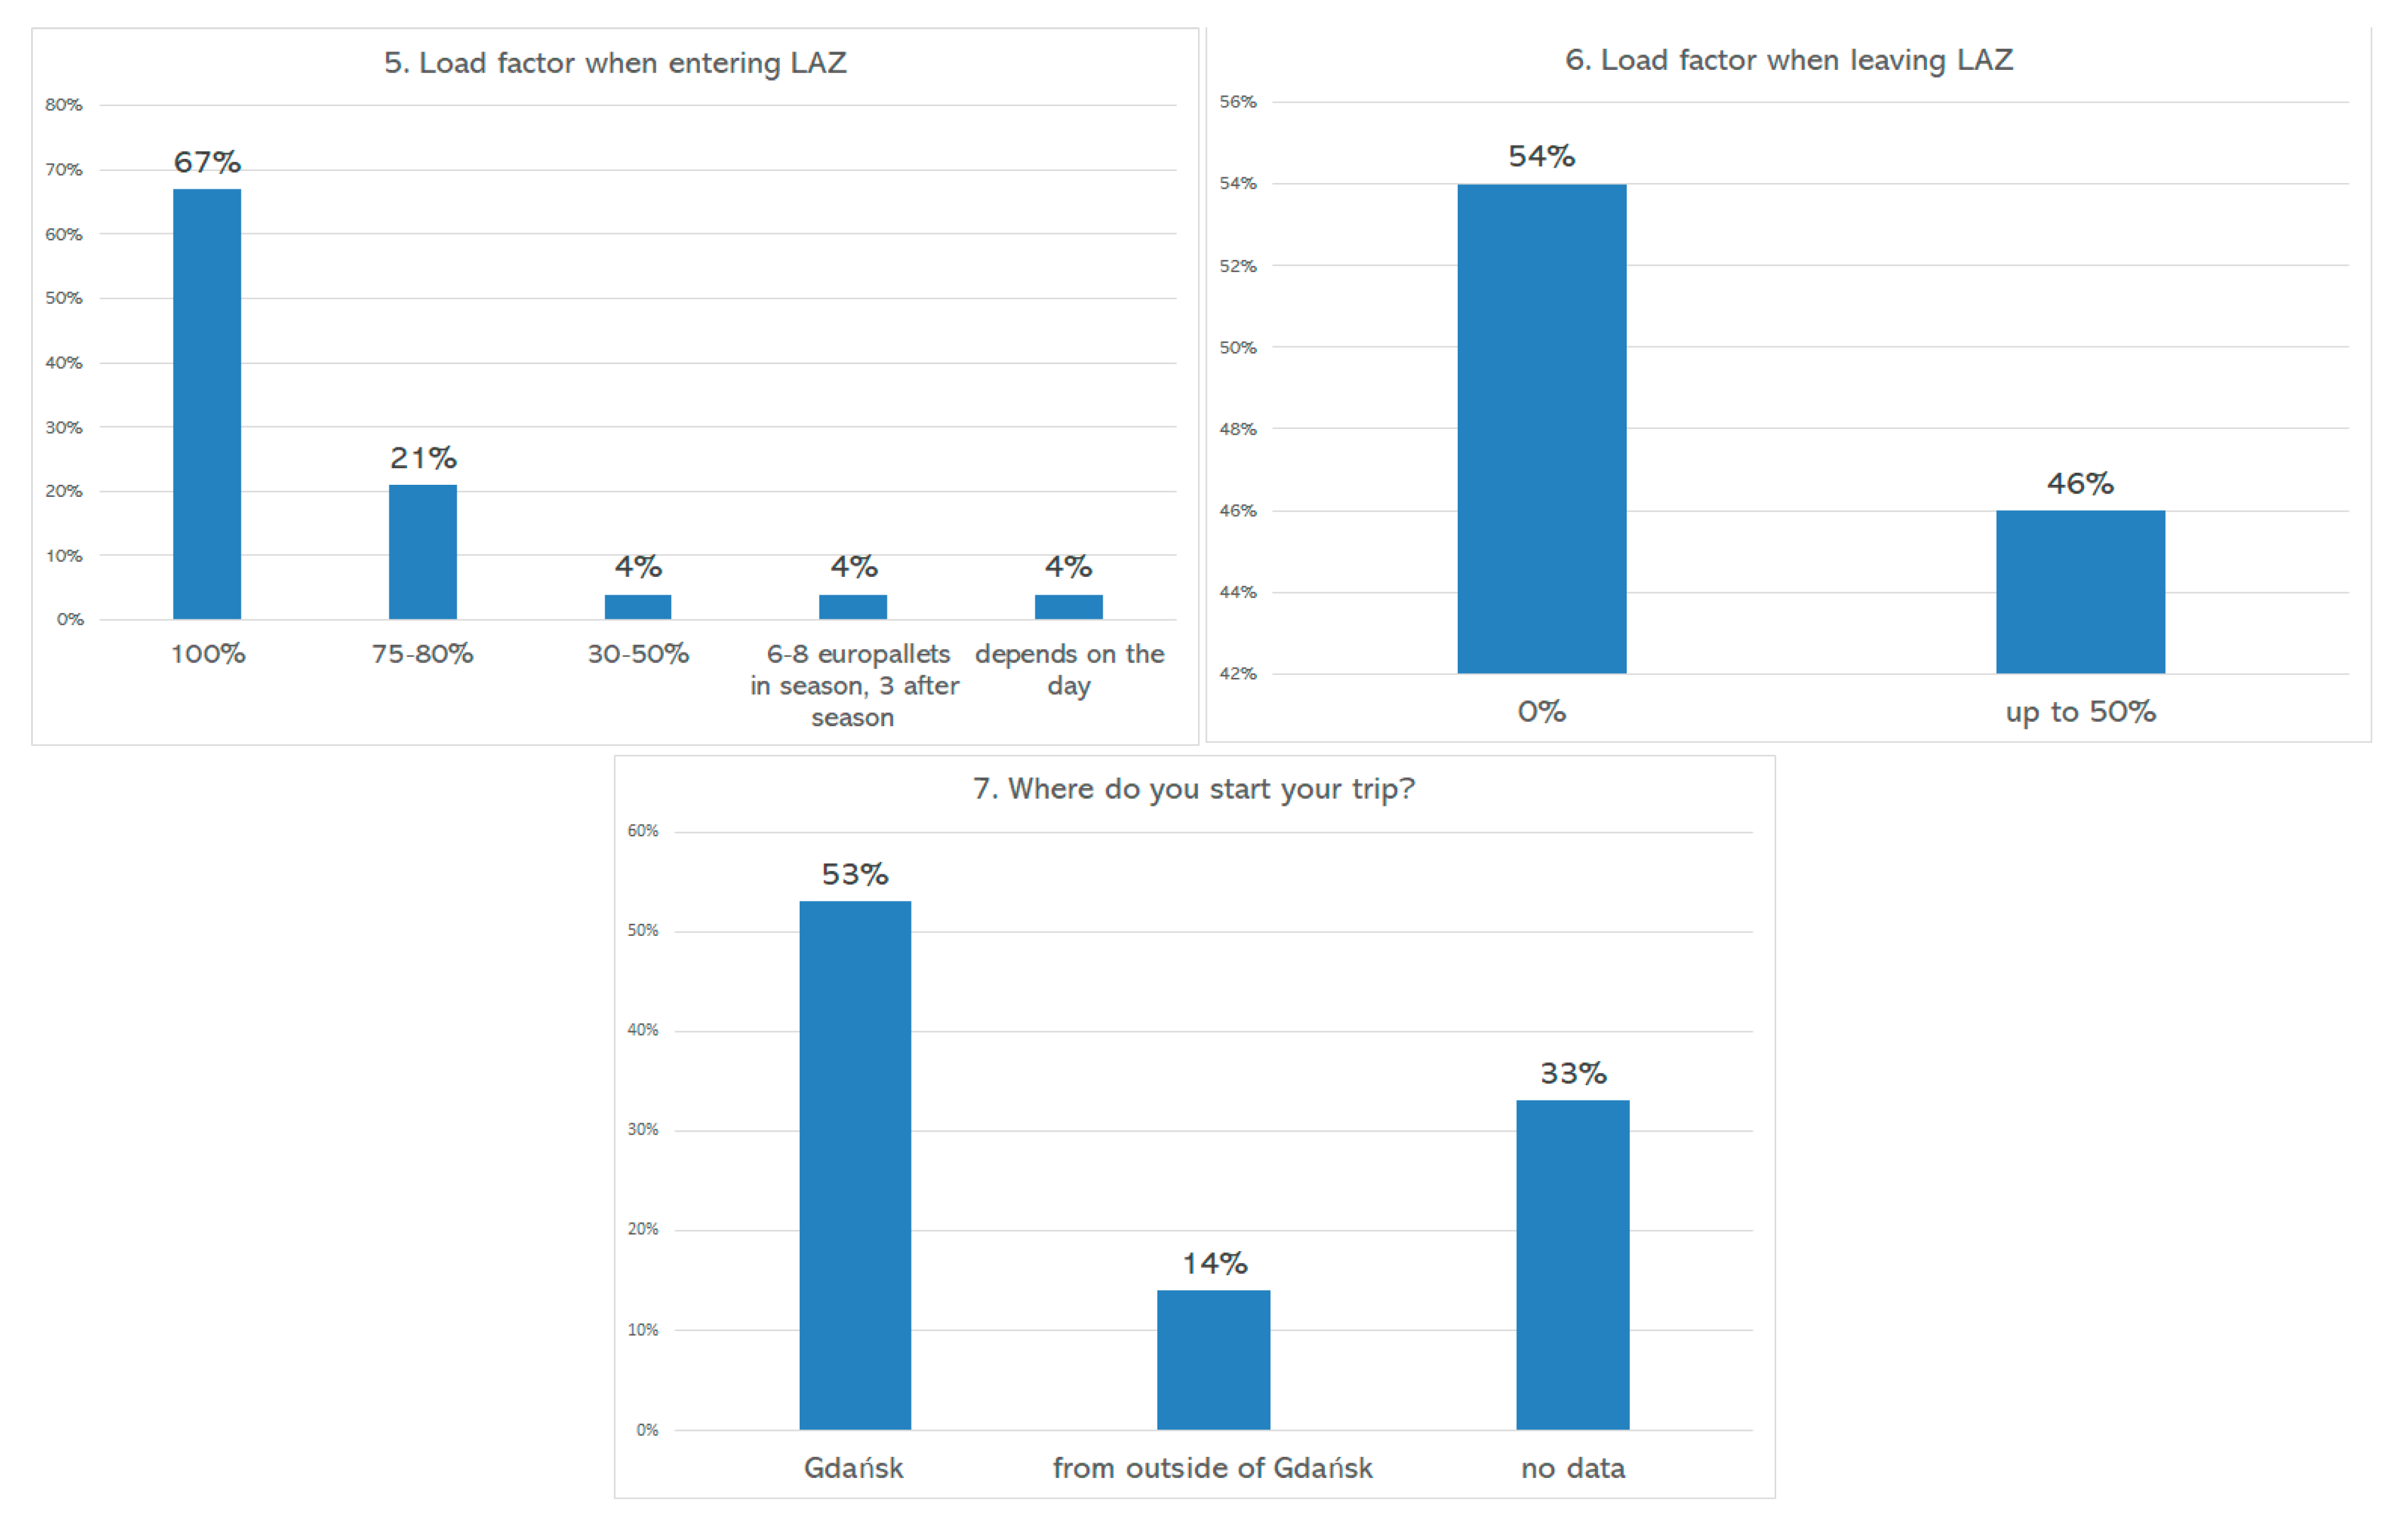
In the interviews, 67% of drivers declared that when entering LAZ their car was 100% loaded, 21% determined the loading factor at 75–80% (Figure 4, question 5). Following this, 8% stated that the loading factor of the vehicle depends on the season and day, and 4% determined that the loading factor is at the level of 30–50%. Half of the respondents left all the goods in LAZ, leaving the Zone with an empty vehicle (Figure 4, question 6). This is an exceptionally good result, especially against the European average, which means that drivers are dedicated to LAZ and that operators organize transports well and have well-defined routes. However, there is still space to reorganize the load utilization. Perhaps the empty cars exiting the LAZ could take with them, for example, reusable containers from restaurants.
From the responses given, 53% of the respondents deliver goods from the Gdansk region, others from outside of Gdansk (Figure 4, question 7). It was revealed that 74% drive from the place of loading to LAZ in less than 30 min. Based on the average speed achieved in the center of Gdansk, the radius of the distance between the locations of warehouses and wholesalers can be drawn (Figure 5).
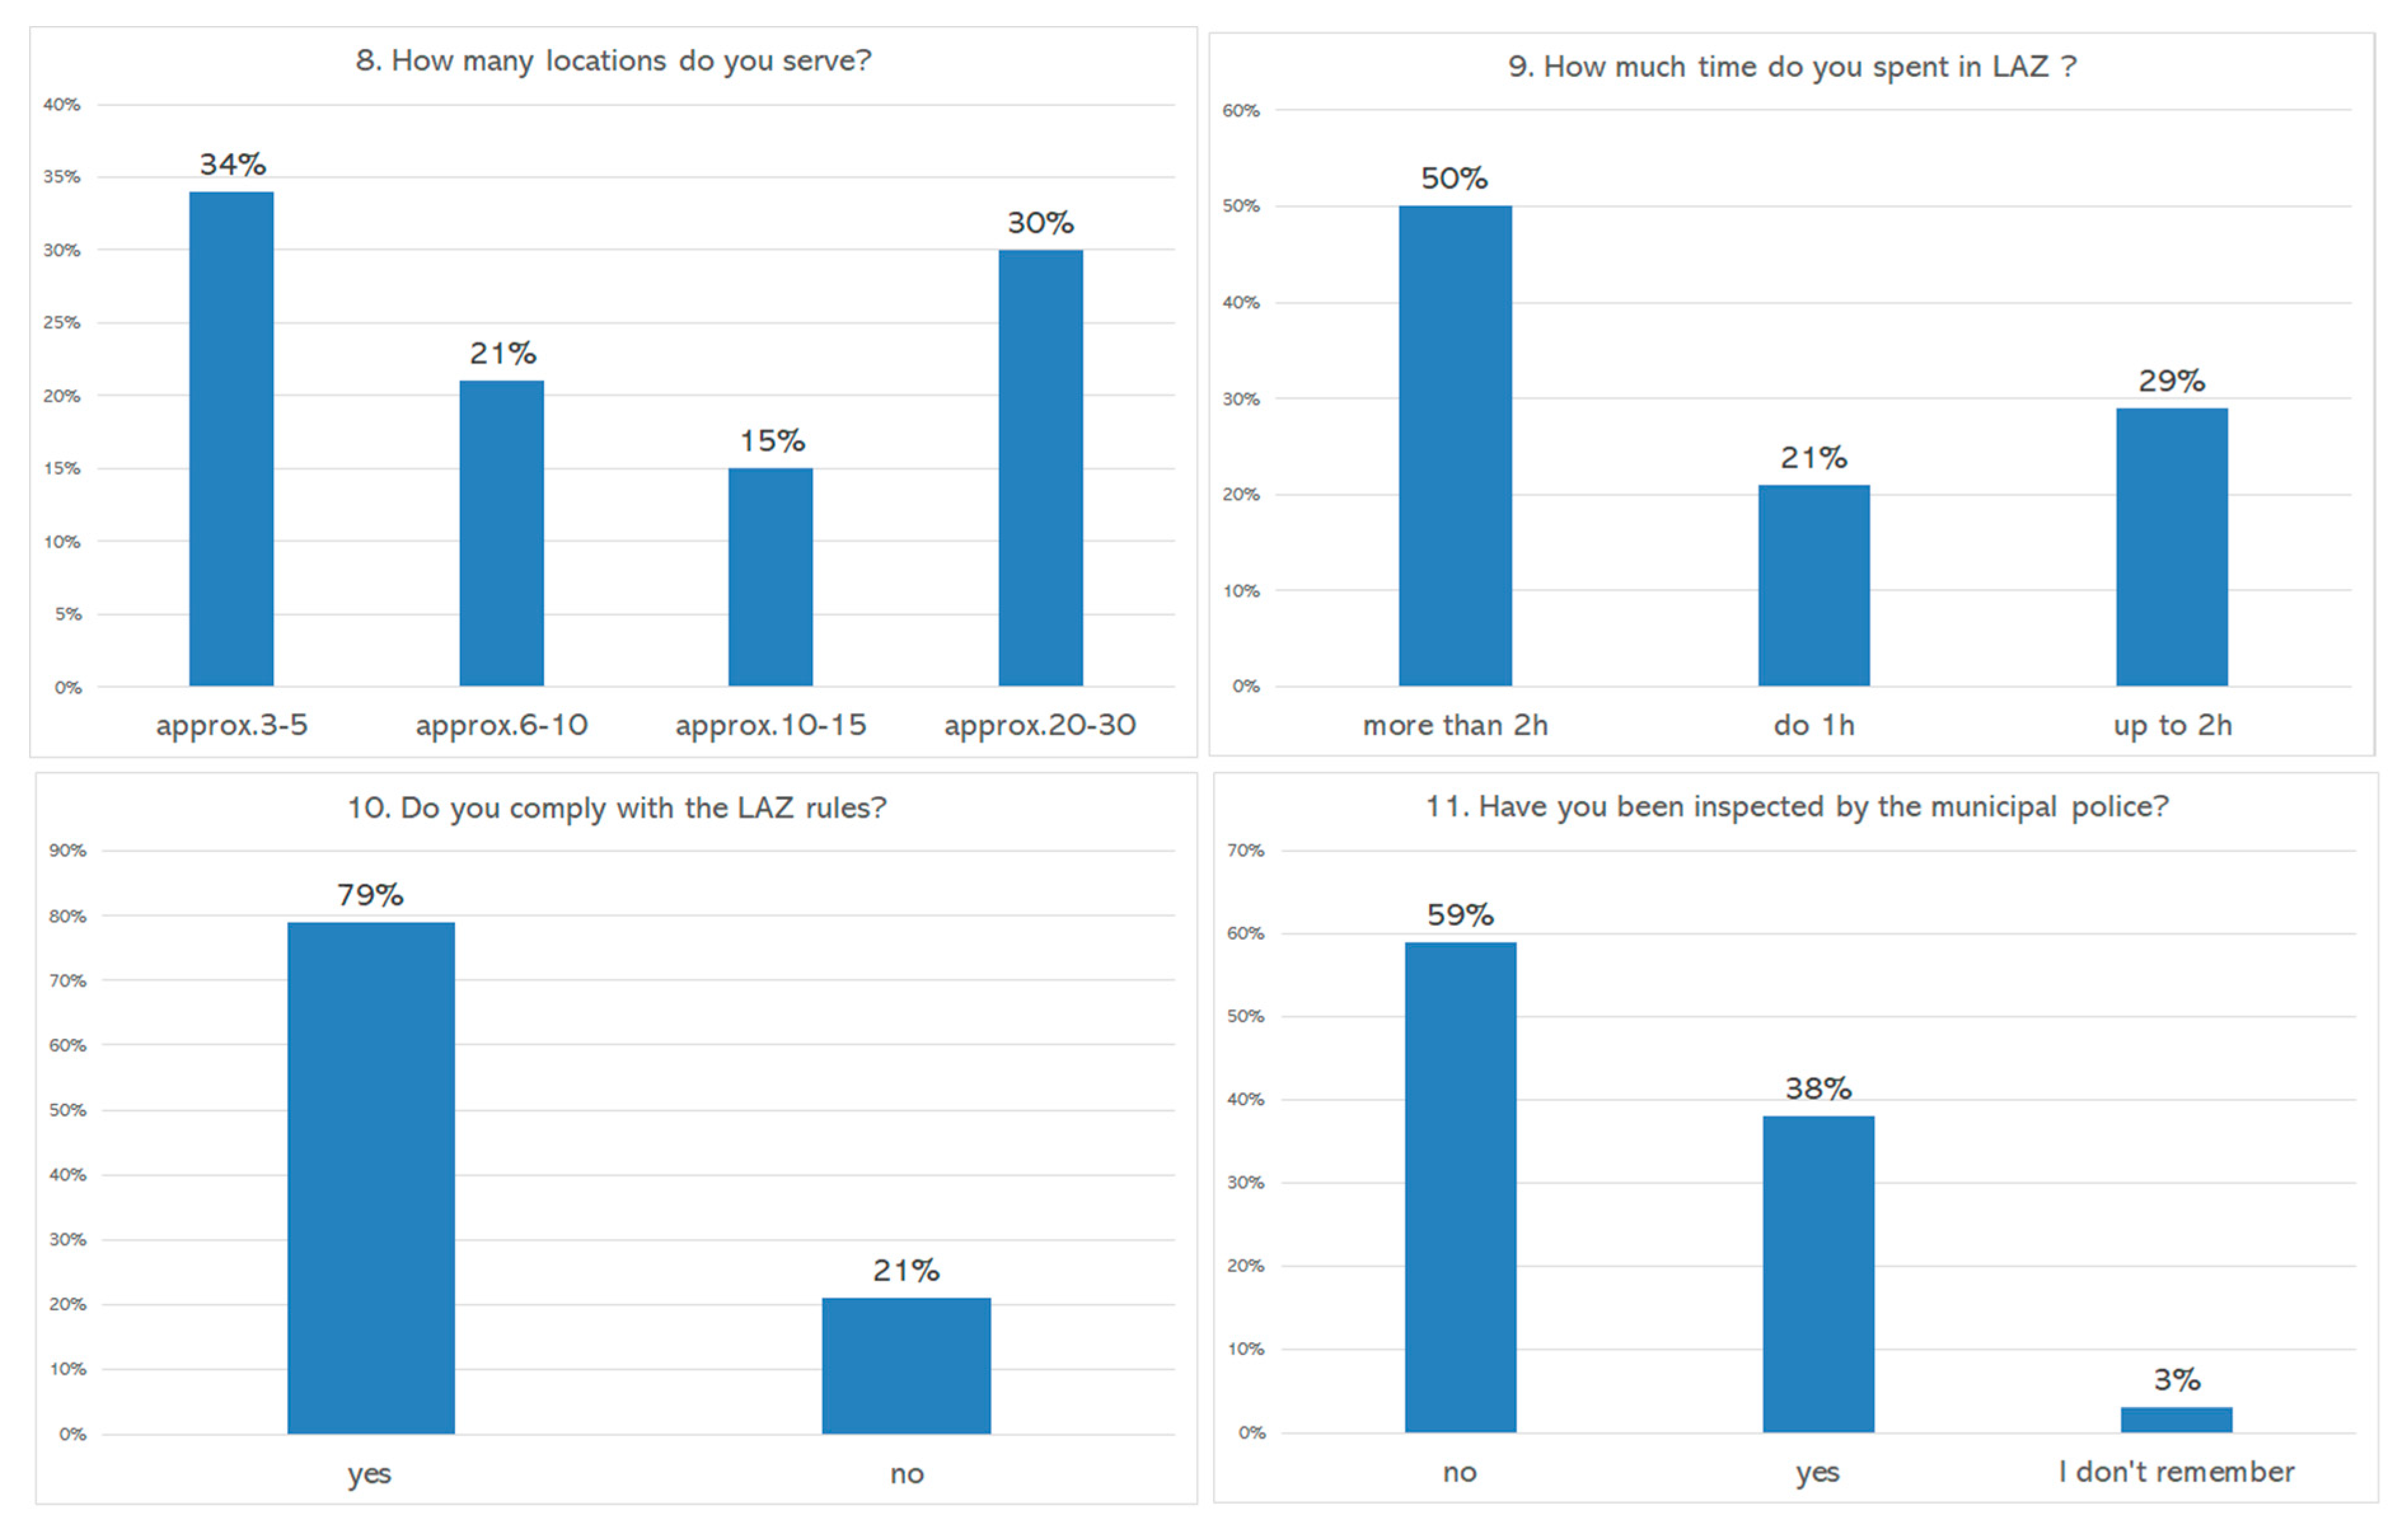
It was observed that 34% of the suppliers support 3–5 locations, 21% of the providers support fewer than 10 receivers, 15% serve 10–15 units, and 30% serve more than 20 locations (Figure 6, question 8).
Half of the respondents spend several hours in LAZ, 29% less than 2 h, and only 21% less than 1 h (Figure 6, question 9). From the frequency, number of serviced receivers, vehicle fill and time spent in the Zone, it can be concluded that the deliveries are fragmented.
However, whilst 79% of the drivers declare that they comply with time restrictions, at the same time only 67% of the drivers actually adhere to the existing suppliers’ hours of entry (Figure 6, question 10). Others admit to staying longer in the Zone, which may confirm disinformation caused by several changes to LAZ regulations.
According to the answers received, 59% of the respondents have not been checked by the security services. Others have, and therefore reinforcement could be on a higher level (Figure 6, question 11).
In the study, 56% of the respondents stated that LAZ facilitated their service to the Zone, 22% could not determine it due to the fact that they did not know the previous situation, 22% claimed that introducing LAZ did not change the situation (Figure 7, question 12). This means that the direction of the changes is good. All the more, it can be assumed that 56% of the 22% unable to assess the situation would also be satisfied if they knew of the previous chaos. Of the respondents asked, 40% said that LAZ reduced congestion, 47% claimed that introducing LAZ did not reduce it, 13% did not have an opinion (Figure 7, question 13).
Nevertheless, 83% evaluated the functioning of LAZ well or quite well, 14% had no opinion and only 3% had a negative opinion (Figure 7, question 14). Following this, 50% thought that LAZ should not be extended, 25% thought that it should be, 25% had no opinion (Figure 7, question 15). When assessing the region in terms of recreation, tourism and habitability, it was acknowledged that most attractions are located within the Zone.
Parking spaces remain problematic; there are still too many vehicles in the Zone, despite the fact that they are almost exclusively residents’ vehicles. The automotive indicator in Gdansk (the number of cars per 1000 inhabitants) has more than doubled in nearly 20 years, with only the vehicles registered in the Gdansk municipality included in the statistics, and even twice as many vehicles with registration plates from outside of Gdansk. Making permanent changes in the city’s communication operations should be based on activities involving the so-called “push-pull method”. On the one hand, they consist of limiting traffic, mainly car traffic (push), and on the other hand, of stimulating it, mainly in the form of alternative means of transport (pull). However, using only this restriction, the solution will not be socially acceptable. Restricting traffic is primarily about reducing parking capacity. The city can reduce the number of parking spaces and introduce more efficient use of them by increasing the rotation of parking cars. This can be achieved by increasing the parking tariff, and sometimes by prohibiting parking for more than a certain number of hours.
Identification and analysis of other possible measures to be adopted by the area should be the result of partnership with all city stakeholders. The tendency towards adopting new sustainable logistics measures can be defined throughout a survey conducted among the stakeholders.
Research carried out by the author in the region [17] and also two other ongoing ones, indicates that only those measures that do not require work or cost efforts, are accepted. The types of measures that were analyzed concerned regulatory, technological, infrastructural, services, economic, urban and energy actions.
In an ongoing survey conducted by the author, the results of which are to be published by 2020, it is shown that entrepreneurs located in LAZ (mostly HoReCa) express high acceptance of an interactive city map for suppliers with the live info about the traffic and parking space and for the dedicated loading zones. Solutions like night deliveries, last mile deliveries operated by alternatively driven vehicles, load-sharing, a system of monitoring the delivery vehicles to support proper behavior and inevitability of financial fines for parking in prohibited area are accepted by half of the respondents. Less popular solutions were LEZs, ZEZs, ICT solutions like sensory parking management, smartphone apps for booking or using ITS to support deliveries. Among the not accepted solutions were benchmarking, electronic platform with the possibility to connect demand with supply and logistics service suppliers, and also cargo trams using existing infrastructure.
A similar survey was conducted in Gdynia (results to be published by 2020). Although the result regarding acceptance towards selected solutions was similar, the general acceptance level for each of them was much higher. Acceptance for most of the solutions exceeded 50%. General awareness of the stakeholders in Gdynia is much higher. The reasons can be attributed to the cities’ characteristics, (this will be elaborated in a different paper), but the certain thing is there is no single set of measures for every town. Each town is different, has different structure, conditions, dominating business profile, infrastructure, freight flows, etc. The works on a SULP must be preluded with a detailed survey.
6. Recommendations Based on Results
The Limited Availability Zone is a rational concept leading to reduction in congestion and carbon dioxide emission in city center, as demonstrated by numerous European experiences [18,19]. On the basis of the study, it can be concluded that it actually reduces the number of vehicles and ensures better utility of the truck load. Drivers can handle receivers faster, but there are still problems with finding a parking space. After 11 o’clock however, vans may still be encountered in the Zone, which means that the reinforcement is not working sufficiently.
The very idea of creating a Limited Accessibility Zone can be assessed positively. There are significantly less cars, which means that air pollution is significantly reduced. Gdansk Road and Greenery Authority estimates that the introduced changes have reduced the car traffic in LAZ by approximately 60%. Inhabitants of Tricity, outside the Zone, are forced to give up their own vehicles and choose public transport or pedestrian traffic.
A way to seal the Zone could be by installing hydraulic bollards that appear after 11 a.m. In addition, it would be necessary to create unloading bays with no parking for vehicles other than vans until 11 a.m., as currently drivers are often forced to stop at a place far from the place of delivery and travel the distance on foot with the goods on a trolley, which extends the delivery and stay time in LAZ.
Additionally, clear information boards should be located at the borders of the Zone. The LAZ control guards often ignore the suppliers’ misconduct, understanding the problem of delivering goods to specific locations and at specific times, which means the rules are not fully respected.
The flow of goods on the warehouse-LAZ route should be improved as many suppliers leave the Zone with an empty or partly empty load, and that opens a field for cooperation. Perhaps LAZ should be operated by dedicated operators from a consolidation center with integrated deliveries, or using a software tool that enables transport users to group transport needs, which would contribute to the reduction of transport costs. Thanks to this, providers of transport services would have the opportunity to increase the degree of vehicle load and eliminate empty runs. Such a platform is a way to obtain savings for enterprises and shorten the time of performing tasks. The advantage of this solution for the society and economy is the reduction of traffic, and thus the reduction of the negative impact of road transport on the environment. Thanks to their cooperation, participating companies can reduce costs, increase profits and reduce CO2 emissions.
7. Conclusions
In Poland, public awareness of climate change and smog is relatively high, but at the same time mental biases contribute to low openness to measures tackling these issues. Capitalism in Poland is 30 years old and is only beginning to become civilized. The mistrust towards competition and the belief that the authorities will do nothing that can favor entrepreneurs is still dominant. Thus, the strategy of limited trust and “counting on oneself” dominates. Hence the reluctance to establish cooperation on the road in order to increase efficiency and to make decision to use UCC.
According to city authorities, introducing LAZ was supposed to reduce traffic in the Zone by approximately 60%. However, no traffic count nor any other traffic statistics are conducted in the Zone. From the presented research, it can be concluded that the functioning of the Zone is not properly executed and that the feedback from the suppliers does not reach the city authorities. The results of the research can constitute an input to the planned Freight Quality Partnership in Gdansk, in which representatives of all stakeholders (suppliers, receivers, authorities, residents) should take place, as each of these groups are not aware of the problems of the other groups. The questions can be used by any city with a defined functional urban area.
Starting and extending work on SULPs is a great opportunity to seal closed zones, communicate with residents about the importance of logistics, communicate with entrepreneurs about the importance of cooperation and its benefits to all stakeholders. SUMPs already bring effects in many cities in the form of sustainable mobility. Similarly, SULPs may contribute to creating sustainable logistics in European cities.
The presented stages of writing SULP, designed by SULPiTER project are intended to be a decision support system for policy makers to facilitate the process of elaborating alternative city logistics scenarios. Each city can use this template in order to report the main points of each SULP at functional urban area level. Based on the guidelines designed in the ELTIS project, it describes the process which each city uses to create SULP through data collection. Data collection should take into consideration the type of suppliers, warehousing spaces, vehicles, supplies, home deliveries, traffic count. The data presented in the paper is part of the data needed for SULP creation, however, questions asked can be asked to the drivers delivering goods in every city, considering not only LAZ, but other functional urban areas (like LEZ or other).
Funding
This paper is supported by University of Gdansk.
Acknowledgments
The author is grateful for the participation in the survey and for the valuable comments from three anonymous reviewers.
Conflicts of Interest
The author declares no conflict of interest.
References
- Dolan, S. The Challenges of Last Mile Logistics & Delivery Technology Solutions. 2018. Available online: https://www.businessinsider.com/last-mile-delivery-shipping-explained?IR=T (accessed on 1 February 2018).
- Kaszubowski, D. Recommendations for urban freight policy development in Gdynia, Transportation Research Procedia 12. In Proceedings of the 9th International Conference on City Logistics, Tenerife, Canary Islands, Spain, 17–19 June 2015. [Google Scholar]
- European Commission. Communication from the Commission to the European Parliament, The Council, The European Economic and Social Committee and the Committee of the Regions. In Proceedings of the Together towards Competitive and Resource-Efficient Urban Mobility, COM (2013) 913 final, Brussels, Belgium, 17 December 2013. [Google Scholar]
- Wołek, M. Sustainable Urban Mobility Plan as a tool for the development of sustainable urban mobility. Logistyka 2014, 4, 3401–3412. [Google Scholar]
- ENCLOSE, Project Website. 2015. Available online: http://www.enclose.eu/content.php?p=1 (accessed on 10 May 2019).
- SULPiTER, Project Website. 2019. Available online: https://www.interreg-central.eu (accessed on 10 May 2019).
- Ambrosino, G.; Liberato, A.; Pettinelli, I. Sustainable Urban Logistics Plans (SULP) Guidelines. In Proceedings of the Civitas Forum, Ljubljana, Slovenia, 7–9 October 2015. [Google Scholar]
- Debyser, A. Urban Mobility. Shifting Towards Sustainable Transport Systems; European Parliamentary Research Service: Brussels, Belgium, 2014; p. 14. [Google Scholar]
- Foltynski, M. New challenges for transport systems beyond 2020—SULPiTER project. In Proceedings of the 3rd International Conference Green Cities 2018–Green Logistics for Greener Cities, Szczecin, Poland, 13–14 September 2018. [Google Scholar]
- Giuliano, G. The challenges of urban freight: A research perspective. In Proceedings of the 2018 VREF Conference on Urban Freight, Gothenburg, Sweden, 17–19 October 2018. [Google Scholar]
- UM Gdansk. Gdansk in Numbers. 2019. Available online: https://www.gdansk.pl/biznes/gdansk-w-liczbach,a,33608 (accessed on 17 February 2019).
- CIVITAS. Smart Choices for Cities. Cycling in the City. 2016. Available online: https://civitas.eu/sites/default/files/civ_pol-09_m_web.pdf (accessed on 2 March 2019).
- Statistics Poland. Available online: https://stat.gov.pl/en/ (accessed on 12 July 2019).
- Tundys, B. City-logistics as a Factor Regional Development (in a Aspect Quality Management of the Air). In Proceedings of the 8th European Conference of Young Research and Scientific Workers Transcom Proceedings, Žilina, Slovakia, 22–24 June 2009. Section 2, Economics and Management, Part 2. [Google Scholar]
- Transportation Research Board. Guidebook for Freight Policy, Planning, and Programming in Small-and Medium-Sized Metropolitan Areas, Washington, DC. 2007. Available online: http://www.dot.ca.gov/hq/tpp/offices/ogm/key_reports_files/National,%20Technical%20studies/NCHRP_guide_to_small_and_med_metro_freight_planning.pdf (accessed on 9 February 2018).
- ZDiZ. Zarząd Dróg i Zieleni w Gdansku. Sustainable Urban Mobility Plan for Gdansk. 2018. Available online: https://gzdiz.gda.pl/download/2019-01/360.pdf (accessed on 11 February 2018).
- Matusiewicz, M. The argumentation for the implementation of Urban Consolidation Centre for the Old Town in Gdansk as an indication of sustainable urban freight logistics. Res. J. Univ. Gdansk. Transp. Econ. Logist. 2017, 69, 63–71. [Google Scholar]
- Amundsen, A.H.; Sundvor, I. Low Emission Zones in Europe Requirements, enforcement and air quality, Institute of Transport Economics, Norwegian Centre of Transport Research. 2018. Available online: https://www.toi.no/getfile.php?mmfileid=49204 (accessed on 12 February 2019).
- Jiang, W.; Manfred, B.; Groer, S.; Scheuvens, D. Impacts of low emission zones in Germany on air pollution levels. In Proceedings of the World Conference on Transport Research-WCTR 2016 Shanghai, Shanghai, China, 10–15 July 2016. Transportation Research Procedia 25. [Google Scholar]
Figure 1.
Stages of organizing the work on SULP. Source: [9].
Figure 1.
Stages of organizing the work on SULP. Source: [9].

Figure 2.
The location of Downtown in Gdansk and Main Town (left) and the Limited Accessibility Zone (LAZ) (right) in yellow in the area of the Main Town in red. Source: own elaboration based on the Order of the Mayor of Gdansk No. 34/14 of 10 January 2014 using Google Maps, access 7 February 2019.
Figure 2.
The location of Downtown in Gdansk and Main Town (left) and the Limited Accessibility Zone (LAZ) (right) in yellow in the area of the Main Town in red. Source: own elaboration based on the Order of the Mayor of Gdansk No. 34/14 of 10 January 2014 using Google Maps, access 7 February 2019.

Figure 3.
Distribution of the respondents’ answers. Source: Own study.

Figure 4.
Distribution of the respondents’ answers. Source: Own study.

Figure 5.
Journey time to the Main Town from the vicinity of Gdansk. Source: Congestion-meter on Targeo.pl, access: 10 February 2019.
Figure 5.
Journey time to the Main Town from the vicinity of Gdansk. Source: Congestion-meter on Targeo.pl, access: 10 February 2019.

Figure 6.
Distribution of the respondents’ answers. Source: Own study.

Figure 7.
Distribution of the respondents’ answers. Source: Own study.


Table 1.
Comparison of traditional transport planning and sustainable urban mobility plans.
| Traditional Transport Planning | Sustainable Urban Mobility Planning | Sustainable Urban Logistics Plans |
|---|---|---|
| Focus on traffic | Focus on people | Focus on effectiveness of the supply chain and last mile delivery |
| Primary objectives: traffic flow, capacity and speed | Primary objectives: accessibility and quality of life, sustainability, economic viability, social equity, health and environmental quality | Primary objectives: emissions free logistics in cities by 2050 |
| Modal-focused | Balanced development of all relevant transport modes and shift towards cleaner and more sustainable modes | Fully loaded and alternatively driven delivery cars, cargo bikes |
| Infrastructure focus | Integrated set of actions to achieve cost-effective solutions | City-profiled measures selected through the results of a survey. Among possible measures: dedicated loadings bays, cooperation on road, competition on shelf, access restrictions, time restrictions, ICT, etc. |
| Sectoral planning document | Sectoral planning document consistent and complementary to related policy areas (such as land use and spatial planning, social services, health, enforcement and policing; etc.) | The document is an extension of the Sustainable Urban Mobility Plan (SUMP) document and it is consistent with other local, regional and national transport policy documents |
| Short and medium-term delivery plan | Short and medium-term delivery plan embedded in a long-term vision and strategy | Short and medium-term delivery plan embedded in a long-term vision and strategy |
| Related to an administrative area | Related to a functioning area based on travel to work patterns | Related to a functioning area |
| Domain of traffic engineers | Interdisciplinary planning teams | Interdisciplinary planning teams, Freight Quality Partnership including area stakeholders |
| Planning by experts | Planning with the involvement of stakeholders using a transparent and participatory approach | Planning with the involvement of stakeholders using a transparent and participatory approach |
| Limited impact assessment | Regular monitoring and evaluation of impact to inform a structured learning and improvement process | Regular monitoring and evaluation of impact to inform structured learning and improvement process, according to allocation of responsibilities among the actors involved |
Source: Own elaboration (Sustainable Urban Logistic Plan (SULP) part) and [8].
Table 2.
Categorization of freight program activities vs. Gdansk situation (subjective review).
| Freight Planning Stage | Characteristics | Gdansk Check |
|---|---|---|
| Basic (freight system needs are handled indirectly as part of the overall transportation program activities) | • Little or no freight-specific planning activities | ۷ |
| • Few known freight data sources | ۷ | |
| • Little or no interaction to date with the private sector freight community | ۷ | |
| • Limited knowledge of economic base, industry or specific freight needs | ۷ | |
| • Freight system is addressed as part of larger transportation projects | ۷ | |
| Advanced (freight system needs have begun to receive some attention; however, they have not been fully integrated into the transportation program activities) | • Some history of freight-specific planning activities | - |
| • Some interaction with private sector stakeholders as part of a specific project | - | |
| • Basic understanding of freight system and its regional importance | - | |
| • Freight program elements are beginning to form, leaders are beginning to emerge | - |
Source: [15] and own elaboration.
© 2019 by the author. Licensee MDPI, Basel, Switzerland. This article is an open access article distributed under the terms and conditions of the Creative Commons Attribution (CC BY) license (http://creativecommons.org/licenses/by/4.0/).
Share and Cite
MDPI and ACS Style
Matusiewicz, M. Towards Sustainable Urban Logistics: Creating Sustainable Urban Freight Transport on the Example of a Limited Accessibility Zone in Gdansk. Sustainability 2019, 11, 3879. https://0-doi-org.brum.beds.ac.uk/10.3390/su11143879
AMA Style
Matusiewicz M. Towards Sustainable Urban Logistics: Creating Sustainable Urban Freight Transport on the Example of a Limited Accessibility Zone in Gdansk. Sustainability. 2019; 11(14):3879. https://0-doi-org.brum.beds.ac.uk/10.3390/su11143879
Chicago/Turabian StyleMatusiewicz, Maria. 2019. "Towards Sustainable Urban Logistics: Creating Sustainable Urban Freight Transport on the Example of a Limited Accessibility Zone in Gdansk" Sustainability 11, no. 14: 3879. https://0-doi-org.brum.beds.ac.uk/10.3390/su11143879
Note that from the first issue of 2016, this journal uses article numbers instead of page numbers. See further details here.