The Impact of Foreign Flight Attendants’ Service Quality on Behavioral Intention Toward Their Home Country—Applied SERVPERF Model


School of Tourism, Hanyang University, Seoul 133791, Korea
*
Author to whom correspondence should be addressed.
Sustainability 2019, 11(15), 4136; https://0-doi-org.brum.beds.ac.uk/10.3390/su11154136
Submission received: 21 June 2019
/
Revised: 22 July 2019
/
Accepted: 24 July 2019
/
Published: 31 July 2019
(This article belongs to the Special Issue Cruise Traveling/Airline Traveling)
Abstract
:This study applied a service performance (SERVPERF) model to measure service quality and used a quantitative method for testing four research hypotheses. This research aims to examine the impacts of foreign flight attendants’ service quality on behavioral intention toward their home country. As a result, the service touch of foreign flight attendants was influenced by curiosity, image, and behavioral intention toward their home country. Thus, this is an important finding that flight attendants conduct a crucial role not only for the airline but also for tourism in their home country. And empathy was found to be the most important dimension of service quality when a flight attendant offered a service to foreigners. This dimension was related to individual attention and communication skills. However, the limitation of this study is that the respondents were passengers of only one nationality; further research should, therefore, include a more diverse range of nationalities.
1. Introduction
The international airline industry has acted as a great contributor about economic growth. It helped more convenient displacement of passengers and enlargement the leisure and tourism choices as well as international trade activities [1]. In 2016, scheduled airlines carried more than 3.8 billion passengers and industry-wide revenue per passenger kilometers (RPKs) grew by 7.1%. IATA’s director general and CEO Alexandre de Juniac stated, “Over the next 20 years, we expect to see a near doubling of passengers from the approximately four billion who traveled in 2017.” [2] The tourism industry is regarded the international airline as significant and sustainable industry. A lot of airlines tried to provide a better service quality to passengers because they recognized the importance of passengers to keep their businesses [3]. Therefore, to provide better quality of experiences and services, airlines need to read passengers’ mind [3]. Most passengers perhaps pass almost all their time on flight, so airlines should take note of improving their in-flight service quality [4]. Flight attendants are the point of contact and front-line service employees who shape the experience of airline passengers through providing the quality of service during the flight service process [5].
The majority of the previous studies on flight attendants’ service quality (SQ) have focused on the impact of SQ on customer satisfaction and loyalty and/or behavioral intention (BI) toward the airline industry [6]. However, there is a death of literature that examine the impact of foreign flight attendants’ service quality on BI toward their home country. Thus, the objective of this research is to examine the impacts of foreign flight attendants’ SQ on BI toward their home country.
2. Literature Review
2.1. Service Quality (SQ)
Services and goods are eventually different. Merchandises are concrete, can make use of the real thing, and their performances are determined by their shapes and forms [7]. On the contrary, services are classified to merchandises as ways of providing, consuming, and evaluating. First, services are basically invisible and accordingly correlated to customer contact [8]. Whyte’s (1946) essay [9] “When workers and customers meet” was the fundamental view of customer contact as a part of SQ. Then later, customer contact has come to a core differentiation between services and goods [10,11,12,13,14,15]. Second, when front-line employees, for instance, bank tellers, flight attendants, and insurance agents provide a service to customers, it can be hard to standardize SQ in the same way as the quality of goods from manufacturers can be standardized [16]. Third, the services of providing and spending can happen co-instantaneously and estimation of SQ often happens the moment the front-line employees provide services to the customer [16].
Thus, SQ requires to have other method of measurement to merchandise quality. First, customers determine more difficult to evaluate SQ than merchandises quality. Second, SQ is impossible to be separately estimated based on the outcome of the service. Third, the customers measure the SQ by their anticipation of quality level, thus the criteria of SQ is defined by customers’ individual estimation [16].
2.1.1. The SERVQUAL Model
Parasurman, et al. (1985) cultivated the service quality (SERVQUAL) model, which tried to find out the gap between the service anticipation and perception of the actual service by the employee at a contact moment [16]. The research in 1988, the ten acknowledged dimensions (tangibility, reliability, responsiveness, competence, courtesy, credibility, security, access, communication, and understanding the customer) were decreased to five dimensions. The five dimensions of SQ contained tangibility, reliability, responsiveness, assurance, and empathy. As the final outcome, the authors created five dimensions included a 22-item questionnaire as the PZB SERVQUAL model [17].
On the airline industry, the first study of the SERVQUAL model were published in 1988 [18] and the direct application of the model to customers’ evaluation appeared in 1991 [19]. Since then, diverse fields such as telecommunication [20], retail stores [21], financial services [22], health care [23], hotels [24], and public sector [25] made use of this gap model. However, Cabello and Chirinos (2012) expressed criticism of the model for complexity as applying both the expectation and perception [26]. Al-Ibrahim (2014) judged that this gap model was very complexed to become a diagnostic instrument for measuring SQ, too [27].
2.1.2. The SERVPERF Model
Cronin and Taylor (1992, 1994) proposed the service performance (SERVPERF) model, which only concentrated on the estimation of the perception of actual service [28,29]. The SERVPERF did not contain customers’ anticipations, so it became easier, more timesaving, and more functional [30]. For this tool, SERVPERF made use of the aforementioned 22-item questionnaire about the perception of the service performance but did not include expectations [31].
Tangibility. In realistic experience, we notice that service is often connected to tangible or physical elements [32]. Tangible features contain the appearance of physical installations, equipment, employees, and communication materials to which the consumer reacts, as well as other products that promote activity of or interaction with the service [33]. In the airline industry, tangibility is evaluated through in-flight physical circumstances such like safe seats, the installed equipment and installation, clean aircraft interiors, flight attendant’s appearance, the provision of food and beverages, or entertainment materials provided during the flight [34]. If these tangible dimensions are ineffective, low quality or unmaintained, it is reasonable that customers would be unsatisfied with the quality of airline service [35]. A tangible element such as the flight attendant’s appearance is perceived as more important in measuring in-flight SQ than measuring ground SQ [3]. A flight attendant’s appearance could be a core concern in improving customers’ impression of an airline’s innovativeness because this reflects the airline’s ability in-flight services [3]. Thus, tangibility can be measured through the flight attendants’ visual attractiveness, appearance, uniform and so on.
Reliability. Service reliability is defined as “the ability to perform the promised service accurately and dependably in an environment” [16]. The service reliability mainly comprises two dimensions: “promises” and “doing it right” [36]. The reliability is focused on an intangible service that has a significant impact on SQ [36]. In the airline service industry, reliability may be estimated through flight schedule punctuality, accurate and up-to-date flight information, luggage safety, personal security, emergency procedures, and so on [33]. In addition, flight attendants’ reliability may be measured through promised service time, problem solving ability, various service offerings, and so on.
Responsiveness. Responsiveness is defined as the ability to react to a customer’s needs and wants in a timely manner [37]. It also refers to the ability to react to a customer’s demand immediately [6]. In the service industry, service responsiveness is defined as helpfulness to customers and prompt service [16]. In airline services, it is important to provide assistance and helpful service via immediate reaction [33]. Thus, a flight attendant’s responsiveness can be measured through willingness to assist passengers, sincere concern in passengers’ needs, providing immediate service, and so on.
Assurance. Assurance is defined as the ability to deliver faith and confidence [16]. In the airline service industry, the dimension of assurance is correlated to basic characteristics such as trustworthiness among flight attendants, knowledge and confidence to keep the trustful service from the online experience to the real flight experience, and the standard of politeness among flight attendants [38]. Assurance can be measured through politeness, kindness, and reputation of flight attendants, capability to answer passengers’ questions, and so on.
Empathy. Empathy is defined as ministering and customized attention to its customers [16]. And it is considered a crucial element of in-flight service as offering customized attention and comprehend concrete customer needs. Leong et al. (2015) also argue that flight attendants should have the capability to recognize customers’ emotions, requests, or complaints [6]. Flight attendants’ empathy may be measured through customized attention to passengers; figuring out concrete needs; realizing membership passengers; special service for the elderly, disabled, or children; paying attention to listen to passengers, and so on.
2.2. Personal Touch
Babbar and Koufteros (2008) indicate human- or people-related components that the factor of “personal touch” in the service by contact employees. The personal touch identifies their role as a decision factor of customer satisfaction in the airline [39].
Customer satisfaction can be defined as the general estimation concentrated on the total expense and purchase experience concerning goods or services [40]. McDougall and Levesque (2000) suggested that SQ is an antecedent and predictor of customer satisfaction [41]. As airline passengers stay most of their time airborne, thus the in-flight services should especially pay more attention to keep the high quality of services [3]. Flight attendants’ SQ is the most significant factor while in-flight service proceeds [5]. Specifically, the MOT (Moment of Truth) during in-flight service may be the key factor to satisfy passengers because the decisive moment on a direct facial interaction between flight attendants and passengers can lead to individual customer satisfaction [42]. Jan Carzon, in charge of turning Scandinavian Air System (SAS) into a customer-driven company, first introduced the fundamental notion of MOT [43]. Carton defined the MOT as a point of which a customer comes into contact with any aspect of the company, and thereby has an opportunity to form an impression of SQ [44]. By being satisfied by the MOT, passengers’ perspective of a flight experience may be transformed from flying “in an airplane” to flying “with people,” thus the utilization of the MOT can grow up the shape of SQ and progressively induce to customer satisfaction [5].
2.3. Curiosity
Curiosity generally reflects an awareness, pursue, and intimate need to explore novel, challenging and unclear information [45]. Past studies have classified four distinct sorts of curiosity: epistemic, sensory, perceptional, and interpersonal (IPC) [46]. Interpersonal curiosity or social curiosity [47] is the desire for other personal information and is essential to social interaction and human relations [48]. The purpose of IPC is generally to know information about other people (i.e., public or private behavior, experiences, thoughts, and feelings). These types of information are referred to as “people information” [48]. People information” has a valuable role in finding various specials and studying social-perceived phenomena such as cultural transmission and language development [49]. In the airline industry, when passengers are satisfied with the SQ via MOT on interacting with foreign flight attendants during the in-flight service process, customers may emerge IPC for foreign flight attendants, which is linked to being curious about “people (foreign flight attendants) information.” Thus, passengers’ IPC may lead to curiosity about a flight attendant’s culture, home country, and so on.
2.4. Country Image (CI)
There has been continuous concern in concept of image among a lot of disciplines including marketing [50], consumer behavior [51], international business research [52], communication [53], and political science [54]. The research on country image can be dated back to the 1930s and 1940s [55,56]. From the mid-1960s, scholars began paying greater attention to the concept of country of origin and it became a popular topic of international marketing research. Unfortunately, from a review of the recent literature on country image, there is no clear and universal definition of the concept [57]. Country image (CI) [58], country-of-origin image [59], and product-country image (PCI) [60] are terms of appearing to be closely associated [57]. From these various sorts, this research selected the first one, country image, according to the recommendation of Kotler et al. (1993). CI is generally defined as “the total of all descriptive, inferential, and informational beliefs about a particular country” [52]. The generic conceptualization and constructs of county image can be associated with different image elements including celebrities, politics, culture, tradition, history, economy, international business, and technology [61], all of which can influence on the whole CI [62]. Recently, study has started to consider how CI impacts on prospective tourists’ visit intention [63].
2.5. Behavioral Intention (BI)
BI has been recognized as the extent of individual plans to conduct or not conduct some concrete behavior in the foreseeable future [64]. Oliver (1997) defined BI as the stated likelihood of engaging in a particular behavior [65]. With this regard, only recently, the studies begin to identify that revisiting intention in particular has been associated with CI. The revisiting intention is considered as those who intend to revisit within a year and their willingness to travel to the destination often [66]. Also, revisiting intensions can be considered as tourists’ tendency to prefer the equal product, brand, location, or destination in the future [67].
2.6. Research Model and Hypotheses
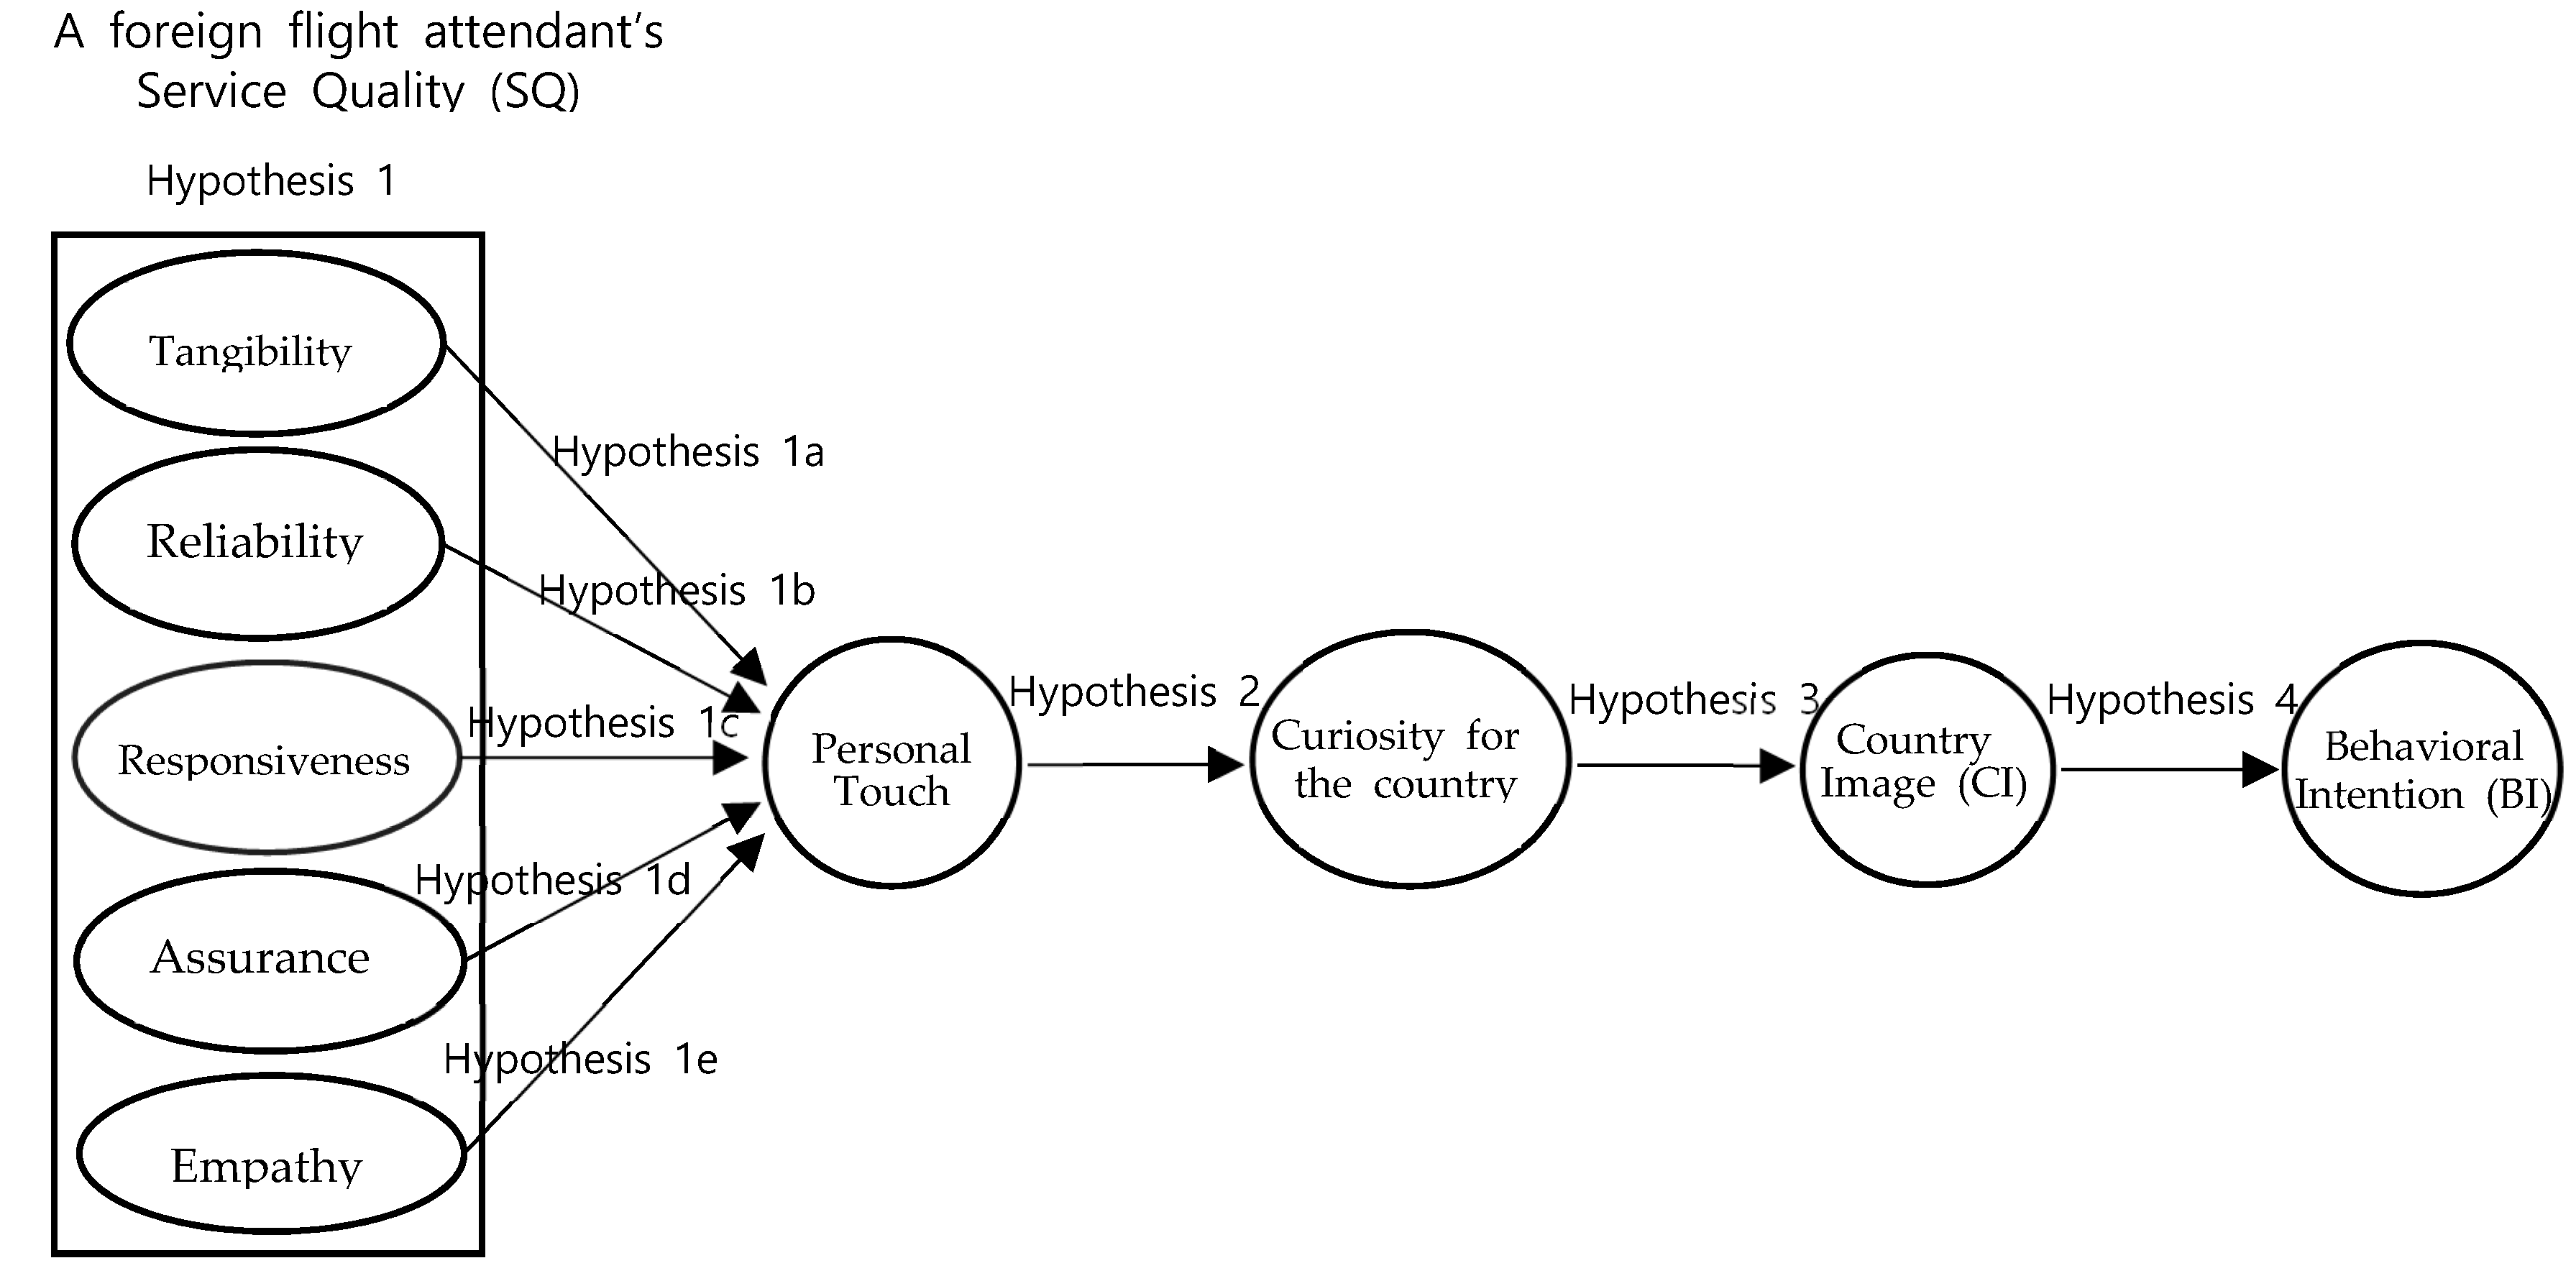
A theoretical model (Figure 1) was developed based on the conceptual background discussed above. The conceptual model describes the hypothesized relationships among service quality, personal touch, curiosity, image, and BI toward the flight attendant’s home country. The model contained a total of four research hypotheses.
Hypothesis 1:
A foreign flight attendant’s service quality (SQ) has a positive impact on personal touch.
- Hypothesis 1a: A foreign flight attendant’s appearance has a positive impact on personal touch.
- Hypothesis 1b: A foreign flight attendant’s reliability has a positive impact on personal touch.
- Hypothesis 1c: A foreign flight attendant’s responsiveness has a positive impact on personal touch.
- Hypothesis 1d: A foreign flight attendant’s assurance has a positive impact on personal touch.
- Hypothesis 1e: A foreign flight attendant’s empathy has a positive impact on personal touch.
Hypothesis 2:
Personal touch has a positive impact on curiosity regarding a foreign flight attendant’s home country.
Hypothesis 3:
Country curiosity has a positive impact on country image (CI).
Hypothesis 4:
Country Image (CI) has a positive impact on behavioral intention (BI).
3. Methodology
3.1. Measurement
Questionnaire items were developed based on a multiple-item measurement scale that has been validated in previous studies. Table A1 in the Appendix presents specific measurement items used in this study.
3.2. Data Analysis
Statistical analyses of the primary data collected were performed using the SPSS WIN program. The demographic background was examined via descriptive statistics and frequency analysis. Multiple and simple linear regressions were carrying were conducted to test the research hypothesis; AMOS verified the overall research model by performing path analysis.
3.3. Respondents’ Profile and Demographic Characteristics
The survey questionnaire comprised of the aforementioned measurement items, a research description, and questions regarding personal characteristics. The questionnaire was pre-tested with faculty members and graduate students whose major is Tourism, and it was modified accordingly based on their feedback. The questionnaire was finalized using academic experts’ reviews and their feedback. Next, data were distributed to travelers at Inchon airport in Korea. More than 300 questionnaires were distributed by hand and we obtained valid 218 responses that are usable for data analysis.
3.4. Sample Characteristics
Table 1 shows the demographic profile of the survey participants. Among the participants, 50.7% were female travelers, and 48.4% were male travelers. In terms of age, about 30.0% were aged between 20–29 years old, 26.3% were 30–39 years old, about 16.1% were 50–59 years old, and about 12% were 40–49 years old. A total of 54.4% of respondents were single and 44.7% were married. In terms of education level, about 38.7% reported that they are university graduates, 28.6% were 2-year college graduates, 22.6% were high school graduates or less, and 8.3% were graduate degree holders. In terms of occupation, about 33.2% were company employees, 22.6% were students, followed by Housewife (9.7%), Businessman (7.8%), sales/service man (7.8%), unemployed (4.1%), retired (2.3%). About 27.6% reported that their household income is less than $30,000, 21.7% reported it as $30,000–$50,000, 19.8% indicated it was $50,000–$70,000, 12.0% reported it as $70,000–$90,000, and 12% reported a household income of more than $90,000. Regarding travel purpose, tourism accounted for 56.7%, official business was 23.5%, and visiting friends/relatives was 14.7%. Regarding participants’ frequency of overseas trip within a year, 43.8% indicated they traveled overseas once a year, 30.4% reported two or three times a year, 10.1%indicated four or five times a year, and 13.8% reported more than six times a year.
4. Results
4.1. Regression Analysis
Respondents were asked to rate the SQ of 15 attributes presented on seven-point Likert scales and these attributes were reduced to the following five factors: (1)—appearance, (2)—reliability, (3)—responsiveness, (4)—assurance, (5)—empathy. Table 2 presents the results of the regression analysis, which indicated that only three SQ factors (responsiveness, assurance, empathy) had a positive impact on personal touch. R2 of 0.672 indicates that 67.2% of the personal touch was explained by the three SQ factors. Further examination of the t-value revealed that (3) responsiveness (t = 2.085, p < 0.05), (4) assurance (t = 4.133, p < 0.001), and (5) empathy (t = 7.022, p < 0.001) were statistically significant.
Respondents were asked to rate personal touch in terms of three attributes presented on seven-point Likert scales. Table 3 presents the results of the regression analysis, which indicated that personal touch had a positive impact on curiosity regarding the foreign flight attendant. R2 of 0.262 indicates that 26.2% of the curiosity was explained by personal touch attributes. Further examination of the t-value revealed that personal touch (t = 8.732, p < 0.001) was statistically significant.
Respondents were asked to rate curiosity in terms of three attributes presented on seven-point Likert scales. Table 4 presents the results of the regression analysis, which indicated that curiosity had a positive impact on CI. R2 of 0.371 indicates that 37.1% of the curiosity was explained by the CI attributes. Further examination of the t-value revealed that curiosity (t = 11.263, p < 0.001) was statistically significant.
Respondents were asked to rate the CI in terms of six attributes presented on seven-point Likert scales. Table 5 presents the results of the regression analysis, which indicated that CI had a positive impact on BI. R2 of 0.403 indicates that 40.3% of the CI was explained by the BI attributes. Further examination of the t-value revealed that CI (t = 12.039, p < 0.001) was statistically significant.
4.2. Path Analysis
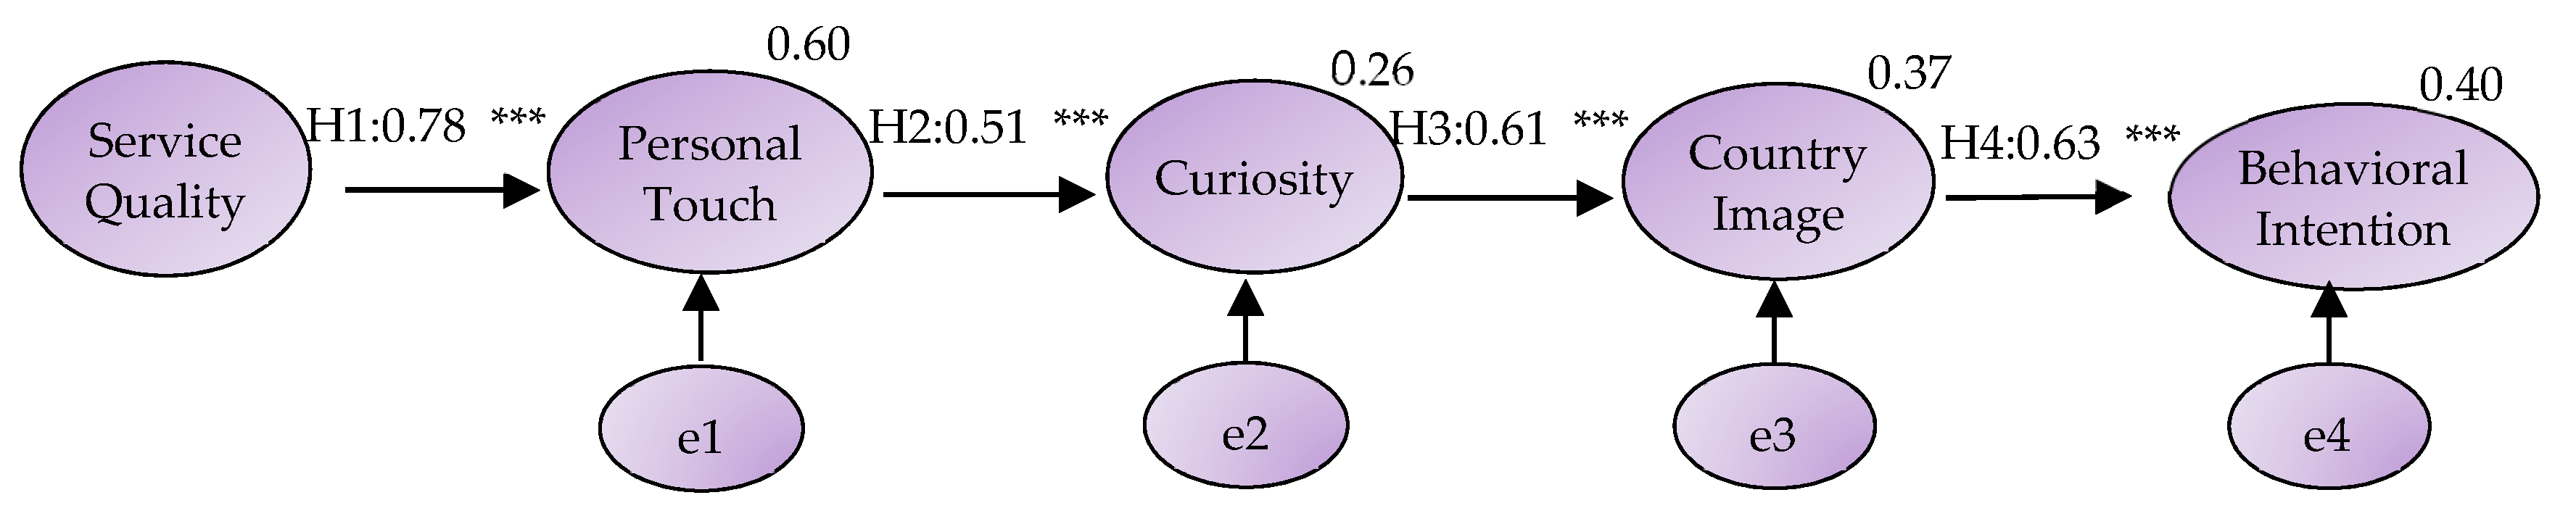
The path analysis model contained a relatively acceptable fit to the data (χ2 = 75.824, df = 6, p < 0.001, RMSEA = 0.232, CFI = 0.87, and TLI = 0.79). Squared multiple correlations were also generated; Personal touch (60%), curiosity (26%), CI (37%), and BI (40%). Further information should be added for clarity. As shown in Figure 2 and Table 6, the path coefficients of SQ on personal touch (β = 0.78, p < 0.001), personal touch on curiosity (β = 0.51, p < 0.001), curiosity on CI (β = 0.61, p < 0.001), and CI on BI (β = 0.63, p < 0.001) were significant. Therefore, our findings revealed that all hypotheses were supported.
5. Discussion
This study aims to measure the impact of a foreign flight attendant’s SQ of personal touch on curiosity, image, and BI regarding their home country. The path analysis confirmed that all hypotheses were supported. This indicates that the SQ of the foreign flight attendant impacted personal touch followed by curiosity, image, and BI toward their home country.
The results of multiple linear regression confirm that the five dimensions (tangibility, reliability, responsiveness, assurance, empathy) of SQ have a partially positively significant relationship with personal touch. Empathy, which had the highest regression coefficient (0.550), is the key driver of SQ, followed by assurance and responsiveness. Empathy measurement items relate to individual attention and communication skills, indicating that passengers may be more touched or satisfied when they communicate well with a foreign flight attendant, and when a foreign flight attendant can understand passengers’ various individual needs even though they have different national backgrounds. On the other hand, appearance(tangibility) measurement items were not found to be positively significant. This study shows passengers consider that customized services and communication skills are more important than the appearance of foreign flight attendants when passengers evaluate the SQ of them. As well, reliability was excluded because the allowable error reached the tolerance limit. Also, appearance (tangibility) measurement items were not found to be positively significant.
6. Implications
The findings provide presents both theoretical and practical implications for the tourism industry. First, this study extends the range of previous airline SQ studies by applying CI factors. The foreign flight attendant’s SQ may have an impact on BI toward their home country. This is an important finding that when flight attendants provide high quality of services to foreign passengers, they may conduct an important role not only for their airline but also for tourism in their home country. Thus, the findings provide suggestions to national tourism marketing organizations. Organization can make the passengers have an opportunity to experience the country promotion materials of flight attendants’ home country via in-flight service just before arriving the flight attendants’ home country. Second, the results for SQ show some information regarding more important dimensions of SQ when foreign flight attendants offer a service to passengers. The most important SQ dimension for foreign passengers’ personal touch was empathy, which is related to individual attention and communication skill. As well, appearance was not found to be positively significant. Thus, when foreign flight attendants provide services to passengers, they try to focus on individual attention and communication through understanding passengers’ diverse culture, languages, personal needs, and so on.
7. Limitation and Recommendation for Further Research
Even though this study presents valuable theoretical and practical implications, some limitations must be addressed. First, the fact that the research was conducted in one place Incheon airport in Korea and 218 survey respondents were only one Korean nationality. Therefore, that can be regarded as a limitation in terms of generalizability of research results, so further research should include a more diverse range of nationalities. Second, this study investigated the impacts on only foreign flight attendants’ SQ, thus future research recommends investigating the flight attendants’ SQ of same country with passengers as well as foreign flight attendants’ SQ. And third, the result of the RMSEA was weak, because it can be not easy to find previous studies that deeply involved between personal touch and curiosity, thus future studies should focus on find out the correlation between personal touch and curiosity.
Author Contributions
Supervision and Research Design—S.S.H.; Writing, Data Collection, Data Analysis, Revision—M.Y.
Funding
This research received no external funding.
Conflicts of Interest
The authors declare no conflict of interest.
Appendix A

Table A1.
Measurement Items.
| Construct | Items |
|---|---|
| 1. Service Quality | |
| 1-1. Appearance: Tangibility (TA) | ▪ The foreign flight attendant being visually attractive. |
| 1-2. Reliability (RL) | ▪ The foreign flight attendant being handsome/pretty. |
| 1-3 Responsiveness (RP) | ▪ The foreign flight attendant being well dressed and having neat appearance. ▪ The foreign flight attendant provides services at the promised time. |
| 1-4. Assurance (AS) | ▪ When passengers have problems, the foreign flight attendant is able to solve problems and cooperate. ▪ Wide range of products and services provided. ▪ The foreign flight attendant is always willing to help. ▪ The foreign flight attendant provides prompt service to passengers. ▪ The foreign flight attendant checks with passengers from time to time if they need anything. |
| 1-5. Empathy (EM) | ▪ The foreign flight attendant is consistently courteous toward passengers. ▪ The foreign flight attendant doing his/her job with a smile. ▪ The foreign flight attendant appears to know what they are doing. ▪ The foreign flight attendant pays attention to what passengers say. ▪ The foreign flight attendant explains the service itself clearly. ▪ The foreign flight attendant understands what the specific needs of his/her passengers are. |
| 2. Personal touch | ▪ I am satisfied with services provided by this airline. ▪ I receive good value for money. ▪ Other things being the same, I would prefer to fly this airline. ▪ I enjoy exploring the foreign flight attendant’s home country. ▪ I find it fascinating to learn about the foreign flight attendant’s home country. ▪ I enjoy learning about issues in the foreign flight attendant’s home country that are unfamiliar to me. |
| 3. Curiosity | ▪ The people in the foreign flight attendant’s home country are well-educated. ▪ The people in the foreign flight attendant’s home country are hard-working. ▪ The people in the foreign flight attendant’s home country are friendly and likable. |
| 4. Country image(CI) | ▪ The foreign flight attendant’s home country actively participates in world affairs. ▪ The foreign flight attendant’s home country is an economically advanced country. ▪ The foreign flight attendant’s home country emphasizes technical/vocational training. |
| 5. Behavioral intention (BI) | ▪ I would choose to travel to the foreign flight attendant’s home country if I am going to travel another time. ▪ I would visit the foreign flight attendant’s home country again. |
References
- Jahmani, A. The effect of Royal Jordanian Airline service quality on passengers’ satisfaction. Int. J. Bus. Soc. 2017, 18, 519–530. [Google Scholar]
- The International Air Transport Association. Available online: https://www.iata.org/Pages/default.aspx (accessed on 25 July 2019).
- Kim, Y.K.; Lee, H.R. Customer satisfaction using low cost carriers. Tour. Manag. 2011, 32, 235–243. [Google Scholar] [CrossRef]
- Chen, F.-Y.; Chang, Y.-H. Examining airline service quality from a process perspective. J. Air Transp. Manag. 2005, 11, 79–87. [Google Scholar] [CrossRef]
- Gursoy, D.; Chen, M.-H.; Kim, H.J. The US airlines relative positioning based on attributes of service quality. Tour. Manag. 2005, 26, 57–67. [Google Scholar] [CrossRef]
- Leong, L.-Y.; Hew, T.-S.; Lee, V.-H.; Ooi, K.-B. An SEM–artificial-neural-network analysis of the relationships between SERVPERF, customer satisfaction and loyalty among low-cost and full-service airline. Expert Syst. Appl. 2015, 42, 6620–6634. [Google Scholar] [CrossRef]
- Taura, T.; Yoshikawa, H. Managing Function Concepts in the Design Process. In Management of Design; Springer Science and Business Media LLC: New York, NY, USA, 1994; pp. 179–203. [Google Scholar]
- Soteriou, A.C.; Chase, R.B. Linking the customer contact model to service quality. J. Oper. Manag. 1998, 16, 495–508. [Google Scholar] [CrossRef]
- Whyte, W.F. When workers and customers meet. Ind. Soc. 1946, 1946, 123–147. [Google Scholar] [CrossRef]
- Chase, R.B. Where does the customer fit in a service operation? Harv. Bus. Rev. 1978, 56, 137–142. [Google Scholar] [CrossRef]
- Chase, R.B. The Customer Contact Approach to Services: Theoretical Bases and Practical Extensions. Oper. Res. 1981, 29, 698–706. [Google Scholar] [CrossRef]
- Parasuraman, A.; Zeithaml, V.A.; Berry, L.L. A Conceptual Model of Service Quality and Its Implications for Future Research. J. Mark. 1985, 49, 41–50. [Google Scholar] [CrossRef]
- Kellogg, D.L.; Chase, R.B. Constructing an Empirically Derived Measure for Customer Contact. Manag. Sci. 1995, 41, 1734–1749. [Google Scholar] [CrossRef]
- Harvey, J. Service quality: A tutorial. J. Oper. Manag. 1998, 16, 583–597. [Google Scholar] [CrossRef]
- Prajogo, D. The implementation of operations management techniques in service organisations: An Australian perspective. Int. J. Oper. Prod. Manag. 2006, 26, 1374–1390. [Google Scholar] [CrossRef]
- Zeithaml, V.A.; Parasuraman, A.; Berry, L.L. Problems and Strategies in Services Marketing. J. Mark. 1985, 49, 33. [Google Scholar] [CrossRef]
- Parasuraman, A.; Zeithaml, V.A.; Berry, L.L. Servqual: A multiple-item scale for measuring consumer perc. J. Retail. 1988, 64, 12. [Google Scholar]
- Gourdin, K.N. Bringing quality back to commercial air travel. Transp. J. 1988, 27, 23–29. [Google Scholar]
- Fick, G.R.; Ritchie, J.B. Measuring Service Quality in the Travel and Tourism Industry. J. Travel Res. 1991, 30, 2–9. [Google Scholar] [CrossRef]
- Oh, J.-G. Global strategic alliances in the telecommunications industry. Telecommun. Policy 1996, 20, 713–720. [Google Scholar] [CrossRef]
- Kettinger, W.J.; Lee, C.C.; Lee, S. Global Measures of Information Service Quality: A Cross-National Study. Decis. Sci. 1995, 26, 569–588. [Google Scholar] [CrossRef]
- Newman, K. Interrogating SERVQUAL: A critical assessment of service quality measurement in a high street retail bank. Int. J. Bank Mark. 2001, 19, 126–139. [Google Scholar] [CrossRef]
- Kilbourne, W.E.; Duffy, J.A.; Duffy, M.; Giarchi, G. The applicability of SERVQUAL in cross-national measurements of health-care quality. J. Serv. Mark. 2004, 18, 524–533. [Google Scholar] [CrossRef]
- Devi Juwaheer, T. Exploring international tourists’ perceptions of hotel operations by using a modified SERVQUAL approach–a case study of Mauritius. Manag. Serv. Qual. Int. J. 2004, 14, 350–364. [Google Scholar] [CrossRef]
- Wisniewski, M. Using SERVQUAL to assess customer satisfaction with public sector services. Manag. Serv. Qual. Int. J. 2001, 11, 380–388. [Google Scholar] [CrossRef]
- Cabello, E.; Chirinos, J.L. Validación y aplicabilidad de encuestas SERVQUAL modificadas para medir la satisfacción de usuarios externos en servicios de salud. Rev. Med. Hered. 2012, 23, 88. [Google Scholar] [CrossRef]
- Al-Ibrahim, A. Quality Management and Its Role in Improving Service Quality in Public Sector. J. Bus. Manag. Sci. 2014, 2, 123–147. [Google Scholar] [CrossRef] [Green Version]
- Cronin, J.J.; Taylor, S.A. Measuring Service Quality: A Reexamination and Extension. J. Mark. 1992, 56, 55. [Google Scholar] [CrossRef]
- Cronin, J.J.; Taylor, S.A.; Taylor, J.A. SERVPERF versus SERVQUAL: Reconciling Performance-Based and Perceptions-Minus-Expectations Measurement of Service Quality. J. Mark. 1994, 58, 125. [Google Scholar] [CrossRef]
- Salomi, G.G.E.; Miguel, P.A.C.; Abackerli, A.J. SERVQUAL x SERVPERF: Comparação entre instrumentos para avaliação da qualidade de serviços internos. Gestão Produção 2005, 12, 279–293. [Google Scholar] [CrossRef]
- Fragoso, J.T.; Espinoza, I.L. Evaluación de la percepción de la calidad de los servicios bancarios mediante el modelo SERVPERF. Contaduría Y Adm. 2017, 62, 1270–1293. [Google Scholar] [CrossRef]
- Lovelock, C.; Gummesson, E. Whither services marketing? In search of a new paradigm and fresh perspectives. J. Serv. Res. 2004, 7, 20–41. [Google Scholar] [CrossRef]
- Zeithaml, V.A.; Bitner, M.J.; Dremler, D. Services Marketing; International edition; McGraw Hill: New York, NY, USA; London, UK, 1996. [Google Scholar]
- Yunus, N. Service Quality towards Customer Loyalty in Malaysia’s Domestic Low Cost Airline Services. Int. J. E-Educ. E-Bus. E-Manag. E-Learn. 2013, 3, 333. [Google Scholar] [CrossRef]
- Amiri Aghdaie, S.F.; Faghani, F. Mobile banking service quality and customer satisfaction (application of SERVQUAL model). Int. J. Manag. Bus. Res. 2012, 2, 351–361. [Google Scholar]
- Dabholkar, P.A.; Thorpe, D.I.; Rentz, J.O. A measure of service quality for retail stores: Scale development and validation. J. Acad. Mark. Sci. 1996, 24, 3–16. [Google Scholar] [CrossRef]
- Tunc, E.A.; Gupta, J.N. Is Time a Competitive Weapon among Manufacturing Firms? Int. J. Oper. Prod. Manag. 1993, 13, 4–12. [Google Scholar] [CrossRef]
- Upton, D.M. Flexibility as process mobility: The management of plant capabilities for quick response manufacturing. J. Oper. Manag. 1995, 12, 205–224. [Google Scholar] [CrossRef]
- Babbar, S.; Koufteros, X. The human element in airline service quality: Contact personnel and the customer. Int. J. Oper. Prod. Manag. 2008, 28, 804–830. [Google Scholar] [CrossRef]
- Anderson, E.W.; Fornell, C.; Lehmann, D.R. Customer Satisfaction, Market Share, and Profitability: Findings from Sweden. J. Mark. 1994, 58, 53. [Google Scholar] [CrossRef]
- McDougall, G.H.; Levesque, T. Customer satisfaction with services: Putting perceived value into the equation. J. Serv. Mark. 2000, 14, 392–410. [Google Scholar] [CrossRef]
- Grönroos, C. Service management and marketing: Managing the moments of truth in service competition. Jossey-Bass 1990. [Google Scholar] [CrossRef]
- Peters, T.J.; Austin, N. A passion for excellence. Lead. Differ. 1985. [Google Scholar] [CrossRef]
- Collier, D.A. The Service/Quality Solution: Using Service Management to Gain Competitive Advantage; Irwin Professional Publishing: Burr Ridge, IL, USA, 1994. [Google Scholar]
- Kashdan, T.B.; Silvia, P.J. Curiosity and Interest: The Benefits of Thriving on Novelty and Challenge. Oxf. Handb. Posit. Psychol. 2009, 2, 366–374. [Google Scholar] [CrossRef]
- Collins, R.P.; A Litman, J.; Spielberger, C.D. The measurement of perceptual curiosity. Pers. Individ. Differ. 2004, 36, 1127–1141. [Google Scholar] [CrossRef]
- Renner, B. Curiosity About People: The Development of a Social Curiosity Measure in Adults. J. Pers. Assess. 2006, 87, 305–316. [Google Scholar] [CrossRef] [PubMed] [Green Version]
- Litman, J.A.; Pezzo, M.V. Dimensionality of interpersonal curiosity. Pers. Individ. Differ. 2007, 43, 1448–1459. [Google Scholar] [CrossRef]
- Tangney, J.P.; Baumeister, R.F.; Boone, A.L. High Self-Control Predicts Good Adjustment, Less Pathology, Better Grades, and Interpersonal Success. J. Pers. 2004, 72, 271–324. [Google Scholar] [CrossRef]
- Speece, M.; Nguyen, D.P. Countering negative country-of-origin with low prices: A conjoint study in Vietnam. J. Prod. Brand Manag. 2005, 14, 39–48. [Google Scholar] [CrossRef]
- Dagger, T.S.; Raciti, M.M. Matching consumers’ country and product image perceptions: An Australian perspective. J. Consum. Mark. 2011, 28, 200–210. [Google Scholar] [CrossRef]
- Martin, I.M.; Eroglu, S. Measuring a multi-dimensional construct: Country image. J. Bus. Res. 1993, 28, 191–210. [Google Scholar] [CrossRef]
- Buhmann, A.; Ingenhoff, D. The 4D Model of the country image: An integrative approach from the perspective of communication management. Int. Commun. Gaz. 2015, 77, 102–124. [Google Scholar] [CrossRef]
- Schatz, E.; Levine, R. Framing, Public Diplomacy, and Anti-Americanism in Central Asia. Int. Stud. Q. 2010, 54, 855–869. [Google Scholar] [CrossRef]
- Katz, D.; Braly, K. Racial stereotypes of one hundred college students. J. Abnorm. Soc. Psychol. 1933, 28, 280–290. [Google Scholar] [CrossRef]
- Klingberg, F.L. Studies in measurement of the relations among sovereign states. Psychometrika 1941, 6, 335–352. [Google Scholar] [CrossRef]
- Zhang, J.; Wu, B.; Morrison, A.M.; Tseng, C.; Chen, Y.C. How country image affects tourists’ destination evaluations: A moderated mediation approach. J. Hosp. Tour. Res. 2018, 42, 904–930. [Google Scholar] [CrossRef]
- Gertner, D.; Kotler, P. How can a place correct a negative image? Place Brand. 2004, 1, 50–57. [Google Scholar] [CrossRef]
- Lee, R.; Lockshin, L. Reverse country-of-origin effects of product perceptions on destination image. J. Travel Res. 2012, 51, 502–511. [Google Scholar] [CrossRef]
- Papadopoulos, N.; Heslop, L.A. Product-country images: Impact and role in international marketing. Routledge 2014. [Google Scholar] [CrossRef]
- Mossberg, L.; Kleppe, I.A. Country and destination image – different or similar image concepts? Serv. Ind. J. 2005, 25, 493–503. [Google Scholar] [CrossRef]
- Chaulagain, S.; Wiitala, J.; Fu, X. The impact of country image and destination image on US tourists’ travel intention. J. Destin. Mark. Manag. 2019, 12, 1–11. [Google Scholar] [CrossRef]
- Martínez, S.C.; Alvarez, M.D. Country Versus Destination Image in a Developing Country. J. Travel Tour. Mark. 2010, 27, 748–764. [Google Scholar] [CrossRef]
- Ajzen, I.; Fishbein, M. Understanding Attitudes and Predicting Social Behaviour; Pearson: Englewood Cliffs, NJ, USA, 1980. [Google Scholar]
- Oliver, R. Customer delight: Foundations, findings, and managerial insight. J. Retail. 1997, 73, 311–336. [Google Scholar] [CrossRef]
- Baker, D.A.; Crompton, J.L. Quality, satisfaction and behavioral intentions. Ann. Tour. Res. 2000, 27, 785–804. [Google Scholar] [CrossRef]
- Zeithaml, V.A.; Berry, L.L.; Parasuraman, A. The Behavioral Consequences of Service Quality. J. Mark. 1996, 60, 31–46. [Google Scholar] [CrossRef]
- Kumar, S.A.; Mani, B.; Mahalingam, S.; Vanjikovan, M. Influence of Service Quality on Attitudinal Loyalty in Private Retail Banking: An Empirical Study. IUP J. Manag. Res. 2010, 9, 21–38. [Google Scholar]
- Parasuraman, A.; Berry, L.L.; Zeithaml, V.A. Refinement and reassessment of the SERVQUAL scale. J. Retail. 1991, 67, 420. [Google Scholar]
- Olorunniwo, F.; Hsu, M.K.; Udo, G.J. Service quality, customer satisfaction, and behavioral intentions in the service factory. J. Serv. Mark. 2006, 20, 59–72. [Google Scholar] [CrossRef]
- Jani, D.; Hwang, Y.-H. Influence of deprivation and interest curiosity on tourists’ Internet search behaviour. Anatolia 2016, 27, 493–504. [Google Scholar] [CrossRef]
- Parameswaran, R.; Yaprak, A. A Cross-National Comparison of Consumer Research Measures. J. Int. Bus. Stud. 1987, 18, 35–49. [Google Scholar] [CrossRef]
- Lee, D.; Ganesh, G. Effects of partitioned country image in the context of brand image and familiarity: A categorization theory perspective. Int. Mark. Rev. 1999, 16, 18–41. [Google Scholar] [CrossRef]
- Ryu, K.; Lee, H.; Kim, W.G. The influence of the quality of the physical environment, food, and service on restaurant image, customer perceived value, customer satisfaction, and behavioral intentions. Int. J. Contemp. Hosp. Manag. 2012, 24, 200–223. [Google Scholar] [CrossRef]
Figure 1.
The proposed model.

Figure 2.
Path analysis model; * p < 0.05, ** p < 0.01, *** p < 0.001. Goodness-of-fit index: χ2 = 75.824, df = 6, p < 0.001, TLI = 0.79, RMSEA = 0.232, CFI = 0.87.
Figure 2.
Path analysis model; * p < 0.05, ** p < 0.01, *** p < 0.001. Goodness-of-fit index: χ2 = 75.824, df = 6, p < 0.001, TLI = 0.79, RMSEA = 0.232, CFI = 0.87.

Table 1.
Demographic Characteristics (N = 218).
| Variable | Frequency | % | |
|---|---|---|---|
| Gender | Male | 110 | 48.4 |
| Female | 105 | 50.7 | |
| Age | 10–19 | 13 | 6.0 |
| 20–29 | 65 | 30.0 | |
| 30–39 | 57 | 26.3 | |
| 40–49 | 26 | 12.0 | |
| 50–59 | 35 | 16.1 | |
| 60–69 | 11 | 5.1 | |
| Marriage status | Marriage | 97 | 44.7 |
| Single | 118 | 54.4 | |
| Education | High school graduate | 49 | 22.6 |
| College graduate | 62 | 28.6 | |
| University graduate | 84 | 38.7 | |
| Graduate school graduate | 18 | 8.3 | |
| Occupation | Company employee | 72 | 33.2 |
| Businessman | 17 | 7.8 | |
| Sales/service person | 17 | 7.8 | |
| Student | 49 | 22.6 | |
| Housewife | 21 | 9.7 | |
| unemployed | 9 | 4.1 | |
| Retired | 5 | 2.3 | |
| Other | 22 | 10.1 | |
| Household Income | under $30,000 | 60 | 27.6 |
| $30,000–$50,000 | 47 | 21.7 | |
| $50,000–$70,000 | 43 | 19.8 | |
| $70,000–$90,000 | 26 | 12.0 | |
| $90,000 and over | 26 | 12.0 | |
| Travel purpose | Tourism | 123 | 56.7 |
| Official business | 51 | 23.5 | |
| Visiting friends/Relatives | 32 | 14.7 | |
| The others | 8 | 3.7 | |
| Number of overseas trips | Once a year | 95 | 43.8 |
| 2–3 times a year | 66 | 30.4 | |
| 4–5 times a year | 22 | 10.1 | |
| More than 6 times a year | 30 | 13.8 | |
Table 2.
Multilinear regression of SQ on personal touch.
| Unstandardized Coefficients | Standardized Coefficients | t | ||
|---|---|---|---|---|
| B | Std. Err | Beta | ||
| (constant) | −0.34 | 0.276 | −1.231 | |
| appearance | −0.014 | 0.058 | −0.012 | −0.234 |
| responsiveness | 0.175 | 0.084 | 0.128 | 2.085 * |
| assurance | 0.342 | 0.083 | 0.314 | 4.133 *** |
| empathy | 0.55 | 0.078 | 0.455 | 7.022 *** |
| R = 0.820, R2 = 0.672, F = 108.475 *** | ||||
Dependent variable: Personal touch; * p < 0.05, *** p < 0.001.
Table 3.
Simple regression of personal touch on curiosity.
| Unstandardized Coefficients | Standardized Coefficients | t | ||
|---|---|---|---|---|
| B | Std. Err | Beta | ||
| (constant) | 1.626 | 0.307 | 5.296 *** | |
| Personal touch | 0.542 | 0.062 | 0.512 | 8.732 *** |
| R = 0.512, R2 = 0.262; F = 76.243 *** | ||||
Dependent variable: Curiosity; *** p < 0.001.
Table 4.
Simple regression of curiosity on CI.
| Unstandardized Coefficients | Standardized Coefficients | t | ||
|---|---|---|---|---|
| B | Std. Err | Beta | ||
| (constant) | 2.535 | 0.181 | 13.981 *** | |
| Curiosity | 0.460 | 0.041 | 0.609 | 11.263 *** |
| R = 0.609, R2 = 0.371; F = 126.851 *** | ||||
Dependent variable: Country Image; *** p < 0.001.
Table 5.
Simple regression of CI on BI.
| Unstandardized Coefficients | Standardized Coefficients | t | ||
|---|---|---|---|---|
| B | Std. Err | Beta | ||
| (constant) | 1.770 | 0.272 | 6.510 *** | |
| Country Image | 0.712 | 0.059 | 0.635 | 12.039 *** |
| R = 0.635, R2 = 0.403, F = 144.945 *** | ||||
Dependent variable: Behavioral intention; *** p < 0.001.
Table 6.
Results of standardized path analysis (n = 218).
| Hypotheses | Paths | Estimate | CR |
|---|---|---|---|
| Hypothesis 1 | Service quality➔Personal touch | 0.777 *** | 18.127 |
| Hypothesis 2 | Personal touch➔Curiosity | 0.512 *** | 8.752 |
| Hypothesis 3 | Curiosity➔Country image | 0.609 *** | 7.896 |
| Hypothesis 4 | Country image➔Behavioral intention | 0.635 *** | 11.891 |
* p < 0.05, ** p < 0.01, *** p < 0.001; Goodness-of-fit index: χ2 = 75.824, df = 6, p < 0.001, TLI = 0.79, RMSEA = 0.232, CFI = 0.87.
© 2019 by the authors. Licensee MDPI, Basel, Switzerland. This article is an open access article distributed under the terms and conditions of the Creative Commons Attribution (CC BY) license (http://creativecommons.org/licenses/by/4.0/).
Share and Cite
MDPI and ACS Style
Yu, M.; Hyun, S.S. The Impact of Foreign Flight Attendants’ Service Quality on Behavioral Intention Toward Their Home Country—Applied SERVPERF Model. Sustainability 2019, 11, 4136. https://0-doi-org.brum.beds.ac.uk/10.3390/su11154136
AMA Style
Yu M, Hyun SS. The Impact of Foreign Flight Attendants’ Service Quality on Behavioral Intention Toward Their Home Country—Applied SERVPERF Model. Sustainability. 2019; 11(15):4136. https://0-doi-org.brum.beds.ac.uk/10.3390/su11154136
Chicago/Turabian StyleYu, Myoungjin, and Sunghyup Sean Hyun. 2019. "The Impact of Foreign Flight Attendants’ Service Quality on Behavioral Intention Toward Their Home Country—Applied SERVPERF Model" Sustainability 11, no. 15: 4136. https://0-doi-org.brum.beds.ac.uk/10.3390/su11154136
Note that from the first issue of 2016, this journal uses article numbers instead of page numbers. See further details here.