Is Smart Housing a Good Deal? An Answer Based on Monte Carlo Net Present Value Analysis


1
Housing and Building National Research Center, Architecture and Housing Research Institute, Cairo 11511, Egypt
2
School of Land Planning and Regional Development, Planning and Development Research Center, Leadership Teaching Chair in Economic Regional Development, Laval University, Quebec, QC G1V 0A6, Canada
*
Author to whom correspondence should be addressed.
Sustainability 2019, 11(15), 4193; https://0-doi-org.brum.beds.ac.uk/10.3390/su11154193
Submission received: 28 June 2019
/
Revised: 27 July 2019
/
Accepted: 29 July 2019
/
Published: 2 August 2019
(This article belongs to the Collection Sustainable Smart Cities and Villages)
Abstract
:The smart cities are considered to be an engine of economic and social growth. Most countries started to convert their existing cities into smart cities or construct new smart cities in order to improve the quality of life of their inhabitants. However, the problem that facing those countries while applying the concept of smart cities is the costs, especially for the residential sector. Despite the high initial and even operation costs for adopting different technologies in smart housing; the benefits could exceed those costs within the lifespan of the project. This article is shedding the light on the economics of smart housing. This study aims to evaluate the net present value (NPV) of a smart economic housing model to check the viability and feasibility of such projects. The calculation of the NPV based on Monte Carlo simulation provides an interesting methodological framework to evaluate the robustness of the results as well as providing a simple way to test for statistical significance of the results. This analysis helps to evaluate the potential profitability of smart housing solutions. The research ends up by proving the feasibility of this type of project.
1. Introduction
Smart city is a powerful concept that has recently captured the attention of decision makers all over the world. The smart city aims to optimize the infrastructure and buildings management while using the Information and Communication Technologies (ICT) in order to improve urban life; boost economic competitiveness; enhance the efficiency of urban and architecture systems; reduce the environmental pollution; and, limit the growth in energy demand [1,2]. The smart city covers diverse aspects of demand for day-to-day life such as the energy, water, health, waste, mobility, buildings, and so on. Many countries have tried to reform their strategies and policies to control the energy demand in the aim of reducing the ecological footprint of the cities since residential sector consumes a significant fraction of the world’s energy supply [3].
The European Union aims to replace at least 80% of electricity meters with smart meters by 2020. According to the European Commission’s 2014 report on smart metering, it is expected that almost 72% of European consumers will have a smart meter for electricity and about 40% will have one for gas [4]. In United States (U.S.), the electric utilities started to deploy smart meters to their residential customers, in 2011, and they aim to deploy smart meters for almost all U.S. at the end of this decade [5].
The global management of resources should not be limited to energy. The scarcity of water that facing many countries become the key mechanism for promoting the efficient water allocation and use [6]. Accordingly, the construction of smart housing become a necessity for many countries.
Nagar et al. (2016) defines the smart home as one that utilizes a combination of appliance-level energy meters, context sensing equipment, automated relays, and user interfaces for detecting and curtailing energy and resources waste [3]. Bin Karnain & Bin Zakaria (2015) argue that the smart home is a concept where devices and systems can communicate with each other and be automatically controlled in order to interact with the household members and improve the quality of their life [7]. For Aljer et al. (2017), a smart home that uses an innovative system to monitor the home with the objective to understand the indoor condition, equipment functioning, and tenants’ behavior in order to establish a based- knowledge strategy improve the housing efficiency and quality [8]. Thus, smart housing consists of four main components; smart meters; sensors or monitoring systems; automatic control system; user interface; and, communication network to connect the devices with each other. Of course, these technologies have a cost. Smart housing can be very expensive, with many sensors; monitoring systems; various meters type; and, sophisticated analytical algorithms. However, the management of energy and resources also have their benefits.
Actually, many studies discuss the difference between the price of standard technologies versus smart technologies in a smart housing. The study [9] compares the cost of on-grid conventional systems, which most likely derive their energy through non-renewable sources, to the cost of installation of a solar system for residential setups under a 1 kW–15 kW range. The study shows that the solar system price is higher than the conventional system by approximately 96%, whereas the cost of installation of on-grid system is 1300 US$, while the cost of installation of a solar system is 37,000 US$. On the other hand, for smart meters, department for business, energy and industrial strategy (2016) states that the cost of installation of traditional electricity/gas meters (credit meter) is £52 and pre-payment meter (PPM meter) is £57, while the cost of installation of electricity/gas AMI (smart meter) is £67, 22% higher than the traditional one [10]. Besides, March et al. (2017) mention in their study that the cost of conventional water meter is cheaper that the smart water meter of about 70%; whereas, the cost of conventional water meter is 25 euros, while these of smart meter is 80 euros [1]. The question is whether the benefits are higher than the costs, i.e., is the financial viability of smart housing worth the investment in technologies?
This paper aims at offering answers to this question. The study uses the economic analysis to investigate the net benefits of a smart housing project from the point of view of government, utilities, and consumers. To do so, a complete literature review on the potential impact (costs and benefits) is first undergone to derive a full set of potential components that need to be integrated in a net present value analysis. The different studies also enable obtaining a full range of potential costs and benefits to investigate a robustness analysis based on a Monte Carlo experiment. The random selection of benefits and costs within the minimum and maximum values is identified and the random growth of the different components is used to obtain a distribution of the net present value calculated based on 1000 different simulations. The analysis is based on a smart housing model that consists of three main components; smart meters; user interface; and, communication network. The research also adds the distributed generation renewable resources as a fourth component for the smart housing model. The research ends up by proving that a smart housing project would realize a positive NPV by approximately 99% within a period of 25 years.
The paper is divided into six sections. The first one presents the definition of the smart housing to be analyzed through empirical analysis. It focuses on the different structures that compose the way smart housing is defined and what it includes. The second one proposes a complete literature review to investigate the different costs and benefits that are associated to the different components. The third section presents the methodology that is used to calculate the net present value based on a Monte Carlo simulation and the way that the data are translated into one single monetary unit. The fourth section presents the results, while the fifth section proposes a discussion of the results. A brief conclusion closes the paper.
2. Smart Housing Model
Smart housing model combines four main components distributed generation renewable resource; smart meters include electricity, gas, water; in-home-display with user interface; and, communication network (home area network), as follows. All of these components are quickly presented and discussed in the next sub-sections.
2.1. Distributed Solar Generation
So far, energy is centrally produced by big power plants, transmitted into cities, and then distributed among several consumers. However, with smart infrastructure, it is more than likely that this landscape will quickly change. There will be a shift from centralized to decentralized distribution and generation, whereas the houses, factories, and regions will be able to generate their own electricity and even feed the excess into the distribution grid. The electricity, in this case, travels much shorter distances to reach the final customers, thus incurring less transmission losses. These systems often use renewable energy generators that can be used in small scales, such as solar, wind, or biomass, as well as other conventional fuels that can be scaled down [2].
In our case, the focus is put on the adoption of rooftop distributed solar generation for residential systems. The study analyses both the off-grid solar systems and the on-grid and off-grid hybrid systems. In the hybrid systems the off-grid systems power the residential systems during peak hours of the day whereas the on-grid systems support the energy consumption during night and off-peak hours. Usually, the excessive electricity that is produced by hybrid systems is transmitted back to the grid for which the utility offers rebates on future electricity bills this concept is named “net metering” [9].
2.2. Electricity Smart Meter
Smart grid technology is being spread out around the world. European Commission considered smart grids as a key component towards a low-carbon energy strategy [11]. Smart Grid is an umbrella term to describe a number of technologies, such as advanced metering infrastructure (AMI) or the smart meters; the two-way communication; and the data analytics tools [12], this part focuses on the electricity AMI. The important aspect of the AMI is the provision of two-way digital communications between the utility and the household, which helps in the better participation in the demand response program; smart charging of plug-in electric vehicles (PEV); integration of distributed generation resources as mentioned above; as well as in operation and management of meter remotely [5,12].
2.3. Gas Smart Meter
The gas smart meter, or gas AMI, represents the next generation of meters. This technology, similar to the electricity smart meter, consists of three layers; the physical meters and associated devices, communications layer covering data transport and communications network management, and IT systems, which manage the data, applications, and services [13]. Accordingly, many studies argue that the gas smart meter would benefit from the communication infrastructure of electricity smart meter. They assume that the electricity smart meter will act as the utility communication-hub for the home; the gas meter will communicate with this communication-hub on the electricity meter; the electricity meter communication-hub will forward the gas data via the electricity smart metering wide area network (WAN) communications system to the electricity smart metering meter data management system (MDMS) at the required intervals; the electricity smart metering MDMS will, in turn, send the gas related data to the gas smart metering MDMS and then onwards to the customer information system (CIS) for validation and processing, in accordance with the required gas market processes. If an in-home display (IHD), as discussed later, is used then the electricity meter communication-hub will also forward the gas data to the IHD [10,13].
It is important to mention that there is another type of meter, the dual fuel electricity and gas meter, which could be deployed in the countries where the supplier of electricity and gas are the same, such as in Great Britain. However, this option should not be applicable in all countries. For this reason, this kind of technology will not be discussed in this study [14].
2.4. Water Smart Meter
“The urban water cycle has not been alien to the smart city revolution” stated March et al. (2017). They argue that water smart meter represents the central element in the digitalization of water networks. However, the water smart meter has not yet been widely deployed, unlike the electricity smart meter. On the one hand, there is still a lack of full understanding of the whole economic life cycle assessment of smart water metering schemes. On the other hand, there is an uncertainty regarding the costs and benefits of smart water meters, which causes that water companies continue to install traditional water meters [1,15]. Alike electricity and gas smart meters, smart water meter reads the customer water usage in real time (or very close to); transfer the data to the water utility and vice versa; and then, processing and analyzing this data [1,6]. By considering the electricity smart meter as a communication hub that can connect to other devices within the residential unit via Home Area Network (HAN), a water smart meter could be considered as a HAN device. Thus, there is an opportunity for the water industry to leverage off this investment and deliver benefits to urban water sector [6].
2.5. In-Home Display with User Interface
In-home displays (IHD); home energy management systems (HEMS); web portal; and, others are technologies that help customers to adjust their power demand by postponing some tasks that require large amounts of electric power in off-peak hours.
The study focuses on IHD, a technology that enables customers to see, in near real-time, what energy they are using, what water they are consuming, and how much they are costing. This will put them in control, avoiding wasting energy, water and money, and support a broader change in behavior in the use of energy and water. Usually, the customers interact with IHD through a simple user interface that helps them to easily understand the display modes [5,6,10,16].
2.6. Home Area Network (HAN)
A Home Area Network (HAN) is an electronic communication system. The HAN that was established by the smart electricity meter is based on ZigBee communications, which potentially allows connection to other ZigBee enabled devices, which include gas smart meter; water smart meter; IHD; communication hub; as well as any smart appliances (smart appliances can be remotely controlled by the consumer via the Home Area Network (HAN)) within the residential unit. Knowing that the electricity meter could act as a communication hub (communications hubs, that operate as a central point in a HAN, allow smart meters and in-home display to connect to each other across the Home Area Network. The Hub gathers metering data from multiple devices and send it to the utility via Wide Area Network (WAN)) in HAN [6,7,10,16].
3. Literature Review
3.1. Cost
The cost of smart housing components, as previously discussed, has been proposed in many studies. Apparently, the initial cost differs according to the hardware costs, the non-hardware costs (mainly labor during the installation stage) throughout different areas, as well as the type of information communication technology (ICT) used in the project (Table 1).
Distributed Solar Generation: obviously, the initial cost of installation for distributed solar generations has affected their adoption, especially in the housing sector. The cost of installing a solar system is dependent on the number of solar modules that is based on the power unit that is needed and the area of roof space available for installation. Hancevic et al. (2017) confirm that the cost of solar generations is declining because of many factors, such as lower module and inverter prices, optimized system configurations, increased competition, lower installer and developer overheads, and improved labor productivity [17].
Most likely, the solar modules and different power components, such as junction box, disconnect switch, wire management, service panels, and backup generators are the first most expensive components in solar systems, followed by the construction cost, Parmar (2016) argued. The study adds that the freight also adds up to a minute cost component in the installation of solar modules. The study also uses a small battery banks in his model to reduce the dependency on on-grid electricity and to accommodate energy use during night and off-peak hours. On the other hand, the hybrid system involves cost components from both on-grid conventional systems and off-grid solar systems [9].
Smart electricity meter: costs vary significantly across the studies, primarily due to differences in labor costs; choice of metering equipment; differences between AMI vendors; the quantity of AMI meters installed; cost of energy efficiency and demand response technologies; whether it has been previously invested in automatic meter reading (AMR); and, type of communications and IT technology, for example General Packet Radio Services (GPRS) and Universal Mobile Telecommunications System (UMTS) are much more costly than power line communication (PLC) technology. Many studies illustrate that the predominant cost driver is the meter, including installation costs followed by IT and communications technology then other auxiliary costs, which differ between case studies. It is important to mention that Faruqui et al. (2011) assumes that the prices will decline significantly as innovations occur, economies of scale take hold, and manufacturing costs decline [5,12,14,16].
Smart gas meter: as declared above, the smart gas meter communication infrastructure is a part of electricity smart meter communication infrastructure. Therefore, the communication infrastructure costs will not be doubled-counted for the gas meter. In this case, the costs include the purchasing and installation of gas smart meter and its equipment; the operation and maintenance; in addition to some incremental communication infrastructure costs for facilitating gas smart metering data transfers and to manage the huge increase in metering-data [13,18].
Smart water meter: the costs of smart water meter include the cost of equipment and installation, as well as the costs of operation and maintenance similar to gas smart meter.
3.2. Benefits
Many studies discuss the benefits of selected smart housing components, either the quantitative benefits that can be expressed by a monetary value or non-monetary benefits where the value could not be exactly determined or the both together. The next part tries to shed the light on some of those studies (Table 2).
3.2.1. Quantitative Benefits
Distributed Solar Generation: apparently, the benefits of distributed solar generation rely on the location of installed system; the weather; average solar peak hours; manpower cost; utility’s energy prices; and, government incentives [9]. From the literature review, it can be deduced that the potential benefits from solar systems adoption are summarized in terms of power savings and the reduction of household expenditure for energy; the electricity government subsidy savings; and, the reduction of carbon emission due to the use of renewable resources.
In the case where the household electricity consumption is heavily subsidized and it is assumed that the users will pay the actual cost of service and the government will remove the energy subsidization, the benefits for households, and the government will be considerably high.
Smart electricity meter: in fact, the benefits of a smart electricity meter deployment are not uniform across the studies and they are influenced by the conditions of each country. E.g. some countries suffer from energy theft, others suffer from the high levels of technical and commercial losses. The value of benefits of smart electricity meter differs from study to another according to the energy price; energy resources; whether there was a previous investment in automatic meter reading (AMR); the weather; the population density; the local labor costs; and, the operation and management of the meter [5,12,14,16].
Based on the literature review, this part tries to cluster the benefits of smart meter into six main groups. The first group is the site works savings and billing system, which includes reduction in cost and time taken for meter reading and billing; error-free bills; reduction in data entry cost; reduction in cost of remote connection and disconnection of meter; reduction in field and meter services, improvement in customer care services; reduction in operational and maintenance costs; and, reduction of uncollectible expense by remote disconnects all non-pay orders. The second is the real time energy auditing which helps to reduce the uncounted and theft energy; faster deduction of dead meters; reduce consumption of inactive meters. The third group is the reduction in energy losses and improvement in reliability, which includes the reduction in technical and commercial losses; improvement of voltage distribution system and reduction in transformer failure due to increase visibility of actual loads on real time basis; rapid outage detection and recovery; and. avoid distribution, transmission, generation capacity investments. The fourth group, is considered the key element of benefits, is the demand response and energy efficiency that represents the reduction in peak power purchase cost through engaging the customers in energy management by providing them with detailed, accurate, and timely information regarding their energy consumption and costs, these will lead to the reduction in electricity usage and load shifting; furthermore, enabling plug-in electric vehicle (PEV) by allowing the PEV owners to charge their vehicles at non-peak times when electricity rates are the cheapest. The fifth group is air pollution, whereas the reduction in energy production and the integration of cleaner distributed generation lead to the decreasing of CO2 emissions and air pollution. The last group is the avoidance in investing in standard meters; and old IT cost related to AMR that will be replaced by AMI. Actually, this last group is considered as a negative cost [5,12,14,16].
Smart gas meter: alike electricity smart meter, the smart gas meter would generate savings through the avoidance of certain activities, such as large reduction in meter-reading costs; site works savings that are related to meter-lock/unlock; reduction in meter exchanges cost regarding the switching between credit to pre-payment meter, which could occur remotely by just changing the smart meter mode; reductions in gas consumption and avoidance of debt by providing real-time information for the residential customers these lead to minimize the fuel-gas required to be compressed in the gas system and delay the investments in network reinforcement; reduction in CO2 emissions; reduction in customer services by enhancing the billing system and minimize customer complaints; eliminating theft of gas; providing savings, in the case of switching suppliers, as the suppliers will be able to take accurate readings on the day of the change; avoiding exchange costs, because there will not be a need to change or invest in conventional meter; in addition, there are some auxiliary benefits, such as the facilities needed, the employees safety, the human resources works that are related to field services that would be eliminated with the deployment of smart gas meter [10,13,18].
Smart water meter: the literature review demonstrates a difficult to identify all of the benefits of this technology and translate them into monetary terms. The monetary benefits discussed in this research are limited. The reduction in meter reading and site visits; reduction in labor costs; detection of water leakage; avoidance of replacement and investment of standard water meters; as well as avoidance of fraudulent readings, especially for low water flow [1,19]. Furthermore, the accurate readings of water consumption and the elimination of estimated bills will reduce customers complaints.
There are other benefits regarding the reduction of water usage and energy usage that are mentioned in the studies but without discussing the value of those benefits. Obviously, by implementing smart water meters the customer water usage reduces, which lead to the reduction in energy consumption used in the operation of water pumps; the reduction in the chemicals used to treat water; and, decreasing of water needs to be treated. In addition, the smart water systems have the ability to measure water quality parameters in real time. The smart water meter will also give the possibilities to segment users and develop new pricing schemes, which help to modulate peak water demands [1,19].
In-home display (IHD): as stated before, IHD is a technology that helps customers to control their energy and water consumption. A study made in Netherlands assume that by using IHD the electricity savings will reach 6.4% but without IHD is only 3.2%. The same case for the gas, the savings may reach 5.1% with IHD and 3.7% without IHD [10]. On the other hand, Commission for Energy Regulation (2011) argues that the savings in gas bill achieve 2.2% by customers who receive detailed informational and graphical analysis of their historical gas usage; and, the saving increased to 2.9% by using IHD that provide half-hourly feedback on costumer gas usage.
3.2.2. Non-Monetary Benefits
Many studies discuss the non-monetary benefits of distributed solar generation. Parmar (2016) states that the resale value of the house with solar generation system increases about 15–20%. On the other hand, Hancevic et al. (2017) argue that the domestic solar generation industry would generate new jobs opportunity and attract new investments for the industry sector.
However, the smart meters, either electricity, gas or water, have many non-monetary benefits, such as consumer satisfaction with their implementation; utilities responding to emergencies rapidly; creation of several jobs; reduction in air pollution; allowing the dynamic prices that reflect shifting supply conditions; promoting the competition within energy and water supply markets; eliminating the monthly visits for customer property, which leads to the increasing of privacy and security of customer; and, eliminating of estimated bills when the customers were absent. There is also a resiliency value for smart meters, in time of disasters the services could be remotely shut off. This will help to limit the amount of losses in infrastructure and minimize the possibility for fire incidence or home drowning. On the other hand, during the drought situations, the irrigation and landscaping water meters could be shut off. At the end, the non-monetary benefit that would represent an asset in the near future is “selling the data”. Smart meters will collect massive amounts of data. In addition to the benefits of collecting data to provide more reliable services, as mentioned above, it can be also sold for statistical purposes as well as for marketing issues as many companies would be interested to know customer’s habits in order to do customer profiling. Evidently, when considering that the data as commodity depends on the regulatory context, who will own the data is the customer or the utility for example. Additionally, regulatory issues also arise regarding data access, availability, transparency, and pricing. All of the aforementioned non-monetary benefits confirm the feasibility of deploying the AMI [1,2,5,10,13,16,18,19,22].
4. Methodology
4.1. Net Present Value: A Monte Carlo Simulation Approach
The individual profitability of a project is usually investigated through the calculation of the net present value (NPV) of its costs and benefits. The classic method consists of actualizing cost, , and benefits, , that is related to a given project over the life cycle of the project, . By calculating the cash flows over each time period, , the NPV reflects the global advantage of the project in the actual cash value (Equation (1)).
where stands for the nominal interest rate and stands for inflation rate.
Most of these analyses are based on single values of cost and benefits over time, i.e., and , which means that no robustness check can be made and the final analysis only rely on single values of both costs and benefits. One way to avoid such an assumption and fragility of the final results is to use Monte Carlo experiment, which allows for generating many values, for costs and benefits, as wishes [23]. Most of the empirical Monte Carlo experiment suggest that choosing 1000 different scenarios is large enough to ensure robustness. However, the analysis is usually limited to change (randomly) the growth rate of cash flows.
Here, we propose a more complete solution, where the costs and the benefits are simulated based on their maximum (; ) and minimum (; ) values deduced from the literature (appendices 1 and 2). For both components, the initial costs and benefits are calculated based on the maximum and minimum values that were obtained in the literature and on a random uniform coefficient to apply a simple mathematical transformation on the extreme values (Equations (2) and (3)).
where and represent a uniform random number choose for benefit () and cost () for the simulation for the initial period (). Thus, initial benefits and costs values are both selected within their minimum and maximum values for each simulation.
After having fixed the initial values for benefits and costs, the components that evolve over time (excluding the implementation costs) are assumed to change based on a random growth rates for both components: benefits and costs (operation and maintenance costs).
The benefit growth rate, , and the cost growth rate, , are simulated based on a normal random variable (divided by 100—Equations (4) and (5). Globally, approximately 99% of the simulated growth rates vary between ± 3%, with an equal probability of experiencing a positive or negative growth.
Thus, the cash flows for each period, , are necessarily different within each time periods and within each simulation, since the individual benefits and operation and maintenance costs components evolve over time and change within simulations.
The main advantage of this procedures is that it allows for retrieving a full distribution of each benefit and costs components, as well as providing a distribution for the NPV, allowing to check the number of simulations that return a positive value. Of course, the choice of a project can be based on different criteria’s, such as the recuperation time, the benefits/costs ratio, or the internal rate of return. However, the analysis put more focus on global profitability, while the benefits/costs ratio (BCR) is also reported to identify the relatively more profitable scenarios. From a pure economic consideration, the project with positive NPV is said to be interesting and valuable. Of course, a positive NPV does not mean that the project under consideration is necessarily the better alternative within the full set of possibilities. For this reason, the BCR is also reported identifying the project that returns the higher leverage effect (having the higher benefits compared to the investment). Thus, combining the two criteria may be helpful for decision makers.
4.2. Data
The data that were used in the Monte Carlo simulation are deduced from the literature (Table 3). It should be noted that the list of potential costs and benefits included in the analysis are those that have been related to existing studies since the values are based on an extensive literature review. The addition of any components can easily be incorporated in an extension of the study.
Obviously, the inferred data need to be harmonized in order to represent the same currency; years; and unit value (Appendix A, Table A1 and Table A2. The study uses the exchange rate at the time of the initial study to convert all of the components value in US$ [24]. Then calculates the present value (PV) for each component either for costs () or benefits () in 2019 (Equations (6) and (7)).
Whereas the real capitalization interest rate is equal to 3%; represents the year of simulation (2019); and, represents the year of the study .
5. Results
In the simulation, the study assumes the nominal interest rate ( equal to 10% and the inflation rate () equal to 3%. The net present value is calculated within a period () of 25 years. As shown in Table 4, the results of NPV for the six components of smart housing model are globally positive. The values of NPVs are not always positive, but the percentage of negative values is quite low, which suggests that the NPV is statistically significant (95% of the NPV are positive) (Figure 1).
For the distributed solar generation, the percentage of positive NPV of the solar system is higher than the hybrid system, which represents the most uncertain component, with 70.7% of the NPV returning a positive outcome. Secondly, for the three smart meters—electricity, gas, and water—the percentages of positive NPV are, respectively, 98.2%, 100%, and 84.5%. The in-home-display (IHD) NPV is shown to be always positive (Table 4).
On the other side, by examining the simulation outcomes regarding the benefits, it can be deduced that some benefits have strong influence than others (Figure 2 and Figure 3). For example, the savings that are offered by the application of distributed solar generation to the users and the government are extremely higher than the environmental benefit. By investigating the benefits of the three smart meters, it can be realized that there is a great commonality across their benefits ranking, the key drivers of benefits are almost the same. The reduction in meter readings expenses returns the highest benefits across all the meters, followed by the reduction in energy consumption and the avoidance of meter exchange. Actually, the reduction in water demand by using the smart meter is cited in many studies, but there is no consistency regarding the percentage or the monetary value, otherwise it can show a meaningful benefit value (Figure 4, Figure 5 and Figure 6). Besides, the value of the reduction in electrical energy demand is higher than the gas energy demand, when using IHD, as the electricity tariff is higher than the gas tariff (Figure 7). At the end, it is important to note that the mean value of the NPVs for all of the components are always positive as well as the benefits and costs ratio are always more than one (Table 4).
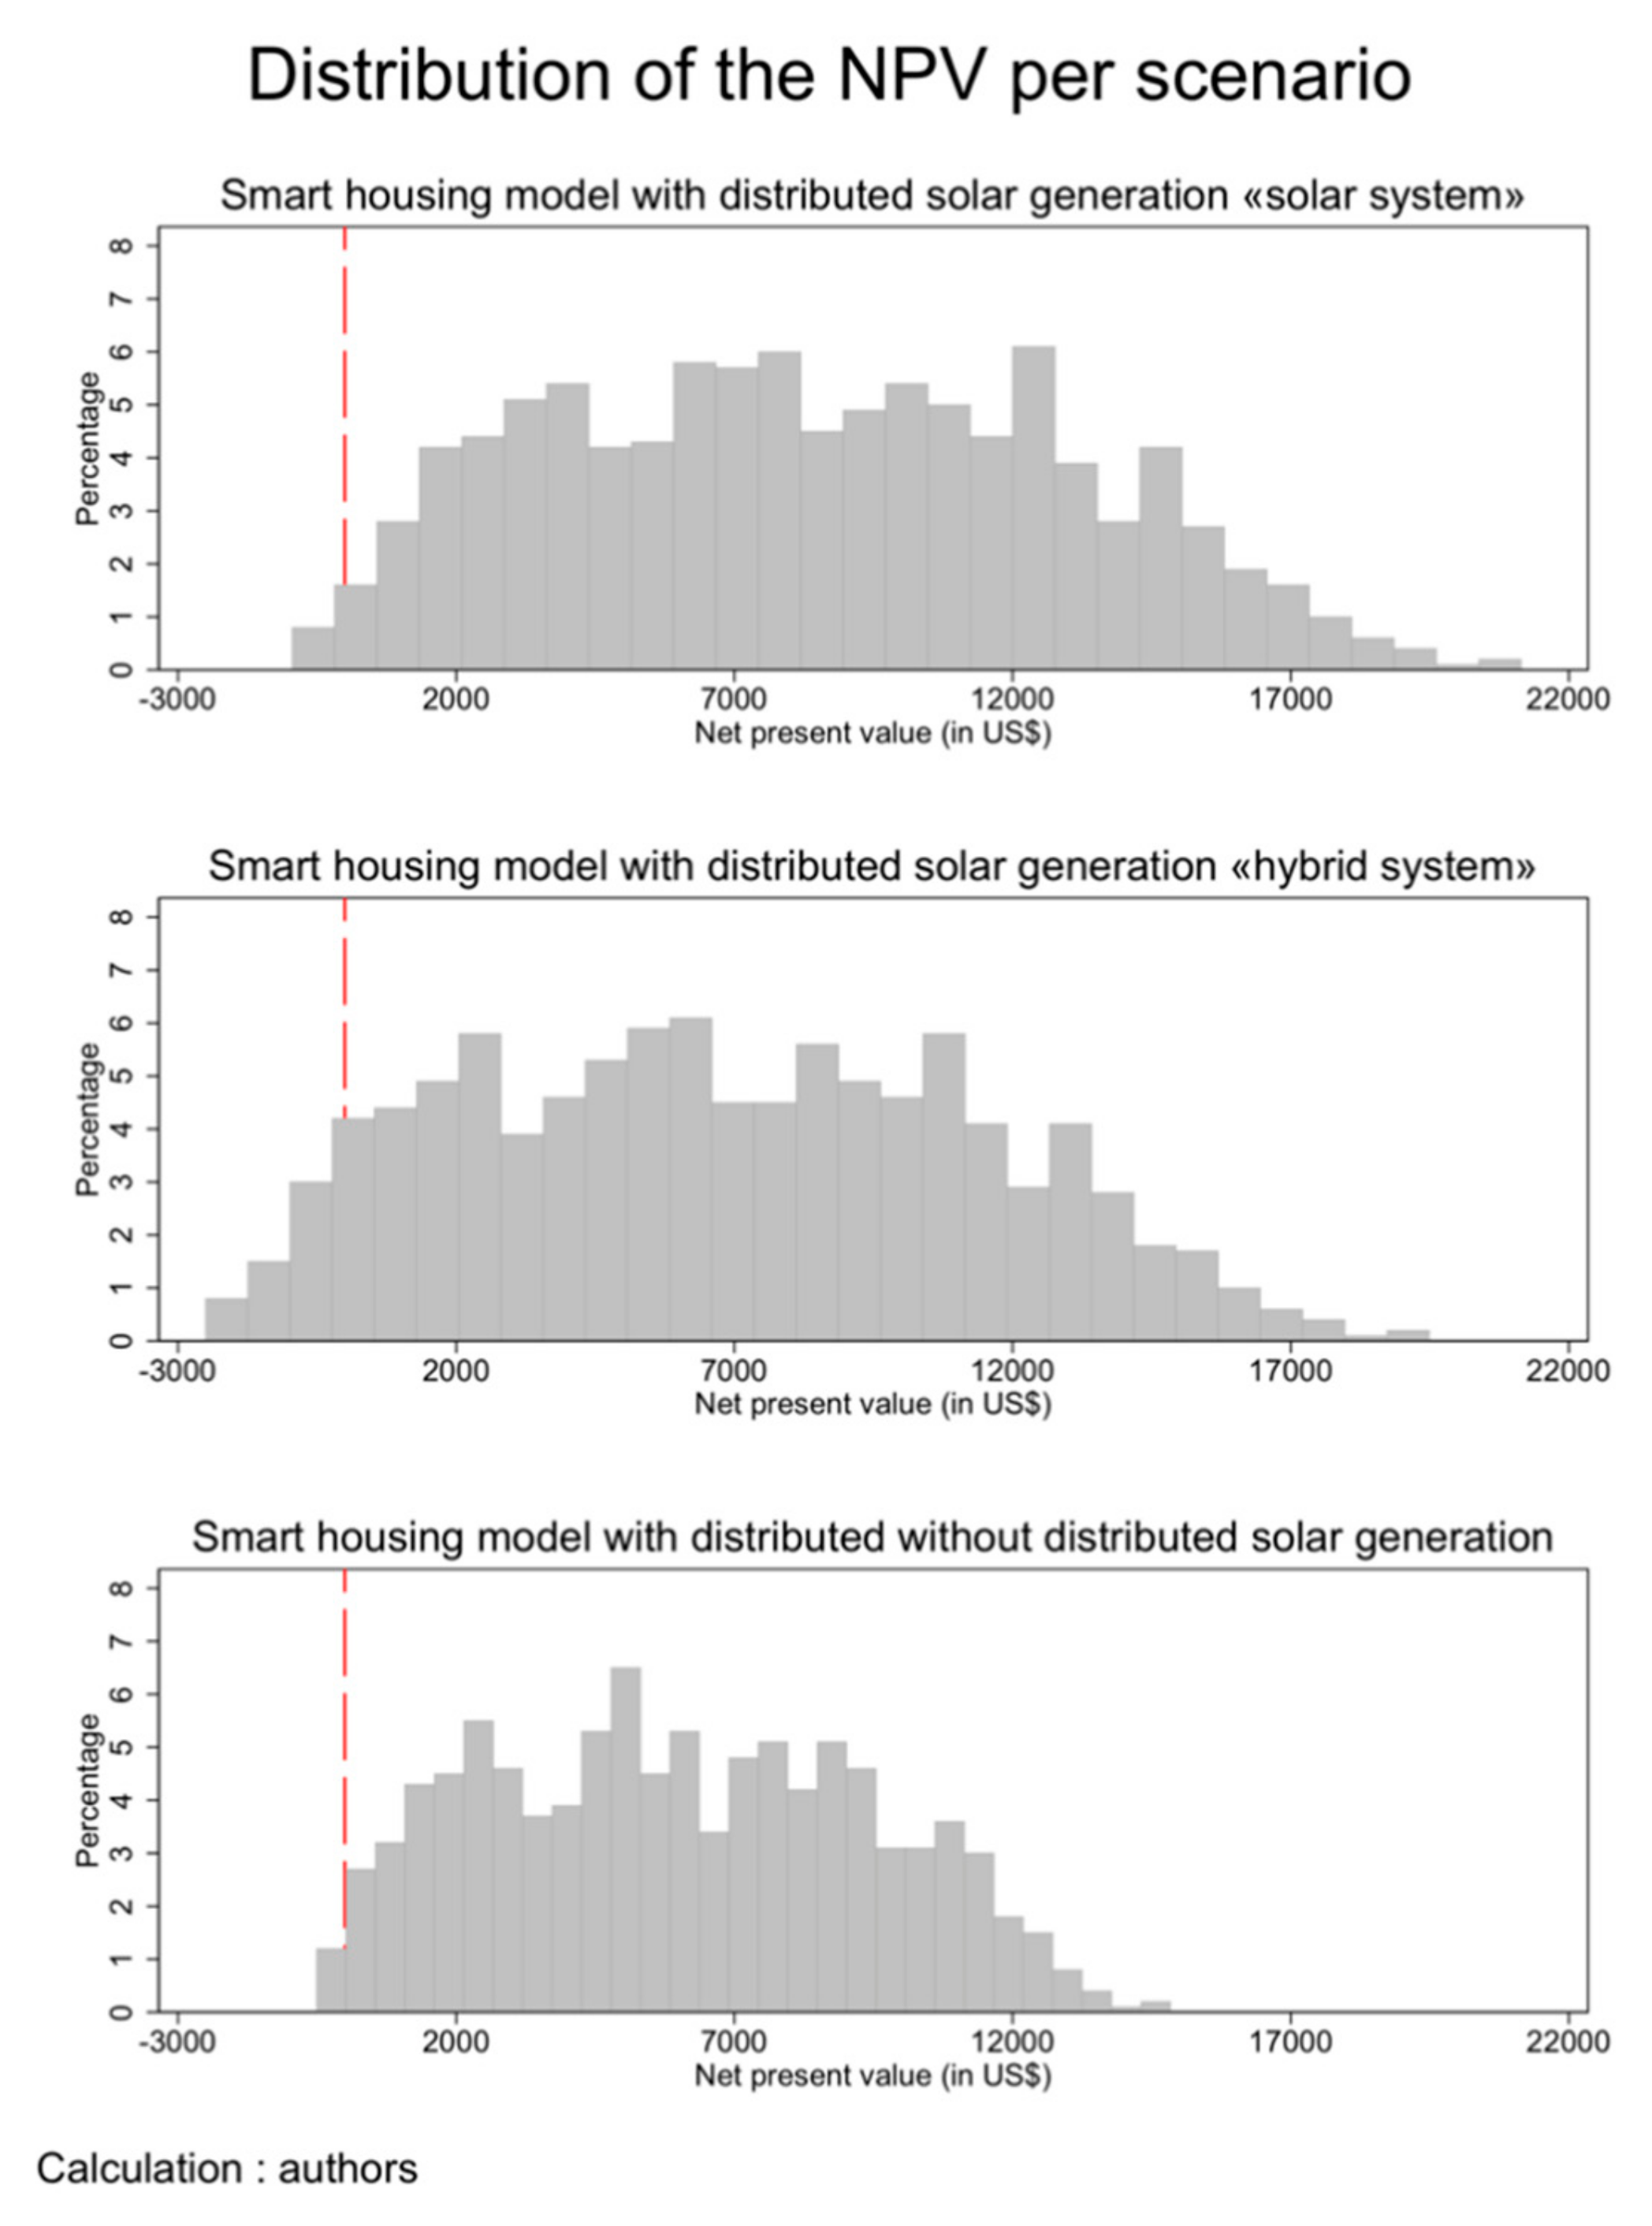
The study suggests three scenarios of simulation in order to determine the NPV of the smart housing model. The first scenario represents the sum of the NPVs of distributed solar generation (solar system), the three meters, and the IHD. The second scenario is for the sum of the NPVs of distributed solar generation (hybrid system), the three meters, and the IHD. The third scenario calculates the sum of the NPVs of the three meters and the IHD without distributed solar generation. By comparing the percentage of positive NPV of the three scenarios, it can be deduced that the highest value is for the first and the third scenario, 99% and 98.8%, respectively. Subsequently, the second scenario, the smart housing with the distributed solar generation (hybrid system), is the lowest one, with 93.7% of the values returning a positive outcome (Table 5, Figure 8). Additionally, the value of mean NPVs are positive for all the scenarios as well as the benefits and costs ratio is more than one, which signifies that investing in smart housing is financially viable.
6. Discussion
The results confirm that the rooftop distributed solar generation is one of the advantages of the smart housing, where the energy production shifts from centralization to decentralization. Although many studies argue that the initial cost of such technologies is declining, because of many factors, such as the increasing in economic competitiveness, the decreasing in manufacturing costs, the optimization in system configurations, the improving in labor productivity, in addition of other many factors; but, the initial cost still relatively high especially for the residential sector. This study compares the NPV for both the off-grid solar system as well as the on-grid and off-grid hybrid system. Indeed, the percentage of positive NPV for the solar system is higher than the hybrid system. The reasons are, first, the hybrid system involves the cost components from both on-grid conventional system and off-grid solar system, which means that, although the number of solar modules are less in the hybrid system, this difference is compensated by the installation of conventional power source; second, there are some auxiliary costs that are the same, regardless the number of solar modules, such as the transportation cost; in addition, for the hybrid system adopters, they have to pay for the energy that is consumed from the conventional system. In this case, the price of energy varies if the adopters transmit the excessive electricity back to the grid under the “net metering” system. On the other hand, it can be noticed that the benefits are the same for system size of 1 kW (Appendix A, Table A2). Noticeably, the application of the rooftop distributed solar generation could be worthy for the countries with heavily subsidized energy price, and it is doing reformation to remove the energy subsidization, such as Egypt and Mexico; or, the countries that experience a hike in their average cost per kilowatt for electricity, such as the U.S.; or the countries that experience high demand in energy especially for clean energy.
As aforementioned, the cost of electricity meter differs based on the characteristics of the meter; the type of communications and information technology adopted; and, the type of energy efficiency technologies used. Form the other side, the deployment of gas and water smart meters can take benefits from the communication infrastructure of electricity smart meter; in this case, the system of communication needs just to be reinforced in order to support the increasing of transmitted data.
Actually, the three smart meters have various benefits for governments, utilities and the customers. These benefits can exceed the costs and give a positive mean NPV, as shown in Table 4. Noticeably, the most important benefit for the three meters is the reduction in meter reading, which represents 38%, 42%, and 48% of the total benefits for the electricity, gas, and water meters, respectively. In addition, the reduction in energy demand is one of the significant benefits, with 19% for electricity smart meter and 36% for gas smart meter, concerning the water sector many studies confirm that the deployment of water smart meter will reduce the water consumption, but there is no consistency regarding the reduction percentage. Furthermore, the avoidance of investing in standard meter or exchanging to pre-payment meter is also one of the important benefits for the three meters, this benefit is considered to be negative costs. Moreover, the electrical smart meter helps to reduce the technical, commercial losses, and transformer failure; this benefit represents 14% of total electrical smart meter benefits, this benefit is very important for the countries that endure from a high rate of energy losses. Actually, the deployment of the three smart meters enhance the reliability of the services in terms of providing accurate readings, minimizing customers complains, managing the outage efficiently, and others.
Though the mean NPVs for the three smart meters are positive (Table 4), by examining the percentage of positive NPV, it can be deduced that a limited percentage of NPV returns a negative outcome NPVs, especially for the electrical and water smart meters. Apparently, the water smart meter shows a relatively low, with 84.5% of positive outcome NPV, which is due to many factors; first, the water smart meter and associated systems are very expensive; second, not all of the benefits are converted into a monetary value; and third, the water is less expensive than the electricity and gas, thus the benefits value are not considerable in NPV equation.
The research ends by carrying out three scenarios for evaluating the NPV of smart housing model. These show that the smart housing model is economically feasible, either by using off-grid solar system or not, whereas the percentage of positive NPV is approximately 99% and the benefits and costs ratio is more than one. It is important to note that the BCR of scenario 3 (without distributed solar generation) is the highest one which emphasize the profitability of this scenario.
7. Conclusions
This research proposes to study the economic feasibility of smart housing based on the calculation of the net present value for four main components: smart meters include electricity, water, gas; in-home-display with user interface; communication network (home area network); and, a distributed generation renewable resource. Illustrative results are presented for each component based on Monte Carlo simulation output, as well as for three different scenarios for the smart housing model. The Monte Carlo simulation helps to reduce the mathematical limitation that must be considered based on single cash flows (costs and benefits) for a project. If most of the studies have, so far, proposed to change only growth rates for cash flows, this study considers the uncertainty in each item of NPV equation, including the initial costs and benefits, as well as the growth rate of both components, independently, within the life cycle of the project.
The results show that the smart housing model is financially feasible, either by using off-grid solar system or not, whereas the percentage of positive NPV is approximately 99% and the benefits and costs ratio is more than one. It can be suggested that, by considering the non-monetary benefits this minor amount of negative NPVs will diminish. To conclude, the high ratio of positive NPVs as well as the positive mean NPV in all smart housing components signify that investing in smart housing make economic sense, as well as this type of project not only will cover its costs within its life cycle, but could also provide a reasonable profit margin, either for the utilities or the government, even for the customers themselves.
This study suggests that public sector, private sector, developer, and decision makers should change their point of view regarding this new type of development and to start to invest in smart housing projects either by converting the existing ones or constructing new ones. As well as, to emphasize that the concept of smart housing is not only limited for high income housing, since the emerged technologies are relatively expensive, but also it would be profitable for low income housing.
It is important to mention that most of the literature that were used in this research are reports completed by utilities or companies to evaluate the costs and benefits of different smart technology separately, e.g., a report discusses the electricity smart meter, other the water and so on. This study tries to combine all of these reports into one document that offers a comprehensive vision for the concept of smart housing.
Author Contributions
Data curation, S.E.; Formal analysis, S.E.; Methodology, J.D. and S.E.; Software and programing, J.D.; Writing—original draft, S.E. and J.D.; Writing—review & editing, S.E. and J.D.
Funding
This research was funded by the Canadian government through the Programme canadien de bourses de la Francophonie (PCBF); and the Teaching Chair in Economic Regional Development, Laval university. The APC was funded by the Programme canadien de bourses de la Francophonie (PCBF).
Conflicts of Interest
The authors declare no conflict of interest
Appendix A

Table A1.
The harmonized costs.
| Author | Subject | Harmonized Costs | ||||
|---|---|---|---|---|---|---|
| Item | Value | Unit | Currency 1 | Years | ||
| Vanshdeep Parmar, 2016 | Micro-generation (Solar System) | Installation of a Solar System (Texas) | 2971.34 | kw | US$ | 2019 |
| Cost for utility | - | - | - | - | ||
| Micro-generation (Solar System) | Installation of a Solar System (California) | 3331.51 | kw | US$ | 2019 | |
| Cost for utility | - | - | - | - | ||
| Micro-generation (Solar System) | Installation of a Solar System (Hawaii) | 3691.67 | kw | US$ | 2019 | |
| Cost for utility | - | - | - | - | ||
| Micro-generation (Hybrid System) | Installation of a Hybrid System (Texas) | 3718.96 | kw | US$ | 2019 | |
| Cost for utility | 39.22 | kw/year | US$ | 2019 | ||
| Micro-generation (Hybrid System) | Installation of a Hybrid System (California) | 4349.63 | kw | US$ | 2019 | |
| Cost for utility | 62.16 | kw/year | US$ | 2019 | ||
| Micro-generation (Hybrid System) | Installation of a Hybrid System (Hawaii) | 5111.71 | kw | US$ | 2019 | |
| Cost for utility | 101.80 | kw/year | US$ | 2019 | ||
| Hancevic et al., 2017 | Micro-generation (Solar System) | Installation of a Solar System | 2104.70 | kw | US$ | 2019 |
| Operation and maintenance | 4.21 | kw/year | US$ | 2019 | ||
| Padmini et al., 2017 | Electricity AMI | Smart meter | 65.05 | meter | US$ | 2019 |
| IT costs | 11.22 | meter | US$ | 2019 | ||
| Operation and maintenance | 3.63 | meter/year | US$ | 2019 | ||
| Ameren Illinois, 2012 | Electricity AMI | Smart meter | 172.59 | meter | US$ | 2019 |
| IT costs | 206.47 | meter | US$ | 2019 | ||
| Operation & management (8 years deployment) | 50.18 | meter | US$ | 2019 | ||
| Operation and maintenance | 23.14 | meter/year | US$ | 2019 | ||
| Ahmad Faruqui et al., 2011 | Electricity AMI | Smart meter and enabling Demand Response/Energy Efficiency technologies (case study 1: Pioneer) | 274.49 | meter | US$ | 2019 |
| Smart meter and enabling Demand Response/Energy Efficiency technologies (case study 2: Committed) | 377.76 | meter | US$ | 2019 | ||
| Smart meter and enabling Demand Response/Energy Efficiency technologies (case study 3: Exploratory) | 308.90 | meter | US$ | 2019 | ||
| Smart meter and enabling Demand Response/Energy Efficiency technologies (case study 4: Cautious) | 357.49 | meter | US$ | 2019 | ||
| Af-Mercados Emi & Institute of Communication & Computer Systems of the National Technical University of Athens ICCS-NTUA, 2015 | Electricity AMI | AM Installation (Portugal) | 86.58 | meter | US$ | 2019 |
| IT & communication (Portugal) | 63.74 | meter | US$ | 2019 | ||
| Customer care (Portugal) | 28.78 | meter | US$ | 2019 | ||
| AM Installation (Flanders) | 595.77 | meter | US$ | 2019 | ||
| IT & communication (Flanders) | 163.07 | meter | US$ | 2019 | ||
| Customer care (Flanders) | 116.48 | meter | US$ | 2019 | ||
| Mark L. Serrano, 2009 | Gas AMI | Gas meter cost | 222.68 | meter | US$ | 2019 |
| Commission for Energy Regulation, 2011 | Gas AMI | Gas meter cost with IHD | 349.73 | meter | US$ | 2019 |
| IT & communication | 45.74 | meter | US$ | 2019 | ||
| Operation & maintenance | 1.99 | meter/year | US$ | 2019 | ||
| Department for business, energy and industrial strategy, 2016 | Gas AMI | cost of equipment | 115.71 | meter | US$ | 2019 |
| installation cost | 136.02 | meter | US$ | 2019 | ||
| Operation & maintenance | 2.90 | meter/year | US$ | 2019 | ||
| U.S. Department of Housing and Urban Development, 2015 | Water AMI | capital cost | 671.83 | meter | US$ | 2019 |
| installation cost | 76.32 | meter | US$ | 2019 | ||
| Operation & maintenance | 2.04 | meter/year | US$ | 2019 | ||
| March et al., 2017 | Water AMI | capital cost | 95.68 | meter | US$ | 2019 |
| Operation & maintenance | 2.99 | meter/year | US$ | 2019 | ||
| Commission for Energy Regulation, 2011 | IHD | IHD cost | 17.62 | unit | US$ | 2019 |
| Department for business, energy and industrial strategy, 2016 | IHD | IHD cost | 30.45 | unit | US$ | 2019 |
| Department for business, energy and industrial strategy, 2016 | Communication hub | Communication hub cost | 62.12 | unit | US$ | 2019 |
1 exchange rate is determined by using [24].
Table A2.
The harmonized benefits.
| Author | Subject | Harmonized Benefits | ||||
|---|---|---|---|---|---|---|
| Item | Value | Unit | Currency 1 | Years | ||
| Vanshdeep Parmar, 2016 | Micro-generation | Power savings (Texas) | 155.10 | kw/year | US$ | 2019 |
| Environmental impact (Texas) | 10.59 | kw/year | US$ | 2019 | ||
| Micro-generation | Power savings (California) | 245.78 | kw/year | US$ | 2019 | |
| Environmental impact (California) | 18.13 | kw/year | US$ | 2019 | ||
| Micro-generation | Power savings (Hawaii) | 402.48 | kw/year | US$ | 2019 | |
| Environmental impact (Hawaii) | 14.63 | kw/year | US$ | 2019 | ||
| Hancevic et al., 2017 | Micro-generation | Power savings | 288.28 | kw/year | US$ | 2019 |
| Government saving from subsidization | 156.52 | kw/year | US$ | 2019 | ||
| Environmental impact | 12.67 | kw/year | US$ | 2019 | ||
| Padmini et al., 2017 | Electricity AMI | Reduction in meter reading costs | 1.95 | Meter/year | US$ | 2019 |
| Reduction in cost of connection/disconnection | 0.98 | Meter/year | US$ | 2019 | ||
| Faster deduction of dead meters | 0.13 | Meter/year | US$ | 2019 | ||
| Reduction of AT & C losses | 13.01 | Meter/year | US$ | 2019 | ||
| Reduction in data entry cost | 1.46 | Meter/year | US$ | 2019 | ||
| Reduction in peak power purchase cost | 1.73 | Meter/year | US$ | 2019 | ||
| Reduction in distribution transformer failure | 0.33 | Meter/year | US$ | 2019 | ||
| Ameren Illinois, 2012 | Electricity AMI | reduction in meter reading | 24.98 | Meter/year | US$ | 2019 |
| reduction in field & meter services | 22.06 | Meter/year | US$ | 2019 | ||
| theft tamper detection & reduction | 3.76 | Meter/year | US$ | 2019 | ||
| faster identification of dead meters | 0.54 | Meter/year | US$ | 2019 | ||
| efficiency improvement in customer care | 1.57 | Meter/year | US$ | 2019 | ||
| IT cost savings | 0.49 | Meter/year | US$ | 2019 | ||
| improved distribution system spend efficiency | 32.85 | Meter/year | US$ | 2019 | ||
| outage management efficiency | 28.89 | Meter/year | US$ | 2019 | ||
| reduced consumption on inactive meters | 1.46 | Meter/year | US$ | 2019 | ||
| reduced uncollectible/bad debt expense | 6.21 | Meter/year | US$ | 2019 | ||
| demand response | 48.08 | Meter/year | US$ | 2019 | ||
| energy efficiency | 2.79 | Meter/year | US$ | 2019 | ||
| PEV | 17.71 | Meter/year | US$ | 2019 | ||
| carbon reduction | 1.38 | Meter/year | US$ | 2019 | ||
| customer outage reduction benefits | 3.00 | Meter/year | US$ | 2019 | ||
| avoided meter purchases | 24.28 | Meter/year | US$ | 2019 | ||
| Ahmad Faruqui et al., 2011 | Electricity AMI | Avoided meter reading (case study 1: Pioneer) | 6.33 | Meter/year | US$ | 2019 |
| Remote connection and disconnection (case study 1: Pioneer) | 0.15 | Meter/year | US$ | 2019 | ||
| Outage management efficiency (case study 1: Pioneer) | 2.99 | Meter/year | US$ | 2019 | ||
| Demand response (case study 1: Pioneer) | 18.55 | Meter/year | US$ | 2019 | ||
| Avoided meter reading ((case study 2: Committed) | 15.83 | Meter/year | US$ | 2019 | ||
| Remote connection and disconnection (case study 2: Committed) | 0.46 | Meter/year | US$ | 2019 | ||
| Outage management efficiency (case study 2: Committed) | 2.56 | Meter/year | US$ | 2019 | ||
| Demand response (case study 2: Committed) | 17.19 | Meter/year | US$ | 2019 | ||
| Avoided meter reading (case study 3: Exploratory) | 12.67 | Meter/year | US$ | 2019 | ||
| Remote connection and disconnection (case study 3: Exploratory) | 0.30 | Meter/year | US$ | 2019 | ||
| Outage management efficiency (case study 3: Exploratory) | 6.25 | Meter/year | US$ | 2019 | ||
| Demand response (case study 3: Exploratory) | 16.10 | Meter/year | US$ | 2019 | ||
| Avoided meter reading (case study 4: Cautious) | 19.00 | Meter/year | US$ | 2019 | ||
| Remote connection and disconnection (case study 4: Cautious) | 0.61 | Meter/year | US$ | 2019 | ||
| Outage management efficiency (case study 4: Cautious) | 5.95 | Meter/year | US$ | 2019 | ||
| Demand response (case study 4: Cautious) | 12.36 | Meter/year | US$ | 2019 | ||
| Af-Mercados Emi & Institute of Communication & Computer Systems of the National Technical University of Athens ICCS-NTUA, 2015 | Electricity AMI | Reduction in meter reading and meter operations (Portugal) | 49.48 | Meter/year | US$ | 2019 |
| Reduction in technical losses of electricity (Portugal) | 8.09 | Meter/year | US$ | 2019 | ||
| Electricity cost savings (DR) (Portugal) | 126.07 | Meter/year | US$ | 2019 | ||
| Reduction of commercial losses (Portugal) | 40.21 | Meter/year | US$ | 2019 | ||
| Reduction of outage times (Portugal) | 1.66 | Meter/year | US$ | 2019 | ||
| Avoided investment in standard meters (Portugal) | 34.96 | Meter/year | US$ | 2019 | ||
| Reduction in meter reading and meter operations (Flanders) | 249.72 | Meter/year | US$ | 2019 | ||
| Reduction in operational and maintenance costs (Flanders) | 93.19 | Meter/year | US$ | 2019 | ||
| Reduction in technical losses of electricity (Flanders) | 4.66 | Meter/year | US$ | 2019 | ||
| Electricity cost savings (DR) (Flanders) | 167.26 | Meter/year | US$ | 2019 | ||
| Reduction of commercial losses (Flanders) | 93.19 | Meter/year | US$ | 2019 | ||
| Reduction of outage times (Flanders) | 34.95 | Meter/year | US$ | 2019 | ||
| Avoided investment in standard meters (Flanders) | 146.29 | Meter/year | US$ | 2019 | ||
| Mark L. Serrano, 2009 | Gas AMI | Meter Reading | 7.17 | Meter/year | US$ | 2019 |
| Avoided costs form changing conventional meter | 1.72 | Meter/year | US$ | 2019 | ||
| Customer Services Field | 2.50 | Meter/year | US$ | 2019 | ||
| Customer Billing Services | 1.07 | Meter/year | US$ | 2019 | ||
| Customer Contact Center | 0.04 | Meter/year | US$ | 2019 | ||
| Facilities | 0.14 | Meter/year | US$ | 2019 | ||
| Safety | 0.01 | Meter/year | US$ | 2019 | ||
| Human Resources | 0.06 | Meter/year | US$ | 2019 | ||
| Gas Transmission & Distribution Planning | 0.50 | Meter/year | US$ | 2019 | ||
| Theft | 0.02 | Meter/year | US$ | 2019 | ||
| Commission for Energy Regulation, 2011 | Gas AMI | meter reading | 84.80 | Meter/year | US$ | 2019 |
| siteworks savings | 2.20 | Meter/year | US$ | 2019 | ||
| meter exchanges | 1.41 | Meter/year | US$ | 2019 | ||
| prepayment meter exchange and operation savings | 13.27 | Meter/year | US$ | 2019 | ||
| theft gas | 0.58 | Meter/year | US$ | 2019 | ||
| system reinforcement | 2.17 | Meter/year | US$ | 2019 | ||
| Customer services | 3.12 | Meter/year | US$ | 2019 | ||
| reduction in CO2 emissions | 2.47 | Meter/year | US$ | 2019 | ||
| reduction in residential usage | 29.95 | Meter/year | US$ | 2019 | ||
| Department for business, energy and industrial strategy, 2016 | Gas AMI | avoided site visits | 10.00 | Meter/year | US$ | 2019 |
| reduction in customer service overhead | 3.76 | Meter/year | US$ | 2019 | ||
| prepayment exchange cost | 27.35 | Meter/year | US$ | 2019 | ||
| theft gas | 0.62 | Meter/year | US$ | 2019 | ||
| The avoidance of debt | 3.76 | Meter/year | US$ | 2019 | ||
| switching savings | 1.33 | Meter/year | US$ | 2019 | ||
| remote disconnection | 0.85 | Meter/year | US$ | 2019 | ||
| avoided losses | 0.34 | Meter/year | US$ | 2019 | ||
| Energy demand reduction | 30.77 | Meter/year | US$ | 2019 | ||
| U.S. Department of Housing and Urban Development, 2015 | Water AMI | reduction in meter reading and labor costs | 29.93 | Meter/year | US$ | 2019 |
| accurate reading of low water flow | 69.78 | Meter/year | US$ | 2019 | ||
| March et al., 2017 | Water AMI | Avoided replacement of standard meters | 2.99 | Meter/year | US$ | 2019 |
| leak detection | 0.48 | Meter/year | US$ | 2019 | ||
| Avoidance of fraudulent readings | 1.17 | Meter/year | US$ | 2019 | ||
| Commission for Energy Regulation, 2011 | IHD | Gas energy demand reduction | 6.25 | Meter/year | US$ | 2019 |
| Department for business, energy and industrial strategy, 2016 | IHD | Gas energy demand reduction | 12.39 | Meter/year | US$ | 2019 |
| Electricity energy demand reductions | 26.90 | Meter/year | US$ | 2019 | ||
1 exchange rate is determined by using [24].
References
- March, H.; Morote, Á.F.; Rico, A.M.; Saurí, D. Household Smart Water Metering in Spain: Insights from the Experience of Remote Meter Reading in Alicante. Sustainability 2017, 9, 582. [Google Scholar] [CrossRef]
- Finger, M. Smart Cities—Management of Smart Urban Infrastructures. 2018. Available online: https://www.coursera.org/learn/smart-cities (accessed on 12 July 2019).
- Nagar, S.; Aneja, S.; Khadilkar, H.; Dechu, S.; Charbiwala, Z. SMOME: A framework for evaluating the costs and benefits of instrumentation in smart home systems. In Proceedings of the 2016 IEEE International Conference on Smart Grid Communications (SmartGridComm), Sydney, Australia, 6–9 November 2016; pp. 134–139. [Google Scholar]
- Joshipura, S. The Payoff and Peril of Smart Infrastructure. Brink—The Edge of Risk. 2019. Available online: https://www.brinknews.com/the-payoff-and-peril-of-smart-infrastructure/ (accessed on 27 May 2019).
- Faruqui, A.; Mitarotonda, D.; Wood, L.; Cooper, A.; Schwartz, J. The Costs and Benefits of Smart Meters for Residential Customers; Institute for Electric Efficiency: Washington, DC, USA, 2011. [Google Scholar]
- Smart Water Metering Cost Benefit Study; Marchment Hill Consulting Pty Ltd.: Melbourne, Victoria, Australia, 2010.
- Karnain, M.A.B.; Zakaria, Z.B. A Review on ZigBee Security Enhancement in Smart Home Environment. In Proceedings of the 2015 2nd International Conference on Information Science and Security (ICISS), Seoul, Korea, 14–16 December 2015; pp. 1–4. [Google Scholar]
- Aljer, A.; Loriot, M.; Shahrour, I.; Benyahya, A. Smart system for social housing monitoring. In Proceedings of the 2017 Sensors Networks Smart and Emerging Technologies (SENSET), Beirut, Lebanon, 12–14 September 2017; pp. 1–4. [Google Scholar]
- Parmar, V. Benefit Cost Analysis of Solar Power Over On-Grid Electricity for Residential System: Is Photovoltaic Technology Really Effective? Ph.D. Thesis, Texas A&M University, College Station, TX, USA, May 2016. [Google Scholar]
- Smart Meter Roll-out Cost-Benefit Analysis; Department for Business, Energy and Industrial Strategy: London, UK, 2016.
- Giordano, V.; Onyeji, I.; Fulli, G.; Jimenez, M.S.; Filiou, C. Guidelines for Conducting a Cost—Benefit Analysis of Smart Grid Projects; Publications Office: Luxembourg, 2012. [Google Scholar]
- Padmini, V.; Omran, S.; Chatterjee, K.; Khaparde, S.A. Cost benefit analysis of smart grid: A case study from India. In Proceedings of the 2017 North American Power Symposium (NAPS), Morgantown, WV, USA; 2017; pp. 1–6. [Google Scholar]
- Commission for Energy Regulation. Cost-Benefit Analysis (CBA) for a National Gas Smart Metering Rollout in Ireland; Tallaght: Dublin, Ireland, 2011. [Google Scholar]
- Study on Cost Benefit Analysis of Smart Metering Systems in EU Member States; Af-Mercados Emi and Institute of Communication & Computer Systems of the National Technical University of Athens ICCS-NTUA: Athens, Greece, 2015.
- Smart Meters and Domestic Water Usage; Foundation for Water Research: Marlow, UK, 2015.
- Advanced Metering Infrastructure (AMI) Cost/Benefit Analysis; Ameren Illinois: St. Louis, MI, USA, 2012.
- Hancevic, P.I.; Nuñez, H.M.; Rosellon, J. Distributed photovoltaic power generation: Possibilities, benefits, and challenges for a widespread application in the Mexican residential sector. Energy Policy 2017, 110, 478–489. [Google Scholar] [CrossRef] [Green Version]
- Serrano, M.L. Socalgas AMI Deployment Plan, Costs, and Operational Benefits; Southern California Gas Company: Los Angeles, CA, USA, 2009. [Google Scholar]
- Benefit/Cost Analysis, Smart Water Meter System; U.S. Department of Housing and Urban Development: Washington, DC, USA, 2015.
- Grelle, M.L. Cost Benefit Analysis of Smart Meter Deployment for Residential Customers, a Holistic Approach. Master’s Thesis, Swiss Federal Institute of Technology Zurich, Zurich, Switzerland, August 2016. [Google Scholar]
- California Carbon Dashboard. 2018. Available online: Calcarbondash.org (accessed on 27 May 2019).
- The Energy Prices Analysis team. Quarterly Energy Prices; Department for Business, Energy and Industrial Strategy: Zurich, Switzerland, 2017. [Google Scholar]
- Shaffie, S.S.; Jaaman, S.H. Monte Carlo on Net Present Value for Capital Investment in Malaysia. Procedia Soc. Behav. Sci. 2016, 219, 688–693. [Google Scholar] [CrossRef] [Green Version]
- The OECD. Conversion Rates—Exchange Rates—OECD Data. 2019. Available online: http://data.oecd.org/conversion/exchange-rates.htm (accessed on 26 May 2019).
- Cost-Benefit Analysis and the Environment: Recent Developments; OECD: Paris, France, 2006.
- Guide D’analyse Coûts-Avantages Pour le Canada: Propositions de Réglementation; Secrétariat du Conseil du Trésor du Canada: Ottawa, ON, Canada, 2007.
Figure 1.
Distribution of net present value (NPV) per component (Monte Carlo simulation-authors).

Figure 2.
Benefits of distributed solar generation (Solar System) (authors).

Figure 3.
Benefits of distributed solar generation (Hybrid System) (authors).

Figure 4.
Benefits of electricity smart meter (authors).

Figure 5.
Benefits of gas smart meter (authors).

Figure 6.
Benefits of water smart meter (authors).

Figure 7.
Benefits of in-home-display (IHD) (authors).

Figure 8.
Distribution of the NPV per scenario (Monte Carlo simulation-authors).

Table 1.
Costs of smart housing components (literature).
| Author | Subject | Costs | ||||
|---|---|---|---|---|---|---|
| Item | Value | Unit | Currency | Years | ||
| Vanshdeep Parmar, 2016 | Micro-generation (Solar System) | Installation of a Solar System (Texas) | 33,000 | 12.5 kw | US$ | 2015 |
| Micro-generation (Solar System) | Installation of a Solar System (California) | 37,000 | 12.5 kw | US$ | 2015 | |
| Micro-generation (Solar System) | Installation of a Solar System (Hawaii) | 41,000 | 12.5 kw | US$ | 2015 | |
| Micro-generation (Hybrid System) | Installation of a Hybrid System (Texas) | 30,300 | 10 kw | US$ | 2015 | |
| Micro-generation (Hybrid System) | Installation of a Hybrid System (California) | 34,300 | 10 kw | US$ | 2015 | |
| Micro-generation (Hybrid System) | Installation of a Hybrid System (Hawaii) | 38,300 | 10 kw | US$ | 2015 | |
| Hancevic et al., 2017 | Micro-generation (Solar System) | Installation of a Solar System | 1870 | kw | US$ | 2015 |
| Operation and maintenance | 3.74 | kw/year | US$ | 2015 | ||
| Padmini et al., 2017 | Electricity AMI | Smart meter | 4000 | meter | INR | 2016 |
| IT costs | 690, 000,000 | M. meters | INR | 2016 | ||
| Operation and maintenance | 223,250,000 | M. meters/year | INR | 2016 | ||
| Ameren Illinois, 2012 | Electricity AMI | Smart meter | 109,517,049 | 780,419 m | US$ | 2012 |
| IT costs | 131,012,913 | 780,419 m | US$ | 2012 | ||
| Operation and management (8 years deployment) | 31,842,433 | 780,419 m | US$ | 2012 | ||
| Operation and maintenance | 293,724,053 | 780,419 m (20 years) | US$ | 2012 | ||
| Ahmad Faruqui et al., 2011 | Electricity AMI | Smart meter and enabling Demand Response/Energy Efficiency technologies (case study 1: Pioneer) | 197,774,979 1 | M. meters | US$ | 2011 |
| Smart meter and enabling Demand Response/Energy Efficiency technologies (case study 2: Committed) | 272,188,433 1 | M. meters | US$ | 2011 | ||
| Smart meter and enabling Demand Response/Energy Efficiency technologies (case study 3: Exploratory) | 222,571,202 1 | M. meters | US$ | 2011 | ||
| Smart meter and enabling Demand Response/Energy Efficiency technologies (case study 4: Cautious) | 257,578,845 1 | M. meters | US$ | 2011 | ||
| Af-Mercados Emi & Institute of Communication & Computer Systems of the National Technical University of Athens ICCS-NTUA, 2015 | Electricity AMI | AM Installation (Portugal) | 56.31 | meter | € | 2014 |
| IT & communication (Portugal) | 41.46 | meter | € | 2014 | ||
| Customer care (Portugal) | 18.72 | meter | € | 2014 | ||
| AM Installation (Flanders) | 387.49 | meter | € | 2014 | ||
| IT & communication (Flanders) | 106.06 | meter | € | 2014 | ||
| Customer care (Flanders) | 75.76 | meter | € | 2014 | ||
| Mark L. Serrano, 2009 | Gas AMI | Gas meter cost | 965,200,000 | 6 M. meters | US$ | 2008 |
| Commission for Energy Regulation, 2011 | Gas AMI | Gas meter cost with IHD | 198.5 | meter | € | 2011 |
| IT & communication | 25.96 | meter | € | 2011 | ||
| Operation & maintenance | 1.13 | meter/year | € | 2011 | ||
| Department for business, energy and industrial strategy, 2016 | Gas AMI | cost of equipment | 57 | meter | £ | 2011 |
| installation cost | 67 | meter | £ | 2011 | ||
| Operation & maintenance | 1.43 | meter/year | £ | 2011 | ||
| U.S. Department of Housing and Urban Development, 2015 | Water AMI | capital cost | 17,012,000 | 28,500 m | US$ | 2015 |
| installation cost | 1,932,500 | 28,500 m | US$ | 2015 | ||
| Operation & maintenance | 1,031,703 | 28,500 m (20 years) | US$ | 2015 | ||
| March et al., 2017 | Water AMI | capital cost | 80 | meter | € | 2017 |
| Operation & maintenance | 2.5 | meter/year | € | 2017 | ||
| Commission for Energy Regulation, 2011 | IHD | IHD cost | 10 | Unit | € | 2011 |
| Department for business, energy and industrial strategy, 2016 | IHD | IHD cost | 15 | Unit | £ | 2011 |
| Department for business, energy and industrial strategy, 2016 | Communication hub | Communication hub cost | 30.6 | Unit | £ | 2011 |
1 the authors based the cost of devices on actual prices and projections provided by manufacturers and assumed that, over the next 20 years, prices will decline significantly as innovations occur, economies of scale take hold, and manufacturing costs decline.
Table 2.
Benefits of smart housing components (literature).
| Author | Subject | Benefits | ||||
|---|---|---|---|---|---|---|
| Item | Value | Unit | Currency | Years | ||
| Vanshdeep Parmar, 2016 | Micro-generation (Solar System) | Power savings (Texas) | 1722.47 | 12.5 kw/year | US$ | 2015 |
| Environmental impact (Texas) | 18,107.7 1 | lbs/year | - | 2015 | ||
| Micro-generation (Solar System) | Power savings (California) | 2,729.62 | 12.5 kw/year | US$ | 2015 | |
| Environmental impact (California) | 30,977.66 1 | lbs/year | - | 2015 | ||
| Micro-generation (Solar System) | Power savings (Hawaii) | 4470.05 | 12.5 kw/year | US$ | 2015 | |
| Environmental impact (Hawaii) | 24,991.6 1 | lbs/year | - | 2015 | ||
| Micro-generation (Hybrid System) | Power savings (Texas) | 1377.98 | 10 kw/year | US$ | 2015 | |
| Environmental impact (Texas) | 14,486.1 1 | lbs/year | - | 2015 | ||
| Micro-generation (Hybrid System) | Power savings (California) | 2183.69 | 10 kw/year | US$ | 2015 | |
| Environmental impact (California) | 24,782.00 1 | lbs/year | - | 2015 | ||
| Micro-generation (Hybrid System) | Power savings (Hawaii) | 3576.04 | 10 kw/year | US$ | 2015 | |
| Environmental impact (Hawaii) | 19,993.2 1 | lbs/year | - | 2015 | ||
| Hancevic et al., 2017 | Micro-generation (Solar System) | Power savings | 0.16 | US$/kwh | US$ | 2015 2 |
| Government saving from subsidization | 1.6 billion | US$/year | US$ | 2015 2 | ||
| Environmental impact | 192 million | US$/year | US$ | 2015 2 | ||
| Padmini et al., 2017 | Electricity AMI | Reduction in meter reading costs | 120,000,000 | M./year | INR | 2016 |
| Reduction in cost of connection/disconnection | 60,000,000 | M./year | INR | 2016 | ||
| Faster deduction of dead meters | 8,000,000 | M./year | INR | 2016 | ||
| Reduction of AT & C losses | 799,998,000 | M./year | INR | 2016 | ||
| Reduction in data entry cost | 90,000,000 | M./year | INR | 2016 | ||
| Reduction in peak power purchase cost | 106,666,000 | M./year | INR | 2016 | ||
| Reduction in distribution transformer failure | 20,000,000 | M./year | INR | 2016 | ||
| Ameren Illinois, 2012 | Electricity AMI | Reduction in meter reading | 237,814,522 | 780,419 m (20 years) | US$ | 2012 |
| Reduction in field & meter services | 209,138,191 | 780,419 m (20 years) | US$ | 2012 | ||
| Theft tamper detection & reduction | 35,522,376 | 780,419 m (20 years) | US$ | 2012 | ||
| Faster identification of dead meters | 5,127,494 | 780,419 m (20 years) | US$ | 2012 | ||
| Efficiency improvement in customer care | 14,589,258 | 780,419 m (20 years) | US$ | 2012 | ||
| IT cost savings | 5,135,593 | 780,419 m (20 years) | US$ | 2012 | ||
| Improved distribution system spend efficiency | 27,076,479 | 780,419 m (20 years) | US$ | 2012 | ||
| Outage management efficiency | 31,789,315 | 780,419 m (20 years) | US$ | 2012 | ||
| Reduced consumption on inactive meters | 16,532,798 | 780,419 m (20 years) | US$ | 2012 | ||
| Reduced uncollectible/bad debt expense | 59,115,015 | 780,419 m (20 years) | US$ | 2012 | ||
| Demand response | 405,776,029 | 780,419 m (20 years) | US$ | 2012 | ||
| Energy efficiency | 23,740,538 | 780,419 m (20 years) | US$ | 2012 | ||
| PEV | 150,676,076 | 780,419 m (20 years) | US$ | 2012 | ||
| Carbon reduction | 11,392,210 | 780,419 m (20 years) | US$ | 2012 | ||
| Customer outage reduction benefits | 27,952,082 | 780,419 m (20 years) | US$ | 2012 | ||
| Avoided meter purchases | 15,404,293 | 780,419 m (20 years) | US$ | 2012 | ||
| Ahmad Faruqui et al., 2011 | Electricity AMI | Avoided meter reading (case study 1: Pioneer) | 51,453,162 3 | M. meters (20 years) | US$ | 2012 |
| Remote connection and disconnection (case study 1: Pioneer) | 1,234,876 3 | M. meters (20 years) | US$ | 2012 | ||
| Outage management efficiency (case study 1: Pioneer) | 24,259,229 3 | M. meters (20 years) | US$ | 2012 | ||
| Demand response (case study 1: Pioneer) | 150,330,260 3 | M. meters (20 years) | US$ | 2012 | ||
| Avoided meter reading ((case study 2: Committed) | 128,632,904 3 | M. meters (20 years) | US$ | 2012 | ||
| Remote connection and disconnection (case study 2: Committed) | 3,704,628 3 | M. meters (20 years) | US$ | 2012 | ||
| Outage management efficiency (case study 2: Committed) | 20,757,821 3 | M. meters (20 years) | US$ | 2012 | ||
| Demand response (case study 2: Committed) | 139,580,561 3 | M. meters (20 years) | US$ | 2012 | ||
| Avoided meter reading (case study 3: Exploratory) | 102,906,323 3 | M. meters (20 years) | US$ | 2012 | ||
| Remote connection and disconnection (case study 3: Exploratory) | 2,469,752 3 | M. meters (20 years) | US$ | 2012 | ||
| Outage management efficiency (case study 3: Exploratory) | 50,721,203 3 | M. meters (20 years) | US$ | 2012 | ||
| Demand response (case study 3: Exploratory) | 130,770,355 3 | M. meters (20 years) | US$ | 2012 | ||
| Avoided meter reading (case study 4: Cautious) | 154,359,485 3 | M. meters (20 years) | US$ | 2012 | ||
| Remote connection and disconnection (case study 4: Cautious) | 4,939,504 3 | M. meters (20 years) | US$ | 2012 | ||
| Outage management efficiency (case study 4: Cautious) | 48,315,562 3 | M. meters (20 years) | US$ | 2012 | ||
| Demand response (case study 4: Cautious) | 100,366,244 3 | M. meters (20 years) | US$ | 2012 | ||
| Af-Mercados Emi & Institute of Communication & Computer Systems of the National Technical University of Athens ICCS-NTUA, 2015 | Electricity AMI | Reduction in meter reading and meter operations (Portugal) | 32.18 | Avg meter/year | € | 2014 |
| Reduction in technical losses of electricity (Portugal) | 5.26 | Avg meter/year | € | 2014 | ||
| Electricity cost savings (DR) (Portugal) | 82 | Avg meter/year | € | 2014 | ||
| Reduction of commercial losses (Portugal) | 26.15 | Avg meter/year | € | 2014 | ||
| Reduction of outage times (Portugal) | 1.08 | Avg meter/year | € | 2014 | ||
| Avoided investment in standard meters (Portugal) | 22.74 | Avg meter/year | € | 2014 | ||
| Reduction in meter reading and meter operations (Flanders) | 162.42 | Avg meter/year | € | 2014 | ||
| Reduction in operational and maintenance costs (Flanders) | 60.61 | Avg meter/year | € | 2014 | ||
| Reduction in technical losses of electricity (Flanders) | 3.03 | Avg meter/year | € | 2014 | ||
| Electricity cost savings (DR) (Flanders) | 108.79 | Avg meter/year | € | 2014 | ||
| Reduction of commercial losses (Flanders) | 60.61 | Avg meter/year | € | 2014 | ||
| Reduction of outage times (Flanders) | 22.73 | Avg meter/year | € | 2014 | ||
| Avoided investment in standard meters (Flanders) | 95.15 | Avg meter/year | € | 2014 | ||
| Mark L. Serrano, 2009 | Gas AMI | Meter Reading | 777,500,000 | 6 M. meters (25 years) | US$ | 2008 |
| Avoided costs form changing conventional meter | 185,900,000 | 6 M. meters (25 years) | US$ | 2008 | ||
| Customer Services Field | 270,500,000 | 6 M. meters (25 years) | US$ | 2008 | ||
| Customer Billing Services | 116,400,000 | 6 M. meters (25 years) | US$ | 2008 | ||
| Customer Contact Center | 4,800,000 | 6 M. meters (25 years) | US$ | 2008 | ||
| Facilities | 15,000,000 | 6 M. meters (25 years) | US$ | 2008 | ||
| Safety | 1,400,000 | 6 M. meters (25 years) | US$ | 2008 | ||
| Human Resources | 6,100,000 | 6 M. meters (25 years) | US$ | 2008 | ||
| Gas Transmission & Distribution Planning | 53,900,000 | 6 M. meters (25 years) | US$ | 2008 | ||
| Theft | 2,400,000 | 6 M. meters (25 years) | US$ | 2008 | ||
| Commission for Energy Regulation, 2011 | Gas AMI | meter reading | 48.13 | Per meter/year | € | 2011 |
| siteworks savings | 1.25 | Per meter/year | € | 2011 | ||
| meter exchanges | 0.8 | Per meter/year | € | 2011 | ||
| prepayment meter exchange and operation savings | 7.53 | Per meter/year | € | 2011 | ||
| theft gas | 0.33 | Per meter/year | € | 2011 | ||
| system reinforcement | 1.23 | Per meter/year | € | 2011 | ||
| Customer services | 1.77 | Per meter/year | € | 2011 | ||
| reduction in CO2 emissions | 1.4 | Per meter/year | € | 2011 | ||
| reduction in residential usage | 17 | Per meter/year | € | 2011 | ||
| Department for business, energy and industrial strategy, 2016 | Gas AMI | avoided site visits | 5.85 | Per meter/year | £ | 2016 |
| reduction in customer service overhead | 2.2 | Per meter/year | £ | 2016 | ||
| prepayment exchange cost | 16 | Per meter/year | £ | 2016 | ||
| theft gas | 0.36 | Per meter/year | £ | 2016 | ||
| The avoidance of debt | 2.2 | Per meter/year | £ | 2016 | ||
| switching savings | 0.78 | Per meter/year | £ | 2016 | ||
| remote disconnection | 0.5 | Per meter/year | £ | 2016 | ||
| avoided losses | 0.2 | Per meter/year | £ | 2016 | ||
| Energy demand reduction | 18 | Per meter/year | £ | 2016 | ||
| U.S. Department of Housing and Urban Development, 2015 | Water AMI | reduction in meter reading and labor costs | 15,156,537 | 28,500 m (20 years) | US$ | 2015 |
| accurate reading of low water flow | 35,341,835 | 28,500 m (20 years) | US$ | 2015 | ||
| March et al., 2017 | Water AMI | Avoided replacement of standard meters | 5,000,000 | In 10 years | € | 2017 |
| leak detection | 80,000 | 200,000 per year | € | 2017 | ||
| Avoidance of fraudulent readings | 180,000–210,000 | 200,000 per year | € | 2017 | ||
| Commission for Energy Regulation, 2011 | IHD | Gas energy demand reduction | 3.55 | Per unit/year | € | 2011 |
| Department for business, energy and industrial strategy, 2016 | IHD | Gas energy demand reduction | 8.4 4 | Per unit/year | £ | 2016 |
| Electricity energy demand reduction | 18.24 5 | Per unit/year | £ | 2016 | ||
1 Carbon price: 13$ per tonne in 2015 [20]; 2 The authors use 2014 National Household Income and Expenditure Survey (ENIGH-2014) as well as, electricity consumption for each household. 3 PV = B × i = 7.377%, 4 Avg gas consumption 15,000 kwh with 0.04£ per kwh [21], 5 Avg electricity consumption 3800 kwh with 0.15£ per kwh [21].
Table 3.
The maximum and minimum values for costs and benefits used in Monte Carlo simulation calculated in 2019 (literature).
Table 3.
The maximum and minimum values for costs and benefits used in Monte Carlo simulation calculated in 2019 (literature).
| Subjects | Item | Unit | Maximum | Minimum |
|---|---|---|---|---|
| Costs | ||||
| Micro-generation Solar System | Installation | US$/KW | 3691.67 | 2104.70 |
| Operation & maintenance | US$/KW/year | 5.05 | 3.37 | |
| Micro-generation Hybrid System | Installation | US$/KW | 5231.51 | 3758.18 |
| Operation & maintenance | US$/KW/year | 5.05 | 3.37 | |
| Electricity AMI | Installation | US$/KW | 875.32 | 76.27 |
| Operation & maintenance | US$/KW/year | 23.14 | 3.63 | |
| Gas AMI | Installation | US$/KW | 395.47 | 222.68 |
| Operation & maintenance | US$/KW/year | 2.9 | 1.99 | |
| water AMI | Installation | US$/KW | 748.15 | 95.68 |
| Operation & maintenance | US$/KW/year | 2.99 | 2.04 | |
| IHD | Installation | US$/KW | 30.45 | 17.62 |
| Benefits | ||||
| Micro-generation Solar System | Power savings | US$/KW/year | 402.48 | 155.1 |
| Government saving from subsidization | US$/KW/year | 187.82 | 125.22 | |
| Environmental impact | US$/KW/year | 18.13 | 10.59 | |
| Micro-generation Hybrid System | Power savings | US$/KW/year | 402.48 | 155.1 |
| Government saving from subsidization | US$/KW/year | 187.82 | 125.22 | |
| Environmental impact | US$/KW/year | 18.13 | 10.59 | |
| Electricity AMI | Reduction in meter reading & meter operations | US$/KW/year | 342.91 | 4.39 |
| Faster deduction of dead meters, theft, uncollectible expenses | US$/KW/year | 11.97 | 0.13 | |
| Reduction of technical, Commercial losses & transformer failure | US$/KW/year | 97.85 | 13.34 | |
| Demand response | US$/KW/year | 167.26 | 1.73 | |
| Outage management efficiency | US$/KW/year | 34.95 | 1.66 | |
| Avoided investment in standard meters | US$/KW/year | 146.29 | 24.77 | |
| Carbon reduction | US$/KW/year | 1.66 | 1.10 | |
| Gas AMI | Avoided meter readings | US$/KW/year | 84.8 | 7.23 |
| Meter exchanges | US$/KW/year | 27.34 | 1.72 | |
| Site works savings | US$/KW/year | 2.65 | 0.85 | |
| Reduction in customer services | US$/KW/year | 5.09 | 1.11 | |
| Gas Transmission & Distribution Planning | US$/KW/year | 2.17 | 0.34 | |
| Theft gas | US$/KW/year | 0.62 | 0.02 | |
| Energy demand reduction | US$/KW/year | 34.53 | 29.95 | |
| Reduction in CO2 emissions | US$/KW/year | 2.96 | 1.98 | |
| water AMI | Reduction in meter reading and labor costs | US$/KW/year | 35.92 | 23.94 |
| Avoidance of fraudulent readings | US$/KW/year | 69.78 | 1.17 | |
| Leak detection | US$/KW/year | 0.58 | 0.38 | |
| Avoided replacement of standard meters | US$/KW/year | 3.59 | 2.39 | |
| IHD | Gas energy demand reduction | US$/KW/year | 12.39 | 6.25 |
| Electricity energy demand reductions | US$/KW/year | 32.28 | 21.52 | |
Table 4.
Net present value summary for each component (Monte Carlo simulation-authors).
| NPV for Distributed Solar Generation (Solar System) | ||||
| Mean | Min | Max | % of NPV > 0 | Benefits/costs |
| 2386.46 | −437.22 | 6302.81 | 98.70% | 1.85 |
| NPV for Distributed solar generation (Hybrid System) | ||||
| Mean | Min | Max | % of NPV > 0 | Benefits/costs |
| 790.94 | −1994.19 | 4649.82 | 70.70% | 1.18 |
| NPV for Electricity smart meter | ||||
| Mean | Min | Max | % of NPV > 0 | Benefits/costs |
| 4376.76 | −481.79 | 10,879.34 | 98.20% | 10.89 |
| NPV for Gas smart meter | ||||
| Mean | Min | Max | % of NPV > 0 | Benefits/costs |
| 866.44 | 58.96 | 1962.31 | 100% | 3.64 |
| NPV for Water smart meter | ||||
| Mean | Min | Max | % of NPV > 0 | Benefits/costs |
| 358.5 | −420.68 | 1391.58 | 84.50% | 2.28 |
| NPV for In-home-display (IHD) | ||||
| Mean | Min | Max | % of NPV > 0 | Benefits/costs |
| 407.51 | 247.18 | 607.06 | 100% | 18.31 |
Table 5.
Net present value summary for each scenario (Monte Carlo simulation-authors).
| Scenario 1: Net Present Value for smart housing model with distributed solar generation (solar system) | ||||
| Mean | Min | Max | % of NPV > 0 | Benefits/costs |
| 8395.67 | −946.26 | 21,142.19 | 99% | 3.07 |
| Scenario 2: Net Present Value for smart housing model with distributed solar generation (Hybrid system) | ||||
| Mean | Min | Max | % of NPV > 0 | Benefits/costs |
| 6800.15 | −2503.23 | 19,489.2 | 93.70% | 2.19 |
| Scenario 3: Net Present Value for smart housing model without distributed solar generation | ||||
| Mean | Min | Max | % of NPV > 0 | Benefits/costs |
| 6009.207 | −509.0402 | 14,839.38 | 98.80% | 6.09 |
© 2019 by the authors. Licensee MDPI, Basel, Switzerland. This article is an open access article distributed under the terms and conditions of the Creative Commons Attribution (CC BY) license (http://creativecommons.org/licenses/by/4.0/).
Share and Cite
MDPI and ACS Style
Elariane, S.A.; Dubé, J. Is Smart Housing a Good Deal? An Answer Based on Monte Carlo Net Present Value Analysis. Sustainability 2019, 11, 4193. https://0-doi-org.brum.beds.ac.uk/10.3390/su11154193
AMA Style
Elariane SA, Dubé J. Is Smart Housing a Good Deal? An Answer Based on Monte Carlo Net Present Value Analysis. Sustainability. 2019; 11(15):4193. https://0-doi-org.brum.beds.ac.uk/10.3390/su11154193
Chicago/Turabian StyleElariane, Sarah A., and Jean Dubé. 2019. "Is Smart Housing a Good Deal? An Answer Based on Monte Carlo Net Present Value Analysis" Sustainability 11, no. 15: 4193. https://0-doi-org.brum.beds.ac.uk/10.3390/su11154193
Note that from the first issue of 2016, this journal uses article numbers instead of page numbers. See further details here.