1. Introduction
The long-term sustainability of companies depends, to a great extent, on their ability to properly meet customer needs. In fact, the aim of satisfying customers is to create brand value, which is a key factor for a company’s sustainability [
1]. Accordingly, many companies invest huge amounts of money on marketing research to gather information about consumer preferences and demands. From this information, it is crucial to understand what consumers think about the products they buy in order to develop appropriate branding and positioning strategies. Reference [
2] stated that a powerful brand name can influence the consumer decision-making process and can positively impact brand sustainability. Specifically, marketing managers need to know how a brand is perceived by its target market relative to other brands in the category and in relation to the most relevant attributes defined for its category. In fact, brand image is built through consumer opinions on specific product characteristics.
With global access to the internet, a large amount of data is generated, thereby providing a promising way to discover consumer opinion about products that are bought and experienced. Organizations want to take advantage of these data and convert them into relevant information that allows them to make better decisions, and this is possible by analyzing all available data (“big data”). Internet users collaborate daily in the generation of huge amounts of data, thereby becoming one of the most important sources of big data. By writing blogs, participating in social media, or reviewing products online, internet users are constantly generating content. Consumer comments in online forums have proven to be a useful source for revealing consumer insights [
3], and this user-generated content (UGC) represents a promising alternative source for potentially identifying customer needs [
4]. Thus, mining this UGC and analyzing the sentiments of the comments expressed by consumers might be useful for companies. Actually, many researchers highlight the importance of factoring in UGC to aid in decision-making in the marketing field. Particularly, brand management can be one area of interest, as online reviews might have an influence on brand image and brand positioning, including design decisions. In the same line, Fan et al. [
5] argued that this type of analysis might help manufacturers not only to find out what consumer demands or requirements are, but also to facilitate the design of new products and the improvement of products already available on the market.
Within this context, sentiment analysis (SA) techniques are a useful way to examine opinionated text, which contains consumer opinions toward companies, products, brands, or events. SA is a subfield in natural language processing (NLP) that automatically classifies text through valence [
6], extracting information from user opinions [
7]. Certain techniques split the comments into two classes (negative or positive), and others incorporate more sentiment classes [
8]. Generally, SA means a classification of the given text polarity at three levels: the document level, sentence level, or aspect level [
7].
A more fine-grained view of the opinions expressed by consumers requires analysis at the sentence level [
8]. Consumers frequently review products that have many features or attributes, and they usually have a different opinion about each of these aspects. While consumers may find some features of products appealing, other aspects may be disappointing. Thus, when a consumer provides feedback about different features of a product, classifying a single review as either positive or negative may overlook valuable information contained within it. For example, some of the features can be positively reviewed, whereas others can be negatively reviewed. A feature-based SA might offer a more detailed view of how consumers rate a product, which in the end will drive future behavior. Using this feature-based analysis, marketing managers can obtain valuable information about different features of the product that would not be detected if the sentiment was classified only in terms of the whole review [
9].
In this paper, we focus on SA techniques as well as on the application of NLP tools to marketing decision-making. First, customer preferences according to a star score usually given by users in UGC and a sentiment score were analyzed. Subsequently, the positive, neutral, and negative sections of the review were split. Finally, the main features of the products that provoked positive, neutral, and negative feelings in clients were identified. We carried out (1) a global sentiment analysis in the review (document level) that allowed us to measure whether the product was liked by people, (2) an analysis of different phrases (sentence level) to find out what buyers liked and disliked about a product, and (3) an extraction of positive/neutral/negative product features (aspect level).
Our case study also extracted big data from Amazon online reviews, as in the case of other researchers (e.g., References [
10] or [
11]), given that Amazon is recognized as one of the most important online marketplaces to buy products. However, our proposal can be applied to different marketplaces (e.g., Flipkart, Snapdeal). These product reviews were written by buyers and were used by new potential consumers as a source of electronic word-of-mouth to make decisions on their own purchases. In this sense, brand image is derived not only from signals sent by companies, but also by online reviews written by consumers. Specifically, we focused on the cell phone category, an interesting case study given its impact on sustainability [
12]. The shortened lifecycle and first world throwaway culture that affect these types of products are concerning, given that the conditions surrounding the extraction of necessary minerals, such as coltan use in batteries, often result in conflict and involve unfair labor practices and human rights abuses [
13], such as in the issue of child soldiers [
14]. Furthermore, the growing demand for coltan may result in adverse environmental impacts in mining regions [
15]. Addressing consumer demands based on their priorities and opinions on a product might help to mitigate these problems and increase the sustainability of the whole sector involved in the manufacturing of electronic and mobile devices.
Regarding sustainability issues, in the critical review of Kemper et al. [
16], the authors responded to the need to better understand the foundations of marketing worldviews with respect to sustainability. In Reference [
17], the authors developed a framework that provides services marketing managers with a systematic and transparent means of enhancing sustainability performance through marketing functions.
In previous studies [
18,
19], we have found that the use of sentiment scores and the search for positive and negative product features help in making decisions. However, we have not found studies that have combined product price, the quantitative star score given by users, the sentiment score given by an SA tool in a global review, and the sentiment score given for each specific extracted feature to classify the best products by brand or category shown on dashboards. Due to the complexity of the online reviews, we made use of SA and text data mining techniques to improve the marketing decision-making process through a specific extraction and analysis of positive, neutral, and negative characteristics of reviewed products.
The major contribution of our research is to present a clear and efficient architecture divided into stages in order to address this complex scenario. In addition, the strength of this general approach, with its well-defined stages, rests in its applicability to other research areas.
The novelty of our work is to give a rating based on the qualification of the features and combine them with other scores that serve to classify products, including price and the global sentiment score. Consequently, our work develops a ranking for a product that classifies its features along with other indicators, such as price and the sentiment score of the review.
To conclude, the aims of the work in this paper were the following:
To use the mined product features and the polarity of consumer opinions about each feature to obtain a product score. Then, we combined price, star score, sentiment score of the review, and sentiment score based on product features to rank each product and to assist marketing managers and consumers in their decision-making processes;
To carry out a detailed analysis of the characteristics of the consumers’ reviews;
To improve recommender systems using positive, neutral, and negative customer feedback. In this way, the objective of “efficient” (or “sustainable”) purchases could be achieved.
This paper is organized as follows:
Section 1 gives an introduction of the uses of SA and the value of consumer reviews in e-commerce for branding.
Section 2 briefs related work presented in the literature about big data techniques applied to marketing, SA, and product feature selection methods. In
Section 3, we show the proposed architecture.
Section 4 details the data collection and tool setup and the experimentation and results. Finally,
Section 5 gives the conclusion and ideas for future work.
2. Background
This paper deals with automatic SA and product features selection, the identification of the main characteristics of an analyzed product (e.g., the users’ opinions about the battery or screen of the Samsung S7 phone) in product reviews, and the benefits of applying big data techniques to marketing. Thus, we will summarize previous work on these topics. This section ends with an overview of the findings extracted from related work, which justifies our contribution to this state-of-the-art work.
Obtaining consumer opinions about a product or service is not an easy task. The traditional way is by means of a simple action consisting of scoring the purchase process experience, including the product or service itself. Scoring the product from 1 to 5 is commonly referred to as a star rating [
20]. Moreover, price can be used as an indicator of customer preferences, and the best way to price a product is to know what consumers would be willing to pay [
21].
However, these methods do not provide enough clarity and do not help customers to purchase products based on a specific feature [
22]. In this way, the quality index of product features strongly influences consumer choices [
23].
Given the current state of information technology, consumers can easily make online purchases and post reviews on social media. This user-generated content may be relied upon by potential customers, thereby influencing future purchasing decisions [
24]. Everybody can easily share their opinions on companies, products, and services with other internet users, and potential customers can easily access these online reviews [
25] in real time. It should be remembered that one of the factors consumers consider in their decision-making processes is word-of-mouth (WOM) [
26]. Thus, measures of eWOM (electronic word-of-mouth) [
27] or online reviews [
28] can be included in marketing-mix models to provide better explanations and predictions of consumer choices and sales. These ratings and comments summarize individual consumer evaluations and act as indicators of product quality [
29,
30]. Furthermore, and even more importantly, they act as a cue to help future consumers determine product or brand attributes [
31]. Such a large volume of constantly generated data is increasingly a big data challenge for businesses [
32].
SA classifies product reviews as positive or negative or other sentiment classes [
8]: polarity classification is the basic task. A recent stream of research focused on applications that are more specialized. One such application is to use opinion mining to determine areas of a product that need to be improved by summarizing product reviews to see what parts of the product are generally considered good or bad by users [
33]. The general opinion about a topic is useful, but it is also important to detect sentiments about individual aspects of the topic [
34]. Furthermore, it is possible to classify customers based on their opinions or improve recommender systems using positive and negative customer feedback.
To analyze all these textual data on reviews, SA can be used. SA in product reviews is the process of exploring these reviews to determine the overall opinion or feeling about a product [
35]. This information is unstructured and is not something that is “machine processable” [
36]. Cambria also exposed that the challenge is huge because an understanding of the explicit and implicit, regular and irregular, and syntactical and semantic language rules is necessary. SA is an avidly researched field with a large number of papers that have been summarized in abundant surveys that have tried to present an overview of the applied techniques and algorithms (e.g., References [
37,
38,
39,
40,
41]). Jandail [
33] showed six types of issues in SA: (1) opposite meanings in particular domains; (2) an interrogative sentence or conditional sentence may not have positive or negative sentiments and may have other sentiment classes (e.g., a neutral sentiments); (3) sarcastic sentences may have the opposite sentiment; (4) sentiment information without using sentiment words; (5) a word can change the feeling polarization in two similar sentences, as well as the fact that for a different person, a sentence may have a different sentiment; (6) natural language semantics may change according to the geographical, cultural, or temporal context. Some researchers have focused on these particular issues [
19,
42,
43,
44,
45,
46,
47,
48].
Cambria et al. [
49] classified the main existing approaches into four categories: keyword spotting, lexical affinity, statistical methods, and concept-based approaches. The keyword spotting approach classifies text by affect categories based on the presence of unambiguous affect words. The lexical affinity approach detects obvious affect words and assigns arbitrary words a probable “affinity” to particular emotions. The statistical methods include Bayesian inference and supervised vector machine (SVM), which is popular for affect text classification. It uses machine-learning algorithms that are trained with a large corpus of affectively annotated texts, and the system learns the affective valence of keywords. The concept-based approaches use web ontologies or semantic networks to accomplish semantic text analysis. All these techniques need to use a sentiment lexicon.
Many studies have focused on analyzing product reviews to get feedback on a product for decision-making purposes. García-Moya et al. [
50] proposed a new methodology based on language models in order to facilitate the portability of the proposal to new domains and languages for the retrieval of product features and opinions from a collection of free-text customer reviews about a product or service. In addition, Singla et al. [
51] classified text as positive, neutral, or negative, although different emotions were also considered (e.g., anger, anticipation, disgust, fear, joy, sadness, surprise, and trust, as well as the traditional positive, negative, and neutral). Paknejad [
52] studied different machine learning approaches to determine the best options for sentiment classification problems for online reviews using product reviews from Amazon. Abbasi et al. [
53] used SVM classifiers for SA with several univariate and multivariate methods for feature selection, reaching 85%–88% accuracy after using the chi-squared method for selecting the relevant attributes in text. A network-based feature selection method, that is, feature relation networks (FRNs), helped to improve the performance of the classifier. Saura et al. [
54] identified key factors in UGC for the creation of successful start-ups by analyzing sentiments with an SVM. This method was applied to identify the start-up topics via the polarity sentiment.
There are several methods that have been used in feature selection, where some are syntactic, based on the syntactic position of the word (such as adjectives); some are univariate, based on each feature’s relation to a specific category; and some are multivariate, based on features subsets [
35]. Archak et al. [
55] used techniques that decompose reviews into segments that evaluate the individual characteristics of a product (e.g., the image quality and battery life of a digital camera). Then, as a major contribution, the authors adapted methods from the econometrics literature, specifically the hedonic regression concept. As mentioned by Chi et al. [
56], existing feature selection techniques compute feature scores solely based on training data statistics or by modifying a specific feature metric formula to include test data information that cannot be generalized to other types of feature metrics, and they proposed combining both techniques (i.e., the training dataset and the feature metric formula). Mars and Gouider [
57] proposed a big data architecture for decision-making, analyzing data and extracting customer opinions about product features. The architecture uses, among other techniques, machine learning, NLP, and big data. To detect the features, they used an ontology that covers features and characteristics of mobile phones in general and in other specific technical terms of electronic products and then extracted feature opinions based on the MapReduced programming model. The feature frequency is most widely used for feature weighting, and there have been many related studies [
58,
59]. Wang et al. [
60] investigated the relevancy between the clustered features and the class in assigning the weights, proposing a method to reduce the size of features by removing irrelevant ones. Zhou et al. [
61] proposed a feature selection approach based on the document frequency of segmented term frequency to eliminate redundant features and retain words with strong class distinguishing ability.
Currently, deep learning approaches have achieved very high performance across many diverse NLP tasks. In Reference [
62], the authors reviewed meaningful deep learning-related paradigms as well as approaches used for NLP tasks. Furthermore, they also supplied an evolution rehearsal. Regarding SA, current studies [
63] exist that have highlighted the importance of extensive phrases and how (in these cases) supervised training, assessment resources, and more powerful models are required.
We conclude this section by emphasizing that our contribution to this state-of-the-art work is not focused on SA techniques but on a combination of quantitative scores given by users, SA scores in a global review, and SA scores on individual characteristics extracted from product reviews (e.g., the positive, neutral, or negative user opinions expressed about product features) in order to assist marketing managers and consumers in their decision-making processes. This combination has not been found in previous works. Our work developed a ranking for the product that classifies its features along with other indicators, such as the price and the sentimental score of the review.
3. The Proposed Methodology Architecture
In this section, we present our proposal (based on the use of SA tools and product feature detection), which focuses on a detailed analysis of the characteristics of consumer reviews.
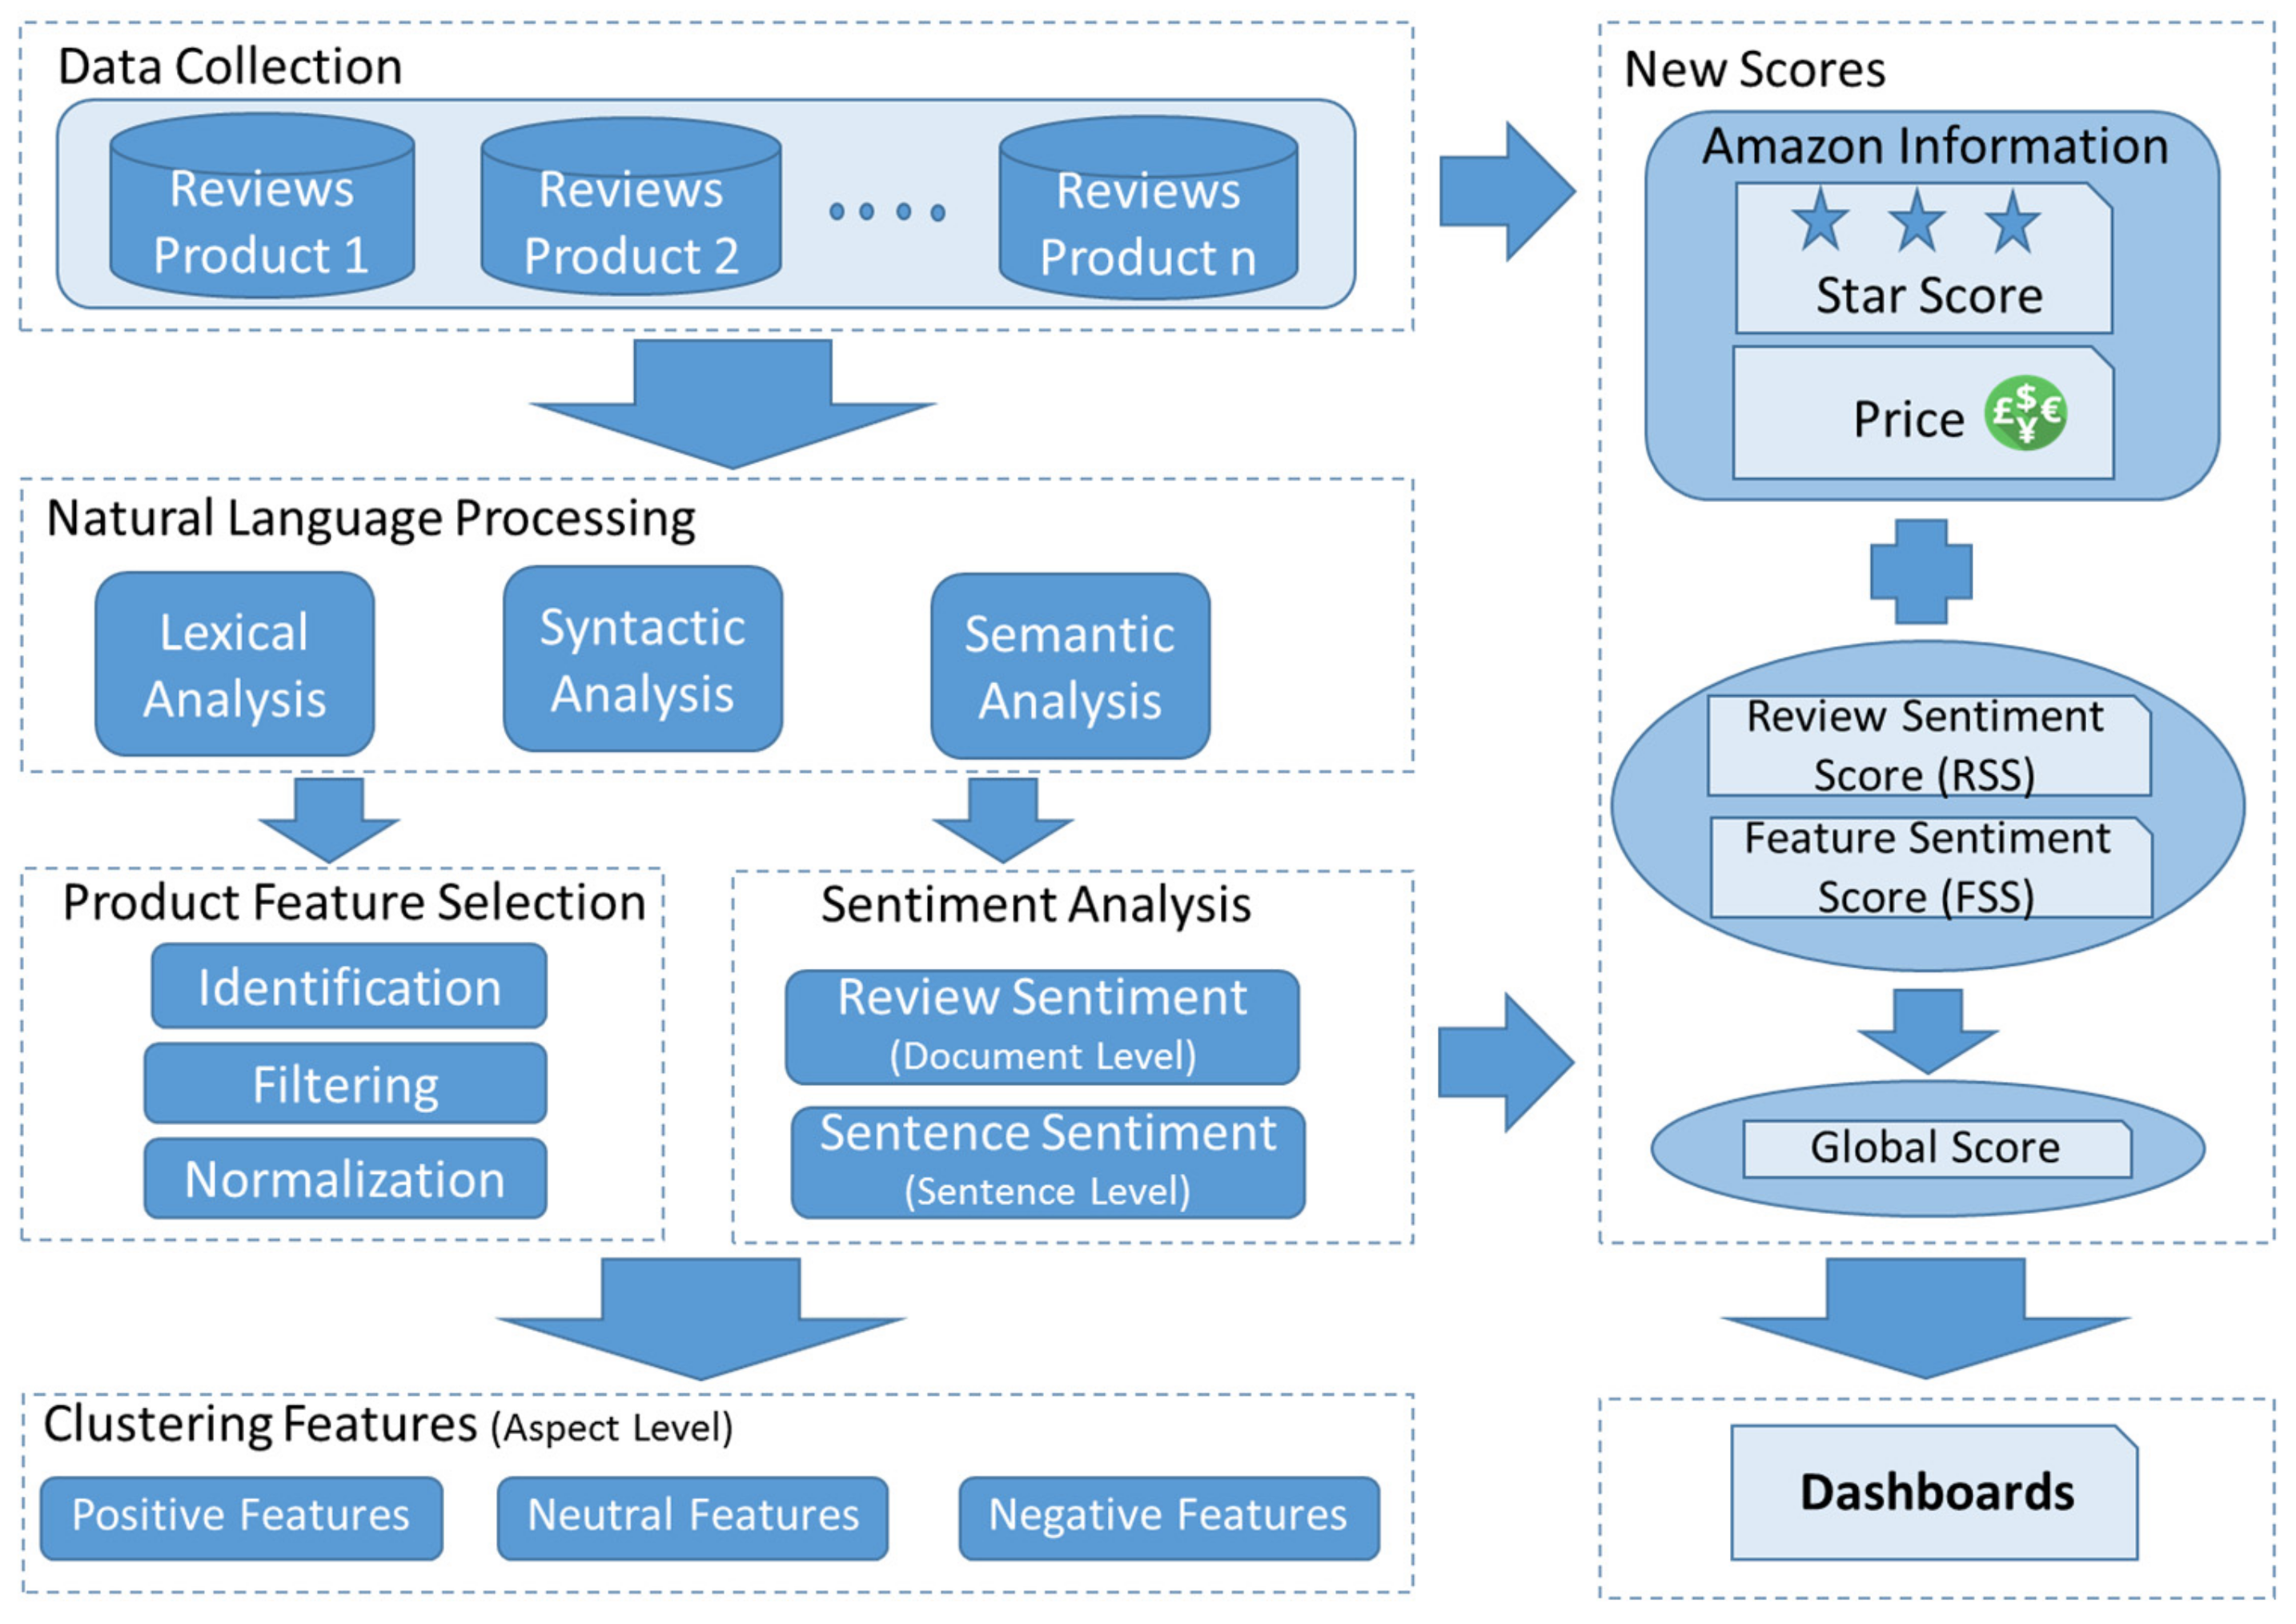
Figure 1 illustrates the proposal.
As shown in the figure, we distinguished seven stages: (1) data collection, (2) review preprocessing using NLP techniques, (3) product feature selection, (4) sentiment analysis, (5) clustering features, (6) new scores, and (7) dashboards.
As previously mentioned, our architecture allows for an analysis of reviews at different levels: (1) In stage 4, SA, the score of the whole review is obtained (document level). The objective is to calculate a global score of the product that measures whether it is liked by people. (2) Moreover, in stage 4, the score for each sentence is calculated (sentence level). The goal is to have a sentence score to find out what buyers like and dislike about the product. (3) Finally, in stage 5, clustering features, the score for each feature is obtained (aspect level) in order to say which ones are positive, neutral, or negative.
Next, we will explain in detail the different stages.
3.1. Data Collection Stage
We had a corpus of product reviews as well as relevant information about each product (for example, the price, the brand, and the categories into which the product is classified). Our proposal analyzes these data and discovers new information that will help managers and users to make decisions regarding the products.
These reviews usually contain an explicit star score assigned by the reviewer, ranging from 1 (bad) to 5 (very good) and a comment in unstructured text. This numerical score is global, relating to the product or the experience of using it, even though the user may not like some specific product characteristics. For instance, the user may qualify a product with 4 or 5 stars, but he/she criticizes some aspect of it. The textual comment has positive, neutral, and negative opinions related to different aspects of the product.
3.2. Review Preprocessing Using NLP Techniques
Using the textual reviews, NLP preprocessing is done. This consists of lexical, syntactic, and semantic analyses. The result of this preprocessing is a tagged word list with part-of-speech (POS) tags (lexical information) and semantic information of the different words. The use of an NLP preprocessing stage has been common in previous works to enrich the input information of general frameworks (for instance, the approaches of Mora et al. [
64] and Peral et al. [
65]).
We proceed in the following way. The words are enriched with their POS tag and syntactic information obtained from the NLP tools. For instance, Freeling [
66], Standford CoreNLP [
67], or Treetagger [
68] may be used. Furthermore, sentiment information is added to the words by means of specialized lexicons. The sentiment lexicon Afinn [
69], an affective word list manually rated between −5 (more negative) and +5 (more positive), may be used to assign a sentiment value to the different words. All of this information is used to calculate the sentiment of a review or sentence in a subsequent stage (SA stage).
In addition, we select the main product features based on the product descriptions. The product descriptions highlight their main features. The NLP tools previously mentioned are used to obtain lexical, syntactic, and semantic information from the product descriptions in order to select the most frequently used nouns and adjectives of these products. With this information, we match selected product features and sentiment scores to rank the positive, neutral, and negative elements. With this ranking, we show relevant information in dashboards about the best products, based on the scored features.
3.3. Product Feature Selection Stage
The identification of the product features was partially based on the methods used by Archak et al. [
55]. These authors used a part-of-speech tagger to annotate each review word with its POS tag, identifying whether the word was a noun, an adjective, a verb, and so on. Nouns and noun phrases are popular candidates for product features, though other constructs (such as verb phrases) can be used as well. Alternative techniques search for statistical patterns in the text, e.g., words and phrases that appear frequently in the reviews. In our experimentation, we used a domain ontology to detect the main product features. We built an ontology on cell phones/mobile phones. This is a list of the principal features of the topic in analysis, in this case, the topic cell phone. Each product has metadata with its product description. In this description, the seller highlights the main features of his own product. Then, we mined (from the product descriptions) the most frequent nouns. This list was filtered to remove irrelevant words. For each review, we selected the features according to the principal feature list. Other methods, such as the latent Dirichlet allocation (LDA) model presented in the work of Saura et al. [
54], can be used to extract the main features.
3.4. Sentiment Analysis Stage
Two scores are calculated in this stage: (a) a global sentiment score for each review and (b) a specific sentiment score for each main feature of the product. In our experimentation, we used the abovementioned affective lexicon Afinn, with 2476 rated words.
The two mentioned scores are obtained using the textual comments of product reviews. In our approach, the following algorithm is applied, which carries out the following tasks: (a) calculating a global sentiment score for each review; (b) splitting the review into phrases and calculating a phrase sentiment score; (c) selecting the main features in all of the reviews of each product; (d) calculating the sentiment score for each main feature that is included in the sentence and selected in the previous task; (e) classifying the opinions as positive, neutral, and negative; and (f) a dashboard display for decision-making. The algorithm will be explained in detail in the case study section. With our proposal, the following analysis can be obtained: the best products of a category, the best products based on particular features, the best features of a product, or word clouds for positive and negative opinions of a product.
The sentiment score of a product is the arithmetic mean of the sentiment scores of all product reviews. The feature-based sentiment score of a product is the arithmetic mean of the sentiment scores of product features. The sentiment score is used as an additional criterion to search for the best products within a product category or within a brand. In addition, the sentiment score of the features is used to determine which product is the best according to the specific attributes of the product.
It is important to mention that our proposal allows for the use of different NLP tools (the abovementioned Freeling, CoreNLP, or Treetagger) to do the preprocessing and other tools to calculate the sentiment scores that provide a sentiment rating for a given sentence (such as CoreNLP, OpeNER [
70], or the GPLSI system [
71]).
3.5. Clustering Features Stage
To evaluate the sentiment polarity of a product feature, the sentiment score of each phrase in which the feature appears is evaluated, and the average of these scores is calculated (Equation (1)). This is done for each product feature. The features are classified as having a positive, neutral, or negative score:
where
P =
feature in
p}.
3.6. New Score Stage
In this stage, two new scores are calculated: the product feature-based score and the product global score. First, the feature-based score is calculated, a new sentiment score of a product averaging the sentiment score of all features of the product, as seen in Equation (2):
where
F =
.
Second, the new feature-based score for a product, which we call the feature sentiment score (FSS), is combined with the price, star score, and review sentiment score (which we call RSS) to calculate a global score for a product (Equation (3)). We assigned a weighting to each variable, considering the following: the most important element for the consumer is the product price, followed by the sentiment score, RSS, and FSS, whose weightings are greater than the star score. For this case study, after several tests, we selected the following weightings: 0.3 for price, 0.25 for the RSS and FSS, and 0.2 for the star score. Since the range of these variables varies widely, they are normalized by using the maximum and minimum score in the same category. The three normalized scores are done using the same
NormalizedScore(product) formula (min–max normalization method):
3.7. Dashboards Stage
In the last stage, the extracted data are shown to the users. There are many possible dashboards available, such as word clouds. These dashboards are very advantageous and have indications of positive/negative features about a product or even the ranking of the top products using the global score. These dashboards are especially appealing for companies in terms of following up on the evolution of their products according to consumer reviews, which can be deeply analyzed.
4. Case Study
In this section, we show the application of our proposal in helping with marketing decision-making. In the first subsection, a data description is shown. The second subsection explains the experimentation that was carried out.
4.1. Data Description
To analyze our proposal, we used big data from amazon reviews. For this research, a dataset was used with product reviews and metadata from Amazon compiled between May 1996 and July 2014. The dataset was retrieved from “Amazon Product Data by Julian McAuley” [
72], at
http://jmcauley.ucsd.edu/data/amazon/ (visited on 15 March 2019). Specifically, we used the corpus about “Cell Phones and Accessories” and particularly the category “Cell Phone”. The case study addressed the need to examine the sustainability of the mobile phone sector [
12]. This is due to the fact that the manufacturing of mobile phones with a short lifecycle has increased sales of these electronic goods [
12], which in turn has produced a negative environmental impact due to the corresponding increase in demand for resources such as coltan, as previously mentioned.
Each review included a star score in the range [
1,
5] and a comment given by the user. They had the following structure, shown with the following sample:
{
“reviewerID”: “A6FGO4TBZ3QFZ”,
“asin”: “3998899561”,
“reviewerName”: “…”,
“reviewText”: “it worked for the first week then it only charge my phone to 20%. it is a waste of money.”,
“overall”: 1.0,
“summary”: “not a good Idea”,
“unixReviewTime”: 1384992000,
“reviewTime”: “11 21, 2013”
}.
We carried out a semiautomatic process for the construction of a mobile feature ontology to identify relevant product features. First, we manually analyzed some product descriptions on product metadata for all cell phone products, and we deduced that these descriptions highlighted the principal features about cell phones. Then, we automatically preprocessed these descriptions using the open source language analysis tool Freeling [
66] to obtain nouns. The most frequent nouns were selected, and some nonthematic words were removed. We obtained 200 words between features and significant thematic words. In this regard, we focused specifically on a detailed analysis of the characteristics of consumer reviews. Additionally, we consulted specific dictionaries, a thesaurus, and some research where mobile ontologies were built [
73,
74], comparing entities and adding some words that were not found automatically. Finally, we manually identified the relationships between the discovered features.
To obtain a quantitative sentiment score expressed in the review’s text (RSS), we studied two tools. The first one used the approach adopted by other research [
75,
76]. It consisted of different stages: (a) splitting the review text into individual words; (b) removing the words that belonged to a stop word list; (c) searching the remaining words in the sentiment lexicon Afinn [
69]; (d) if the word was in the lexicon Afinn, adding the emotional rating of this word; and (e) averaging all of these emotional ratings to get the review sentiment. Equation (4) shows the overall mathematical formula for obtaining the sentiment value of a review in the range [−5,5] using the mentioned approach. The second tool was the NLP tool Standford CoreNLP (
https://stanfordnlp.github.io/CoreNLP/, visited on 15 March 2019). It provides a set of human language technology tools [
67], including SA. With this tool, a sentence classification of Very Negative (=1), Negative, Neutral, Positive, or Very Positive (=5) was obtained. Equation (4) is
where
.
In our case study, we implemented the first approach using R Language (
https://www.r-project.org/about.html, visited on 15 March 2019). Subsequently, we scored the reviews and the products, and we also deduced which were the main positive, neutral, and negative features of a product. CoreNLP is an alternative tool that may be used in our modular architecture.
Due to the fact that the feeling score was in the range of −5 to 5 and the star score was between 1 and 5, we had to normalize both scores in order to compare them. After some experimentation, we concluded that these values were adequate to map the values of sentiment analysis and star rating by the user (see Equation (5)):
where
.
Here is an analysis of a sample review text of the product “B000W09N9W” that was extracted from the corpus: “… This cell phone has passed the proof of time under really really tough conditions. ….Great things: 1. Signal: Superb, I have had many cel phones before, including Nokia which I thing it has a great signal, but HTC TYTN II has much better signal. This one sustains signal in elevators while my nokia can’t…. 3. Screen: Touch screen works really well. Tilting (40 degrees) screen is nice and comfortable to work with when you are writting over the table. 4. Sliding QWERTY keyboard is the main reason to buy it for us who don’t like front keyboards, this makes the phone a little bulky but is great. 5. Plenty of buttons: Has plenty of buttons that make it easy to operate. The 360 degree 3 way jog wheel paired with oK button (left side) is fantastic, great option to operate the phone while you are driving. 6. Setting e-mail/sms accounts was really easy and fast…..Good things: 1. Processor: 400 Mhz, works oK, it is not super-fast but certainly it is not slow. Phone turns on fast (less than 1 minute to operate). 2. Platform: Windows mobile 6 is good. Until date I have had to re-start the phone 3 or 4 times due to system fail (unable to detect end call), besides this it has worked well. 3. Camera 3 mega-pixels: Has good definition, works precisely. 4. HTC Home screen is nice, very interactive. … Not so Good: 1. Camera: Does not has flash, so don’t expect to get good insides pictures. 2. Battery: Weak point, don’t expect your battery to last more than 24 hours, and much less if you use it heavily. Requires car charger, charge through USB. 3. Speaker: It is not so loud…”.
In this review, we found positive features such as signal, screen, processor, platform, keyboard, and camera. In addition, negative features such as battery were identified. The sentiment score in the phrase about the camera was 3, and the keyboard was 2.5. Both were positive sentiments. The features camera and keyboard, therefore, were classified as positive features. The sentiment score in the phrase about the battery was −2. This was a negative sentiment. The battery feature, subsequently, was classified as a negative feature.
In what follows, we apply the algorithm proposed in the SA stage of our architecture (
Section 3) to our example:
- (a)
The RSS for each review was calculated (document level). For this sample review, the RSS was 1.6, which was a positive review. The RSS for this review was close to the average of the RSS scores for all of the reviews of the same product (the RSSes of the products). It was 1.21, which was also a positive score;
- (b)
The reviews were split into phrases, and a phrase sentiment score was calculated (sentence level). This particular review was separated into 44 sentences. For example, a positive sentence was, “Signal: Superb I have had many cel phones before including Nokia which I thing it has a great signal but HTC_TYTN_II has much better signal.” This had a phrase sentiment score of 3.33 using Equation (4). Another example was a negative sentence: “Battery: Weak point do not expect your battery to last more than 24 h and much less if you use it heavily.” This obtained a phrase sentiment score of −2 with Equation (4);
- (c)
The main features in all of the reviews of each product were selected. Finally, a total of 200 features were collected. These lists were filtered, and the most “important” were selected. The selection and filtering of the main product features were made using the abovementioned mobile feature ontology;
- (d)
For each product, a sentiment score for each feature was assigned based on the phrase sentiment score each feature had. In this particular product, “B000W09N9W”, a total of 51 features were collected, of which 50 were positive. The feature “battery” was classified as a negative feature. The FSS of this product was 1.24;
- (e)
The opinions were classified into positive and negative;
- (f)
Dashboards for decision-making were shown.
To help to make decisions, we generated some graphics to summarize valuable information about products and their features.
4.2. Experimentation
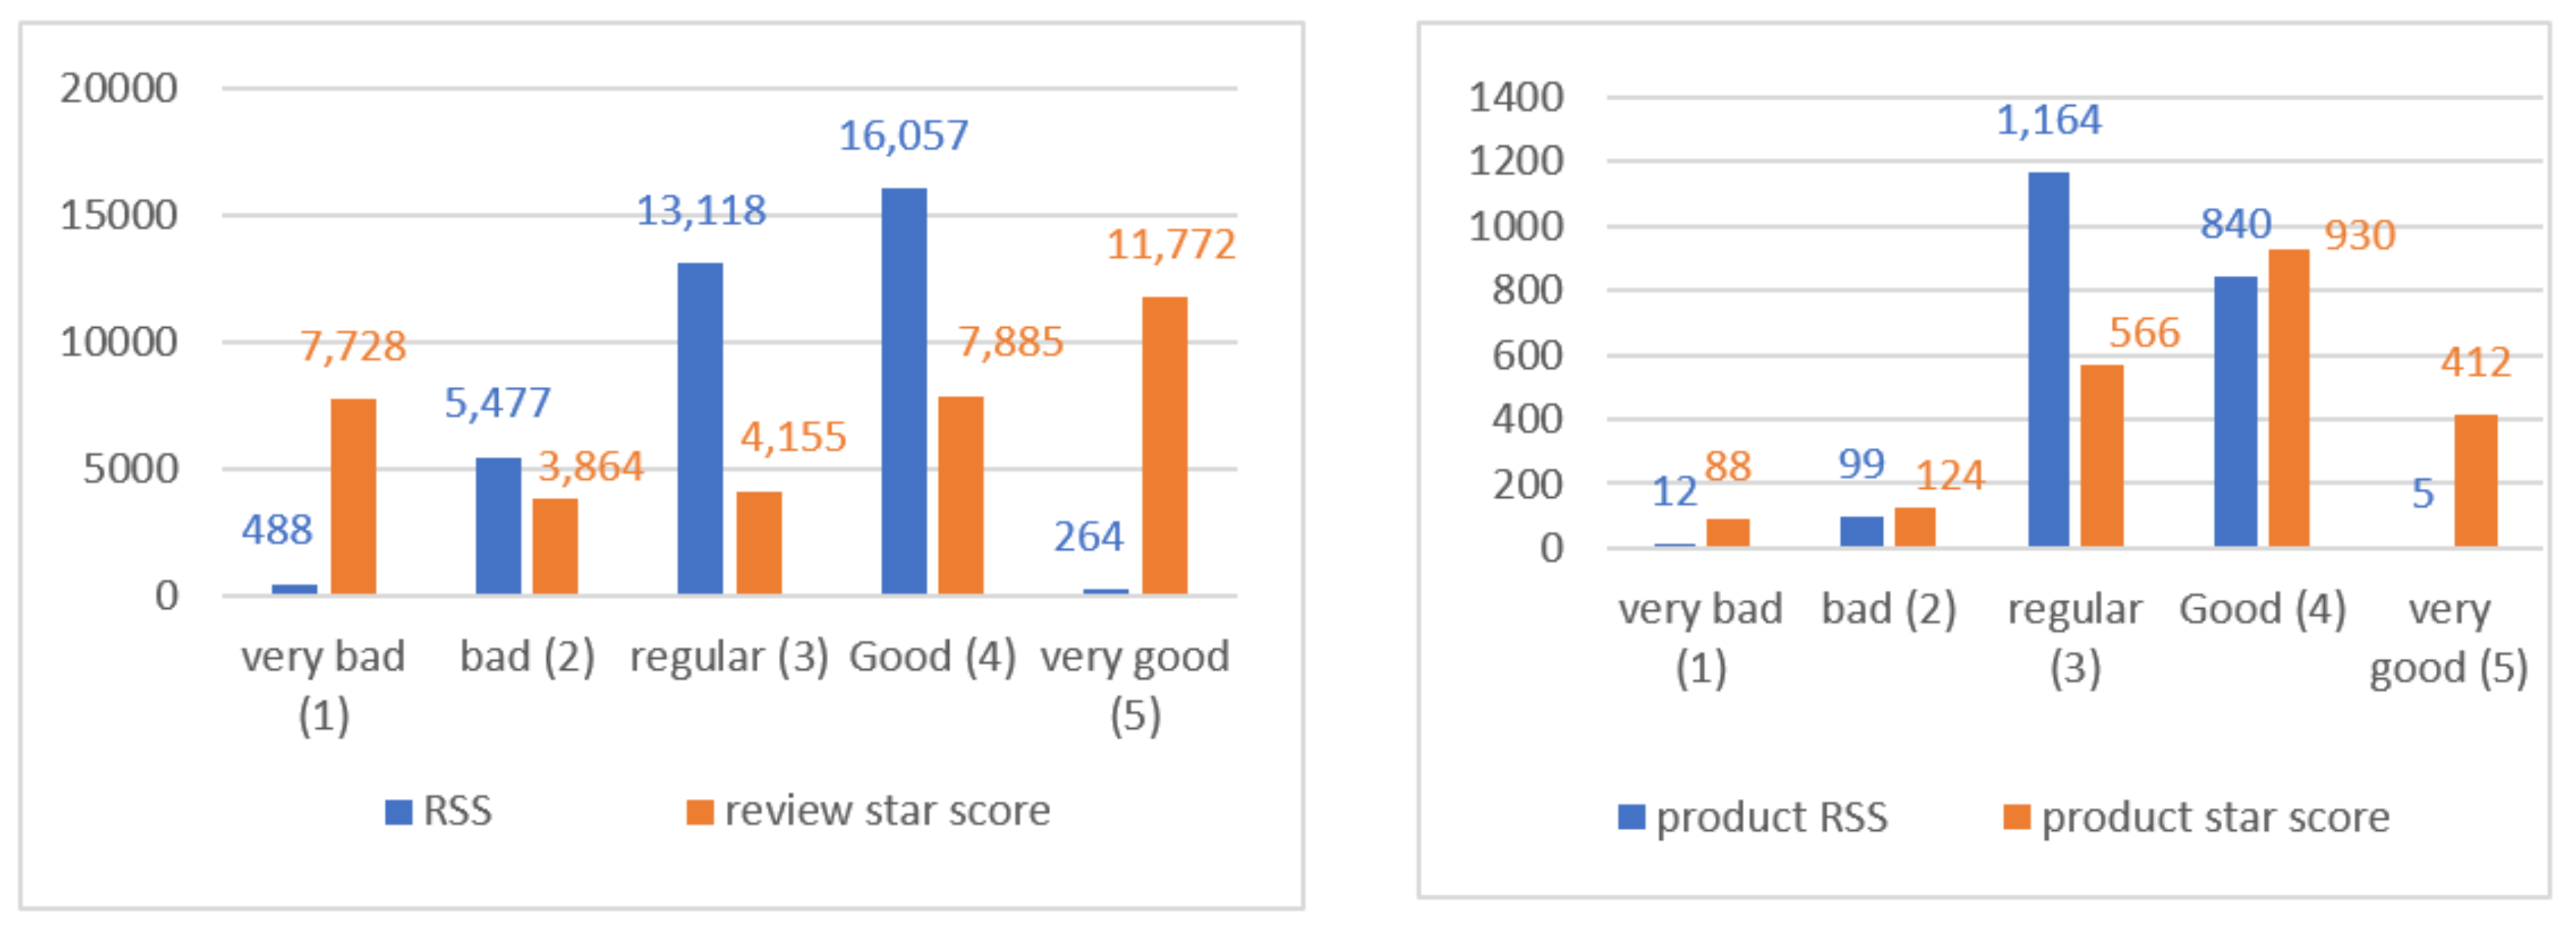
The original corpus was comprised of 600,000 reviews. We specifically filtered the reviews in the category cell phone, and 44,460 reviews were selected. Some of these reviews were irrelevant, as they did not mention any feature about the product itself (they were reviews with general opinions or comments about the service or the seller). These were removed, and 36,452 reviews with 330,330 sentences were kept. SA was applied to all cell phone reviews to obtain their sentiment values. Most of the reviews obtained a star score of 5 and an RSS of 4 (see left-hand side chart of
Figure 2, representing the overall RSS score for all products and comparing it to the review’s star score). In addition, we calculated the RSS score by product and compared it to the star score. Most products received a star score of 4, whereas most products received an RSS of 3 (see right-hand side chart of
Figure 2, representing the proximity of the sentiment score to the star score for each product).
After the experiment, we could conclude that although in general terms the phones were good products or experiences with the product were very good, there were specific details that were criticized, and therefore some negative comments were mentioned. The same occurred for those products that were given a poor RSS with some positive features. These comparisons were made to analyze the correlation between the different scores, showing that there were indeed some differences that could be explained by customer satisfaction with the product as a whole or with parts of the product.
It is important to know that there were products that had a good star score but where the consumer’s opinion was significantly different because these products probably had important features to be analyzed. We included
Table 1, which shows a list of products where the star score and the RSS were very distinct. Then, we selected two specific products to see the detailed features that provoked a significant difference.
For example, regarding the product B0012SK0F4, the table shows that the star score and the RSS of the product were very different. Subsequently, we analyzed the sentiment score of the main product features to identify likes and dislikes. With respect to the product B0012SK0F4, the feature “battery” was bad. With the product B002RD07EW, the problem was the “camera”.
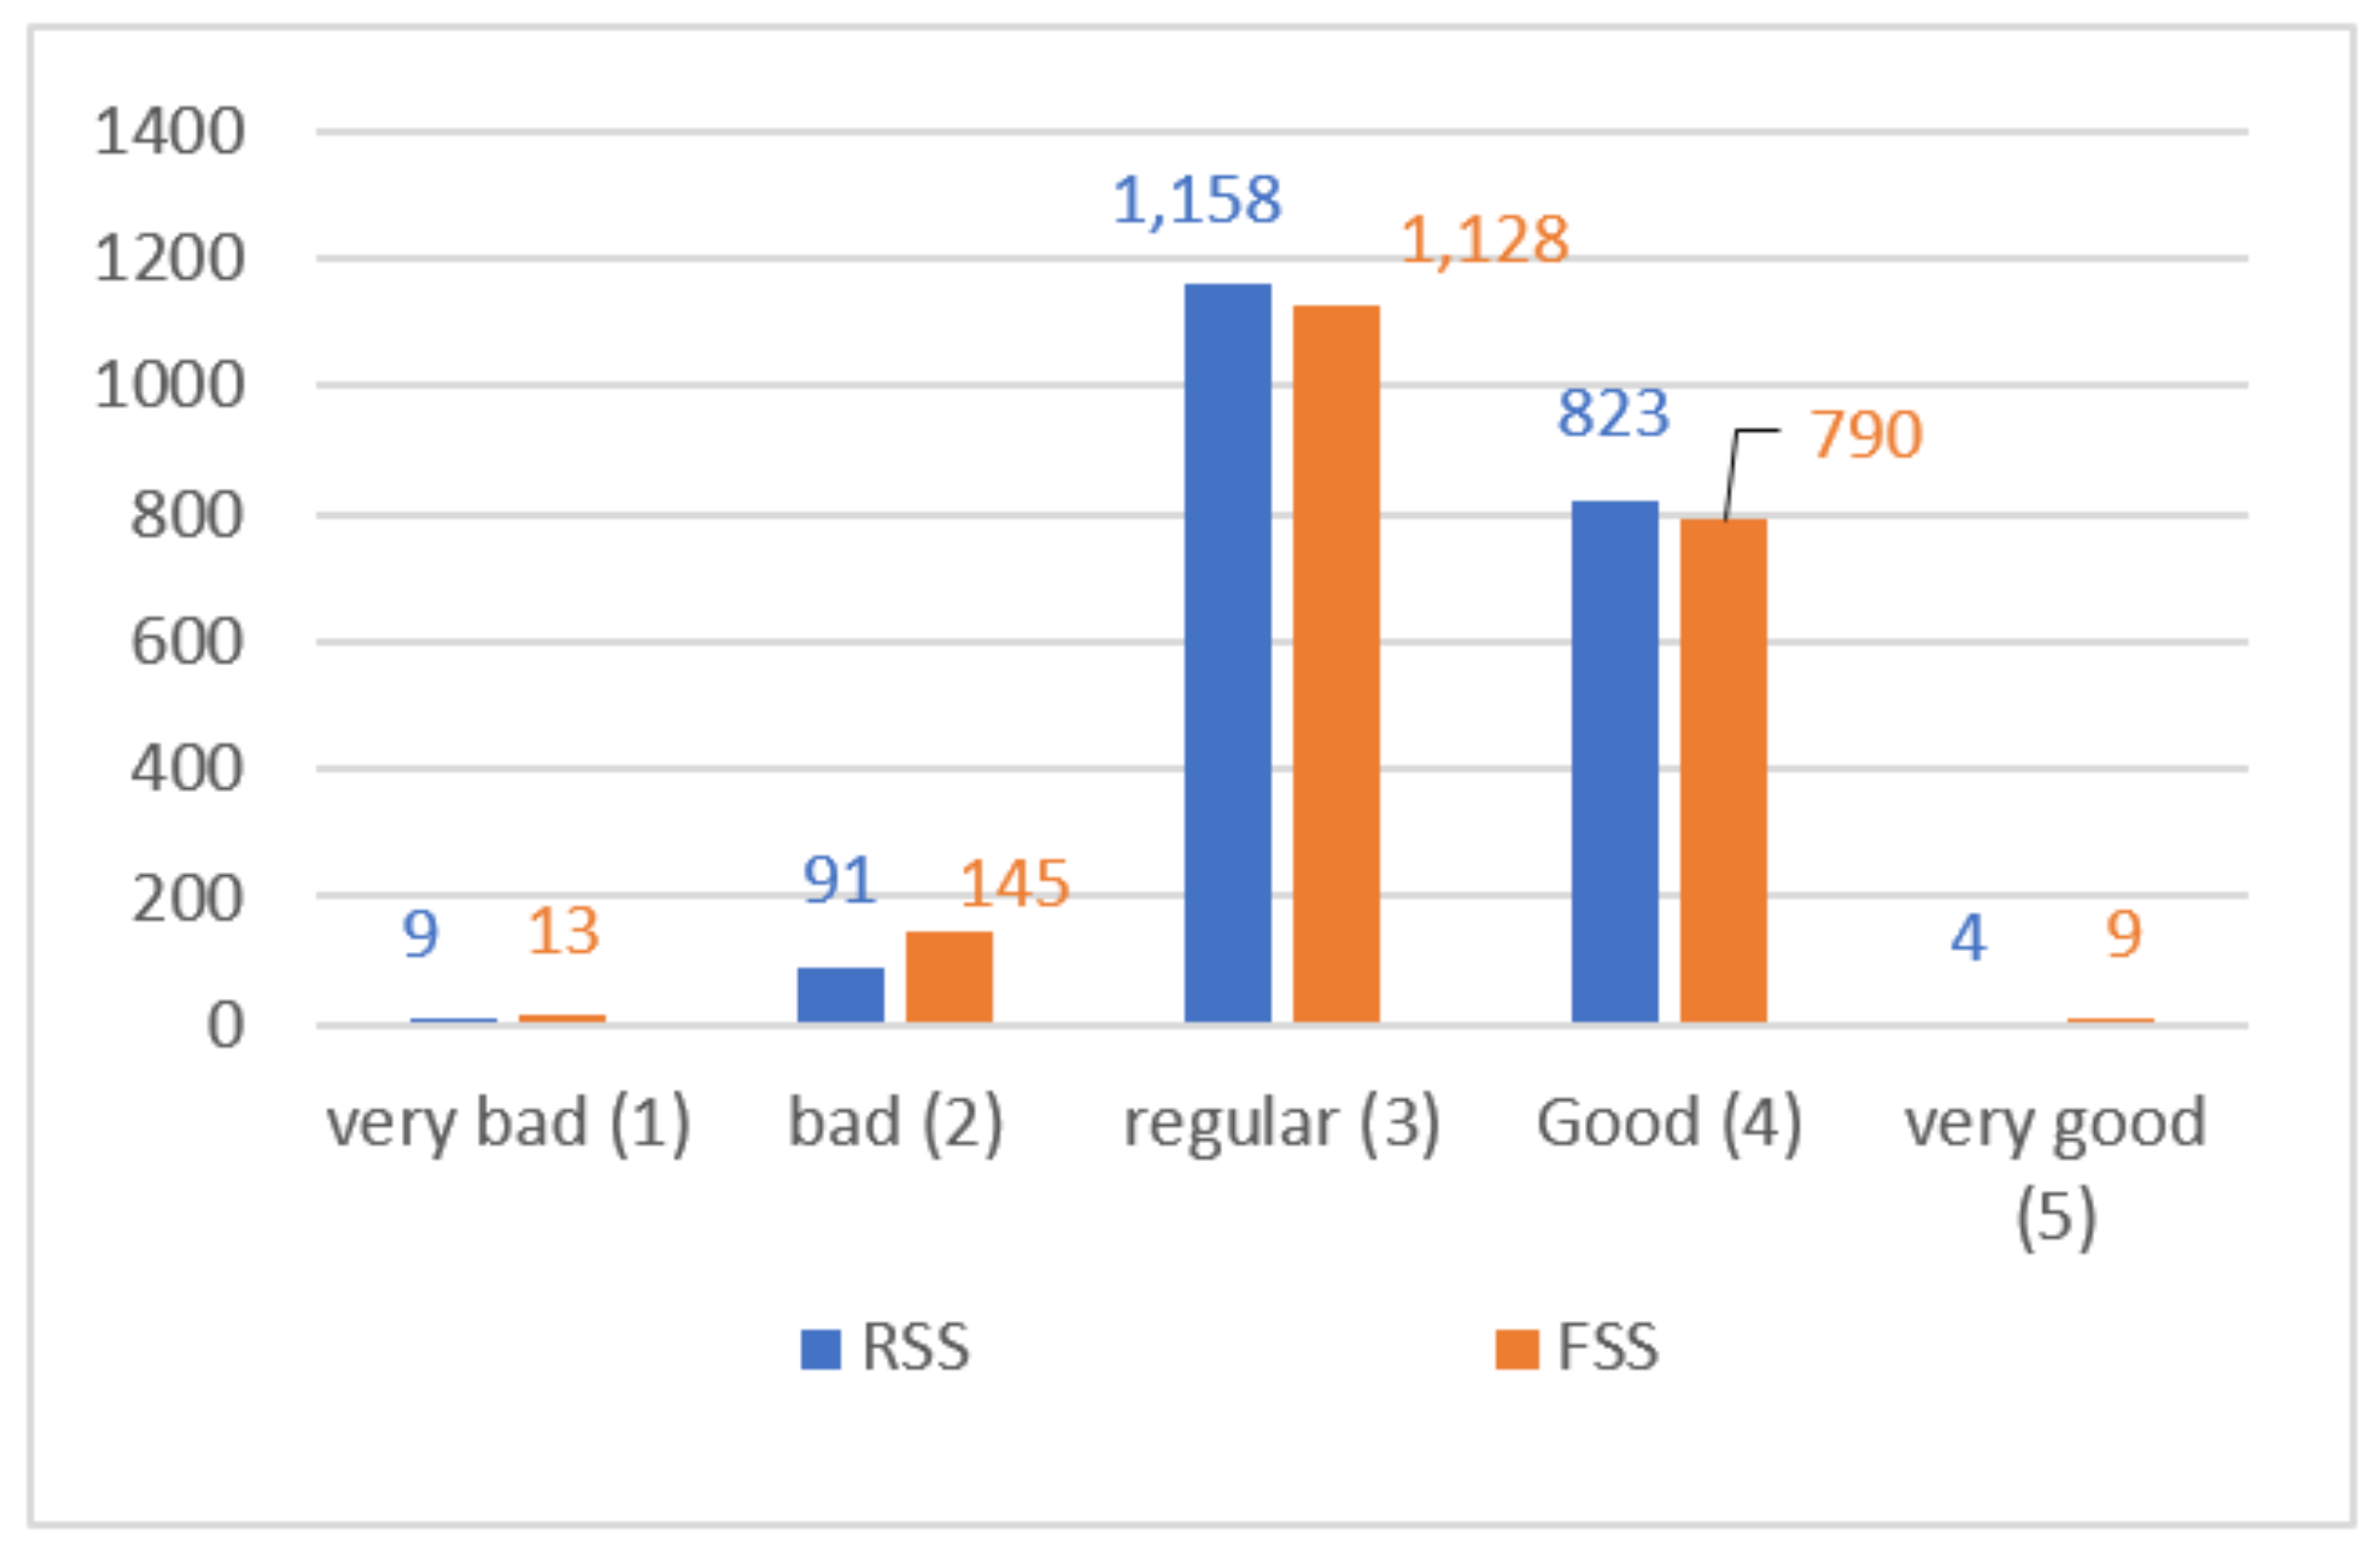
In addition, we compared the RSS to the FSS of products. With this comparison, we wanted to show the difference between customer global opinion and specific opinions about features of the product. In
Figure 3, we show the differences between these scores.
As
Figure 3 demonstrates, there was a high correlation between both scores. After analyzing in detail the results obtained, we verified that in the case of a positive RSS, the FSS score was slightly lower because it factored in negative sentiments detected for some product features. It was also proven in the experimentation that the inverse was detected in the case of a negative RSS, where the FSS score was slightly higher because it factored in positive sentiments detected for some product features.
After an analysis of the results of 2085 products, there were 425 products with different scores: 173 products had better FSSes than RSSes, and 252 products had better RSSes than FSSes.
Finally, we wanted to use together the four measures (the new product global score defined in Equation (3)) to evaluate customer satisfaction with a product: Not just the price or the general feeling about a product, but also the feeling about the characteristics of the product. With this new measure, we were able to rank the products and determine the best recommendations for cell phone products. As previously mentioned, we combined four weighted variables to obtain the global score of the product: (1) the normalized price, (2) the normalized star score, (3) the normalized RSS, and (4) the normalized FSS. Then we used the global score to specify the best products.
Table 2 shows an example for the category “Cell Phone”.
It is important to highlight that the most expensive product was not necessarily the best evaluated, and the best evaluated in stars was not necessarily the best evaluated globally. In this case, the best-scored product was not the most expensive, but it had the best RSS and FSS (4.0). Furthermore, it can be seen that the fifth product was the most expensive, but its RSS and FSS were low.
The clustering of features allowed for some products to be selected, e.g., to discover the best products with a selected feature. In addition, we could find the positive and negative features of a product, or we could obtain the main features that were the most interesting to consumers.
For example, if a customer was interested in a cell phone with a very good camera, we could search the top products with the best sentiment score of the specific feature “camera” (Equation (1)). In
Table 3, we show the five best-scored products based on the feature sentiment score where the specific feature was “camera”.
Furthermore, we could explore the products that had positive and negative features. This search can help managers pay attention to negative features to improve them or highlight positive features. Besides, it provides valuable information in analyzing the positioning of different products on the market. In our experimentation, an example of positive and negative features occurred with the product “B000W09N9W” after an analysis of all of the reviews for this specific product. In that case, we found positive features for “processor”, “signal”, “camera”, and “Bluetooth” and negative features for “battery” and “touchscreen”.
We mined the most-mentioned features in the cell phone category in all of the reviews. The five most-mentioned ones were the following: screen, battery, camera, keyboard, and pictures. Then, considering these main features, we could search for products with some positive and negative features. For instance, we were interested in products that received positive reviews for the camera and negative ones related to the battery. We found the following products: B000W09N9W, B000E7T7JO, B000M3S6ME, B000P6CEYE, B001IWO6IQ, B003EEME8A, B000BYGNUQ, and B001CJNHLC.
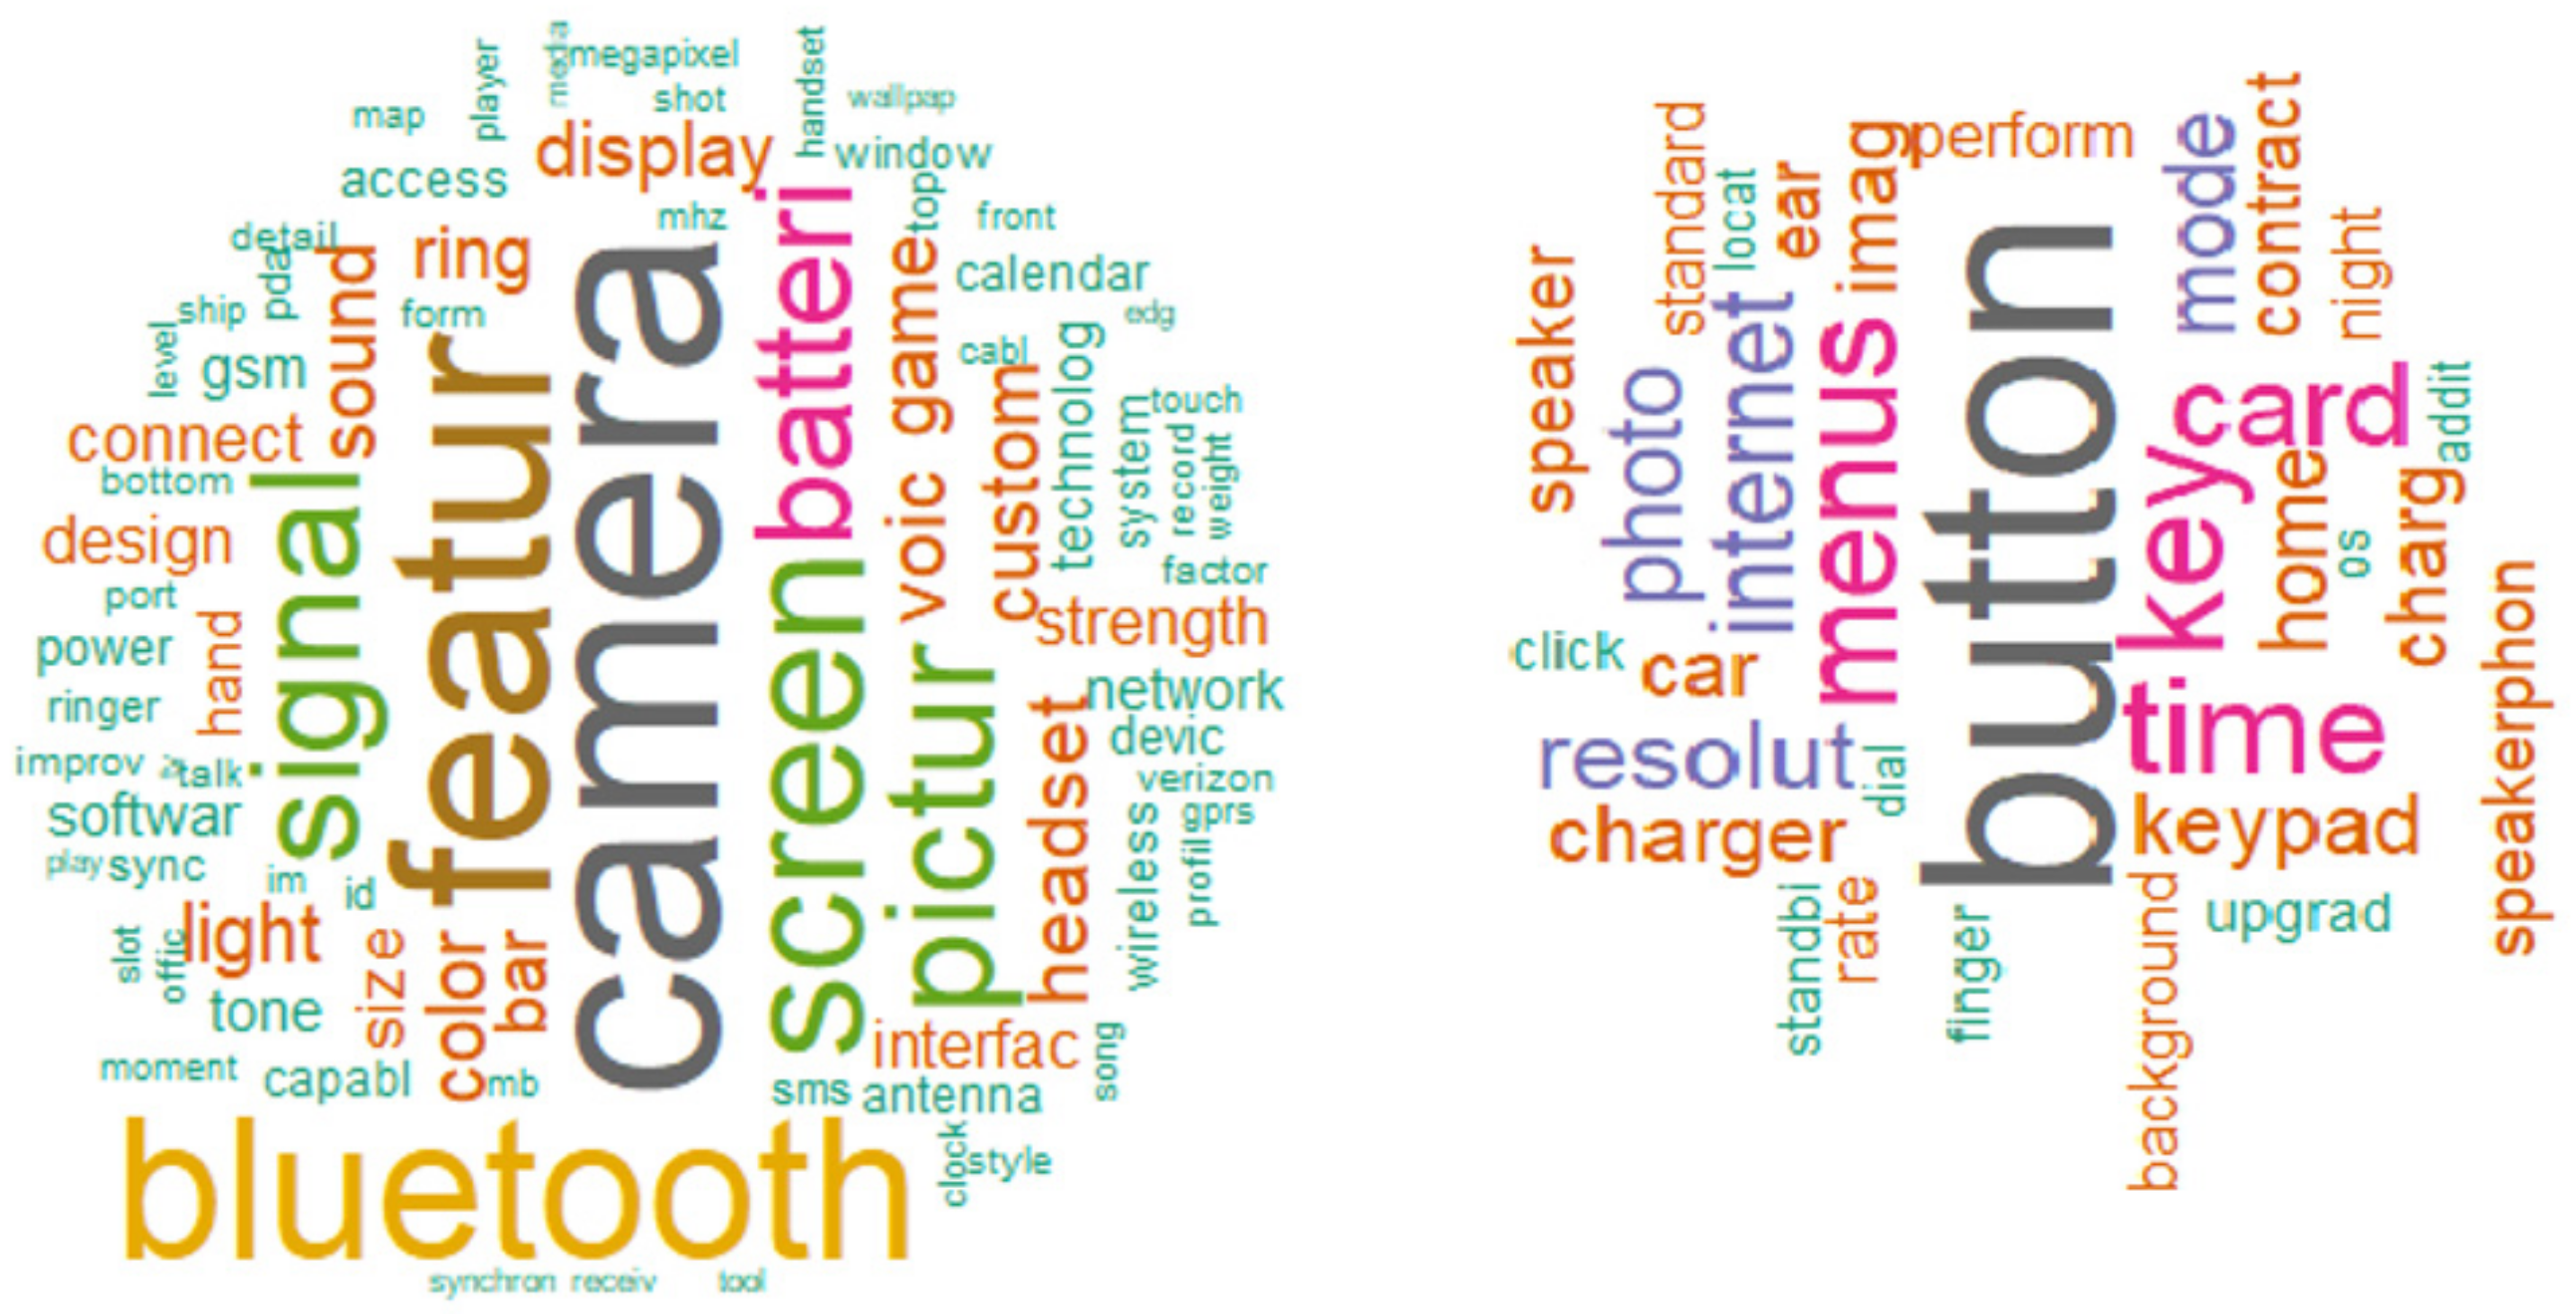
After gathering the positive and negative features, we used word cloud dashboards to clearly show the main liked and disliked features of all of the products analyzed in the case study. These dashboards showed in a graphical way the detailed analysis that obtained the main features of the consumer reviews. For example, the product “B0000AGRYX” had a lot of positive and negative features that we can show using word clouds. We can see that the main positive feature mentioned was the camera and that the main negative feature mentioned was the button (
Figure 4).
5. Conclusions
A company has a sustainable competitive advantage when it creates more economic value than a marginal firm in its industry and when other firms are unable to duplicate the benefits of this strategy [
77]. In this sense, Kiron et al. [
78] identified big data analytics as a significant dimension to explore for achieving a sustainable competitive advantage. In the same line, Dolores et al. [
79] highlighted that activities aimed at building a firm’s intangible value create business benefits and sustainability.
Within this context, the approach presented in this study focuses on the importance of managers in factoring in consumer opinions expressed on the internet to gain a better understanding of consumer needs and demands. In fact, new technologies are transforming how companies do business by improving the lifecycle management of their products [
80]. Particularly, the internet offers a promising way to reveal consumer opinions on the products they buy as well as the whole consumer experience. The continuous stream of UGC over time provides a huge amount of information that can be employed to help decision-making in the marketing field.
This paper proposes a further step in the application of sentiment analysis to decision-making by adding product feature selection and calculating additional information from online reviews. By mining the text of user-generated online reviews and increasing the granularity of the analysis at a sentence level, our proposal would help managers and users to make better decisions in analyzing their products and purchases.
Our proposal focuses on SA techniques and on the application of NLP tools to marketing decision-making. Customer preferences according to star and sentiment scores are analyzed. Subsequently, the negative and positive features of the reviewed products are identified. We reviewed some algorithms to detect the features of products, and they were adapted to improve the information that is shown in the dashboards. An analysis of consumer perceptions reveals what products feature differentiated positions in the minds of consumers. Moreover, the employment of word clouds allows us to visualize the most important features mentioned by consumers.
We can carry out (1) a global sentiment analysis in the review (document level) that allows us to measure whether the product is liked by people, (2) an analysis of different phrases (sentence level) to find out what buyers like and dislike about a product, and (3) an extraction of positive/negative product features (aspect level).
We put into practice the proposal on a corpus of reviews of cell phone products extracted from Amazon. Our analysis showed that star scores represented a general user’s viewpoint about the product, but that in a review the user could highlight specific features that he/she liked or disliked. It should be recalled that customer preferences for a product are driven by different product features and the value that he/she attaches to these attributes [
81]. Thus, analyzing a consumer’s opinion in relation to these specific features is of great interest for managers. It is consumer perception of a brand that determines the value the brand has in terms of these attributes.
This procedure will help managers to better understand the positioning of the products of their firm. In fact, the market structure analysis begins with a predetermined set of attributes and their underlying dimensions and assumes that consumers differ in their evaluations of product attributes [
81,
82]. With the methodology employed in this paper, we show the opinion of consumers in relation to the main features of a product. These consumer perceptions reflect the similarities and differences between products and brands, helping marketing managers depict the market structure and brand positioning. Furthermore, this framework could be employed to diminish the eco-footprint of the mobile sector and increase its long-term sustainability. In fact, if marketing managers understand what consumers think about the products they buy and experience, they will have the necessary information to increase customer satisfaction in relation to a product. Eventually, this could increase the lifecycle of mobile phones and reduce the consumption of the raw materials needed to produce these products.
The main contributions of our research are the following: (1) a definition of a general architecture using sentiment analysis and text data mining to identify a product’s main positive/negative features; (2) a combination of price, star score, sentiment score of a review, and sentiment score based on product features to rank each product and assist marketing managers and consumers in their decision-making processes; (3) an analysis of the characteristics of a consumer’s review using visualization techniques such as dashboards.
We propose that future work consider using other types of corpora to validate our proposal. Furthermore, we must consider n-gram features and the positive as well as negative qualifiers of features. This study had some specific limitations. First, the sentiment analysis was performed with the Afinn lexicon. Despite this lexicon being well recognized in this field, a different sentiment analysis tool could obtain different results. Second, the main features of the product were manually derived from product descriptions and processed with the open source language analysis tool Freeling. Although these features were double-checked and described the main characteristics of the product, a different procedure could obtain a different ontology for these descriptions.

 ,
, 


