Warranty Period Decision and Coordination in Closed-Loop Supply Chains Considering Remanufacturing and Consumer Behavior

1
School of Management Science and Engineering, Nanjing University of Information Science and Technology, Nanjing 210044, China
2
ChangWang School of Honors, Nanjing University of Information Science and Technology, Nanjing 210044, China
*
Author to whom correspondence should be addressed.
Sustainability 2019, 11(15), 4237; https://0-doi-org.brum.beds.ac.uk/10.3390/su11154237
Submission received: 7 June 2019
/
Revised: 16 July 2019
/
Accepted: 25 July 2019
/
Published: 5 August 2019
(This article belongs to the Special Issue Optimal Decisions and Risk Assessment in Sustainable Supply Chains)
Abstract
:The closed-loop supply chain management model is an effective way to promote sustainable economic development and environmental protection. Increasing the sales volume of remanufactured products to stimulate green growth is a key issue in the development of closed-loop supply chains. By designing an effective warranty strategy, customer’s perceived value can be enhanced and market demand can be stimulated. This study cuts through the warranty period of closed-loop supply chain products. Based on the perspective of consumer behavior, game theory is used to construct the optimal decision-making model for closed-loop supply chains. The optimal warranty decision making for new products and remanufactured products under centralized and decentralized decision-making models is discussed. Further, the impact of the closed-loop supply chain system with warranty services and the design of contract coordination is also shown. We show that consumer preference has a positive impact on the sales of remanufactured products and the profits of enterprises; with the extension of the new product and remanufacturing warranty period, the profit of the supply chain system first increases and then decreases, and the value is maximized at the extreme point in the manufacturer-led decision-making model. Furthermore, the leader gains higher profits with bargaining power, but the profit of the supply chain system under decentralized decision model is less than that of the centralized decision model, reflecting the double marginalization effect. The revenue sharing contract and the two-charge contract designed in this study coordinate the closed-loop supply chain system with warranty services, so that the member companies in the supply chain can achieve Pareto improvement.
1. Introduction
Technological advances and increased market demand have led to an accelerated entry of new products into the market, while generating a large number of used products. Since end-of-life (EOL) products contain environmentally harmful substances (e.g., arsenic, cadmium, lead, etc.), the ecological problems caused by the improper disposal of EOL products have become serious. Conversely, EOL products promote environmental sustainability and green growth through the valuable and recyclable raw materials they provide (Song et al.; Tseng et al. [1,2]). Globally, many relevant regulations and directives, such as the European Union’s Waste Electrical and Electronic Equipment Directive, explicitly require manufacturers to assume responsibility for the proper recovery and disposal of EOL products, recycle the residual value of the product, and increase resource utilization. These policies are intended to regulate market entities as much as possible. Even without policy directives, driven by environmental activism and performance factors, companies are recycling their waste products to take full advantage of their economic potential and enhance the company’s green brand image. Green growth is imperative in light of current environmental crises and resource depletion, and commonly regarded as an important path to tackle resource and environmental crises, and fulfill the sustainable, balanced, and compatible development of society and economy (Lv et al. [3]). Constructing and improving the recycling system of waste products is an inevitable choice in achieving sustainable resource management.
The closed-loop supply chain model of “resources–products–waste products–remanufactured products” enables waste products to be professionally restored to the same quality and performance as new products and is considered to be the most valuable product recycling method. Compared with new products, remanufactured products can save costs by 50%, energy by 60%, and materials by 70%, and reduce pollutant emissions by more than 80% (Ostojic [4]). Remanufacturing has now become a business and an important strategy for sustainable development (for example, remanufacturing is a “strategic emerging industry” in China’s 13th Five-Year Plan). Many companies, including Hewlett-Packard, Epson, IBM, and Xerox, have created a huge competitive advantage for themselves through remanufacturing. The value of remanufactured products is primarily achieved through resale. According to the US International Trade Commission data, the sale of US remanufactured products was $43 billion in 2011, accounting for 2% of the annual manufacturing sales (United, 2012). However, remanufacturing, while showing enormous economic and environmental value, has also created a series of dilemmas (Mai et al. [5]). Since the quality of remanufactured products cannot be fully evaluated before purchase, consumers have different willingness to pay (WTP) for remanufactured products and new products, which limits the remanufacturing system’s revenue capacity and the ability to stimulate remanufacturing. This problem of low market demand needs to be resolved if green growth is to increase.
As a signal mechanism, warranty is the obligation or paid guarantee provided by the guarantor, such as the manufacturer, retailer, or supply chain system, to the consumer for the technical performance, use effect, and maintenance of the product during product sales. Warranty can be a valuable tool in marketing since it can enable faster green growth. Firstly, consumers can rely on the warranty to predict the quality of remanufactured products to protect their rights. Secondly, warranty can be one of the indicators of remanufactured product reliability, which can reduce consumer risk. Thirdly, effective warranty policies can enhance the perceived customer value and stimulate market demand (Alqahtani et al. [6]). Automobile manufacturers Chrysler, Ford, and Japanese companies engaged in “warranty wars” to increase their respective sales (Liao et al. [7]). The warranty period for a product is very important to the supply chain. Logically, the length of the warranty period and the reliability of the product (related to its life-cycle) play a key role in determining the total cost of the product, and these additional costs have a significant impact on the total profit of the supply chain. A satisfactory warranty policy increases consumers’ willingness to purchase remanufactured products while contributing to sustainability and resource efficiency. However, the supply chain must balance the warranty inputs and benefits to maximize efficiency. Therefore, our warranty on remanufactured products introduces consumer factors and we believe that the perceived value of consumers is related to the warranty duration. The purpose of this paper is to explore the impact of different conditions of warranty costs on supply chain operations decisions, production decisions, and performance.
This paper examines how supply chains make trade-offs between the product’s warranty period and the supply chain revenue to maximize benefits. In the remanufacturing industry, the length of the remanufactured product’s warranty period (related to the remanufactured product failure rate) plays a key role in determining the total cost of the product. Generally speaking, the longer is the warranty period, the higher is the warranty cost. Establishing an optimal warranty period will significantly affect closed-loop supply chain performance. We provide insights into the following questions. (1) How does consumer behavior affect the closed-loop supply chain market demand for warranty services to stimulate green growth? (2) How do the member companies in the supply chain formulate optimal warranty period decisions to balance inputs and costs to achieve profit maximization? (3) In the closed-loop supply chain with warranty services, how do the member companies choose the coordination contract to achieve optimal profit for the supply chain system?
This paper constructs a single-stage closed-loop supply chain model based on game theory and studies the different warranty decision cases under decentralized M-R decision (Manufacturer as the leader), decentralized R-M decision (Retailer as the leader), and centralized models to solve the above-mentioned problems. The manufacturer is the warranty provider in a supply chain system. Firstly, by expanding the consumer utility function to construct a closed-loop supply chain market demand model with warranty services and comparing the changes in green growth performance under under each model. Secondly, by constructing the target profit function and solving the optimal equilibrium solution, this paper compares and analyzes the optimal pricing decision of products (new and remanufactured) under each model and the impact of warranty period decision on the revenue of supply chain system. Finally, by designing a revenue sharing contract to coordinate the double marginalization generated by closed-loop supply chain, the efficiency of the supply chain warranty and consumer confidence in the purchase of remanufactured products is maximized, thereby stimulating the realization of the potential value of remanufacturing, which can contribute to green growth. The effect is to maximize the efficiency of the supply chain warranty and consumer confidence in the purchase of remanufactured products.
The impact of warranty maturity decisions on optimal profits in a closed-loop supply chain will be significant for economic growth and environmental sustainability. This paper deals with the relationship between consumer preferences and supply chain performance under game theory. The remainder of this paper is organized as follows. Section 2 gives a literature review of theoretical and empirical research related to sustainable development and closed-loop supply chain management, warranty operational decisions, and consumer behavior. We present problem descriptions and model assumptions in Section 3. The mathematical model of closed-loop supply chain decision-making and coordination is shown in Section 4. Section 5 presents the numerical simulation and numerical analysis to show the application of the model. Finally, the conclusion and future research direction are given in the Section 6.
2. Literature Review
This section reviews the literature on the three issues related to closed-loop supply chains with warranty services and warranty decisions. Firstly, this section describes the relevant literature on sustainable development and closed-loop supply chain management. Secondly, it analyzes the relevant literature on the operational decision making of warranties. Thirdly, it reviews the related research on consumer purchase behavior.
2.1. Sustainable Development and Closed-Loop Supply Chain Management
Political and sustainability agreements are increasingly in place to prevent major negative consequences from the human economic impact and weather effects. Sustainability is the limits imposed by technology and social organizations on the ability of the environment to meet current and future capabilities [8,9]. Zsyman et al. [10] pointed out that green development is now the core theme in international climate change negotiations. The Europe 2020 strategy has identified green development as a basic pillar of the EU’s economic policy. Talens et al. [11] discussed how to incorporate the results into the EU product policy to help achieve some of the goals of the European Commission’s circular economy plan. Saidani et al. [12] classified the circular economy indicators to guide future research on the implementation of cyclical indicators and circular economy. The closed-loop supply chain management model is an important support for the green development concept. Many scholars have researched closed-loop supply chain management. The closed-loop supply chain related issues related to this paper are mainly product pricing and coordination decision making. Savaskan et al. [13] studied the pricing strategies and system efficiencies of three different receivables structures under demand determination. They concluded that the seller is responsible for the recycling of waste products in the most effective way. Shi et al. [14] examined the problem of product recovery mode selection in a closed-loop supply chain consisting of manufacturers and distributors and analyzed the order price and income under the no-pass mode. De et al. [15] studied the pricing problem of recycling channels in the closed-loop supply chain channels for government subsidized products and compared the impact of different subsidy object influence factors on the profit and pricing of each product. Luo et al. [16] studied two brand manufacturers through a unified pricing model under horizontal and vertical competition where the distributors sell products and analyzed the impact of different power structures on product pricing. Zhou et al. [17] analyzed the pricing and benefit distribution of a three-stage closed-loop supply chain system using game theory, combined with the impact of third-party logistics service level. Their results show that: (1) the total returns of the closed-loop supply chain in the joint decision scenario is much higher than in the independent decision scenario; and (2) based on the Nash negotiation model, the benefits for the closed-loop supply chain members in the joint decision scenario greatly exceed those of independent decision scenario. Wang et al. [18] expanded on the effectiveness of the reward and punishment mechanism (RPM) in the two-phase closed-loop supply chain. Parsaeifar et al. [19] developed mathematical models of non-cooperative and concentrated scenarios to characterize pricing decisions and remanufacturing strategies and coordinate the overall supply chain performance, in addition to providing manufacturers with a three-way discount mechanism to achieve win–win results for the channel members. Regarding supply chain contract coordination, Ranjan et al. [20] considered the service factors in a closed-loop supply chain based on consumer behavior and used revenue-sharing and two-charge contracts to make the supply chain system under decentralized decision-making achieve a Pareto improvement. Amin et al. [21] considered the global factors, including exchange rate and tariffs to propose a mathematical model for closed-loop supply chain network. The model considers global factors, multi-objectives, and uncertainties in a closed-loop supply chain network. Li et al. [22] studied a three-level reverse supply chain consisting of recyclers, remanufacturers, and two fully information-sharing distributors. In the coordination strategy of different supply chain entities, four different coordination strategies were discussed and the optimal decisions of different models are compared and analyzed in detail. We considered consumer behavior theory in the decision-making model of a closed-loop supply chain and studied the operational decisions of closed-loop supply chain from the perspective of warranty operation decision making.
2.2. Warranty Operational Decisions
Research on warranty operational decisions mainly concentrated in two streams: warranty period and product life-cycle. Bian et al. [23] studied the warranty strategy in a two-stage supply chain consisting of manufacturers and two competing retailers and used a game model to explore the interaction between the two warranties and the competition between the retailers. Wu et al. [24] analyzed the optimal warranty decision problem under each game model based on network externality perspective and designed an improved revenue sharing contract to coordinate the double marginalization effect that results in inefficiency for a closed-loop supply chain with warranty service. The supply chain system was Pareto improved. Arabi et al. [25] determined the best warranty period from the perspective of producers and consumers to minimize the total cost of use and increase service life. Wang et al. [26] investigated the cooperative and non-cooperative interactions between manufacturers and consumers based on base warranty and extended warranty. Using the basic warranty period, they proposed a new upgrade model where the cost of preventive maintenance is shared by both parties. For the extended warranty period, two upgrade models were built and the benefit sharing utility was analyzed using game theory to find the extreme profit maximization and cost minimization points for each party. Lan et al. [27] discussed the influence of product price and quality on the formulation of warranty strategy in a fuzzy supply chain based on three types of warranty. Using game theory, Esmaeili et al. [28] constructed two extended service models under different supply chains and discussed the dominant decision-making problems of the market participants in the product market and the warranty market under a decentralized decision-making mechanism of supply chain. Xu et al. [29] considered the issue of bundled pricing of durable consumer goods with warranty services under monopoly and duopoly market structures. Based on the above literature on warranty decision making, it is found that there are few studies on the coordination of supply chain systems when strong retailers provide extended warranty services. We comprehensively examine the optimal decision-making combination for the closed-loop supply chain warranty entity and warranty channel.
2.3. Consumer Behavior
In terms of consumer behavior, Lei et al. [30] found that companies dynamically price their products and warranty services over time and consumers determine the reliability of products based on warranty prices. In a sense, the consumer’s buying beliefs are consistent with the company’s warranty policy. Wang et al. [31] provided a theoretical basis for understanding remanufactured product-related consumer values. Genc et al. [32] studied several consumer returns for second-hand products based on product prices and discounts within the framework of a closed-loop supply chain. They also showed how consumer behavior affects the dynamic nature of the game. Zhu et al. [33], using Stackelberg game theory, found that consumers pay attention to service level when purchasing electronic products and the degree of consumer preference affects pricing decisions for new products and remanufactured and refurbished products. Bai et al. [34] discussed the impact of recycling services on new mobile phone sales from a consumer perspective in the context of a closed-loop supply chain and introduced the key impact factors of Chinese consumers’ attitudes and behaviors. Wu et al. [35] found that consumers’ perceptions of product innovations evolve over time. Liao et al. [36] seized consumer neutral and disgusting consumption and the two types of consumer valuation and demand uncertainty, through game theory to solve the problem of closed-loop supply chain and remanufacturing and introduced utility functions to analyze market demand and determine the optimal pricing and channel strategy for manufacturers’ profit maximization. We identify changes in the warranty strategy between new and remanufactured products based on the consumer behavior theory, which has been given little attention in the aforementioned studies.
In summary, scholars have studied the decision making for warranty operations in the traditional supply chain market. However, the integration of the warranty system into the closed-loop supply chain system is still hobbled by decision-making optimization problems. The reality of remanufacturing warranty decision needs further study. Consumer behavior directly affects market capacity and the literature on closed-loop supply chains often ignores the impact of consumer behavior factors on market demand. Therefore, this paper considers the difference between the warranty cost for new and remanufactured products and expands the consumer utility function from the perspective of consumer behavior to compare and analyze manufacturers, retailers, and supply chain systems under centralized and decentralized decision making models and examines the profit change in closed-loop supply chain system through optimal warranty period decision making. Using revenue-sharing contract, we further analyze the influence of consumer preference factors in the system to achieve Pareto improvements.
3. Problem Description and Model Hypothesis
3.1. Problem Description
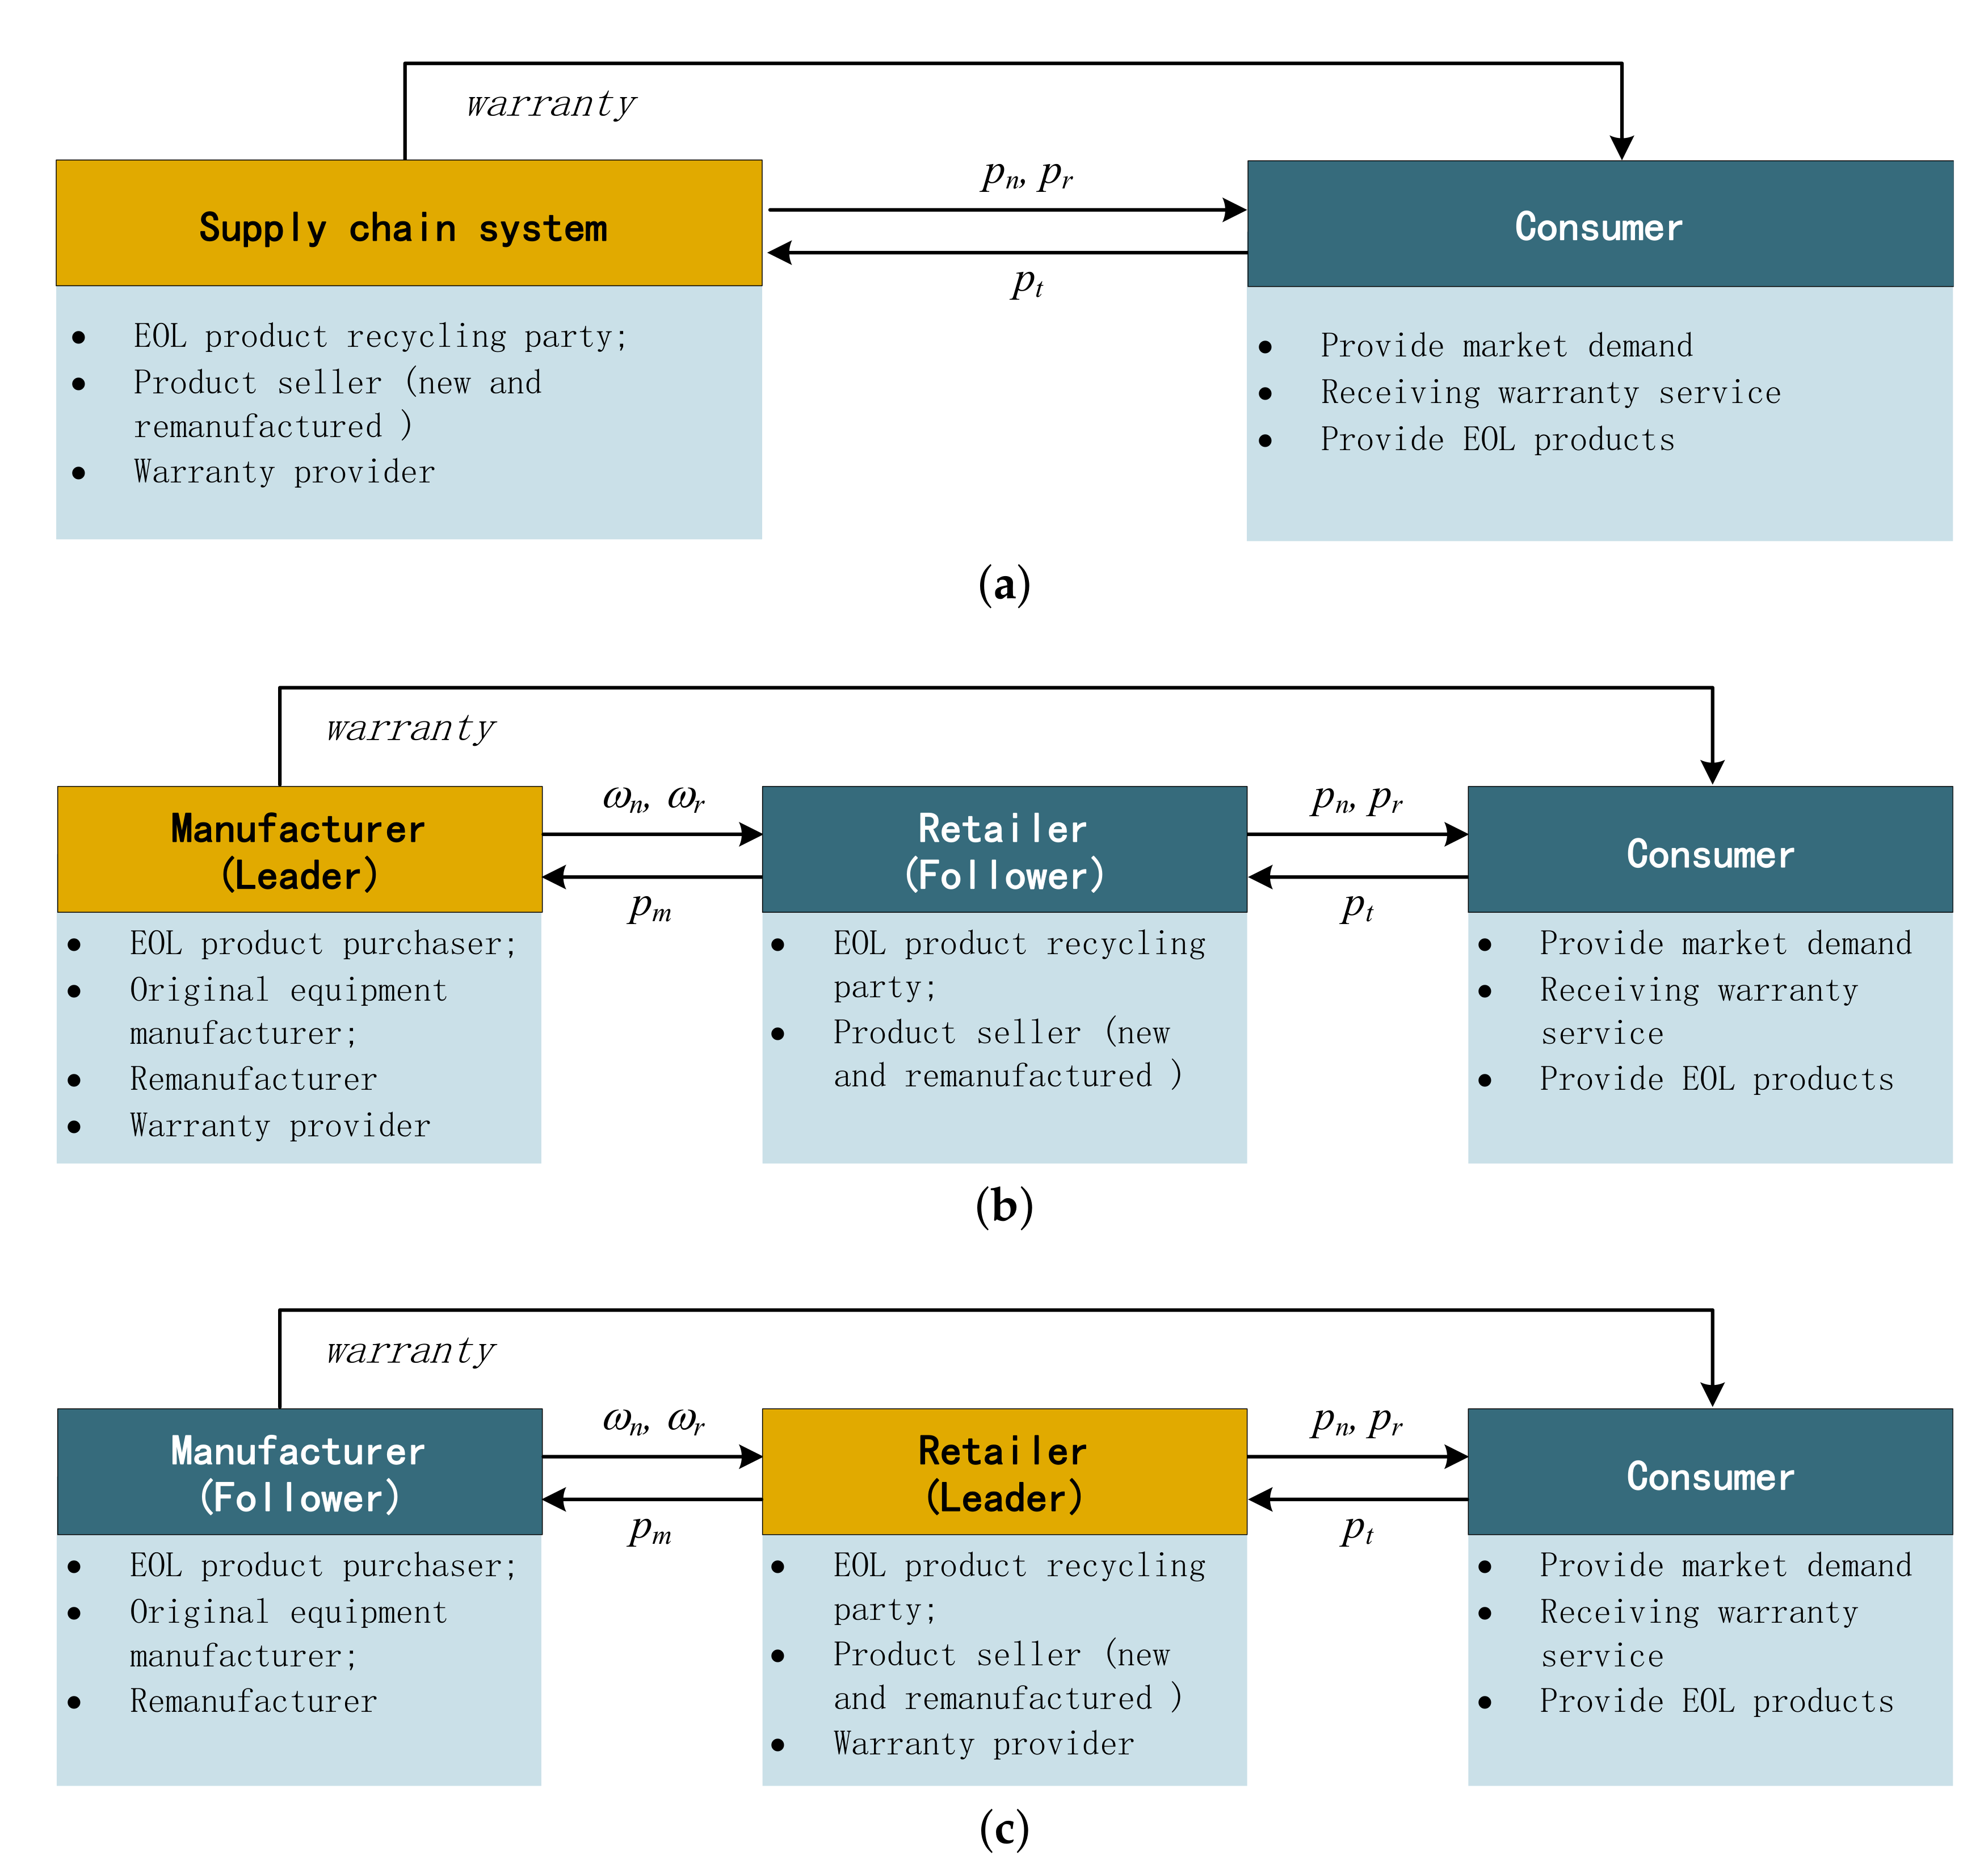
This study considers a single-stage closed-loop supply chain system with two risk-neutral firms, a manufacturer and a retailer. The manufacturer assumes the role of original equipment manufacturer and remanufacturer, and provides warranty services to facilitate remanufacturing sales. The retailer makes two decisions: product sales and EOL product recycling. The decision order is as follows: Firstly, the manufacturer sells new and remanufactured products to retailers at wholesale prices respectively. The warranty period provided by the manufacturer is respectively. Then, after the retailer buys the product from the manufacturer, the retail price of the two products is determined to be , respectively, for sale to the consumer. Finally, the retailer pays the consumer recycling price of EOL product, and the manufacturer pays the retailer the transfer price , resulting in a closed-loop supply chain system. Three types of decision models are discussed below: Figure 1a is a centralized decision model, where manufacturers and retailers are integrated into a single decision; Figure 1b is a decentralized decision model dominated by the manufacturer; and Figure 1c is a decentralized decision model dominated by the retailer. Definitions of variables are shown in Table 1.
3.2. Model Hypotheses
Assumption 1.
There is a manufacturer-led Stackelberg game relationship between the manufacturers and retailers. The manufacturers and retailers are risk-neutral and have complete information.
Assumption 2.
There are no differences in quality and performance between new and remanufactured products, but for the sake of differentiation, remanufactured products are designed with a “remanufacturing” logo, and consumers have a different WTP for both products.
Assumption 3.
The unit wholesale price, retail price, production, and warranty period for new and remanufactured products are , respectively, where , n is the new product and r is the remanufactured product. The profit function is , where S denotes the supply chain system, R denotes the retailer, M denotes the manufacturer, and the fixed recycling fee for the EOL product is F.
Assumption 4.
The new product and unit cost is , where . According to Li et al. [37], new products and the warranty costs for manufactured products are , where , linked to product failure rate, and is the average unit cost for the repair or replacement of the failed product by the manufacturer.
Assumption 5.
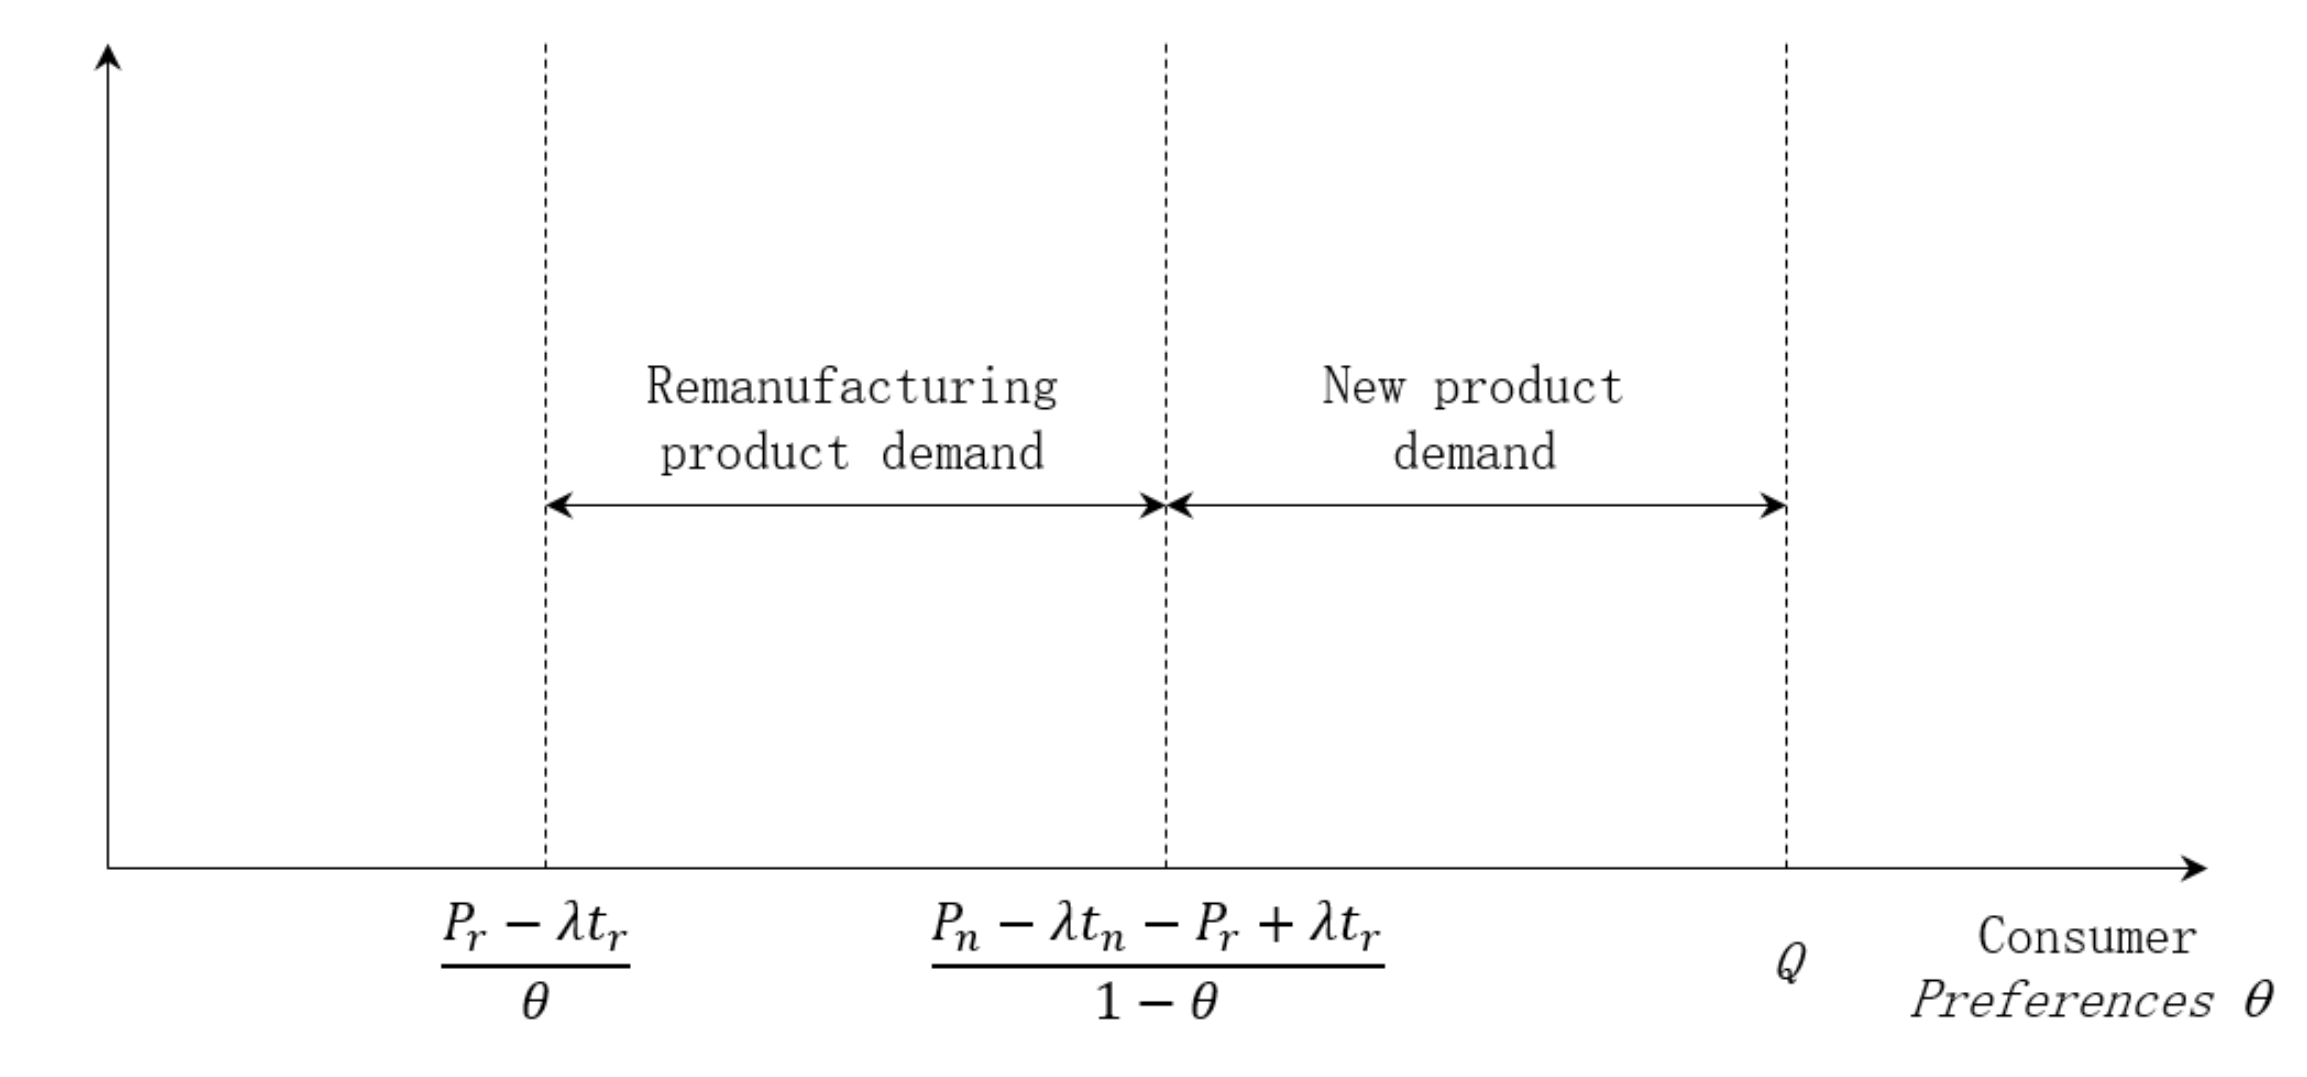
Let the potential market size of the product be Q, and the value of the consumer’s evaluation of the new product α, subject to a uniform distribution of . Consumers’ recognition of remanufactured products is and the value of the consumer’s remanufactured product is . Consumer demand decreases as product prices increase and increases as service levels increase. Therefore, the net utility of a consumer buying a new product is expressed as , while the net benefit of a remanufactured product is ( indicates the coefficient of influence of the warranty period on demand). The consumer demand distribution is shown in Figure 2 under different strategic choices.
According to the method of Debo et al. [38], product demand is judged by consumer utility. That is, when is satisfied, the demand for new products and remanufactured products exists at the same time and the demand functions of the new product and the remanufactured product are given as:
In the following, the superscripts “c”, “d” and “r” in the variables represent Model C, Model M and Model R, respectively. The superscript “*” indicates the optimal decision result, while subscripts “M”, “R”, and “S” represent manufacturers, retailers and remanufacturing systems.
4. Closed-Loop Supply Chain Decision-Making and Coordination
4.1. Centralized Decision Making
Under centralized decision making (Model C), the manufacturers and retailers form a joint decision to maximize profits of the supply chain system. The profit function is expressed as:
In Equation (3), the first and second parts are the sales revenue of new products and remanufactured products, respectively, and the third part is the fixed recycling cost of EOL products. Combining Equations (1) and (2) to solve the objective function, Proposition 1 can be obtained:
Proposition 1.
Under centralized decision, the optimal retail price and optimal output of new products and remanufactured products are:
Substituting the above optimal equilibrium solution into the objective function yields the optimal profit function :
(To simplify the display, let . See proof in Appendix A.1.)
The following propositions can be obtained by analyzing the results of the optimal equilibrium solutions under Model C from the range of values of each parameter.
Proposition 2.
Under centralized decision:
- 1.
- is not associated with consumer preference, and decreases with the increase of θ.
- 2.
- and increase with the increase of consumer preference θ.
- 3.
- is positively related to and not associated with ; is positively related to , regardless of .
Proposition 2 shows that, under Model C, an increase in consumer preference for stimulates consumer demand for remanufactured products and reduces demand for new products, triggering a market encroachment effect.
Proposition 3.
Under centralized decision, the warranty period provided by the supply chain system for new products and remanufactured products is divided into:
When and , attains the maximum value:
When and , increases with the increase of . When and , decreases with the increase of .
(See proof in Appendix A.2.)
Proposition 4.
When and , takes the maximum value:
(To simplify the display, let .)
When and , increases with the increase of . When and , decreases with the increase of .
4.2. Decentralized Decision
4.2.1. M-R Decision
Under decentralized decision (Model D1), the manufacturer becomes the market leader by virtue of its bargaining power. At this time, the supply chain decision making is as follows. First, the manufacturer considers the retailer’s optimal response function and determines the wholesale price and warranty period. Then, the retailer sets the retail price based on the manufacturer’s decision. The decision model is:
The first part of Equation (14) is the manufacturer’s new product sales revenue, the second part is the remanufactured product sales revenue, and the third part is the fixed recycling cost of EOL products. The constraint condition is the sales price decision under the condition that the retailer’s target profit function is maximized. Combining Equations (1) and (2) to solve the objective function, Proposition 5 can be obtained:
Proposition 5.
Under decentralized decision, the optimal retail price, optimal wholesale price, and optimal yield of new products and remanufactured products are:
Substituting the above optimal equilibrium solution into the objective function can yield the optimal profit function of the manufacturer and the retailer , respectively:
(See proof in Appendix B.1.)
The following propositions can be obtained by analyzing the results of the optimal equilibrium solutions under Model D from the range of values of each parameter.
Proposition 6.
Under the decentralized M-R decision model:
- 1.
- is not associated with consumer preference θ, and decreases with the increase of θ.
- 2.
- and increase with the increase of consumer preference θ.
- 3.
- are positively related to , and not associated with ; are positively related to , regardless of .
Proposition 6 indicates that, under decentralized decision making, the increase in consumer preference for spurs consumer demand for remanufactured products and reduces demand for new products. With an increase in consumer preference for , the retail price and wholesale price of remanufactured products increase accordingly, while the retail price and wholesale price of new products remain unchanged.
Proposition 7.
Under decentralized decision, , and .
Proposition 7 shows that the optimal retail price and wholesale price of new products and remanufactured products under decentralized decision making are greater than the optimal equilibrium price of centralized decision making. The manufacturers and retailers aim at maximizing their respective profits. As a result, the overall profit of the supply chain is less than the total profit of centralized decision making, resulting in a double marginalization effect and making the supply chain system inefficient.
Proposition 8.
Under decentralized decision, the manufacturer’s warranty period for new products and remanufactured products is:
When and , reaches the maximum value, respectively:
When and , increases with the increase of . When and , decreases with the increase of .
(See proof in Appendix B.2.)
Proposition 9.
When and , and reach the maximum:
(To simplify the display, let .)
When and , and increase with the increase of . When and , and decrease with the increase of .
4.2.2. R-M Decision
The strong retailer network and the market terminals make the retailer the market leader. At this time, the supply chain decision making is as follows. First, the retailer determines the retail price , according to its target profit function and the manufacturer’s optimal response function. Then, the manufacturer determines the wholesale price , based on its own objective function and the retailer’s decision. Its decision model is:
The first part of Equation (30) is the retailer’s new product sales revenue and the second part is the remanufactured product sales revenue. In the constraint, the first constraint is the wholesale pricing decision under the condition that the manufacturer’s target profit function is maximized, and the second constraint is that the retailer’s sales price is greater than or equal to the wholesale price (where ). Combining Equations (1) and (2) to solve the objective function, Proposition 9 can be obtained.
Proposition 10.
Under decentralized R-M decision, the optimal retail price, optimal wholesale price, and optimal yield of new products and remanufactured products are:
Substituting the above optimal equilibrium solution into the objective function can yield the optimal profit function of the manufacturer and the retailer , respectively:
(See proof in Appendix C.1.)
The following propositions can be obtained by analyzing the results of the optimal equilibrium solutions under Model D2 from the range of values of each parameter.
Proposition 11.
Under decentralized R-M decision model:
- 1.
- is not associated with consumer preference θ, and decreases with the increase of θ.
- 2.
- and increase with the increase of θ.
- 3.
- are positively related to , and not associated with ; are positively correlated with , regardless of .
Proposition 10 shows that, under decentralized decision making, the increase in consumer preference for spurs consumer demand for remanufactured products and reduces demand for new products. With an increase in consumer preference for , the retail price and wholesale price of remanufactured products increase, while the retail price and wholesale price of new products remain unchanged.
(See proof in Appendix C.2.)
Proposition 12.
Under the decentralized RM decision model, and .
Proposition 12 shows that the optimal retail price and wholesale price of new products and remanufactured products under decentralized RM decision model are greater than the optimal equilibrium price of centralized decision making. At this time, the manufacturers and retailers aim at maximizing their respective profits. As a result, the overall profit of the supply chain is less than the total profit under centralized decision making, resulting in a double marginalization effect and making the supply chain system inefficient.
Proposition 13.
According to the range of relevant parameters, comparing the optimal decision results under R-M and M-R decision models, we get:
- 1.
- ;
- 2.
- ;
- 3.
- ;
Proposition 13 shows that, firstly, the dominant player gains a higher profit because of a bargaining advantage. That is, the retailer under R-M decision model earns the maximum profit, and the manufacturer under M-R decision model earns the maximum profit. Secondly, the total system profit under M-R decision model is less than the total system profit under the R-M decision model, indicating that the double marginalization effect produced by the manufacturer-led Stackelberg game model is greater than that of the retailer-led system.
Proposition 14.
Under the decentralized R-M decision model, the manufacturer’s warranty period for new and remanufactured products is:
When and , reaches the maximum value:
When and , increases with the increase of . When and , decrease with the increase of .
(See proof in Appendix C.3.)
4.3. Coordination Mechanism
To solve the double marginalization effect in the M-R and R-M decision models, a revenue sharing contract and a two-charge contract are used for contract coordination to improve the total profit of the system under decentralized decision making, so that the supply chain system revenue can achieve Pareto improvement.
4.3.1. M-R Decision Model: Revenue Sharing Contract
Referring to the study by Cachon et al. [39], the following uses a revenue sharing contract for Model D1 to coordinate a decentralized closed-loop supply chain system.Namely: the manufacturer demand the retailer to share the sales revenue of some of its products. Accordingly, the manufacturer feeds back to the retailer at a lower wholesale price. The retailer retains the proportion of the sales revenue share of the product as , and the manufacturer’s revenue sharing ratio For . Its decision model (Model R1) is as follows:
In Model R1, the first and second parts of the objective function are the manufacturer’s sales of new products and remanufactured products, the third part is the fixed recycling cost of EOL products, and the fourth part is based on the manufacturer’s The retailer allocates income by the revenue-sharing ratio of . The first part of the constraint is the retailer’s incentive compatibility constraint (IC) to increase the retailer revenue. The second part is the participation constraint (IR) of manufacturers and retailers to ensure that the manufacturers and retailers achieve Pareto improvements.
Combining Equations (1) and (2) to solve the objective function, Propositon 14 can be obtained:
Proposition 15.
Under the coordination mechanism, the optimal retail price, optimal wholesale price, and optimal output of new products and remanufactured products are:
(See proof in Appendix D.1.)
Proposition 16.
Under the revenue sharing contract, the optimal revenue sharing ratio between manufacturer and retailer is , at which point the supply chain can achieve Pareto improvement, namely:
(See proof in Appendix D.2.)
Proposition 17.
Under the revenue-sharing contract, the manufacturer’s warranty period for new products and remanufactured products is:
When and , reachs the maximum value respectively:
When and , increases with the increase of . When and , decreases with the increase of .
(See proof in Appendix D.3.)
Proposition 18.
When and , and is the maximum:
(To simplify the display, let .)
When and , and increases with the increase of . When and , and decreases with the increase of .
4.3.2. R-M Decision Model: Two-Charge Contract
Under the RM decision model, retailers become market leaders with strong sales network and market terminal advantages. They charge manufacturers a certain percentage of channel fees with strong bargaining power. The following two pairs of charge systems are used to coordinate the RM decision model. The marginalization effect (Model R2) is as follows:
In Model R2, the first and second parts of the objective function are the revenues of the retailers selling new and remanufactured products, and the third part is the channel fee paid by the retailer. The first constraint is the manufacturer’s incentive compatibility constraint (IC) to expand the manufacturer’s revenue, and the second part is the manufacturer’s and retailer’s participation constraint (IR) to ensure that the supply chain system achieves Pareto improvement.
Combining Equations (1) and (2) to solve the objective function, we get Proposition 15.
Proposition 19.
Under Model R2, the two-charge contract improves utility. The objective function needs to satisfy the decision and
(See proof in Appendix E.1.)
5. Numerical Simulation
To better understand the conclusions of the reaction, let the relevant parameters be . The above propositions were simulated using Wolfram Mathematica 11.0.
5.1. Research on Key Decision Factors of Closed-Loop Supply Chain Warranty
(1) Examine the changes in the retail prices of closed-loop supply chains with warranty services as and , as shown in Table 2. Firstly, increase with the increase of , indicating that the price change in new products is positively related to the new product warranty cycle and has nothing to do with the remanufactured product warranty period. Secondly, have nothing to do with the change in , indicating that the increase in consumer preferences is not related to new product pricing decisions. Again, increase with the increase of , indicating that the change in the price of the remanufactured product is positively related to the warranty period of the remanufactured product and has nothing to do with the new product warranty period. Finally, increase with the increase of , indicating that remanufactured product pricing increases as consumer preferences increase. Propositions 1 and 4 are further demonstrated.
(2) Examine the changes in the wholesale price of the closed-loop supply chain with warranty services as and , as shown in Table 3. Firstly, increase with the increase of , indicating that the wholesale price change in new products is positively related to the new product warranty cycle and has nothing to do with the remanufactured product warranty period. Secondly, have nothing to do with the change in , indicating that the increase in consumer preferences has nothing to do with new product pricing decisions. Again, increase with the increase of , indicating that the price change in remanufactured products is positively related to the remanufactured product warranty cycle and has nothing to do with the new product warranty period. Finally, increase with the increase of , indicating that remanufactured product pricing increases as consumer preferences increase. Propositions 1 and 4 are further proved.
5.2. Closed-Loop Supply Chain Decision and Coordination with Warranty Services
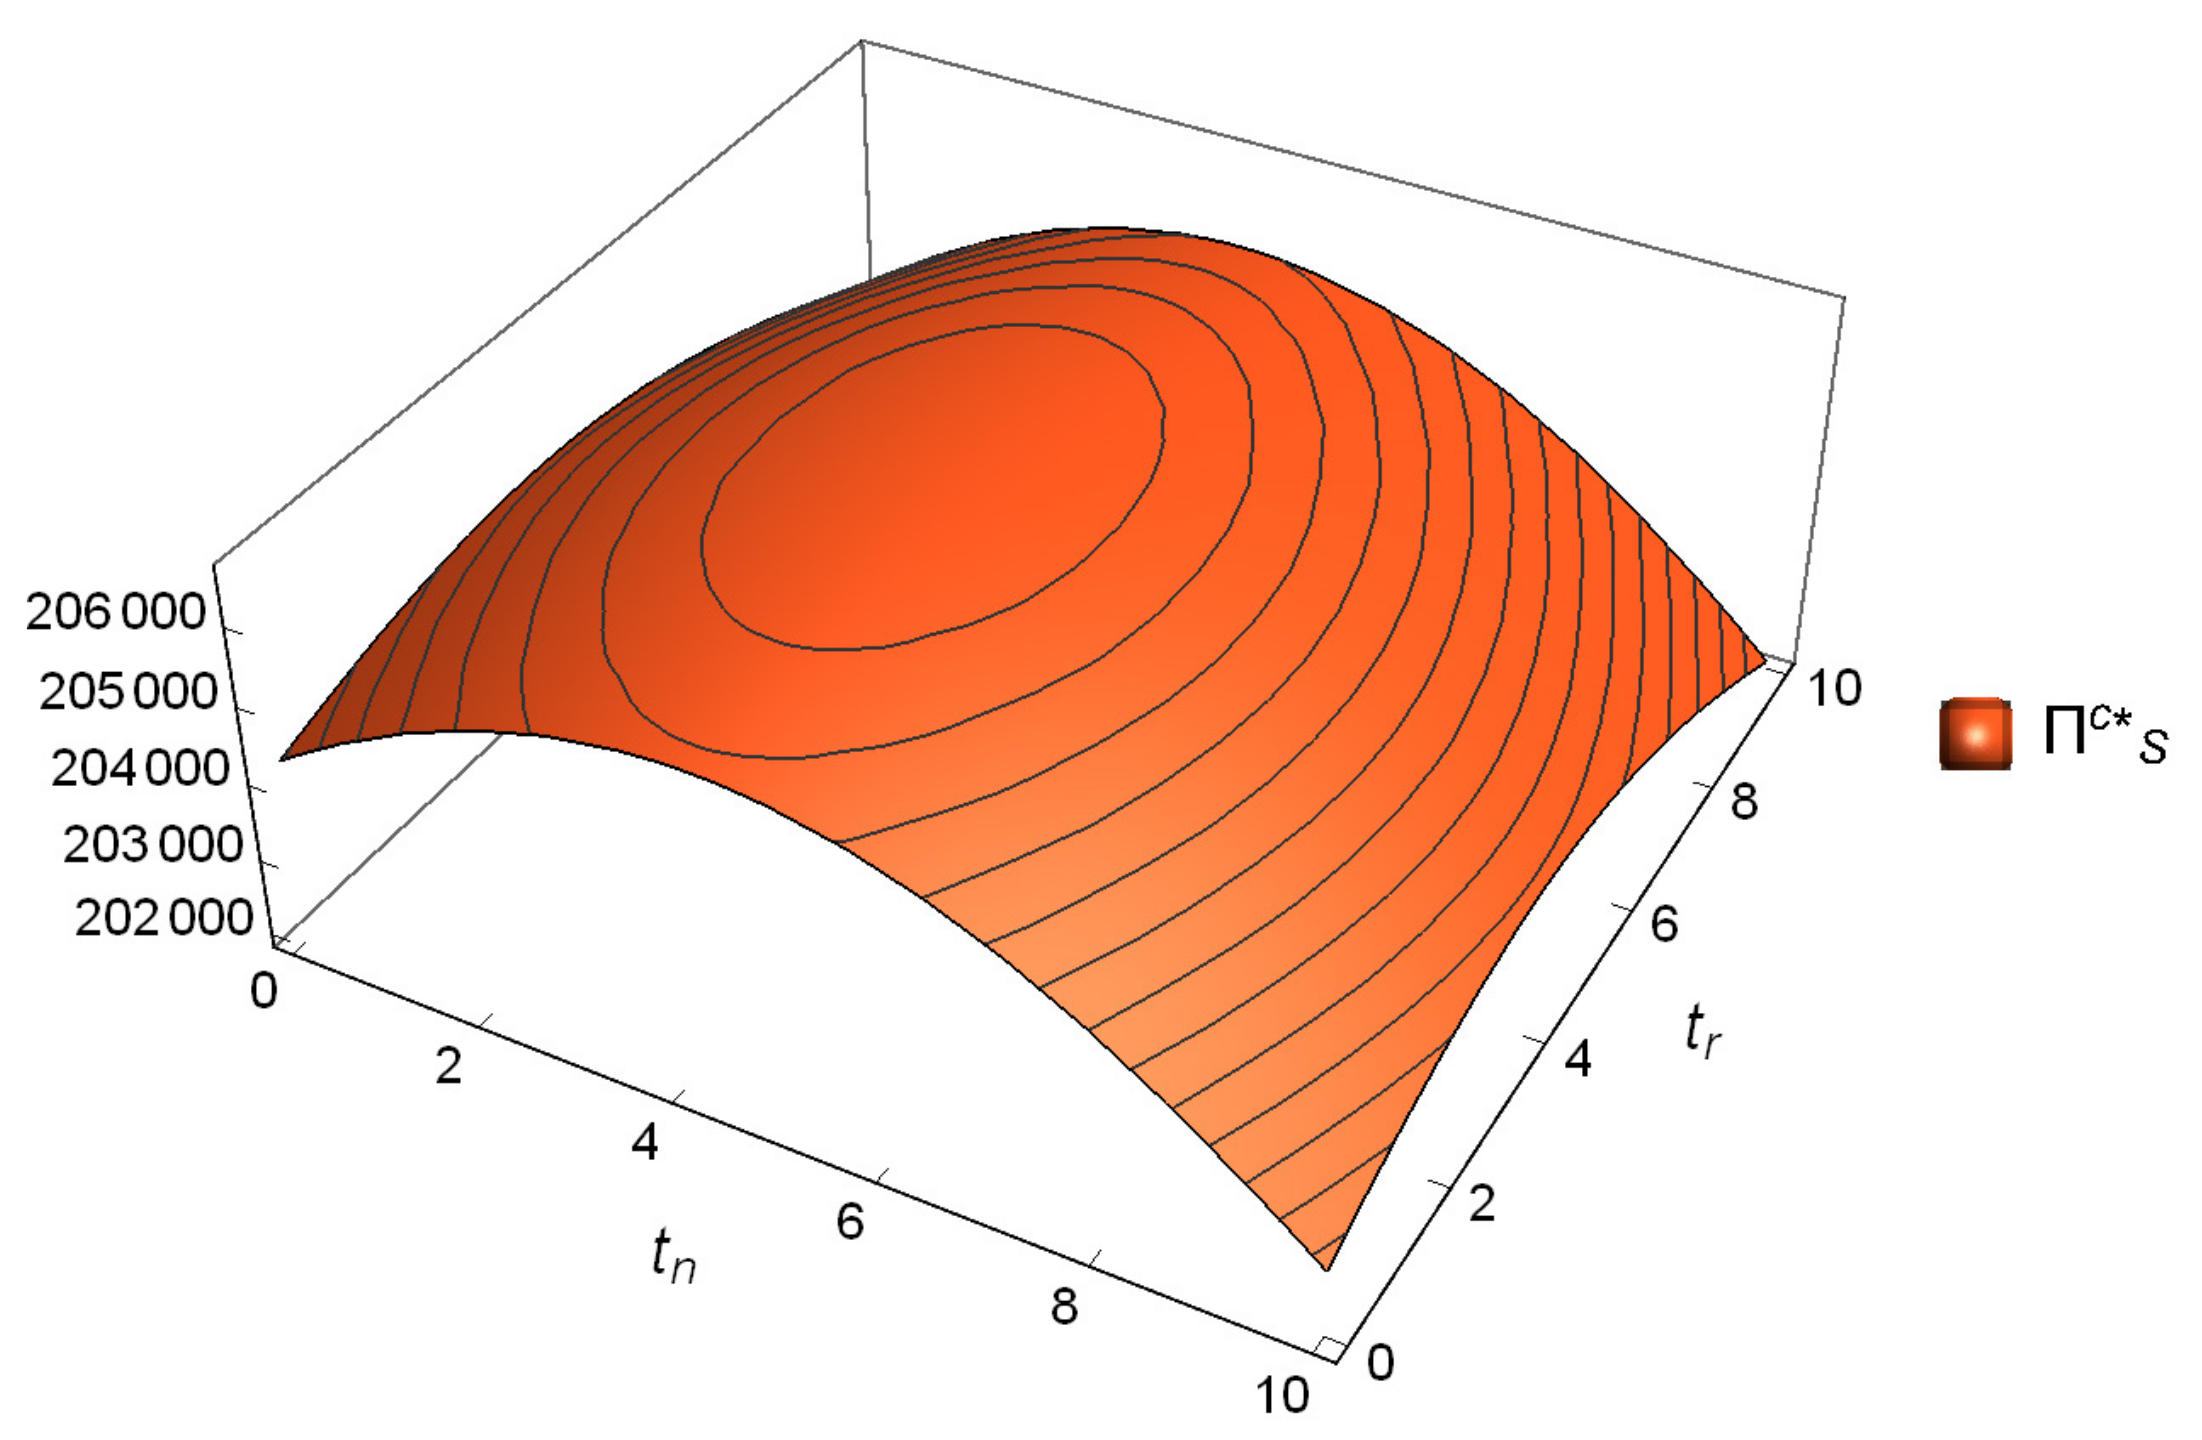
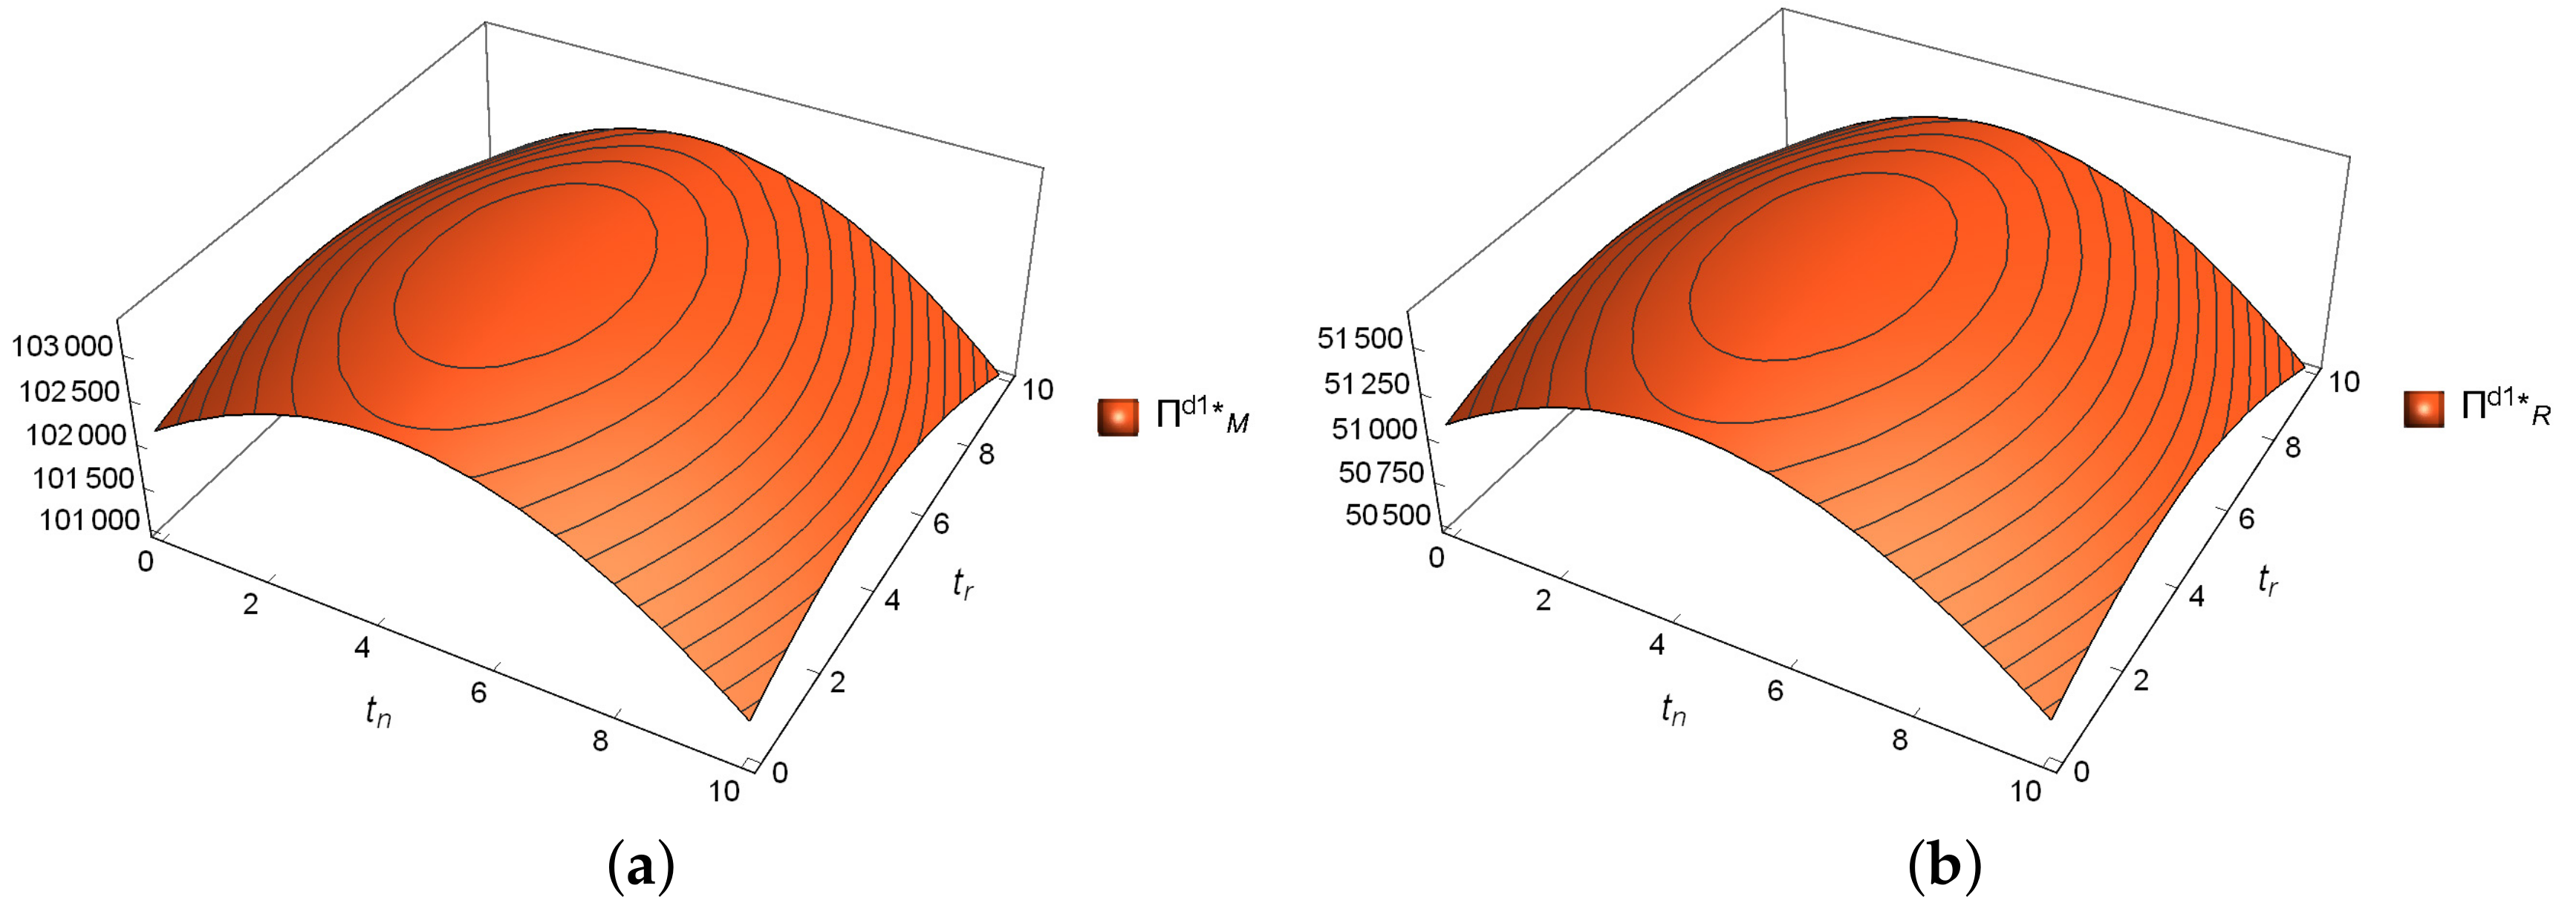
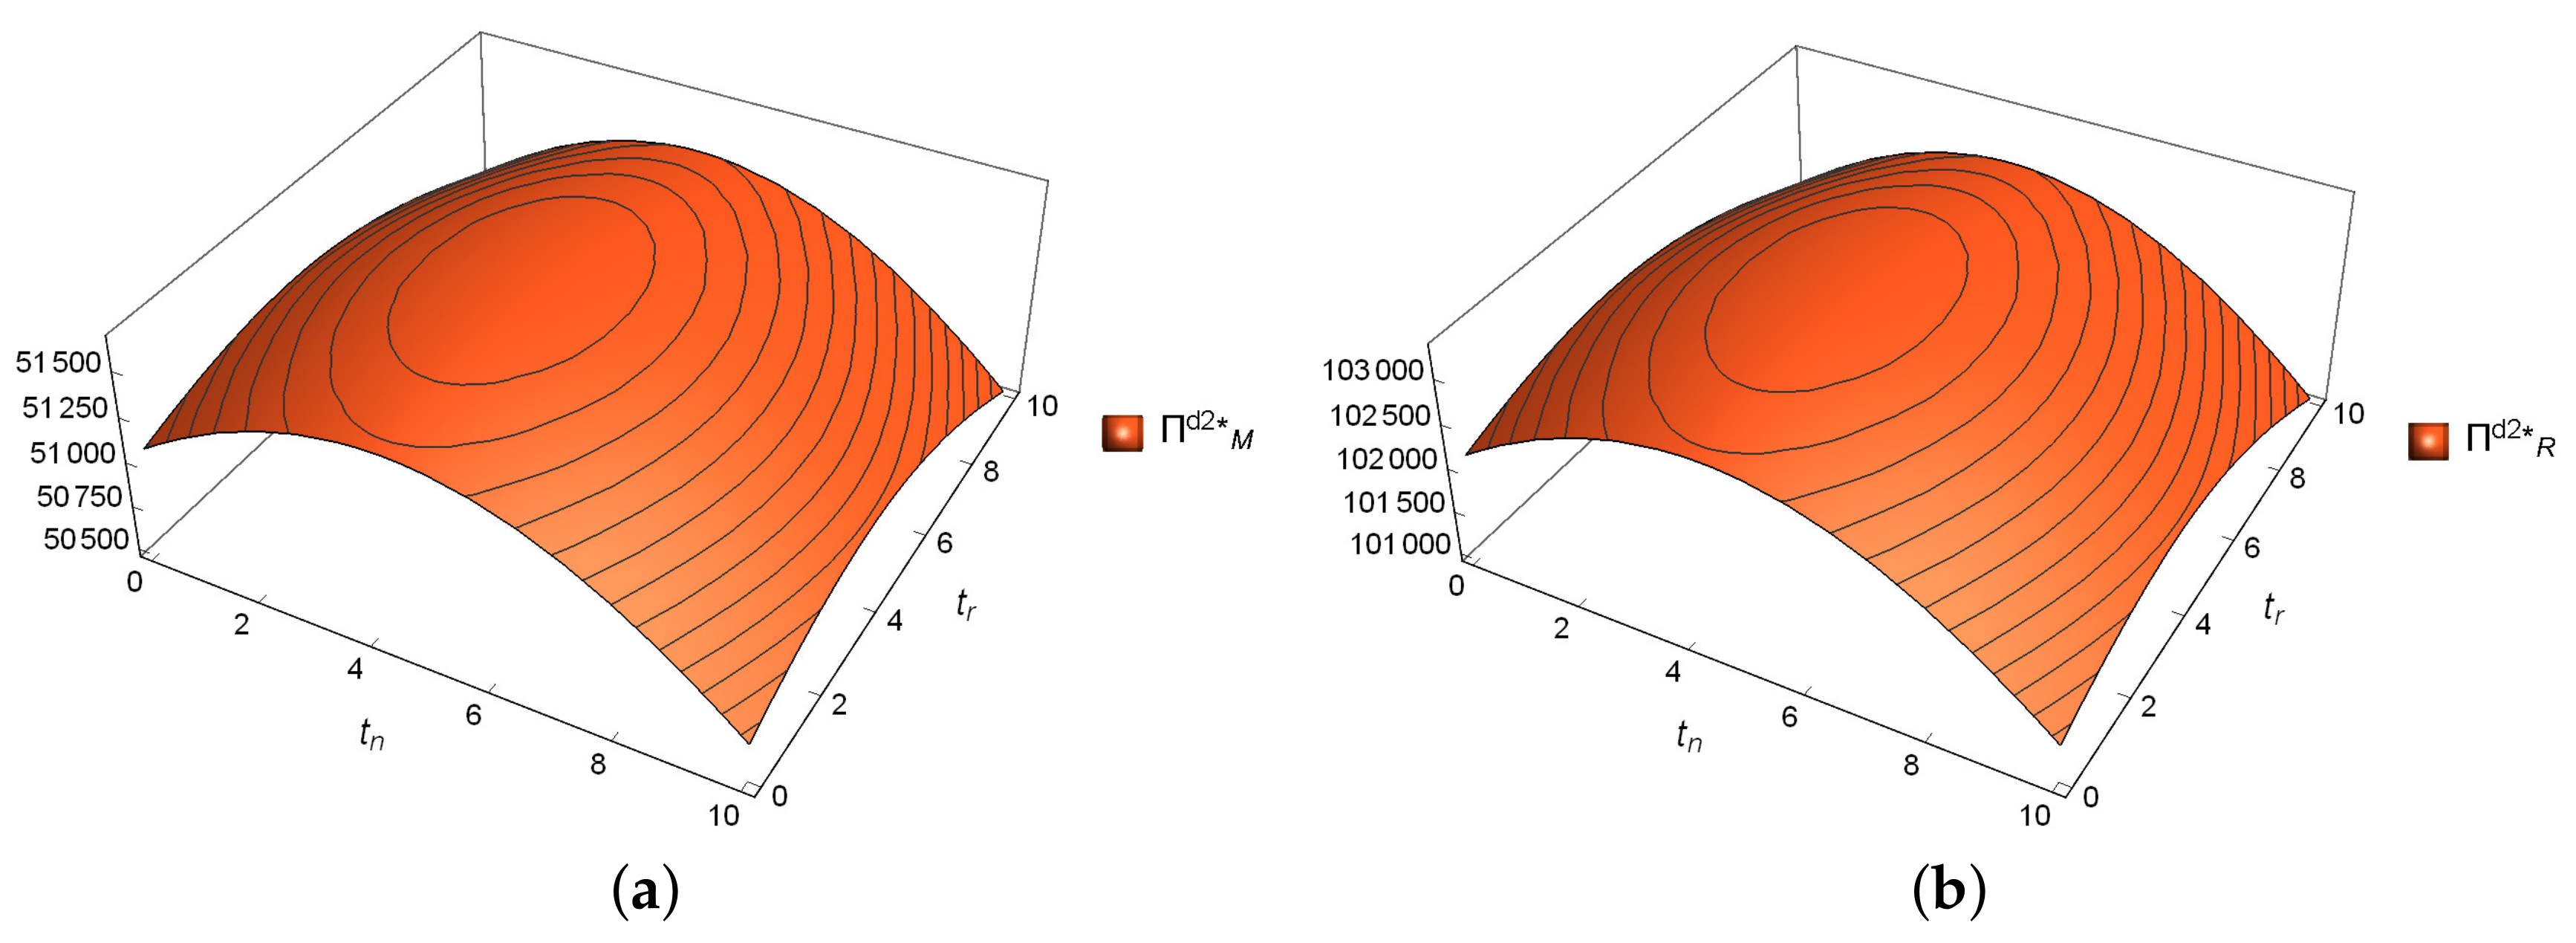
When , the total profit of the supply chain under the centralized and decentralized decision models is shown in Figure 3, Figure 4 and Figure 5 and Table 4. Firstly, with increasing consumer preference , the profit of the members of the supply chain and the total profit of the supply chain increase, and the profit of the leader (i.e., the manufacturer) is higher. Secondly, when and , the optimal profit under each decision model increases with the increase of , when and ( indicates the lower limit of the warranty period ), the optimal profit under each decision model decreases with the increase of . Namely, the maximum value is obtained at . Finally, under the decentralized decision model, the total profit of the supply chain is lower than in the centralized decision model, showing a double marginal effect and the supply chain system is inefficient.
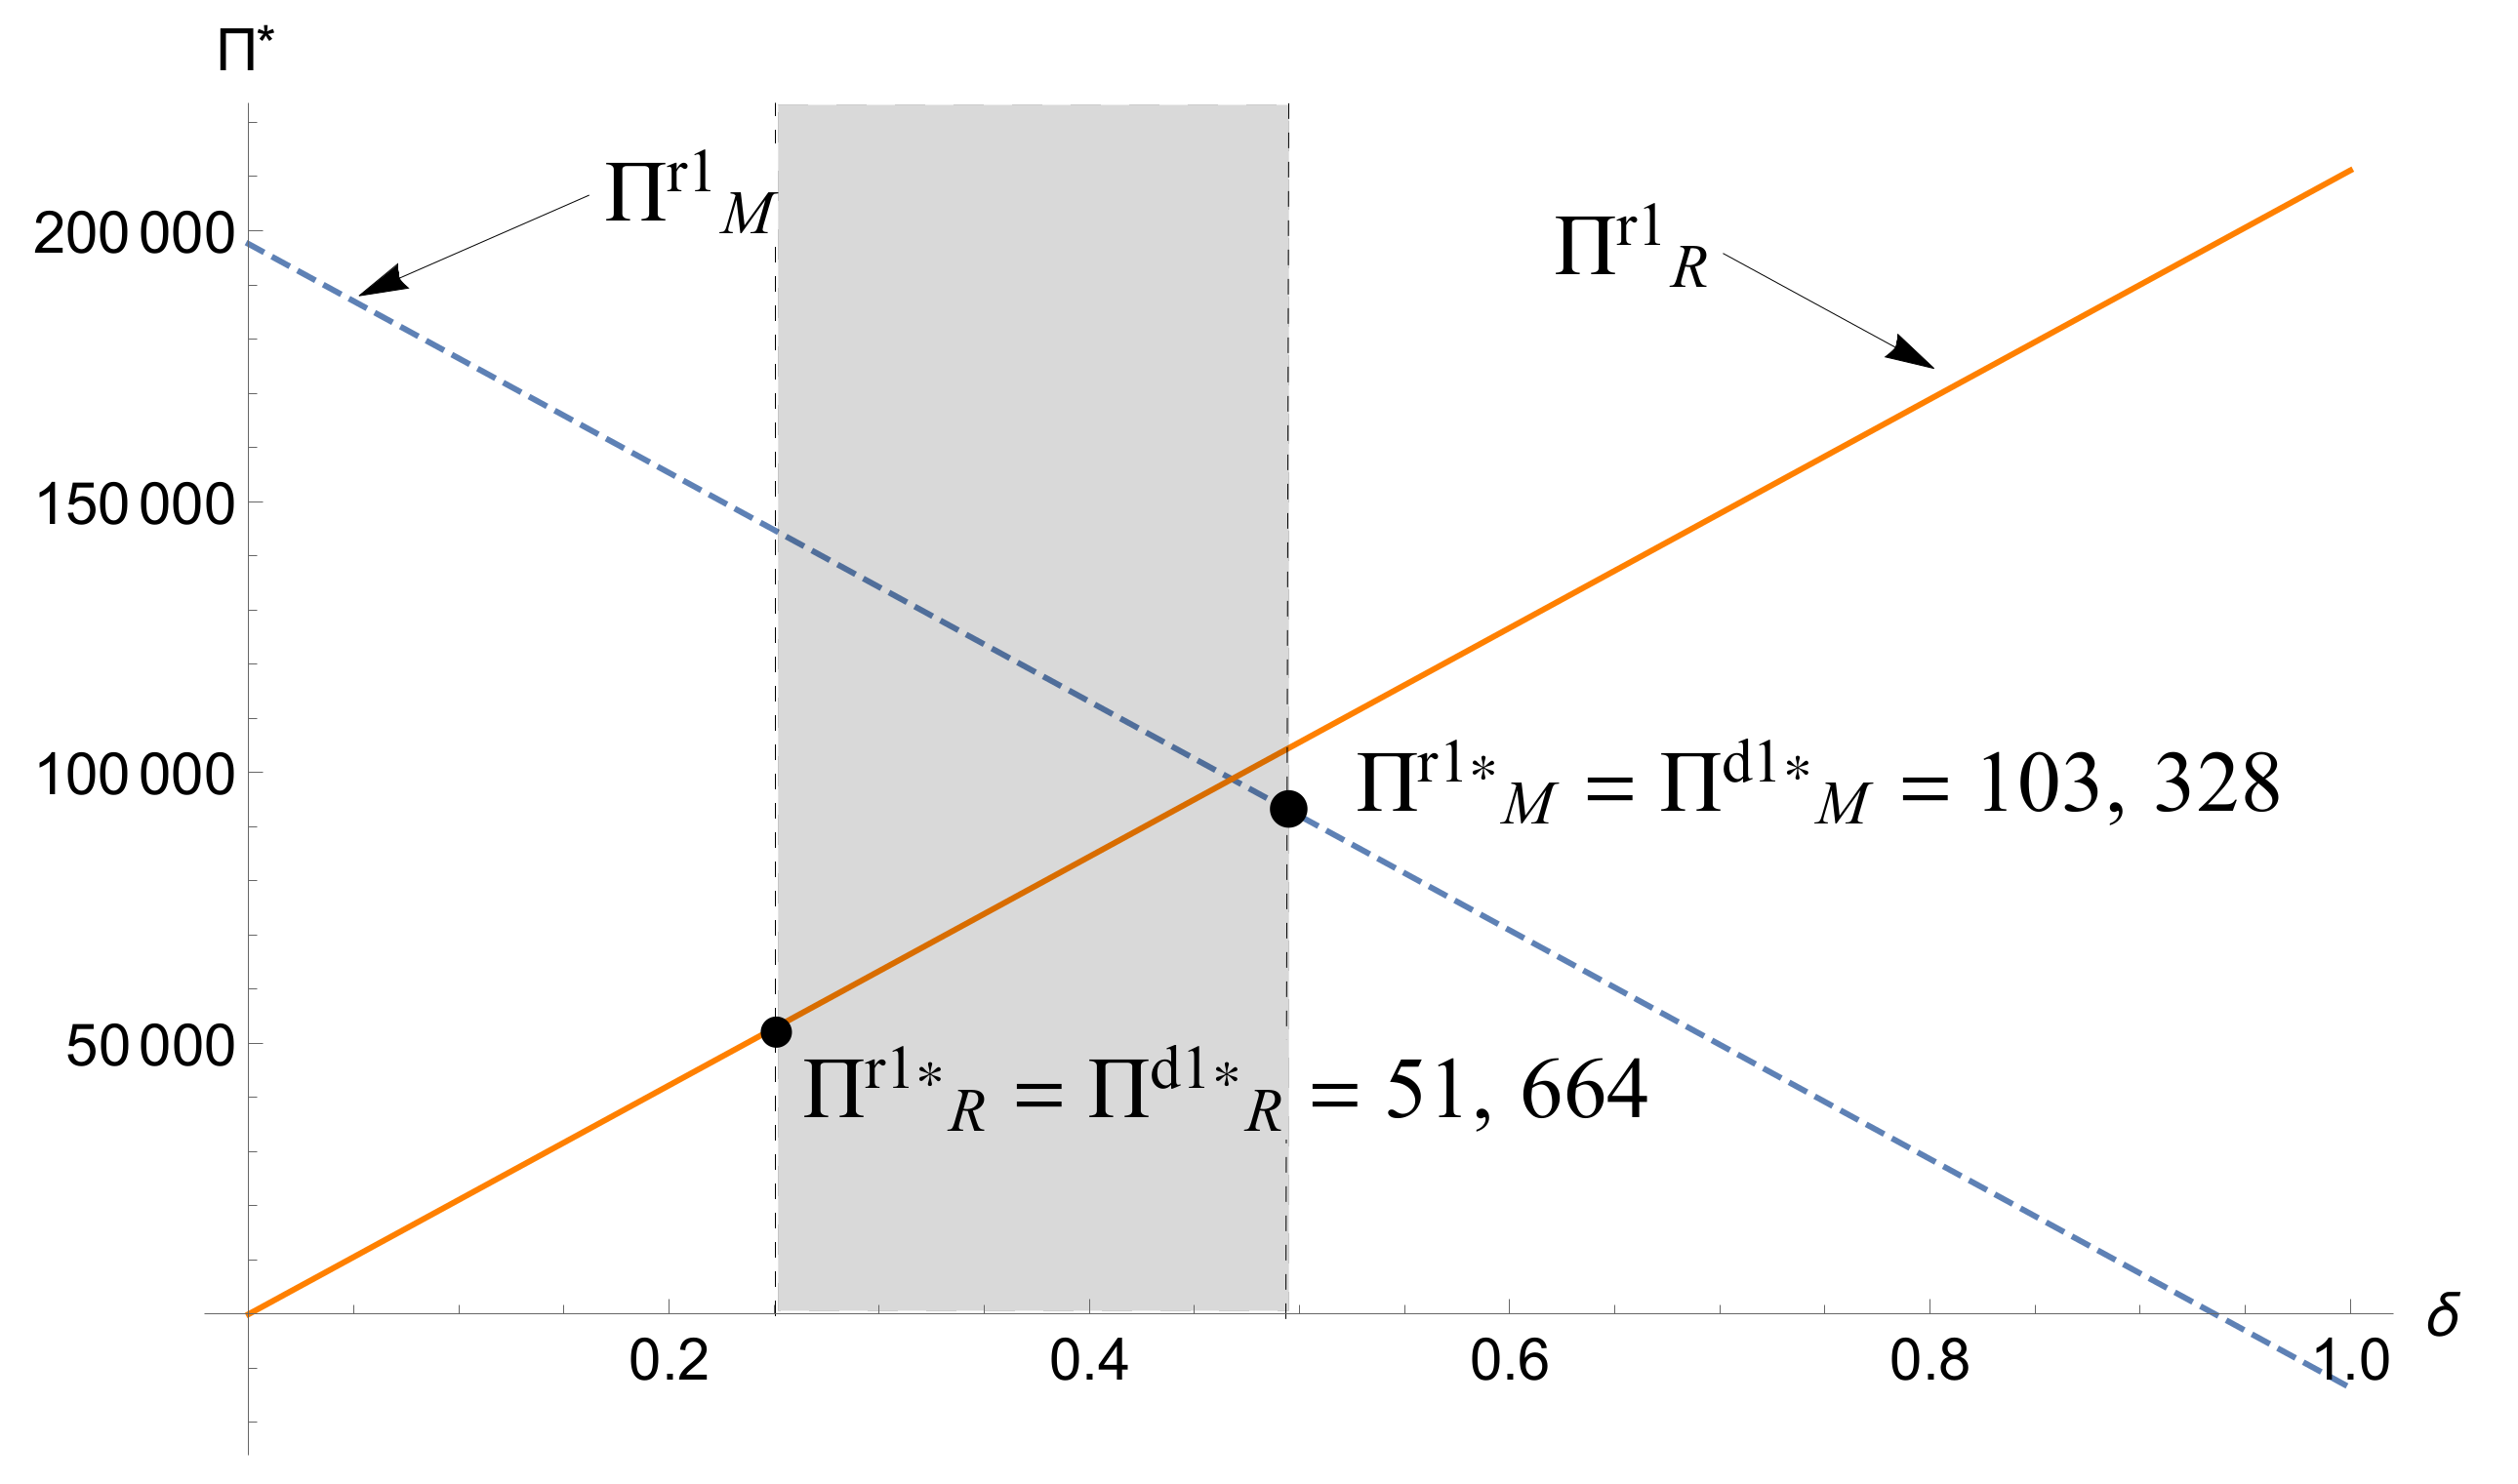
To solve the double marginalization effect in the M-R decision model, the optimal equilibrium solution derived from the revenue sharing contract obtains the optimal profit coordination result (see Figure 6), where the abscissa is the revenue-sharing ratio. When , . When , . Thus, when the revenue-sharing interval , the revenue sharing contract is valid, and proposition 8 is further proved.
To solve the double marginalization effect in the R-M decision model, the optimal equilibrium solution obtained from the two-toll system contracts can obtain the optimal profit coordination result, so that , and the related value of the parameter can be obtained under the two-charge system contract. The retailer’s coordination profit is , and the manufacturer’s profit is , consistent with the incentive compatibility constraints and participation constraints, namely, .
6. Conclusions and Future Development Direction
Using game theory and consumer behavior perspective, this study constructs a closed-loop supply chain system consisting of a single manufacturer and a single retailer, focusing on centralized decision making (Model C) and decentralized decision making (Models D1 and D2). The warranty service model studies the impact of the closed-loop supply chain warranty term factor with warranty services on the supply chain operation decision making and performance.
6.1. Research Results
The study makes the following conclusions. Firstly, consumer preferences have a positive correlation with the overall returns of a closed-loop supply chain system with warranty services, and the increase in consumer preferences is conducive to increasing the revenue capacity of each member of the closed-loop supply chain. Secondly, from the consumer behavior perspective, under the centralized decision model, the optimal product pricing and the optimal retail price are lower than in the decentralized decision model, and the optimal output is higher than in the decentralized decision model, with the extension of the new product and remanufactured product warranty period of , . The profits of the manufacturers, retailers, and closed-loop supply chain systems increase first and then decrease. That is, when the warranty period of new products and remanufactured products reaches the extreme point (, ), of the warranty service, the closed-loop supply chain system achieves the maximum value. Thirdly, the profits of the supply chain system under centralized decision model is higher than under the decentralized decision model, and the market leader under the decentralized decision making gains more profits. The coordination contract designed in this study can effectively solve the double marginalization effect of the closed-loop supply chain system of warranty services embodied in manufacturers to stimulate the sales volume of retailers. This achieves the effect of small profits but quick turnover. At this time, determining the revenue-sharing ratio of is especially critical (when the revenue sharing ratio is , the manufacturer and the retailer have no cooperation), for the contract to effectively achieve Pareto improvements in the supply chain system.
6.2. Theoretical Contribution
Our theoretical analysis and model decision making contribute to the literature in two major streams: Firstly, our research provides an effective solution to the remanufacturing marketing difficulties in the closed-loop supply chain by designing warranty mechanism. Although the warranty strategy is one of the effective driving forces to achieve supply chain performance growth, previous research has not paid full attention to the application of the warranty strategy in the closed-loop supply chain system. Secondly, based on the consumer behavior theory, we comprehensively examined the dynamic game situation in the remanufacturing system, studied the decision-making of warranty period decision in the closed-loop supply chain with warranty service, and the optimal decision that make the supply chain system profit optimal was obtained, expanded and supplemented to the current research on green supply chain management.
6.3. Management Significance
Firstly, the model results show that the increase in consumer remanufacturing preferences is conducive to the improvement of market demand for remanufactured products and stimulates the realization of the potential value of remanufactured products. At this point, the closed-loop supply chain system with warranty services could increase the price of its remanufactured products as the consumer’s preference increases, and the yield capacity of the supply chain system increase.
Secondly, the revenue of the supply chain system tends to increase first and then decrease with the extension of the warranty period, which indicates that the closed-loop supply chain system with warranty service should fully consider the comparison between warranty cost and benefit when making warranty period decision. When the warranty period meets the peak condition, the company obtains the optimal profit.
Finally, the diversified supply chain members of the supply chain have a double marginalization effect in order to maximize their own benefits, making the decentralized system revenue lower than the centralized decision. For the implementation of the downward distortion of the closed-loop supply chain system with guaranteed services, the revenue sharing contract and the two-charge contract designed in this paper can effectively achieve Pareto improvement, enabling supply chain member companies to jointly address the uncertainty of the remanufacturing market through contracts.
6.4. Limitations and Directions of Future Research
The directions that can be further expanded in this research are as follows: Firstly, this paper assumes that the supply chain consists of a single manufacturer and a single retailer. In the future, the closed-loop supply chain channel competition situation with warranty services can be further examined. Secondly, this paper builds new products and remanufactured products at the same time in the market and the product utility phase remains the same, but, in actual operation, there are often situations in which products are updated. At this time, the new product has higher consumer utility; future research will study the coordination strategy of the product in the context of upgrading the product.Thirdly, the relationship between the producer and the retailer can be redefined, having retailers as the obliging partners to consumers and not being too specific on consumer deposits and the retailers ability/transaction cost model in reclaiming products. Additionally, our paper only considers that the warranty service is provided by the manufacturer or the supply chain system, the issue of the warranty efficiency decision combination of the supply chain can be examined in the future, namely, when different warranty entities provide warranty services, the warranty cost comparison relationship of each warranty party can be examined to determine the supply chain optimal warranty entity combination strategy.
Author Contributions
Conceptualization, X.Z. and L.Y. Methodology, L.Y. Software, L.Y. Formal Analysis, L.Y. Resources, X.Z.; Validation, L.Y.; Visualization, L.Y.; and Project Administration, W.L.
Funding
This research was funded by the Humanity and Social Science Youth Foundation of Ministry of Education in China (Grant Number 19YJC630240) and the Practice Innovation Training Program of College Students in Jiangsu Province (Grant Number 201910300045Z).
Acknowledgments
This paper received administrative and technical support from the China Institute of Manufacturing Development. Meanwhile, the authors would like to thank the anonymous reviewers for their valuable comments and suggestions to improve the quality of the paper.
Conflicts of Interest
The authors declare no conflict of interest.
Appendix A. Centralized Decision Making
Appendix A.1. Proof of Proposition 1
From the range of values of related parameters and Hessin matrix solution, is found to be a strictly concave function for and there is a unique optimal equilibrium solution. The first-order partial derivatives of are solved for the objective function and made zero, and the simultaneous equilibrium decision-making solution can be obtained by the simultaneous equations. Proposition 1 is proved.
Appendix A.2. Proof of Proposition 3
Firstly, from the range of the relevant parameters and solving the Hessin matrix, is a strict concave function for . Solving the first-order partial derivative of for the objective function and making it zero, the optimal equilibrium decision solution can be solved by the simultaneous equations. Secondly, solving the first-order partial derivative of for can obtain , making it zero and solvable, available from , when , gets the extreme value. Finally, solving the first-order partial derivative of for can obtain , making it zero and solvable, available from , when , gets the extreme value. Proposition 3 is proved.
Appendix B. M-R Decision
Appendix B.1. Proof of Proposition 5
From the range of values of the relevant parameters and Hessin matrix solution, is found to be a strictly concave function for , and there is a unique optimal equilibrium solution. Solve the first-order partial derivative of for and make it zero and substitute into . Solve the first-order partial derivative of and make it zero. Finally, the optimal equilibrium solution under the decentralized decision model can be obtained using the inverse induction method. Proposition 5 is proved.
Appendix B.2. Proof of Proposition 8
Firstly, from the range of the relevant parameters and solving the Hessin matrix, is a strict concave function for . Solving the first-order partial derivative of for the objective function and making it zero, and can be obtained by solving the simultaneous equations, then substituting it to , and can be obtained according to the inverse induction method. Secondly, solving the first-order partial derivative of for can obtain , making it zero and solvable, available from , when , gets the extreme value. Finally, solving the first-order partial derivative of for can obtain , making it zero and solvable, available from , when , gets the extreme value. Proposition 8 is proved.
Appendix C. R-M Decision
Appendix C.1. Proof of Proposition 10
From the range of values of the relevant parameters and Hessin matrix solution, is found to be a strictly concave function for , and and there is a unique optimal solution. Solve the first-order partial derivatives of for and make it zero. Then, is substituted into to solve the first-order partial derivative of and make it zero. Finally, the optimal equilibrium solution under the decentralized decision model can be obtained using inverse induction.
Appendix C.2. Proof of Proposition 11
Firstly, from the range of the relevant parameters and solving the Hessin matrix, is a strict concave function for . Solving the first-order partial derivative of for the objective function and making it zero, and can be obtained by solving the simultaneous equations, then substituting it to , and can be obtained according to the inverse induction method. Secondly, solving the first-order partial derivative of for can obtain , making it zero and solvable, available from , when , gets the extreme value. Finally, solving the first-order partial derivative of for can obtain , making it zero and solvable, available from , when , gets the extreme value. Proposition 11 is proved.
Appendix C.3. Proof of Proposition 14
Firstly, from the range of the relevant parameters and solving the Hessin matrix, is a strict concave function for . Solving the first-order partial derivative of for the objective function and making it zero, and can be obtained by solving the simultaneous equations, then substituting it to , and can be obtained according to the inverse induction method. Secondly, solving the first-order partial derivative of for can obtain , making it zero and solvable, available from , when , gets the extreme value. Finally, solving the first-order partial derivative of for can obtain , making it zero and solvable, available from , when , gets the extreme value. Proposition 14 is proved.
Appendix D. M-R Decision Model: Revenue Sharing Contract
Appendix D.1. Proof of Proposition 15
Solve for the first-order partial derivatives of so that it is zero and solve the equations to get . Lettting can be coordinated using inverse induction to achieve the optimal equilibrium solution under the contract mechanism.
Appendix D.2. Proof of Proposition 16
Substituting into can get . Make satisfy the supply chain participation constraint (IR) to obtain the revenue-sharing interval. Proposition 16 is proved.
Appendix D.3. Proof of Proposition 17
Firstly, from the range of the relevant parameters and solving the Hessin matrix, is a strict concave function for . Solving the first-order partial derivative of for the objective function and making it zero, and can be obtained by solving the simultaneous equations, then substituting it to , and can be obtained according to the inverse induction method. Secondly, solving the first-order partial derivative of for can obtain , making it zero and solvable, available from , when , gets the extreme value. Finally, solving the first-order partial derivative of for can obtain , making it zero and solvable, available from , when , gets the extreme value. Proposition 17 is proved.
Appendix E. R-M Decision Model: Two-Charge Contract
Appendix E.1. Proof of Proposition 18
For , is a concave function for , and there is a unique optimal solution. Let and substitute into , and using inverse induction, participate in the constraint. The condition can be obtained from the value of .
References
References
- Song, M.; Peng, J.; Wang, J.; Dong, L. Better resource management: An improved resource and environmental efficiency evaluation approach that considers undesirable outputs. Resour. Conserv. Recycl. 2018, 128, 197–205. [Google Scholar] [CrossRef]
- Tseng, M.L.; Chiu, A.S.; Liang, D. Sustainable consumption and production in business decision-making models. Resour. Conserv. Recycl. 2018, 128, 118–121. [Google Scholar] [CrossRef]
- Lv, X.; Lu, X.; Fu, G.; Wu, C. A Spatial-Temporal Approach to Evaluate the Dynamic Evolution of Green Growth in China. Sustainability 2018, 10, 2341. [Google Scholar] [CrossRef]
- Ostojic, P. Pumps and circular economy. World Pumps 2016, 2016, 30–33. [Google Scholar] [CrossRef]
- Mai, D.T.; Liu, T.; Morris, M.D.; Sun, S. Quality coordination with extended warranty for store-brand products. Eur. J. Oper. Res. 2017, 256, 524–532. [Google Scholar] [CrossRef]
- Alqahtani, A.Y.; Gupta, S.M. Warranty as a marketing strategy for remanufactured products. J. Clean. Prod. 2017, 161, 1294–1307. [Google Scholar] [CrossRef]
- Liao, B.; Li, B. Warranty as an Effective Strategy for Remanufactured Product. Int. J. Inf. Syst. Supply Chain Manag. 2016, 9, 41–57. [Google Scholar] [CrossRef]
- WCED, S.W.S. World commission on environment and development. Our Common Future 1987, 17, 1–91. [Google Scholar]
- Turki, S.; Rezg, N. Impact of the quality of returned-used products on the optimal design of a manufacturing/remanufacturing system under carbon emissions constraints. Sustainability 2018, 10, 3197. [Google Scholar] [CrossRef]
- Zsyman, J.; Huberty, M.; Behrens, A.; Colijn, B.; Tol, R.S.; Núñez Ferrer, J.; Aglietta, M.; Hourcade, J.C. Green growth. Intereconomics 2012, 47, 140–164. [Google Scholar] [CrossRef] [Green Version]
- Talens Peiró, L.; Ardente, F.; Mathieux, F. Design for Disassembly Criteria in EU Product Policies for a More Circular Economy: A Method for Analyzing Battery Packs in PC-Tablets and Subnotebooks. J. Ind. Ecol. 2017, 21, 731–741. [Google Scholar] [CrossRef]
- Saidani, M.; Yannou, B.; Leroy, Y.; Cluzel, F.; Kendall, A. A taxonomy of circular economy indicators. J. Clean. Prod. 2018, 207, 542–559. [Google Scholar] [CrossRef] [Green Version]
- Savaskan, R.C.; Bhattacharya, S.; Van Wassenhove, L.N. Closed-loop supply chain models with product remanufacturing. Manag. Sci. 2004, 50, 239–252. [Google Scholar] [CrossRef]
- Shi, J.; Zhou, J.; Zhu, Q. Barriers of a closed-loop cartridge remanufacturing supply chain for urban waste recovery governance in China. J. Clean. Prod. 2019, 212, 1544–1553. [Google Scholar] [CrossRef]
- De Giovanni, P.; Zaccour, G. A selective survey of game-theoretic models of closed-loop supply chains. 4OR 2019, 17, 1–44. [Google Scholar] [CrossRef]
- Luo, Z.; Chen, X.; Chen, J.; Wang, X. Optimal pricing policies for differentiated brands under different supply chain power structures. Eur. J. Oper. Res. 2017, 259, 437–451. [Google Scholar] [CrossRef] [Green Version]
- Zhou, Q.; Chen, D. Study on coordination and benefit distribution of closed-loop supply chain with a TPL service provider. In Proceedings of the 2016 IEEE International Conference on Information and Automation (ICIA), Ningbo, China, 1–3 August 2016; pp. 1986–1989. [Google Scholar]
- Wang, W.; Ding, J.; Sun, H. Reward-penalty mechanism for a two-period closed-loop supply chain. J. Clean. Prod. 2018, 203, 898–917. [Google Scholar] [CrossRef]
- Parsaeifar, S.; Bozorgi-Amiri, A.; Naimi-Sadigh, A.; Sangari, M.S. A game theoretical for coordination of pricing, recycling, and green product decisions in the supply chain. J. Clean. Prod. 2019, 226, 37–49. [Google Scholar] [CrossRef]
- Ranjan, A.; Jha, J. Pricing and coordination strategies of a dual-channel supply chain considering green quality and sales effort. J. Clean. Prod. 2019, 218, 409–424. [Google Scholar] [CrossRef]
- Amin, S.H.; Baki, F. A facility location model for global closed-loop supply chain network design. Appl. Math. Model. 2017, 41, 316–330. [Google Scholar] [CrossRef]
- Li, J.; Wang, Z.; Jiang, B.; Kim, T. Coordination strategies in a three-echelon reverse supply chain for economic and social benefit. Appl. Math. Model. 2017, 49, 599–611. [Google Scholar] [CrossRef]
- Bian, Y.; Yan, S.; Zhang, W.; Xu, H. Warranty strategy in a supply chain when two retailer’s extended warranties bundled with the products. J. Syst. Sci. Syst. Eng. 2015, 24, 364–389. [Google Scholar] [CrossRef]
- Wu, Y.; Wang, J.; Li, C. Decisions of Supply Chain Considering Chain-to-Chain Competition and Service Negative Spillover Effect. Sustainability 2019, 11, 1612. [Google Scholar] [CrossRef]
- Arabi, M.; Mansour, S.; Shokouhyar, S. Optimizing a warranty–based sustainable product service system using game theory. Int. J. Sustain. Eng. 2018, 11, 330–341. [Google Scholar] [CrossRef]
- Wang, J.; Zhou, Z.; Peng, H. Flexible decision models for a two-dimensional warranty policy with periodic preventive maintenance. Reliab. Eng. Syst. Saf. 2017, 162, 14–27. [Google Scholar] [CrossRef]
- Lan, Y.; Zhao, R.; Tang, W. A fuzzy supply chain contract problem with pricing and warranty. J. Intell. Fuzzy Syst. 2014, 26, 1527–1538. [Google Scholar]
- Esmaeili, M.; Gamchi, N.S.; Asgharizadeh, E. Three-level warranty service contract among manufacturer, agent and customer: A game-theoretical approach. Eur. J. Oper. Res. 2014, 239, 177–186. [Google Scholar] [CrossRef]
- Xu, Z.; Peng, Z.; Yang, L.; Chen, X. An improved shapley value method for a green supply chain income distribution mechanism. Int. J. Environ. Res. Public Health 2018, 15, 1976. [Google Scholar] [CrossRef] [PubMed]
- Lei, Y.; Liu, Q.; Shum, S. Warranty pricing with consumer learning. Eur. J. Oper. Res. 2017, 263, 596–610. [Google Scholar] [CrossRef]
- Wang, Y.; Hazen, B.T.; Mollenkopf, D.A. Consumer value considerations and adoption of remanufactured products in closed-loop supply chains. Ind. Manag. Data Syst. 2018, 118, 480–498. [Google Scholar] [CrossRef]
- Genc, T.S.; De Giovanni, P. Optimal return and rebate mechanism in a closed-loop supply chain game. Eur. J. Oper. Res. 2018, 269, 661–681. [Google Scholar] [CrossRef] [Green Version]
- Zhu, X.; Yu, L. Differential Pricing Decision and Coordination of Green Electronic Products from the Perspective of Service Heterogeneity. Appl. Sci. 2018, 8, 1207. [Google Scholar] [CrossRef]
- Bai, H.; Wang, J.; Zeng, A.Z. Exploring Chinese consumers’ attitude and behavior toward smartphone recycling. J. Clean. Prod. 2018, 188, 227–236. [Google Scholar] [CrossRef]
- Wu, C.H. Price competition and technology licensing in a dynamic duopoly. Eur. J. Oper. Res. 2018, 267, 570–584. [Google Scholar] [CrossRef]
- Liao, B.F.; Li, B.Y. A marketing strategy in a closed-loop supply chain with loss-averse consumers. Math. Probl. Eng. 2018, 2018, 2560153. [Google Scholar] [CrossRef]
- Ning, L.; Bangyi, L.; Zhi, L. Re-manufactured product warranty subject and warranty efficiency study. Oper. Manag. 2016, 25, 249–257. [Google Scholar]
- Debo, L.G.; Toktay, L.B.; Van Wassenhove, L.N. Market segmentation and product technology selection for remanufacturable products. Manag. Sci. 2005, 51, 1193–1205. [Google Scholar] [CrossRef]
- Cachon, G.P. Supply chain coordination with contracts. Handb. Oper. Res. Manag. Sci. 2003, 11, 227–339. [Google Scholar]
Figure 1.
(a) Centralized decisions; (b) decentralized M-R decisions; and (c) decentralized R-M decisions.
Figure 1.
(a) Centralized decisions; (b) decentralized M-R decisions; and (c) decentralized R-M decisions.

Figure 2.
Consumer utility floating range.

Figure 3.
The change in total profit of supply chain system with under centralized decision model.

Figure 4.
(a) The variation in manufacturer’s profit with under decentralized M-R decision model. (b) The variation in retailer’s profit with under decentralized M-R decision model.
Figure 4.
(a) The variation in manufacturer’s profit with under decentralized M-R decision model. (b) The variation in retailer’s profit with under decentralized M-R decision model.

Figure 5.
(a)The variation in manufacturer’s profit with under decentralized R-M decision model. (b) The variation in retailer’s profit with under decentralized R-M decision model.
Figure 5.
(a)The variation in manufacturer’s profit with under decentralized R-M decision model. (b) The variation in retailer’s profit with under decentralized R-M decision model.

Figure 6.
Changes in the optimal profit of manufacturers and retailers under the change in revenue sharing interval.
Figure 6.
Changes in the optimal profit of manufacturers and retailers under the change in revenue sharing interval.


Table 1.
Notations.
| Nomenclature | Definition |
|---|---|
| Decision variables | |
| Retail price of new or remanufactured products, | |
| Wholesale price of new or remanufactured product | |
| Demand function of new or remanufactured products | |
| Warranty period of new or remanufactured products | |
| Recycling price of the EOL product that the retailer pays the consumer | |
| Transfer price that the manufacturer pays the retailer | |
| Unit cost of new or remanufactured products | |
| Q | Potential market size |
| Consumer utility function | |
| Consumer’s recognition of remanufactured products, | |
| k | Cost coefficient for each warranty subject to provide warranty for unit remanufactured products |
| The influence coefficient of the warranty period on market demand | |
| F | The fixed recycling fee for the EOL product |
| Indices | |
| c | Centralized Decisions (Model C) |
| Decentralized M-R Decisions (Manufacturer as the leader, Model D1) | |
| Decentralized R-M Decisions (Retailer as the leader, Model D2) | |
| Revenue sharing contract (Model R1) | |
| Two-charge contract (Model R2) | |
| Subscript | |
| M | Manufacturer |
| R | Retailer |
| S | Supply chain system |
Table 2.
Changes in retail prices of new and remanufactured products under various decision models with and .
Table 2.
Changes in retail prices of new and remanufactured products under various decision models with and .
| 3 | 3 | 552.31 | 384.83 | 776.45 | 542.74 | 776.45 | 542.77 | |
| 0.7 | 4 | 4 | 554.95 | 387.45 | 777.92 | 544.17 | 777.92 | 544.17 |
| 5 | 5 | 558.63 | 391.19 | 779.95 | 546.15 | 779.95 | 546.15 | |
| 3 | 3 | 552.31 | 434.86 | 776.45 | 617.74 | 776.45 | 617.77 | |
| 0.8 | 4 | 4 | 554.95 | 437.45 | 777.92 | 619.17 | 777.92 | 619.17 |
| 5 | 5 | 558.63 | 441.17 | 779.95 | 621.15 | 779.95 | 621.15 | |
| 3 | 3 | 552.31 | 484.85 | 776.45 | 692.74 | 776.45 | 692.77 | |
| 0.9 | 4 | 4 | 554.95 | 487.45 | 777.92 | 694.17 | 777.92 | 694.17 |
| 5 | 5 | 558.63 | 491.18 | 779.95 | 696.15 | 779.95 | 696.15 |
Table 3.
Changes in wholesale prices of new and remanufactured products under various decision models with and .
Table 3.
Changes in wholesale prices of new and remanufactured products under various decision models with and .
| 3 | 3 | 552.32 | 399.81 | 328.15 | 241.91 | |
| 0.7 | 4 | 4 | 554.95 | 402.45 | 331.97 | 245.72 |
| 5 | 5 | 558.63 | 406.19 | 337.32 | 251.05 | |
| 3 | 3 | 552.32 | 449.82 | 328.15 | 266.91 | |
| 0.8 | 4 | 4 | 554.95 | 452.45 | 331.97 | 270.72 |
| 5 | 5 | 558.63 | 456.17 | 337.32 | 276.05 | |
| 3 | 3 | 552.32 | 499.84 | 328.15 | 291.91 | |
| 0.9 | 4 | 4 | 554.95 | 502.45 | 331.97 | 295.72 |
| 5 | 5 | 558.63 | 506.16 | 337.32 | 301.05 |
Table 4.
Changes in the profit of supply chain member companies with and .
| Centralized Decision | Decentralized M-R Decision | Decentralized R-M Decision | |||||||
|---|---|---|---|---|---|---|---|---|---|
| 3 | 3 | 200,992 | 100,496 | 50,247.9 | 150,743.9 | 50,950.6 | 101,901 | 152,851.6 | |
| 0.7 | 4 | 4 | 198,879 | 99,439.6 | 49,719.8 | 149,159.4 | 51,007.6 | 102,015 | 153,022.6 |
| 5 | 5 | 195,895 | 97,947.6 | 48,973.8 | 146,921.4 | 50,996.2 | 101,992 | 152,988.2 | |
| 3 | 3 | 201,293 | 100,647 | 50,323.3 | 150,970.3 | 51,035.1 | 102,070 | 153,105.1 | |
| 0.8 | 4 | 4 | 199,151 | 99,575.6 | 49,787.8 | 149,363.4 | 51,092.7 | 102,185 | 153,277.7 |
| 5 | 5 | 196,121 | 98,060.6 | 49,030.3 | 147,090.9 | 51,081.2 | 102,162 | 153,243.2 | |
| 3 | 3 | 202,662 | 101,331 | 50,665.5 | 151,996.5 | 51,384.3 | 102,769 | 154,153.3 | |
| 0.9 | 4 | 4 | 200,497 | 100,248 | 50,124.2 | 150,372.2 | 51,442.5 | 102,885 | 154,327.5 |
| 5 | 5 | 197,431 | 98,715.7 | 49,357.9 | 148,073.6 | 51,430.9 | 102,862 | 154,292.9 | |
© 2019 by the authors. Licensee MDPI, Basel, Switzerland. This article is an open access article distributed under the terms and conditions of the Creative Commons Attribution (CC BY) license (http://creativecommons.org/licenses/by/4.0/).
Share and Cite
MDPI and ACS Style
Zhu, X.; Yu, L.; Li, W. Warranty Period Decision and Coordination in Closed-Loop Supply Chains Considering Remanufacturing and Consumer Behavior. Sustainability 2019, 11, 4237. https://0-doi-org.brum.beds.ac.uk/10.3390/su11154237
AMA Style
Zhu X, Yu L, Li W. Warranty Period Decision and Coordination in Closed-Loop Supply Chains Considering Remanufacturing and Consumer Behavior. Sustainability. 2019; 11(15):4237. https://0-doi-org.brum.beds.ac.uk/10.3390/su11154237
Chicago/Turabian StyleZhu, Xiaodong, Lingfei Yu, and Wei Li. 2019. "Warranty Period Decision and Coordination in Closed-Loop Supply Chains Considering Remanufacturing and Consumer Behavior" Sustainability 11, no. 15: 4237. https://0-doi-org.brum.beds.ac.uk/10.3390/su11154237
Note that from the first issue of 2016, this journal uses article numbers instead of page numbers. See further details here.