Article

Impact of Leachate from Northern Landfill Site in Bloemfontein on Water and Soil Quality: Implications for Water and Food Security

by
Olusola O. Ololade
1,*,
Sabelo Mavimbela
1,
Saheed A. Oke
2 and
Rinae Makhadi
1,3
1
Centre for Environmental Management, University of the Free State, Bloemfontein 9301, South Africa
2
Unit for Sustainable Water and Environment, Civil Engineering Department, Central University of Technology, Bloemfontein 9300, South Africa
3
Department of Geology, University of the Free State, Bloemfontein 9301, South Africa
*
Author to whom correspondence should be addressed.
Sustainability 2019, 11(15), 4238; https://0-doi-org.brum.beds.ac.uk/10.3390/su11154238
Submission received: 31 March 2019 / Revised: 19 July 2019 / Accepted: 24 July 2019 / Published: 6 August 2019

Abstract

:
Solid waste management in developing cities is a threat to water and food security. The final disposal option for solid wastes is usually landfill sites. Possible contaminants and their impact on surface and groundwater, and soil quality, at the northern solid waste landfill in Bloemfontein city, South Africa, was investigated. Soil samples were analysed for basic cations and heavy metals. A one-point surface leachate, groundwater, and surface water samples were analysed for physicochemical and microbiological parameters. Hydrochemical speciation models were developed using these parameters to determine the influence of the leachate emanating from the landfill on the quality of the water samples. Findings from the study showed that the low metal content in the soil and water samples posed no immediate threat to food and water security. However, most of the other parameters were above the permissible limit of South African National Standard 241 (SANS241) and World Health Organisation (WHO) for drinking water, and the Department of Water Affairs and Forestry (DWAF) specification for irrigation, an indication that the groundwater was unfit for drinking, domestic and irrigation purposes. Metal concentrations in the soil also increased with distance downslope of the landfill along drainage lines. The implementation of a circular economy in Bloemfontein will translate to less pollution and enhance sustainable development.

1. Introduction

Municipal solid waste disposal is a global concern especially in developing countries, and as urbanisation continues to advance, the management of solid waste becomes a public health and environmental concern in urban areas [1]. A variety of waste management strategies exist, with management practices ranging from the avoidance and reduction of waste, re-use, recycling, recovery, and ultimately treatment and disposal [2]. For a developing country like South Africa, landfilling is the most common method of waste disposal, with almost 90% of waste disposed at landfills [3]. “Landfill is an engineered waste disposal site facility with specific pollution control technologies in order to minimise potential impacts. Landfills are usually located above ground or contained within quarries or pits” [4]. It is the “simplest, cheapest and most cost effective method of disposing waste” in several parts of the world [5]. Despite these benefits, it still poses a significant threat to various spheres of the environment due to the presence of toxic inorganic and organic constituents in the leachate [6] and “poorly developed solid waste management systems” [7]. According to Aljaradin and Persson [8], a variety of environmental, health, and social impacts associated with the disposal of waste by landfilling exists and these include amongst others explosion hazards from methane build up, air pollution from odour produced as a fraction of the degradable waste decays and the overall dilapidation of the immediate environment where the landfill is situated.
Many developing countries operate landfills without proper leachate collection and treatment facilities with adverse impacts on the environment. The extent of the impact depends on the nature of the leachate [5]. Leachate composition varies widely and depends on factors such as the composition and depth of waste, availability of moisture and oxygen, landfill design, operation, and age [9]. The leachate contamination of soils has a significant impact on the quality of the soil. According to Magaji [10], soil is in most cases the most polluted part of the ecosystem around landfills, because chemical elements are transported and distributed when water seeps through it. Several pollutants, including heavy metals, polyaromatic hydrocarbons, and pharmaceutical compounds accumulate in the soil [11]. According to Shaikh et al. [12], some of these pollutants may be adsorbed on to the soil during their diffusion in the soil. The implication associated with these pollutants, especially heavy metal contamination, is of concern in agricultural production systems [10].
Leachate emanating from landfills built without engineered liners and leachate collection systems could impact negatively on surface water and groundwater quality with severe consequences for human and ecosystem health [13]. Wastes placed in landfills are subject to either groundwater underflow or infiltration from precipitation. As water percolates through the waste, it picks up a variety of organic and inorganic compounds, which flow out of the waste and accumulates at the bottom of the landfill resulting in contaminated water, termed leachate [9]. Leachate that accumulates at the bottom of a landfill, seeps through the soil, and sometimes reaches the groundwater [5]. The contamination of groundwater by landfills, affects the overall quality of water and results in the water becoming unfit for use.
According to Vaverková and Adamcová [14] “the environmental impacts of landfill leachate, particularly on groundwater quality, has been noticed in several studies regardless of an ideal site selection and a monitoring network”. Adamcová et al. [15] further indicate that landfills containing hazardous materials are monitored by analysing the soil and groundwater, which has been contaminated with leachate. Several studies have determined soil, surface water, and groundwater pollution from landfill leachate with diverse findings. Aderemi et al. [5] found in their research that the absence of a leachate collector in their study area could lead to uncontrolled accumulation of leachates over time, posing significant threat to groundwater quality. Findings from Vaverková and Adamcová [14] indicate that the landfill was not a major contributor to pollution in the water samples analysed in their study despite the high concentrations of some parameters in the leachate but concluded that other land use activities such as agriculture could be the possible source of pollution. Kanmani and Gandhimathi [16] also conducted research on the impact of leachate from a landfill site on nearby soil quality and concluded that there is ”appreciable contamination of the soil by leachate migration” with possible contamination of the groundwater system over a period of time if there is no mitigation procedure in place. Findings from Lin et al. [17] indicate that leachate from landfills degrade the quality and safety of soil and water, contaminating the food system, which poses long-term health risks. This scenario compromises water security, which according to Frone and Frone [18], “underlines all dimensions of human health and wellbeing and is fundamental to food production”.
South Africa is a water scarce country [19] with limited arable land suitable for agriculture, a large portion of which is already degraded [20]. Bloemfontein, a metropolitan city within the Free State Province of South Africa has an increasing population with people migrating from rural areas, resulting in an increase in waste generation. Agriculture is the main economic sector of the city, but due to the variable and average rainfall in the area, groundwater has become the main source of water for irrigation of crops and often used as a source of drinking water in some households [21]. Presently, there are two landfills in the city, one situated south and the other north of the city. The northern landfill site is situated close to residential areas. In 2018, residents complained to the local municipality about odour emanating from the decomposing waste and constant fire outbreaks on the landfill [22]. This prompted a concern about the hazard this landfill might pose to the environment and nearby residents. Hence, the characterisation of leachate generated from the landfill and its influence on the surrounding soil and water quality, bearing in mind the arid nature of the area, was worth investigating. A previous study on groundwater contamination of the landfill, more than two decades ago, indicated contamination of the monitoring boreholes [23].
There are several ways of investigating soil and water contamination due to leachate, of which the two most common approaches are the experimental determination of contaminants and the estimation of contaminants via mathematical modelling [24]. Very few studies have been conducted in South Africa to assess the impacts of landfills on the environment, despite landfills being the preferred choice of waste disposal. In this study, we estimated the impact of leachate contamination from an unlined landfill site on the soil and water quality within the vicinity of the landfill. Diverse physiochemical and biological parameters were analysed in leachate, soil, surface water, and groundwater samples to determine the possible implications for water and food security in the study area.

2. Materials and Methods
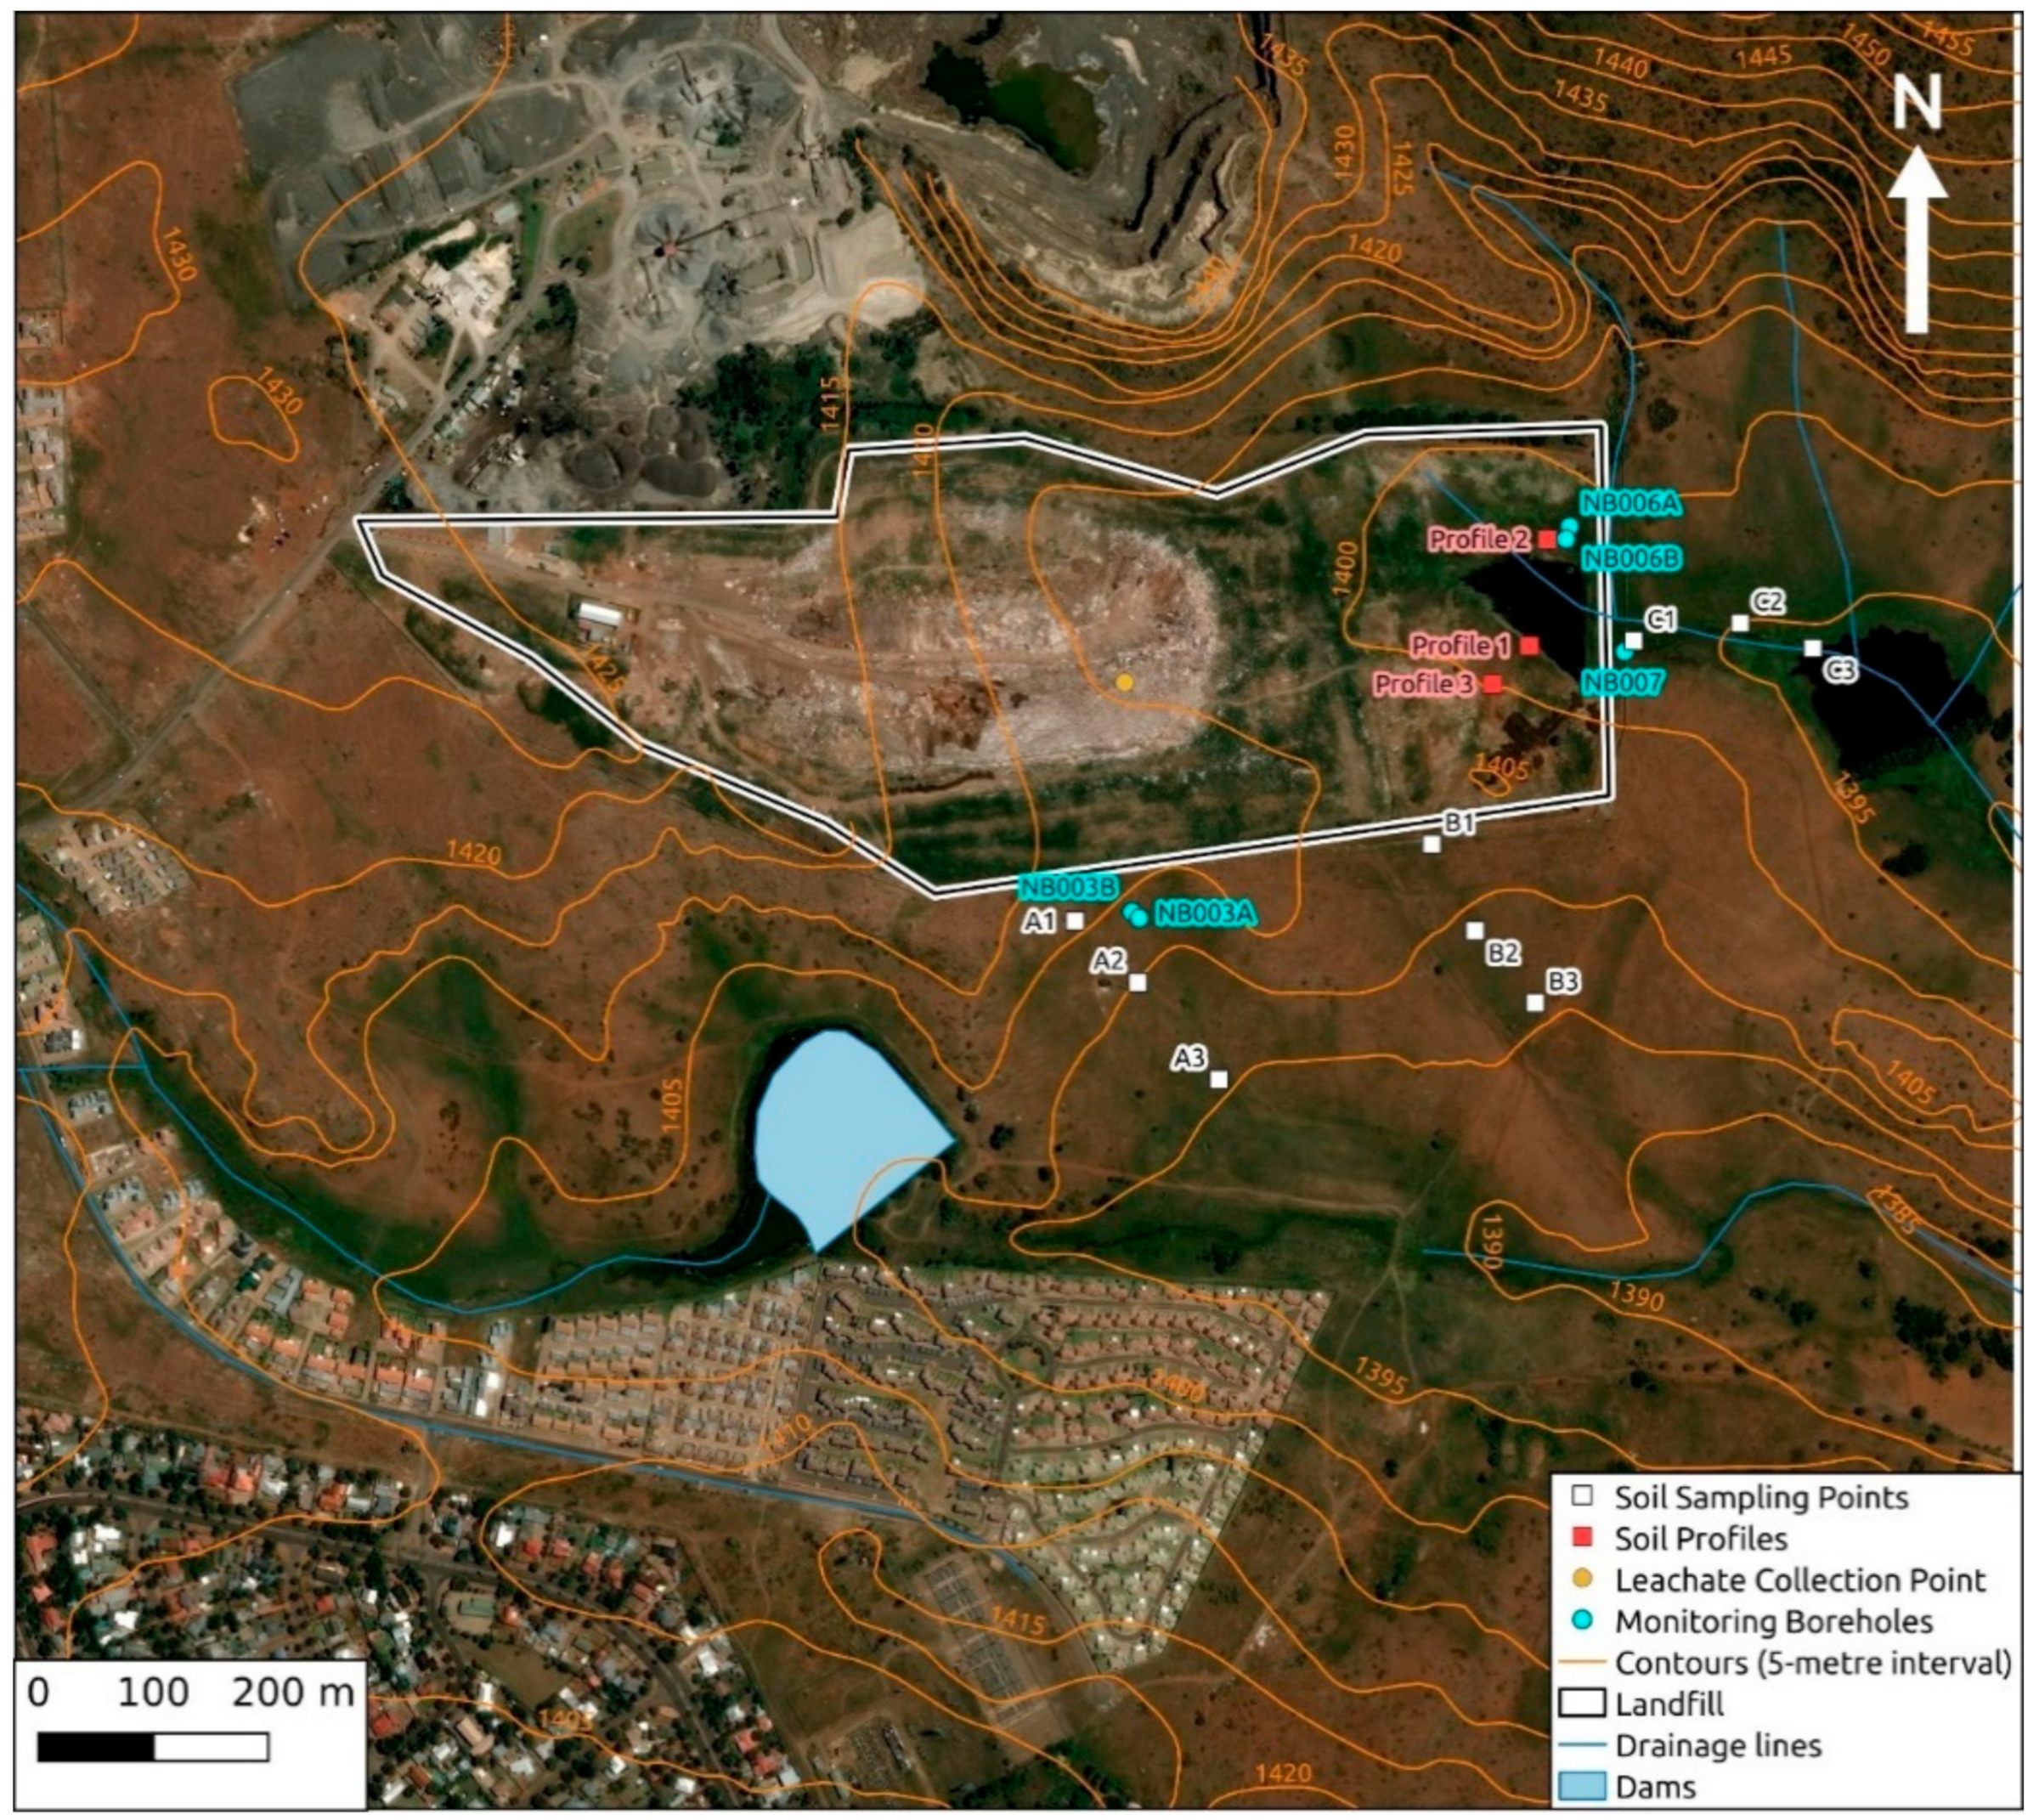
2.1. Study Area

The landfill site is located on the northern margin of Bloemfontein city, Free State Province, South Africa. The landfill is used to dispose of domestic and trade waste, building rubble, garden greens, and tyres (general non-hazardous waste) [21]. The landfill site covers an area of 39.73 ha. The climate of the area is categorised as a cold semi-arid climate (BSK) zone, which entails a steppe climate with dry winters and mean annual temperatures below 18 °C [25]. The average annual precipitation in Bloemfontein is 514 mm, with an evaporation rate of 1,676 mm [26]. The summer season ranges from October to February and winter from May to August, with an average annual mean maximum temperature ranging from ± 26 °C in summer and an average annual mean minimum temperature of ± 8 °C in winter [21]. The soil type of the study area was classified as a duplex soil, with a major portion being clay [27].
The landfill area is characterised by two geological groups of the Karoo Supergroup, namely the Ecca and the Beaufort groups [21]. The Beaufort group consists of sandstone, shale, and mudstone, which are intruded by dolerite dykes and sills [28]. Two aquifer types are common to the Bloemfontein area—fractured and intergranular aquifers [21]. The intergranular aquifers consist of sedimentary rocks that have a series of dolerite intrusions [29]. The dolerite dykes have an average borehole yield of between 0.5 l/s and 5 l/s [21]. According to Butler [29], the landfill has a steep slope to the north and is situated on a slight rise, which is controlled by a high resistance to weathering of the underlying dolerite. Waste rock piles from a “dolerite mine, located on the north-western boundary and upgradient of the landfill site may affect the chemistry of the ground and surface water, as a large percentage of run-off from the mine drains through a portion of the landfill” [23]. Pollution monitoring boreholes were dug in the eastern and southern sides of the landfill. The boreholes were drilled into dolerite, to a depth of about 35 m. The expected groundwater flow is in a south-easterly direction following the topography [29]. Given the position of the pollution monitoring boreholes with reference to the landfill site, any leachate that flows out of the landfill site would flow towards the boreholes with respect to the topography.

2.2. Groundwater, Surface Water, and Leachate Sampling

To study the impact of leachate from the unlined landfill site, soil and water bodies within the vicinity of the landfill were sampled and analysed. The sampling includes five groundwater samples from existing municipal boreholes drilled for leachate contamination monitoring purposes. A surface water body in close proximity to the landfill site was also sampled. Duplicate samples were collected in autumn (2 March 2018) and winter (19 June 2018). The sampling names followed the municipal labelling of the boreholes (Figure 1). Groundwater sampling followed the description in American Public Health Association (APHA) [30] and surface water was collected directly into sampling bottles.
The landfill does not have a leachate collection system; therefore, the leachate was collected along a drainage path within the landfill site. The leachate was sampled once after an episode of rain in autumn. There was little to no leachate generation during the winter season, due to lack of rainfall and the relative aridity of the landfill environment. All the water samples collected for physiochemical analysis were contained in tight-capped polyethylene bottles, while the ones for microbiological analysis were in tight-capped glass bottles to avoid any contamination. They were kept in a cooler box containing ice before being transferred to the laboratory on the same day of collection for analysis. Water quality analyses (physical, cations, trace elements, anions, and microbial) of the leachate, surface water, and groundwater samples were carried out at the Institute for Groundwater Studies (University of the Free State) using ICP-MS, ion chromatography, and IDEXX (Colilert18) Quanti-TrayTM.

2.3. Soil Drainage and Soil Profile Sampling

Soil sampling followed the drainage pathways from the landfill site. These pathways are what is termed the soil drainage. Sampling was done along drainage A, B, and C, as indicated in Figure 1. Drainage C path had obvious leachate contamination. Three soil profiles were dug along drainage C, namely Profiles 1, 2, and 3 (Figure 1). Drainage samples of about 1 kg were collected at each sampling point to a depth of about 15 cm using an auger. Soil profile sampling was collected up to a depth of 1.2 m.
Soil samples were analysed at the Department of Soil, Crop and Climate Sciences (University of the Free State). Prior to laboratory analysis, soil samples were air-dried for 48 hours. The samples were further grounded and sieved. Subsamples of 40 g from the different soil profile depths were oven dried at 105 °C for 24 hours. These soil samples were prepared for particle size distribution determination using the pipette procedures proposed by the Non Affiliated Soil Analysis Work Committee [31,32].
Soil samples were leached using 0.005 MDTPA (diethylene triamine penta acetic acid), 0.1 M triethanolamine, and 0.01 M CaCl2, at a pH of 7.3. Basic cations (Ca, Mg, Na and K) and soil pH were determined from the soil leachate using a standard method [32]. The DTPA soil test method [32] was used to determine soil metal content of the soil leachate obtained from the soil drainage and profile samples.

2.4. Hydrogeochemistry and Geochemical Speciation

Piper diagrams and sodium adsorption ratio (SAR) diagrams were plotted using the WISH (Windows Interpretation for Hydrogeologists) version 3.02.191, a software program developed by Lukas Eelco from the Institute for Groundwater Studies, University of the Free State. Piper diagrams were used to plot the major ion chemistry of the water samples as well as the classification of the water types. The SAR diagrams were plotted to indicate the sodium adsorption ratio in order to determine suitability of the water for irrigation and the salinity hazard of the water samples was determined with reference to the electrical conductivity (ECs) of the water samples.
Soil saturation indices were determined using geochemical modelling software PHREEQC, interactive version (3.3.12) [33]. The geochemical modelling was done to predict the metal speciation and mineralogical composition of compounds that may have precipitated from the contaminated water samples. Simulations were done for the leachate, and boreholes NB07 and NB03B. Borehole NB07was selected, as it was the most contaminated, possibly because of its location inside the landfill site and along drainage slope C. Borehole NB03B was selected since it was the only borehole that showed significant sulphate concentrations over both seasons and is situated along drainage slope A.
The validity of a geochemical modelling results were based on the quality of the thermodynamic database used [34]. The llnl.dat database was used for this study in PHREEQC software version 3.3.12. Advantages of llnl.dat includes reliable data for a vast number of minerals and aqueous species in the temperature range of 0 to 300 °C [35]. This gives an opportunity to calculate mineral speciation over large temperature ranges. The IInl.dat is based on the revised Helgson–Kirksham-Flowers (HKF) equations together with parameters developed by a number of authors [36].

3. Results

3.1. Soil Physical and Chemical Properties

The spatial chemical distribution of the landfill drainage pathways are given in Table 1 and the physicochemical characteristics of soil profiles around the landfill is given in Table 2. The soils were predominately clay to loamy sand with the most abundant exchangeable cations being Ca and Mg and heavy metals Fe and Mn. Concentration of heavy metals with few exceptions generally fell below the norm threshold values of [37] and [38] while Pb and As were below detectable levels.
The three soil profiles SP1, SP2, and SP3 had particle size distribution with a consecutive decrease in clay fraction and could be characterised as clay to sandy clay, clay loam to loamy sand, and loamy sand, respectively. Exchangeable cations from all soil profiles depths with pH below 7 followed the concentration trend Ca>Mg>Na>K>S>P while at soil pH 7 and above, K and S appeared to exchange positions. Heavy metal concentrations for the respective depths were consecutively highest from SP1, SP2, and SP3 and was consistent with the clay content of these soil profiles. Heavy metal concentration for SP1 at all depths with mean soil pH 7 followed the trend Mn>Fe>Cu>Ni>Cr>Zn>Cd, while SP2 and SP3 with mean soil pH of 6.6 show the trend of Fe>Mn>Cu>Ni>Zn>Cr>Cd.
The higher concentration of Ca and Mg (Table 1) indicated that the drainage slopes had a higher soil pH, which was corroborated by a mean soil pH of not less than 7.02. Similarities in the exchangeable cations and heavy metal concentration trends suggested a common origin of chemical enrichment. However, the A and B drainage slopes showed downslope increase in exchangeable cation and heavy metal concentration while the opposite was observed from the C drainage slope with Ca being the exception. The C drainage also had the highest mean total % C (1.9%), Na (195 mg/kg) and mean metal concentration. Lower pH (6.3 to 7.1) was observed from soil profiles along the drainage C slope, especially from the shallow rocky soil profile (SP3) with clay content less than 20%.

3.2. Physicochemical Characteristics of the Leachate

The leachate samples had a neutral to alkaline pH (pH 7.6) and fell within the South African Department of Water Affairs [39] waste water discharge limit. The leachate samples had an EC of 355 mS/m and COD of 440 mg/L, which were above the DWA wastewater limits [39]. The TDS (2825 mg/L) and TOC (120 mg/L) values were also very high. The results of the leachate physicochemical analyses were compared with the DWA wastewater discharge limits in Table 3. The wastewater limits are applicable to the discharge of wastewater into a water resource as given by Reference [40]. The concentrations of heavy and trace metals in the leachate samples were very small and not included in Table 3.
Some parameters whose concentrations were high and above permissible limits in the water samples were noted in the leachate samples as well. This indicated that they were from the same source, which was likely to be the landfill. The pH was the only parameter within the DWA discharge limit. The leachate had a neutral pH, which indicated a methanogenic stage of leachate corresponding to an old landfill site [41]. The leachate sample had total coliform and Escherichia coli concentrations that exceeded the DWAF wastewater discharge limit (Table 3). The total coliform and E. coli concentrations also exceeded the maximum detectable limit.

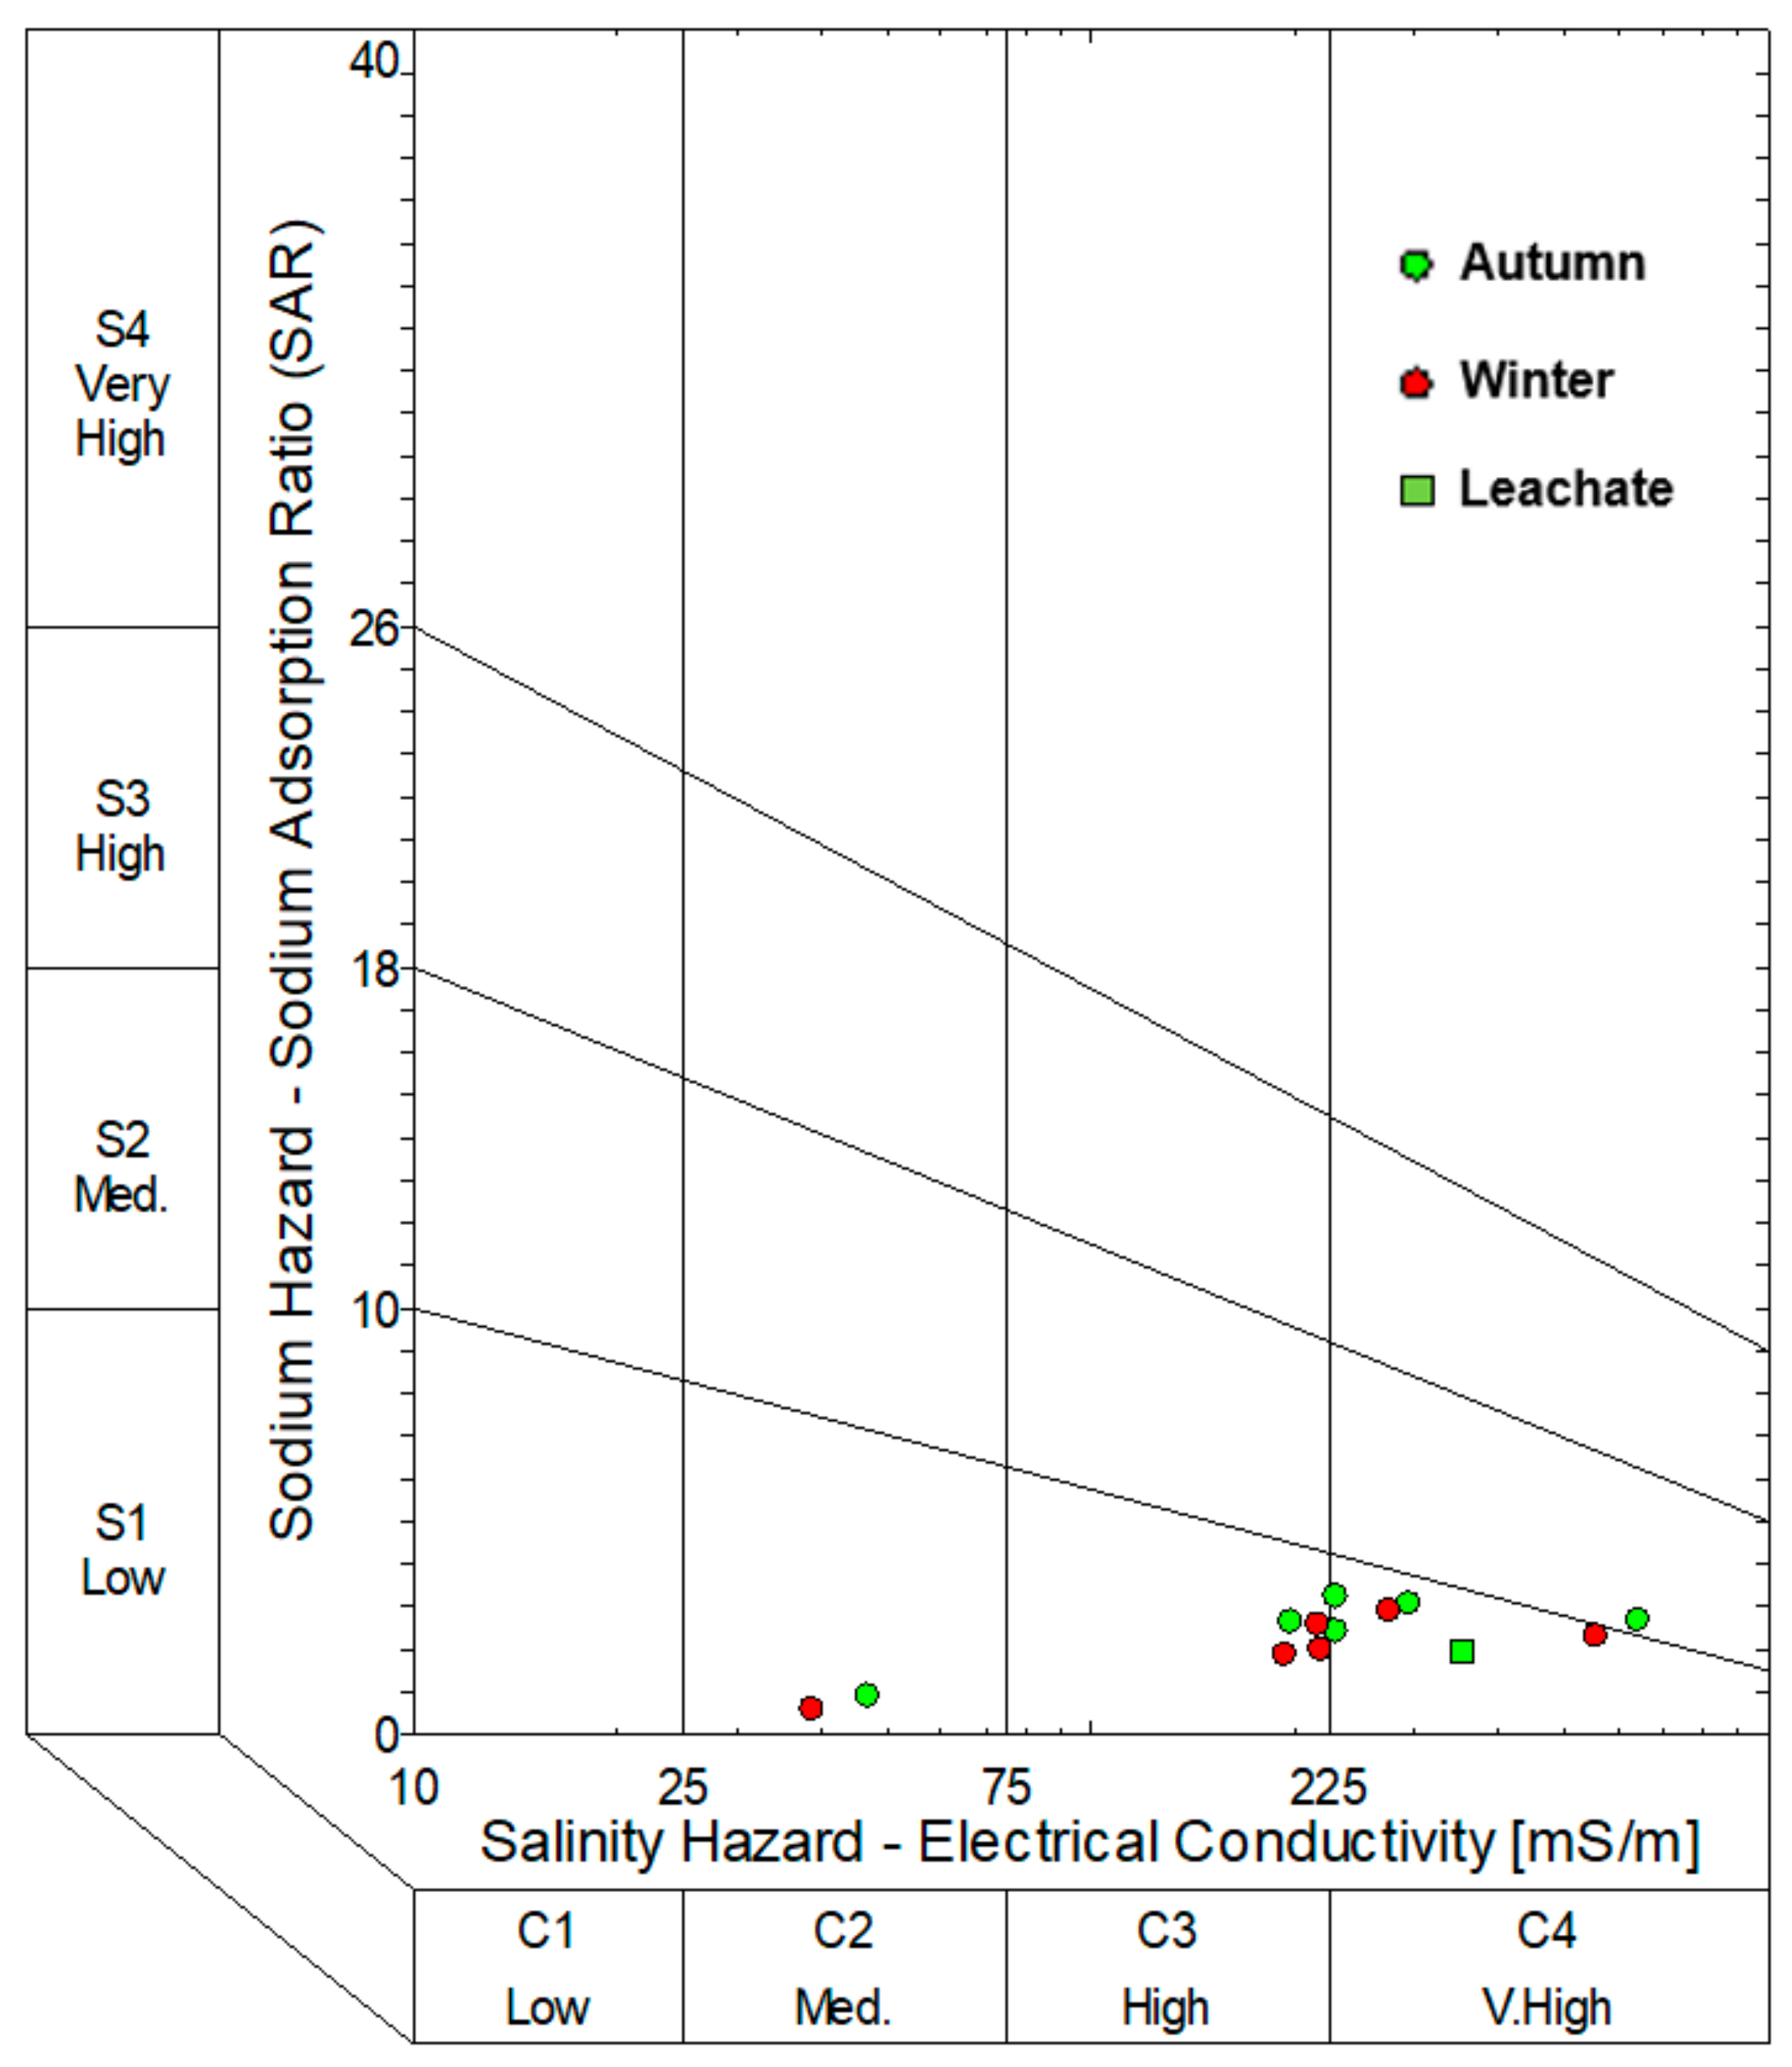
3.3. Water Quality Characteristics of Surface and Groundwater

The physicochemical analyses of the water samples for autumn and winter are presented in Table 3. Heavy and trace metal results were not included, because most had either very low or undetectable concentrations. The mean pH of the water samples varied from 7.3 to 7.9. This indicated that all the sampling sites had a pH within the alkaline range. The mean TDS for the borehole water samples varied from 1343.5 mg/L to 4756.5 mg/L for the autumn and winter samples while that of the surface water was lower with 361 mg/L for autumn and 280.5 mg/L for the winter samples (Table 3). Borehole NB07 had the highest concentration of TDS in both seasons. An indication of the amount of organic matter present in water can be obtained by measuring related properties such as TOC. The mean TOC values for the borehole water samples ranged from 8.3 mg/L to 82.7 mg/L during autumn and 8.7 mg/L to 77 mg/L in winter (Table 3). The TOC of the autumn surface water sample was 27 mg/L and 9.2 mg/L for the winter samples. Among all the boreholes, NB07 had the highest concentration of TOC in the two seasons. Chemical oxygen demand is another measure of organic material contamination in water [42]. The COD values for borehole water samples ranged from 52 mg/L to 299.5 mg/L in autumn and 37 mg/L to 261 mg/L in winter with NBO7 having the highest value in both seasons (Table 3). The COD of the surface water was much higher in autumn (91 mg/L) than winter (31.5 mg/L).
Almost all the borehole water samples had calcium concentrations that were above the SANS241 [43] (150 mg/L–300 mg/L) and WHO [44] (75 mg/L) recommended limit for drinking water, except NB03A and surface water, which were below the SANS241 [43] limit. All the boreholes had magnesium concentrations that exceeded the SANS241 [43] and WHO [44] recommended limits for drinking water in the autumn season. The surface water samples, however, had magnesium concentrations that were within the recommended limits of the standards for drinking water over both seasons. Apart from borehole NB06B and NB03A, all the water samples had sodium concentrations that exceeded all the standards. Borehole NB07 had the highest concentrations of all the three Ca>Na>Mg for both sampling seasons. Only borehole NB07 had Br concentrations above the requirements of SANS241 [43] for drinking water with the samples collected in autumn having the highest concentrations. The surface water samples also had sulphate concentrations that were within the permissible limits over both seasons. The anion concentrations for the boreholes had the trend Cl>HCO3>SO4>Br for autumn with a similar trend in winter.

3.4. Bacteriological Characteristics of Water Samples

Total coliform and E. coli were described and grouped based on their common origin or characteristics either as total or faecal coliform [45]. The borehole water samples had total coliform concentrations between 23 cfu/100 ml and 2420 cfu/100 ml for autumn (Table 3). Boreholes NB03B and NB07 and surface water had total coliform concentrations that exceeded prescribed maximum limits (Table 3). The surface water body was the only sampling point that had significant E. coli concentrations in both seasons, with no E. coli detected in the borehole water samples. The borehole water samples had total coliform concentrations between 3 cfu/100 ml and 2420 cfu/100 during winter (Table 3). Borehole NB03B and NB03A had total coliform concentrations that exceeded prescribed maximum limits. All the boreholes, except NB07 in winter (3 cfu/100 ml), had total coliform concentrations exceeding the drinking water standard for both seasons.

3.5. Hydrochemical Facies

Piper plots were constructed to illustrate the hydrogeochemical facies and three main water types were identified (Figure 2). The major ion chemistry of the water samples indicated some variations as well as similarities in the overall chemistry. Autumn and winter samples of Boreholes NB06A and NB06B and winter surface water samples had a similar chemistry and plotted as Ca(Mg)HCO3 water type with alkalinity dominating the anion and no dominant cation. Boreholes NB03A, NB03B, and autumn surface water had a similar chemistry and plotted as Ca(Mg)SO4 water type with a dominant anion of sulphate and no dominant cation. Borehole NB07 plot as Ca(Mg)Cl in the two seasons with chloride as dominant anion and no dominant cation. It is noted that anion exchange occurred for the surface water from Ca(Mg)SO4 in autumn to Ca(Mg)HCO3 in winter. From Figure 3, Leachate, boreholes NB07 and NB03B had a very high salinity hazard in both seasons.

3.6. Geochemical Speciation

Based on results from the water quality analysis, two boreholes (NB03B and NB07) close to the landfill had enriched mineral concentrations above recommended standards of WHO [44] and the South African SANS241 [43] standard for drinking water. These boreholes were located along the drainage path of leachate flowing out of the landfill. Table 4 shows the comparison of speciation of leachate and groundwater for the two seasons. A negative solubility index showed that the solution was undersaturated with respect to the particular mineral, whilst a positive index suggested otherwise [47].
The mineral saturation indices (SI) using the llnl.dat database were calculated for the leachate and the autumn and winter water quality data. Results showed that almost the same mineral type that speciated out of the leachate, speciated out of the two groundwater seasons. The mineral speciation included oversaturation of the following mineral types, carbonate minerals (dolomite, goethite and rhodochrosite), and hydrated minerals of many metals (geothite, hematite, gibbsite, alunite, and Fe(OH)3). These minerals signify two important factors, geogenic and anthropogenic input. Manganese minerals rich rhodocrosite in the groundwater samples were linked to the leachate. Aragonite, dolomite, and calcite precipitated in all the samples for both autumn and winter. During autumn, gibbsite would likely not precipitate in the groundwater samples. All the other minerals were undersaturated with no precipitation occurring in the leachate and groundwater samples.

4. Discussion

All the soil samples had a high pH with a common origin based on the similarities of their chemical enrichment. Lower pH (6.3 to 7.1) was observed from soil profiles along the drainage C slope, especially from the shallow rocky soil profile (SP3) with clay content less than 20%, which meant a low buffering and adsorption potential for exchangeable cations and other dissolved leachate compounds (Table 2). Clay minerals tend to stick together, reducing the downward movement, and their electrically charged complex sites give clay soils a high cation exchange capacity. In this regard, SP1 demonstrated decreased concentrations with depth of exchangeable cations and metals compared to SP2 and SP3, which had variable vertical concentrations. The C drainage also had the highest mean total % C (1.9%), Na (195 mg/kg) and mean metal concentration. High Na levels are associated with soil structural instability due to clay dispersion and swelling properties that exacerbate poor internal drainage and high surface runoff generation [5]. The higher clay content of up to 44% from SP1 and SP2 (C drainage slope) could have been the reason for the higher Cu concentrations for all three downslope positions falling above the norm value of 6.5 mg/kg (Table 2). The high levels of Cu along the drainage slope posed the risk of contaminating downslope vegetation and surface water bodies used by livestock and humans. If ingested in large doses, Cu could cause anaemia, liver and kidney damage, as well as stomach and intestinal irritation [48].
All the water samples had pH within the recommended drinking water and irrigation standards. The WHO [44] and SANS241 [43] recommends that a TDS concentration below 500 mg/L and 1200 mg/L respectively is suitable for drinking water. All the borehole samples had TDS concentrations above these permissible limits. According to Ngabirano et al. [49], high temperatures during dry seasons facilitate dissolution, ion-exchange capacity, desorption, and weathering processes. Considerable rainfall had been received prior to sampling in March 2018 after a long summer period where the study area had been relatively dry. This would have facilitated long-term dissolution, since the change in groundwater composition is not an instantaneous process, but occurs over time, thereby contributing to an increase in TDS.
Groundwater recharge through the dolerite dykes and fractures from rainfall that already contained elements in solution from the landfill could have facilitated more dissolution and caused considerable increases in TDS during autumn. The winter months were dry with much lower temperatures up to −0.75°C according to the Bloemfontein weather office monitoring stations. This explained why the TDS concentrations were much lower in winter than autumn. This supported the idea that seasonal variation had an influence on the composition of the water samples. The surface water body had TDS concentrations that were within the permissible limits for drinking water over both seasons.
Chloride is a common toxin in water and adds a distinctive salty taste to water [50]. Chloride is also an indication of the corrosiveness and salinity of the water with respect to household appliances and irrigation [26]. All the boreholes samples exceed the SANS241 [43] and WHO [44] recommended limit of Cl for drinking water and irrigation purposes in both seasons. However, the surface water Cl concentrations were below the recommended limit of the standards used in this study. The high Br concentrations in NB07 above the requirements of SANS241 [43] for drinking water in both seasons with autumn having the highest concentrations could be due to the proximity of the borehole to the landfill site. According to Sasakova et al. [51], bromide is introduced in surface waters and aquifers because of agricultural, industrial and residential activities. The wastes coming from different human activities that are deposited in the landfill site may be the potential origin of these significant bromide concentrations. Boreholes NB03A and NB03B were the only boreholes that had sulphate concentrations exceeding the SANS 241 [43] and WHO [44] for drinking water. Sulphate originates from a variety of sources, including natural and industrial effluents, with mineral resources like barite and gypsum being the dominant natural mineral resources for sulphate in groundwater. Sulphate concentrations in unpolluted water are typically less than 10 mg/L and is considered a common pollutant in mining areas [26]. There are no given specifications for sulphate concentrations for irrigation purposes in the DWAF specifications for irrigation [44]. All the borehole samples met the requirements of the FAO guidelines for irrigation [52] of 1000 mg/L although NBO3B had concentrations almost close to this limit in both season.
Manganese concentrations for some of the borehole samples exceeded the DWAF specifications for irrigation [46]. Borehole NB07 had manganese concentrations that exceeded the DWAF specifications for irrigation of 0 mg/L, with 5.3 mg/L for the autumn sample and 2.7 mg/L for the winter sample. According to Ahmad [53], manganese is a common metallic element that occurs naturally in deeper wells with little or no oxygen present and can occur from the weathering of amphiboles as well as anthropogenic sources such as industrial effluents, landfill leakages and acid mine drainage. Boreholes NB07, NB06A, and NB06B had the highest bicarbonate concentrations over both seasons. Calcium and magnesium mainly originate from carbonate minerals such as calcite and dolomite, with magnesium also originating from ferromagnesian minerals, such as olivine, garnet, and amphiboles [42]. Sodium is considered an important ion on the Earth’s crust [42]. With reference to major ion concentrations and irrigation purposes, all the boreholes had sodium concentrations that exceeded the recommended limit for irrigation, with no given specifications for irrigation for both calcium and magnesium. Although all the boreholes had sodium concentrations exceeding the recommended limit, none of the boreholes had a sodium hazard as indicated by the SAR diagram (Figure 3). Boreholes NB06A and NB06B in both seasons and the winter water surface sample had similar water chemistry of Ca(Mg)HCO3. Calcium bicarbonate water is typical of shallow, fresh groundwater and evidence of rock dissolution. Boreholes NB03A, NB03B, leachate, and autumn surface water had a similar chemistry and plotted as Ca(Mg)SO4 water type. Calcium (magnesium) sulphate water type is typical of gypsum rich groundwater and mine drainage [54]. However, further analysis from the geochemical modelling showed that there was an under saturation of gypsum in all the samples including leachate. Borehole NB07 plotted as Ca(Mg)Cl in both seasons, which is due to the significant high concentrations of Cl in the water samples compared to other boreholes. All the boreholes and the surface water body had nitrate and nitrite concentrations that were within the SANS241 [43] permissible limit for drinking water.
The EC values were very high in groundwater samples exceeding the SANS 241 [43] and WHO [44] standards for drinking water of 170 mS/m and 150 mS/m respectively in both the autumn and winter season. Borehole NB07 had the highest EC values over both seasons. The surface water body had EC values that were within the permissible limit for drinking water over both seasons according to the standards. All the boreholes also had EC values that exceeded the DWAF specifications for irrigation [46] as an EC of 43 mS/m is recommended for irrigation purposes.
The high salinity hazards (high electrical conductivities) of boreholes NBO7 and NBO3B rendered them unfit for irrigation. The surface water body had an EC value within the permissible limit for irrigation in the winter season, but exceeded the limit during the autumn season. pH is one of the factors that influences the fate and transport of contaminants in the environment and a low pH can cause the dissolution of metals and nutrients in the water thereby releasing toxic elements that may pollute water [55]. The neutral to alkaline pH of both the surface and borehole water might have been one of the driving factors behind the absence of both heavy and trace metals. The absence of heavy metals may also have been an indication of the type of waste deposited in the landfill site, which was not of industrial or mining origin as the site received mostly domestic waste.
Coliforms and faecal coliforms are established indicator organisms that are reliable for the detection of faecal contamination in water due to sewage disposal or other sources [45]. All the borehole samples and surface water samples had total coliform above the permissible level for drinking water in the two seasons. Only the surface water had E. coli concentration in both seasons with the highest amount (613 cfu/100 ml) in autumn. The total coliform and E. coli concentration in the leachate was above the detention limit. Hossain et al. [56] indicate that the surface water that flows through wastes can dissolve and leach harmful chemicals that are carried away from the landfill into surface water. According to Sanders et al. [57], total coliform and E. coli concentrations in surface water generally correspond to high rainfall and are usually higher in summer months. The landfill was a potential source of bacterial contamination through direct runoff since it is located at a higher elevation relative to the surface water body and there are no erosion control barriers in place.

Implications of Water and Soil Quality on Food and Water Security

According to Nagarajan et al. [58], the determination of physicochemical and bacteriological characteristics of water is essential to assess the suitability of water for drinking and irrigation purposes. Kumar and James [42] further illustrate that the reliability of water for various purposes depends on the chemical and physical quality of the water. The borehole water near the landfill site is currently not in use for both domestic and irrigation purposes. Bloemfontein is a semi-arid area and the protection of groundwater resources is important, because groundwater is the next available alternative source of water when surface water bodies are unable to meet the demand. Apart from the boreholes sampled for this study not being considered as a potential source of water, there is a possibility that boreholes located at the south-eastern direction of the landfill can be contaminated based on the geohydrology of the study area, because the groundwater flows in a south eastern direction. Based on findings from this study, where most of the parameters were above the permissible limit of SANS241 [43], WHO [44] for drinking water, and DWAF specification for irrigation [46], there was an indication that the groundwater was unfit for drinking, domestic, and irrigation purposes. Irrigation water of poor quality changes the physical and chemical properties of soil leading to reduced soil productivity, produces toxic crops with ultimate reduction in yield [59]. This could impact water and food security, especially during times of drought similar to the one that occurred in 2015–2017 in South Africa [19].
The surface water body could have been a potential alternative source of water for irrigation purposes in the surrounding smallholdings. However, because of the elevated coliform and E. coli concentrations, the surface water was unfit for both irrigation and domestic use. There are no given specifications for irrigation and the permissible total coliform concentration in water depends on the type of crop being irrigated [46]. The water resources in the study area did not align with the definition of water security proposed by Frone and Frone [18], namely “the sustainable availability of water quantity and quality acceptable for production, livelihoods and health, coupled with acceptable level of risk to society related to unpredictable impacts“.
Relationships between pH and mobility of chemical compounds had an influence on the landfill soil and water quality. The neutral to alkaline pH of the soil, leachate, and borehole water illustrated the significant concentrations of basic forming exchangeable cations (Ca2+, Mg2+, K+, and Na+). These cations could have been enriched through weathering of the local parent material [60] or the landfill leachate [13]. Almost all the metal concentrations were lower than the threshold values, indicating that the waste disposed at the landfill had low metal content. Copper was the only metal that had concentrations (21 to 29 mg/kg) higher than the threshold value (16 mg/kg). Nevertheless, the high levels of Cu posed minimal risk to water and food security, given the complex interaction Cu has with the environment, which makes its concentration become rapidly stable and non-accumulative [61].
Geochemical modelling showed that toxic metals and minerals such as smithsonite, otavite, hausmannite, and pyrolusite were undersaturated in all the water samples. The few minerals that speciated out of the groundwater (geothite, hematite, gibbsite, Fe(OH), and alunite) as a result of the leachate influence could adversely affect water quality and negatively impact on food security. The oversaturation of carbonate dominant minerals speciation collaborated the suggestions that rainfall induced the leachate generation in the landfill, while undersaturation of sulphate minerals speciation such as jarosite, malanterite and CdSO4 indicated their low presence and inability to dominate and influence the geochemical process. This suggested that their impact on the groundwater quality, and water and food security was minimal. The elevated elements in the hydrated minerals could have been harmful for irrigation of crops.
Based on the results from this study, the low metal content in the soil and water samples did not pose a threat to food and water security. Although the findings from the study showed that most parameters in the soil except Cu were within the permissible limit, because of the pH and soil type of the study area, the lack of good quality water needed for crops irrigation and livestock watering may compromise food security. According to Brown [62], water security will be closely linked with food security in the future, which could impact the sustainable development of Bloemfontein as basic human needs could be compromised. Of note, is that the metal concentrations in the soil increased downslope with distance from the landfill along drainage lines. This could be a risk to land use downslope of the landfill. Considering the three pillars of sustainability and sustainable development, which consists of the triple PPPs (people, planet, and profit), the potential future loss of water and food security could lead to adverse impacts on residents’ safety, health and livelihoods, severe degradation of the surrounding ecosystems and environment, and ultimate reduction in economic growth [63]. Based on the concept of sustainable development, research has shown that environmental degradation correlates positively with poverty [64] and water security provides the platform on which sustainable multi-sectors can be built [63]. Two of the factors that will affect food security in the study area are increased urbanisation and pressure on water resources [18].

5. Conclusions

This study explored the influence of landfill leachate on the surrounding soil and water quality of the Northern landfill in Bloemfontein and the implication on water and food security. Based on findings, most of the parameters analysed were above the permissible limit of SANS241, WHO for drinking water, and DWAF specification for irrigation, an indication that the groundwater was unfit for drinking, domestic, and irrigation purposes. The piper diagram employed in the study showed that the leachate and most of the groundwater samples plotted in the same vicinity in the autumn season, an indication that the leachate influenced the quality of the borehole samples. The oversaturation of manganese, iron, and aluminium metals precipitating out of the leachate and groundwater samples close to the landfill made the groundwater unsuitable and unsustainable for water and food security. Since manganese is readily absorbed by plants, excessive groundwater rich manganese water use for irrigation will lead to enrichment of manganese in food. Excess manganese and iron in drinking water will cause aesthetic problems. Iron and manganese are essential nutrients in food yet toxic at high levels. Their toxicity will complicate the health of consumers of food irrigated with the iron and manganese enriched water in the region.
Almost all the parameters analysed in the soil were within the normal threshold except for Cu. However, contamination of water resources could affect water and food security since the quality of the water was unfit for drinking and irrigation purposes. Of note, is the fact that samples from boreholes close to the landfill had higher concentrations of most parameters analysed in the water samples while the soil samples showed an increase in concentration of parameters with distance downslope along drainage lines; a possible risk to land use downslope of the landfill. In terms of the triple bottom line of sustainability, namely people, planet, and profit, the findings indicated that all the three pillars can be compromised, thereby hindering the sustainable development of the Bloemfontein area and surroundings. We therefore proposed that a leachate collector be installed and a barrier be erected at the south-eastern side of the landfill to contain the leachate, especially when rain falls. Implementation of a circular economy in Bloemfontein city will reduce waste generation and disposal in landfills, which would translate to less pollution of surrounding environmental resources.

Author Contributions

Conceptualization, O.O.O.; formal analysis, O.O.O., S.M., S.A.O., and R.M.; funding acquisition, O.O.O.; investigation, O.O.O., S.M., and R.M.; methodology, O.O.O., S.M., S.A.O., and R.M.; project administration, O.O.O.; resources, O.O.O.; supervision, O.O.O.

Funding

This research was funded by funding from the University of the Free State Interdisciplinary Fund, the Centre for Environmental Management, and the Department of Geology, University of the Free State.

Conflicts of Interest

The authors declare no conflict of interest. The funders had no role in the design of the study; in the collection, analyses, or interpretation of data; in the writing of the manuscript, or in the decision to publish the results.

References

  1. Omran, A.; Gavrilescu, M. Municipal solid waste management in developing countries: A perspective on Vietnam. Environ. Eng. Manag. J. 2008, 7, 469–478. [Google Scholar] [CrossRef]
  2. DEA (Department of Environmental Affairs). National Waste Management Strategy, Government Gazette 35306; Government Notice 344 of 4 May 2012; Department of Environmental Affairs: Pretoria, South Africa, 2012.
  3. South African Waste Management Series, 2015. Available online: https://www.environment.gov.za/sites/default/.../environmentoutlook_chapter13.pdf (accessed on 25 June 2018).
  4. Sholichin, M. Field investigation of groundwater contamination from solid waste landfill in Malang, Indonesia. Int. J. Civ. Environ. Eng. 2012, 12, 74–81. [Google Scholar]
  5. Aderemi, A.O.; Oriaku, A.V.; Adewumi, G.A.; Otitoloju, A.A. Assessment of groundwater contamination by leachate near municipal solid waste landfill. Afr. J. Environ. Sci. Tech. 2011, 5, 933–940. [Google Scholar]
  6. El-Gohary, F.A.; Kamel, G. Characterization and biological treatment of pre-treated landfill leachate. Ecol. Eng. 2016, 94, 268–274. [Google Scholar] [CrossRef]
  7. Krčmar, D.; Tenodi, S.; Grba, N.; Kerkez, D.; Watson, M.; Rončević, S.; Dalmacija, B. Preremedial assessment of the municipal landfill pollution impact on soil and shallow groundwater in Subotica, Serbia. Sci. Total Environ. 2018, 615, 1341–1354. [Google Scholar] [CrossRef] [PubMed]
  8. Aljaradin, M.; Persson, K.M. Environmental impact of municipal solid waste landfills in semi-arid climates: Case study-Jordan. Open Waste Manag. J. 2012, 5, 28–39. [Google Scholar] [CrossRef]
  9. Dharmarathne, N.; Gunatilake, J. Leachate characterisation and surface groundwater pollution at municipal at municipal solid waste landfill of Gohagoda, Sri Lanka. Int. J. Sci. Res. Publ. 2013, 3, 1–7. [Google Scholar]
  10. Magaji, J.Y. Effects of waste dump on the quality of plants cultivated around Mpape dumpsite FCT Abuja, Nigeria. Ethiop. J. Environ. Stud. Manag. 2012, 5. [Google Scholar] [CrossRef]
  11. Swati, P.G.; Das, M.T.; Thakur, I.S. In vitro toxicity evaluation of organic extract of landfill soil and its detoxification by indigenous pyrene-degrading Bacillus sp. ISTPY1. Int. Biodeterior. Biodegrad. 2014, 90, 145–151. [Google Scholar] [CrossRef]
  12. Shaikh, P.R.; Bhosle, A.B.; Yannawar, V.B. The impact of landfill on soil and groundwater quality of the Nanded city, Maharashtra. Rese 2012, 4, 56–63. [Google Scholar]
  13. Mohammadi, S.; Heidari, M.; Shahmoradi, B.; Hosseini, G. Assessing landfill leachate heavy metal effect on the surface water quality: A case of Gheshlagh River, Sanandaj City, Iran. J. Adv. Environ. Health Res. 2014, 2, 38–43. [Google Scholar]
  14. Vaverková, M.D.; Adamcová, D. Evaluation of landfill leachate pollution: Findings from a monitoring study at municipal waste landfill. J. Ecol. Eng. 2015, 16, 19–32. [Google Scholar] [CrossRef]
  15. Adamcová, D.; Vaverková, M.D.; Bartoň, S.; Havlíček, Z.; Břoušková, E. Soil contamination in landfills: A case study of a landfill in Czech Republic. Solid Earth 2016, 7, 239–247. [Google Scholar] [CrossRef]
  16. Kanmani, S.; Gandhimathi, R. Assessment of heavy metal contamination in soil due to leachate migration from an open dumping site. Appl. Water Sci. 2013, 3, 193–205. [Google Scholar] [CrossRef]
  17. Lin, A.Y.; Huang, S.T.; Wahlgvist, M.L. Waste management to improve food safety and security for health advancement. Asia Pac. J. Clin. Nutr. 2009, 18, 538–545. [Google Scholar] [PubMed]
  18. Frone, D.-F.; Frone, S. The importance of water security for sustainable development in the Romanian Agri-Food sector. Agric. Agric. Sci. Proc. 2015, 6, 674–681. [Google Scholar] [CrossRef]
  19. Ololade, O.O. Understanding the nexus between energy and water: A basis for human survival in South Africa. Dev. South. Afr. 2018, 35, 1–16. [Google Scholar] [CrossRef]
  20. Musvoto, C.; Nortje, K.; De Wet, B.; Mahumani, B.K.; Nahman, A. Imperatives for an agricultural green economy in South Africa. S. Afr. J. Sci. 2015, 111, 1–8. [Google Scholar] [CrossRef] [Green Version]
  21. Mangaung Metropolitan Municipality. Integrated Waste Management Plan: Review of Integrated Waste Management Plan; final report; Mangaung Metropolitan Municipality: Bloemfontein, South Africa, 2016.
  22. Hartzenberg, S. Northern Dumping Site Causing Unhappiness in Bloemfontein. OFM News. Available online: https://www.ofm.co.za/article/local-news/265257/northern-dumping-site-causing-unhappiness-in-bloemfontein (accessed on 24 May 2019).
  23. Verhagen, B.T.; Butler, M.J.; Levin, M.; Walton, D.J. Investigation of Ground Water Pollution Associated with Waste Disposal: Development of an Environmental Isotope Approach: Report to the Water Research Commission; WRC Project No 311/1/01; Water Research Commission: Pretoria, South Africa, 1996; ISBN 1-86845-739-7.
  24. Naveen, B.P.; Sumalatha, J.; Malik, R.K. A study on contamination of ground and surface water bodies by leachate leakage from a landfill in Bangalore, India. Int. J. Geo-Eng. 2018, 9, 1–20. [Google Scholar] [CrossRef]
  25. Dingaan, M.N.V.; Du Preez, P.J. Grassland communities of urban open spaces in Bloemfontein, Free State, South Africa. Koedoe 2013, 55, 1–8. Available online: http://0-dx-doi-org.brum.beds.ac.uk/10.4102/koedoe.v55i1.1075 (accessed on 30 September 2017). [CrossRef]
  26. DWA. Development of Water Reconciliation Strategies for the Luvuvhu and Letaba Water Supply System: Literature Review Report. Prepared by WRP Consulting Engineers (Pty) Ltd, in association with DMM Development Consultants cc, Golder Associates Africa, Kwezi V3 Engineers and Zitholele Consulting; Department of Water Affairs: Pretoria. 2012. Available online: https://www.academia.edu/7903476/Development_of_A_Reconciliation_Strategy_For_The_Luvuvhu_And_Letaba_Water_Supply_System_Literature_Review_Report (accessed on 8 September 2018).
  27. Hensley, M.; Le Roux, P.; Du Preez, C.; Van Huyssteen, C.; Kotze, E.; Van Rensburg, L. Soils: The Free State’s Agricultural Base. S. Afr. Geog. J. 2006, 88, 11–21. [Google Scholar] [CrossRef]
  28. Botha, J.F.; Cloot, A.H. Karoo Aquifers: Deformations, Hydraulic and Mechanical Properties; Report to the Water Research Commission by the Institute for Groundwater Studies; University of the Free State: Bloemfontein, South Africa, 2004. [Google Scholar]
  29. Butler, M.J. Groundwater Pollution at Sanitary Landfill Sites; Geohydrological, Environmental Isotope and Hydrochemical Studies. Master’s Thesis, University of the Free State, Bloemfontein, South Africa, 1998. [Google Scholar]
  30. APHA; AWWA; WEF. Standard Methods for the Examination of Water and Wastewater, 21st ed.; American Public Health Association; American Water Works Association; Water Environment Federation; Government Printing Office: Washington, DC, USA, 2005.
  31. Papuga, K.; Kaszubkiewicz, J.; Wilczewski, W.; Staś, M.; Belowski, J.; Kawałko, D. Soil grain size analysis by the dynamometer method—A comparison to the pipette and hydrometer method. Soil Sci. Annu. 2018, 69, 17–27. [Google Scholar] [CrossRef]
  32. Non Affiliated Soil Analysis Work Committee. Handbook of Standard Soil Testing Methods for Advisory Purposes; Soil Science Society of South Africa: Pretoria, South Africa, 1990. [Google Scholar]
  33. Parkhurst, D.L.; Appelo, C.A.J. User’s Guide to PHREEQC (version 3)—A Computer Program for Speciation, Batch-Reaction, One-Dimensional Transport, and Inverse Geochemical Calculations; U.S. Geol. Survey, Water-Resources Inv. Report 99–4259; USGS: Reston, VA, USA, 2017.
  34. Voigt, M.; Marieni, C.; Clark, D.E.; Gislason, S.R.; Oelkers, E.H. Evaluation and refinement of thermodynamic databases for mineral carbonation. Energy Procedia 2018, 146, 81–91. [Google Scholar] [CrossRef]
  35. Blasco, M.; Gimeno, M.J.; Auque, L.F. Comparison of different thermodynamic database used in a geothermometrical modelling calculation. Proceedia Earth Planet. Sci. 2017, 17, 120–123. [Google Scholar] [CrossRef]
  36. Shock, E.L.; Helgeson, H.C. Calculation of the thermodynamic and transport properties of aqueous species at high pressures and temperatures: Standard partial molal properties of organic species. Geochim. Cosmochim. Acta 1990, 54, 915–945. [Google Scholar] [CrossRef]
  37. Government Gazette. Draft National Norms and Standards for the Remediation of Contaminated Land and Soil Quality (Notice No. 233, 2012); Government Gazette 35160:561, March 19 (Regulation Gazette No. 59, 2008); DEAT: Pretoria, South Africa, 2012.
  38. Tótha, G.; Hermannb, T.; Da Silvac, M.R.; Montanarella, L. Heavy metals in agricultural soils of the European Union with implications for food safety. Environ. Int. 2016, 88, 299–309. [Google Scholar] [CrossRef]
  39. DWA. Guidelines for Leachate Control; Department of Water Affairs: Pretoria, South Africa, 1999.
  40. DWA, Department of Water Affairs, South Africa. Revision of General Authorisations in Terms of Section 39 of the National Water Act, 1998; Government Gazette 36820; Government Printer: Pretoria, South Africa, 2013.
  41. Sabahi, E.A.; Rahim, S.A.; Zuhairi, W.Y.; Nozaily, F.A.; Alshaebi, F. The characteristics of leachate and groundwater pollution at municipal solid waste landfill of Ibb city, Yemen. Am. J. Environ. Sci. 2009, 5, 256–266. [Google Scholar] [CrossRef]
  42. Kumar, P.J.S.; James, E.J. Physicochemical parameters and their sources in groundwater in the Thirupathur region, Tamil Nadu, South India. Appl. Water Sci. 2013, 3, 219–228. [Google Scholar] [CrossRef] [Green Version]
  43. South African National Standard 241-1: Drinking Water, Part 1: Microbiological, Physical, Aesthetic and Chemical Determinants; 241-2:2015 drinking water; SABS: Pretoria, South Africa, 2015.
  44. World Health Organization (WHO). Guidelines for Drinking Water Quality; Final Task Group Meeting; WHO: Geneva, Switzerland, 2015. [Google Scholar]
  45. Elisante, E.; Muzuka, A.N.N. Sources and seasonal variation of coliform bacteria abundance in groundwater around the slopes of Mount Meru, Arusha, Tanzania. Environ. Monit. Assess. 2016, 188, 395. [Google Scholar] [CrossRef]
  46. DWAF. South African Water Quality Guidelines, 2nd ed.; Volume 4: Agricultural use: Irrigation; Department of Water Affairs and Forestry: Pretoria, South Africa, 1996; 196p.
  47. Oke, S.; Vermeulen, D. Geochemical modeling and remediation of heavy metals and trace elements from artisanal mines discharge. Soil Sediment Contam. Int. J. 2017, 26, 84–95. [Google Scholar] [CrossRef]
  48. Wuana, R.A.; Okieimen, F.E. Heavy metals in contaminated soils: A review of sources, chemistry, risks and best available strategies for remediation. Int. Sch. Res. Network Ecol. 2011, 2011, 1–20. [Google Scholar] [CrossRef]
  49. Ngabirano, H.; Byamugisha, D.; Ntambi, E. Effects of seasonal variations in physical parameters on quality of gravity flow water in kyanamira sub-county, Kabale District, Uganda. J. Water Resour. Prot. 2016, 8, 1297–1309. [Google Scholar] [CrossRef]
  50. Patil, P.N.; Sawant, D.V.; Deshmukh, R.N. Physicochemical parameters for testing of water; A review. Int. J. Environ. Sci. 2012, 3, 1194–1207. [Google Scholar]
  51. Sasakova, N.; Gregova, G.; Takacova, D.; Mojzisova, J.; Papajova, I.; Venglovsky, J.; Szaboova, T.; Kovacova, S. Pollution of surface and ground water by sources related to agricultural activities. Front. Sustain. Food Syst. 2018, 2, 42. [Google Scholar] [CrossRef]
  52. FAO. Water Quality for Agriculture. Rome: Food and Agriculture Organisation. Available online: http://www.fao.org/docrep/003/t0234e/T0234E01.htm#ch1.4 (accessed on 5 June 2019).
  53. Ahmad, M. Iron and Manganese Removal from Groundwater: Geochemical Modelling of the Vyredox Method. Master’s Thesis, University of Oslo, Oslo, Norway, 2012. [Google Scholar]
  54. Kumar, P.J. Interpretation of groundwater chemistry using piper and chadha’s diagrams: A comparative study from Perambalur, taluk. Elixir Int. J. 2013, 54, 12208–12211. [Google Scholar]
  55. Khatri, N.; Tyagi, S. Influences of natural and anthropogenic factors on surface and groundwater quality in rural and urban areas. Front. Life Sci. 2015, 8, 23–39. [Google Scholar] [CrossRef]
  56. Hossain, M.L.; Satyajit Roy Das, S.D.; Hossain, M.K. Impact of landfill leachate on surface and ground water quality. J. Environ. Sci. Tech. 2014, 7, 337–346. [Google Scholar] [CrossRef]
  57. Sanders, E.C.; Yuan, Y.; Pitchford, A. Faecal coliform and E. coli concentrations in effluent-dominated streams of the upper Santa Cruz watershed. Water 2013, 5, 243–261. [Google Scholar] [CrossRef]
  58. Nagarajan, R.; Thirumalaisamy, S.; Lakshumanan, E. Impact of leachate on groundwater pollution due to non-engineered municipal solid waste landfill sites of erode city; Tamil Nadu, India. Iran. J. Environ. Health Sci. Eng. 2012, 9, 1–12. [Google Scholar] [CrossRef]
  59. Talukder, M.S.U.; Shirazi, S.M.; Niazuddin, M.; Ghosh, A.K. Groundwater quality and its impact on soil and crop. Bangladesh J. Agric. Sci. 1999, 26, 153–160. [Google Scholar]
  60. Kumar, K.; Chopra, A.K. Monitoring of physico-chemical and microbiological characteristics of municipal wastewater at treatment plant, Haridwar City (Uttarakhand) India. J. Environ. Sci. Tech. 2012, 5, 109–118. [Google Scholar] [CrossRef]
  61. Fitsanakis, V.A.; Zhang, N.; Garcia, S.; Aschner, M. Manganese (Mn) and Iron (Fe): Interdependency of Transport and Regulation. Neurotox Res. 2010, 18, 124–131. [Google Scholar] [CrossRef]
  62. Brown, L.R. Outgrowing the Earth: The Food Security Challenge in an Age of Falling Water Tables and Rising Temperatures; Taylor and Francis: London, UK, 2012; p. 57. [Google Scholar]
  63. Beck, M.B.; Walker, R.V. On water security, sustainability, and the water food-energy nexus. Front. Environ. Sci. Eng. 2013, 7, 626–639. [Google Scholar] [CrossRef]
  64. Ololade, O.O. Sustainable development: An overview. In Environmental Science and Engineering Vol 1: Sustainable Development; Rao, S.Y., Gurjar, B.R., Govil, J.N., Eds.; Studium Press LLC: Houston, TX, USA, 2017; 17p, ISBN 1-62699-089-1. [Google Scholar]
Figure 1. Location of the water and soil sampling points in the northern landfill site.
Sustainability 11 04238 g001
Figure 2. Piper diagram of the leachate and water sample.
Sustainability 11 04238 g002
Figure 3. Salinity hazard (SAR) diagram of leachate, groundwater and surface water.
Sustainability 11 04238 g003
Table 1. Spatial chemical distribution of the landfill drainage pathways.
Exchangeable Cations (mg/kg)Heavy Metals (mg/kg)
DrainageDistance [m]pH (KCl)% CCaMgNaKCuMnFeZn
A107.490.249381901481151.52.911.90.77
A2507.030.26883333148882.510.618.20.89
A31007.360.2620206881632632.817.518.51.23
Mean 7.290.2512804031531552.2610.318.20.96
B107.311.1613254131551552.814.817.31.25
B2507.020.445232601551053.049.470.71.21
B31007.160.6516939481732832.742.524.70.99
Mean 7.160.7511805401601802.835.537.51.15
C107.611.11497880821017521.479.2229.72.31
C2507.581.7524151981807323.751.1128.02.60
C31007.162.83525040519511829.447.6156.52.02
Mean 7.451.94242470195121.724.8159.27171.42.31
NormsSA------16740-240
Norms; SA South African, Government Gazette [37].
Table 2. Physicochemical characteristics of soil profiles around the landfill.
Exchangeable Cations (mg/kg)Heavy Metals (mg/kg)
Soil ProfileDepth (cm)pH (KCl)CaMgNaKSPCdCrCuFeMnNiZnClay%Silt%Sand%Bulk Density
SP 1206.5847801430484.42482035.20.12.011384.561637.61.484425311.79
406.9425001956372.497403.60.040.264.436.78200.60.393516481.85
807.03253627346811402086.40.050.297.732.281720.464126331.87
1206.9812241036335.456333.80.050.192.830.04171.30.53127801.67
SP 2206.512428828209.2129298.80.060.148.183.76562.20.7154811.1
606.3632702058425201318.20.050.139.642.54251.20.38116831.58
1007.0635122022525.61472014.40.040.196.524.76130.60.33626381.64
SP 3106.98886262125.6126135.40.030.332.232.14281.80.49158761.59
206.38185472216266266.60.040.225.930.7130.80.29158761.55
456.262046864170.2331330.040.032.819.3130.50.21199721.43
NormsSA-------7.56.516-74091240
EU>7------1.5-100---200
Norms: SA, South African Government Gazette [37]; EU, European Union limits [38].
Table 3. Water quality parameters of the leachate, surface water and groundwater samples collected in autumn and winter.
Autumn SeasonWinter SeasonWater Quality Guidelines
Sampling SiteLeachateSurfaceNB03ANB03BNB07NB06ANB06BSurfaceNB03ANB03BNB07NB06ANB06BSANS 2015DWAF 1998WHO 2011DWA 1999
pH7.67.77.67.87.47.37.57.97.87.77.47.47.45–9.76.5–8.46.5–8.55–9.5
TDS2825361144924354756.515371647280.51364.5241534321343.51417≤1200-500-
EC35546197.5295643.5230.523038.8193275.5557218216.5≤170<40150150
COD44191191.596.5299.5725231.537772618251---75
TOC120278.31882.711.5139.28.714.6771012≤10---
Ca48943107282.5450.518017641103241391153150300-75
Mg11019122.5171.55201171061611215540510097100-30
Na18028168264351.5169219.517116235272128165≤2000–70200
K110834.5821536810.5100-300
HCO322974174362.5939.5699.5708.512998478647596569---
SO41147119535998311954853697534118≤500-500
Cl55935300318.52190349421352792921656347412≤3000–1052500.25
Br1.40.52.01.91112022823≤3-
Mn1000.9500000210≤0.400≤10 0.1
Total coliform2420242098.52420242023517155224202420242038.536≤10varies101000
E. coli24206130000018000000000
Mean values for TDS, TOC and COD are expressed in mg/L; EC in mS/m; pH in pH units; Total coliform and E. coli in cfu/100 ml. Water guidelines as per South African National Standards (SANS) 241 [43] drinking water standards, World Health Organisation (WHO) [44], Department of Water Affairs (DWA) waste-water limits [39] and Department of Water Affairs and Forestry (DWAF) specifications for irrigation [46].
Table 4. Mineral speciation of leachate and groundwater for the landfill in autumn and winter.
Leachate (SI)Autumn (SI)Winter (SI)
MineralFormulaNB03BNB07NB03BNB07
Al(OH)3Al(OH)3−1.39--−1.15−1.40
AluniteKAl3(SO4)2(OH)1.08--−1.91−3.47
AnhydriteCaSO4−0.54−0.81−2.34−0.87−2.26
AragoniteCaCO30.180.951.101.000.54
CalciteCaCO30.321.091.241.140.68
CdSO4CdSO4−10.63---−11.68
Cd(OH)2Cd(OH)2−7.93---−7.30
DolomiteCaMg (CO3)20.332.302.922.431.74
Fe(OH)3Fe(OH)30.271.821.522.120.39
GibbsiteAl(OH)31.30--1.541.29
GoethiteFeOOH6.167.717.428.016.28
GypsumCaSO4.2H20−0.24−0.50−2.04−0.56−1.98
HaliteNaCl−5.67−5.73−4.82−5.82−5.04
HausmanniteMn3O4−12.81-−8.07−9.07−11.90
HematiteFe2O314.3417.4316.8418.0314.57
JarositeKFe3(SO4)2 (OH)−3.86−3.02−5.98−2.02−8.02
ManganiteMnOOH−5.60-−3.89−4.09−5.30
MelanteriteFeSO4.7H2O−7.06−7.95−8.78−7.64−8.63
OtaviteCdCO3−1.97---−0.92
PyrochroiteMn (OH)2−6.46-−5.1−5.75−6.16
PyrolusiteMnO2.H20−10.64-−8.53−8.33−10.34
RhodochrositeMnCO30.08-1.550.310.80
SideriteFeCO3−1.71−1.57−0.71−1.15−1.18
SmithsoniteZnCO3−2.83---−2.60
SylviteKCl−5.45−7.02−6.03−1.15−6.15
Zn(OH)2Zn(OH)2−4.59---−4.73

