Article

Investigating the Influential Factors of Shared Travel Behavior: Comparison between App-Based Third Taxi Service and Free-Floating Bike Sharing in Nanjing, China

1
School of Transportation, Southeast University, Nanjing 211189, China
2
School of Information, Baoshan University, Baoshan 678000, China
*
Author to whom correspondence should be addressed.
Sustainability 2019, 11(16), 4318; https://0-doi-org.brum.beds.ac.uk/10.3390/su11164318
Submission received: 30 May 2019 / Revised: 4 August 2019 / Accepted: 7 August 2019 / Published: 9 August 2019
(This article belongs to the Section Sustainable Transportation)

Abstract

:
In recent years, app-based third taxi service (ATTS) and free-floating bike sharing (FFBS) have become significant travel modes to satisfy travel demands of urban residents. In order to explore the mechanism of their modes selection, firstly, based on 595 valid samples, differences between ATTS and FFBS in original modes, travel distance, geographical position distribution, and travel emergency degree were compared. Then, a multinomial logistic model was established to investigate the factors influencing the choice among ATTS, FFBS, and traditional travel modes (TTM). The results show that: (1) FFBS attracts users whose original modes are walking, private bicycle and bus, while ATTS has a certain competition effect on cruising taxi and bus. (2) Residents are more likely to change from bus to FFBS on weekends, while this competitive relationship between ATTS and bus has no significant difference in different dates. (3) Compared with TTM, residents are more inclined to utilize shared modes to participate in flexible activities, especially in suburb. (4) Interestingly, ATTS is more likely to be utilized in emergency travel, and the residents without registered permanent residences tend to use FFBS and ATTS. Finally, some suggestions and policies were proposed for the government and enterprises to improve operation managements.

1. Introduction

In recent years, with the rapid development of Internet technology and mobile payment, innovative transportation service models have appeared in China, such as app-based third taxi service (ATTS), free-floating bike sharing (FFBS), car sharing services, scooter sharing, and so on. Among them, ATTS, such as Didi, Uber, and Shenzhou special taxi, and FFBS, such as Mobike and hellobike, are relatively prevalent. As of 2017, the scales of ATTS, FFBS, and car sharing users are approximately 336 million, 400 million, and 8 million, respectively, in China [1,2,3]. This means that ATTS and FFBS have become significant components of urban transportation systems [4,5]. In addition, the Chinese government pays special attention to the development of FFBS and ATTS and it has continuously formulated and updated relevant policies to regulate the operation of such enterprises since 2016 [6,7]. Based on the above reasons, this study chooses the subjects of ATTS and FFBS to explore the shared travel behavior. In particular, the use processes of these two modes are as follows: As for ATTS, a customer could send his/her instantaneous travel request to nearby ATTS drivers through a taxi-hailing application. Once one of the drivers accepts the request, the customer will receive the information of this ATTS. Then this driver will be guided to the location of the customer via the Global Navigation Satellite System and pick up and deliver him/her to the destination [8]. As for FFBS, a customer could easily locate the locations of nearby bikes via a FFBS application and unlock a bike by scanning its QR code. After reaching the travel destination, the customer can simply lock the bike to a reasonable parking area [9]. Compared with traditional travel modes (TTM), ATTS and FFBS, which integrate information technology, have the following superiorities: (1) Customers can view the number of available vehicles or bicycles around and book them in advance through a mobile phone application, which effectively alleviates the difficulty of finding a taxi or a bicycle and solves the problem of overflowing unlicensed vehicles. (2) Mobile payment is convenient, coupons and discount cards would make travel costs more inexpensive. (3) The construction of urban infrastructures could be reduced, such as public bicycle rental stations and taxi stands [9,10]. (4) These two travel modes, as more sustainable modes of transportation, are shifting the traffic tools from private ownership to shared use, which can improve resource utilization and turnover rate [11,12]. However, when we enjoy the convenience of shared travel, a series of problems have also been triggered. First, many ATTS and FFBS enterprises compete in a disordered manner in order to occupy the market, and introduce vehicles and bikes substantially, especially in second-tier and above cities (most of them are provincial capitals and sub-provincial cities). They attract users in the forms of electronic coupons and discount cards, which results in a large deficit of many enterprises [13]. Second, the balance of the urban transportation structure is destroyed, and TTM, such as public bicycle, taxi, and conventional bus, suffer severe competition [14,15]. In addition, as important supplements to urban transportation systems, the travel characteristics and user demands are different among ATTS, FFBS, and TTM [14,16,17]. Therefore, the goal of this study is to explore the travel characteristics of shared travel modes and the factors affecting the choice of ATTS, FFBS, and TTM. In particular, this study addresses the following questions: (1) Is the adoption of ATTS, FFBS, and TTM consistent across different population? (2) What are the differences of the travel characteristics for users of ATTS and FFBS? (3) What factors influence the mode choices among ATTS, FFBS, and TTM? What are the similarities and differences in terms of the influence of each factor? The answers to these questions cannot only clarify their functions and locations, but also provide the basis for the integration and development of urban diversified transports and the renewal of transportation policies.
To address these questions, firstly, differences between ATTS and FFBS in original travel modes, travel distance, position distribution, and travel emergency degree are compared and analyzed, which can clarify their respective status and role. Then, a multinomial logistic (MNL) model is established to examine the factors influencing the modes choice among ATTS, FFBS, and TTM with considering variables such as original travel mode, registered permanent residence, and so on, which helps to understand the differences and similarities of the factors affecting their travel demands clearly. Finally, through the case study of Nanjing, relevant intervention strategies and suggestions can be proposed for the development of ATTS and FFBS and for the innovation of TTM.

2. Literature Review

ATTS and FFBS, as new travel modes which combine traditional modes with Internet technology, understanding their travel characteristics and user preferences are the basis for travel demand forecasting and vehicle/bike redistribution. In our literature review, we mainly concentrate on the research from two aspects: users’ travel characteristics and influential factors of ATTS and FFBS.

2.1. Travel Characteristic of Users

The analysis of travel characteristics of ATTS users was of great significance to understand the demand distribution and travel prediction in ATTS system. As for travel purpose and travel distance, Rayle et al. [14] reported that 67% of ridesourcing trips were for social and leisure, and 16% of those were for commuting, the average travel distance was 5.1 km. In the case of travel date and time, based on the order data of ATTS in Beijing, China, Wang [18] concluded that the travel demands on weekdays were slightly higher than those on weekends and the demand was the lowest on Saturday; the travel peaks appeared in the morning and evening, especially at night. In terms of the impact of ridesharing on vehicle kilometers traveled (VKT), Rodier et al. [19] suggested that relatively large vehicle miles traveled reductions were possible if the use levels of dynamic ridesharing were moderate and high. In addition, through a Monte Carlo simulation method, Tirachini and Gómez-Lobo [20] indicated that the average occupancy rate was a significant parameter in determining the impact on VKT, as the occupancy rate increases, the possibility that ridesharing reduces VKT is higher.
The analysis of travel characteristics of FFBS users played an important role in FFBS introduction and redistribution. For travel distance and travel duration, the riding distance was concentrated in 0.8~2.8 km (mean was 2.3 km), the riding duration was concentrated in 10~25 min (mean was 20 min) [21]. With regard to travel purpose and the time period of travel, FFBS was mainly used for commuting to work, attending school, shopping, and entertainment [5,22], and the travel peaks appeared at 7:00~9:00, 12:00~14:00, and 17:00~19:00 [5,21,22,23]. Regarding the travel position, Shen et al. [15] concluded that FFBS was primarily concentrated in the peripheral residential areas with high population density and access to the mass rapid transit by analyzing the GPS data of dockless bikes in Singapore. In addition, Li et al. [5] drew a thermodynamic chart of the distribution of FFBS in Nanjing by utilizing GPS data, and showed that the trip on weekends would be more active than that on weekdays around the university. Additionally, in the case of the impact of FFBS on the travel change of cyclists, Jia [24] reported that the proportion of cyclists increased from 21.9% to 30.9% in commuting travel and from 22.1% to 33.6% in non-commuting travel.

2.2. Influential Factors of ATTS and FFBS

Studying the influential factors of shared system was not only useful to evaluate service quality, but also helped to reduce operation costs and improve user experience and satisfaction. Among the influential factors of ATTS, short waiting time, the convenience and flexibility, the availability of public transport, and low travel cost were main reasons for promoting the usage of this service. For example, based on semi-structured research interviews and focus groups in Denmark, Nielsen et al. [25] identified that travel cost savings compared to private and public transport, great flexibility and the opportunity to socialize with other passengers were positively impact the usage of ATTS. Rayle et al. [14] showed short wait and travel times and the convenience make ridesourcing more appealing. Perboli et al. [26] showed that 62% of car-sharing members utilized the service when other public transport modes were not available, and the most attractive point of this service was the liberation from the burden of owning a car for both car-sharing members and potential members. Additionally, safety problems, individual privacy concerns and the remoteness of location had negative impacts on the use of ATTS. For example, Nielsen et al. [25] reported that the shortcomings of ATTS were the difficulty in finding rides, insecurity, and social awkwardness with strangers. Additionally, some scholars applied a technology acceptance model to investigate the factors affecting the use of ATTS application. For example, Liu [27] found that perceived usefulness mostly influenced the intentions and attitudes of users to utilize ATTS application, followed by perceived ease of use. Haba and Dastane [10] showed that performance expectancy and social influence positively influenced the use intension of customers, while effort expectancy had no influence.
Among the factors affecting the usage of FFBS, the previous literatures mainly considered bicycle infrastructure (available bikes and racks, bicycle path length), land use and built environment (residence density, the distance from bus facilities, the number of intersections), meteorological data (temperature, rain), and road traffic conditions (traffic congestion, travel safety). For example, Shen et al. [15] concluded that more available bicycles, higher private residential density, longer cycling paths, more accessible bike racks for parking, and the areas with more bus stations positively impacted on the use of FFBS. On the contrary, heavy rainfall and hot weather (above 31 °C) had negative influences. Based on the survey in Shanghai, Xin et al. [28] showed riding environment (the width and the connectivity of bicycle lanes), and laws and regulations (claim mechanism, punishment mechanism) were the major stumbling blocks for commuters in FFBS systems; riding safety (separation facilities, other non-motorized vehicle users’ manner), government intervention (constraint force over bicycle companies, punctuality of management policy notification), and staff service (efficiency of removing broken bicycles) were the major obstacles for non-commuters. In addition, travel attributes (trip time, distance) and travel perceptions (convenience in picking up and parking bikes, malfunction bicycles, travel costs, system service, laws and regulations) were equally important. For example, Du and Cheng [22] demonstrated that the evening peak was more significant than the morning peak in distinguishing patterns choice, and users of short-distance travel tended to select a travel cycle pattern than an origin to destination pattern. When the distance reached 4 km, there was a significant shift to a transfer pattern. Chen et al. [16] performed an investigation of the relationship between users and use frequency of FFBS and public bikes, the results showed that good bike quality and low travel cost were strengths for public bikes, while the freedom and flexibility were the attractive characteristics for FFBS. Li et al. [5] concluded a higher transportation cost, the convenience of picking up and returning a bike, and the contribution to health could promote the usage of FFBS, while limited regulations and malfunctioning bikes restricted the operation efficiency in the FFBS system.
As is evident from the above review, the existing literatures mainly considered the impacts of users’ travel characteristics, user perceptions, and external environment on the shared travel modes, and the number is still few. In addition, these literatures only concerned single ATTS or FFBS systems, or compared FFBS with public bicycles, or compared ATTS with cruising taxis. As the two new and shared travel modes combined with the Internet technology, there are also similarities and differences in travel behaviors and influential factors. Therefore, comparing the characteristics and factors affecting the use of ATTS and FFBS under the same environment is not only significant to enrich the existing research content of shared travel, but can also contribute to the coordination and development of these two systems.

3. Data

3.1. Survey Area

Nanjing, an important central city located in the eastern part of China, is a nationally comprehensive transportation hub. According to “Statistical communique of national economic and social development in Nanjing in 2017”, by the end of 2017, Nanjing had a permanent population of about 8.34 million and a GDP of 1.172 trillion Yuan (170.856 billion dollars) [29]. There were 1246 public bike stations, 705 bus lines, and 10 subway operation lines in the main urban area, the sharing rate of public transit in motorized transportation reached 59%. In addition, the development of bicycle and taxi in Nanjing are far ahead of other cities. As for the operation of bicycles, as of 2017, nearly 40,000 public bicycles and about 450,000 FFBSs were put into the market [30]. With respect to the taxis, as of 2017, about 14,000 cruising taxis and 28,000 ATTSs were put into operation [31]. These factors are of importance for providing new evidence and a profound understanding on shared travel behavior in mainland China. Therefore, Nanjing was selected as a case study city for this research.

3.2. Data Source

The survey was conducted in Nanjing, China, by graduate students at School of Transportation, Southeast University. The period was lasted from 14 May 2018 to 20 May 2018. For the survey location, the face-to-face survey was mainly conducted in some major residential areas, commercial areas, metro and bus stations, schools, parks, and supermarkets; the online survey were conducted by social software, a way that has been utilized by many researches [5,16,17,22,32,33]. In order to ensure the quality of investigation, IP address was restricted to Nanjing and one IP address could complete only once, the answer time was set to at least five minutes in the survey software. In addition, the terminologies in questions were described in detail to assist respondents in understanding the relevant contents better. After completing the questions, the respondents would receive some cash as rewards.
For the survey, firstly, the respondent answered whether he/she usually uses ATTS or FFBS, if he/she had not used these two travel modes, he/she could select one of the traditional travel modes (walk, private bicycle, public bicycle, electric bicycle, conventional bus, subway, private car, cruising taxi, and unlicensed vehicle) which he/she used frequently. Among them, unlicensed vehicles refer to those tricycles and motorcycles that compete with cruising taxis for passengers and illegally carry passengers on the road in urban areas. Then, as for the last travel in which he/she used the travel mode described in the first step, he/she filled in basic attributes information, travel information, and perception information.
(1)
User basic attributes information included gender, age, educational level, occupation, monthly income, time spend on the Internet every day, whether you have a registered permanent residence, whether you have a driving license, whether you have a public bike IC-card, the number of private bicycles, electronic bicycles, and cars in the household. Among them, the registered permanent residence, which is also called “Hukou”, is a special population policy in China. It was introduced in the 1950s to control the movement of the rural population to the big cities. Residents with and without it are treated differently, for example, the migrant workers usually are not qualified to access to local basic services, such as medical care and education welfares [34]. In addition, each question presented specific options for respondents to choose.
(2)
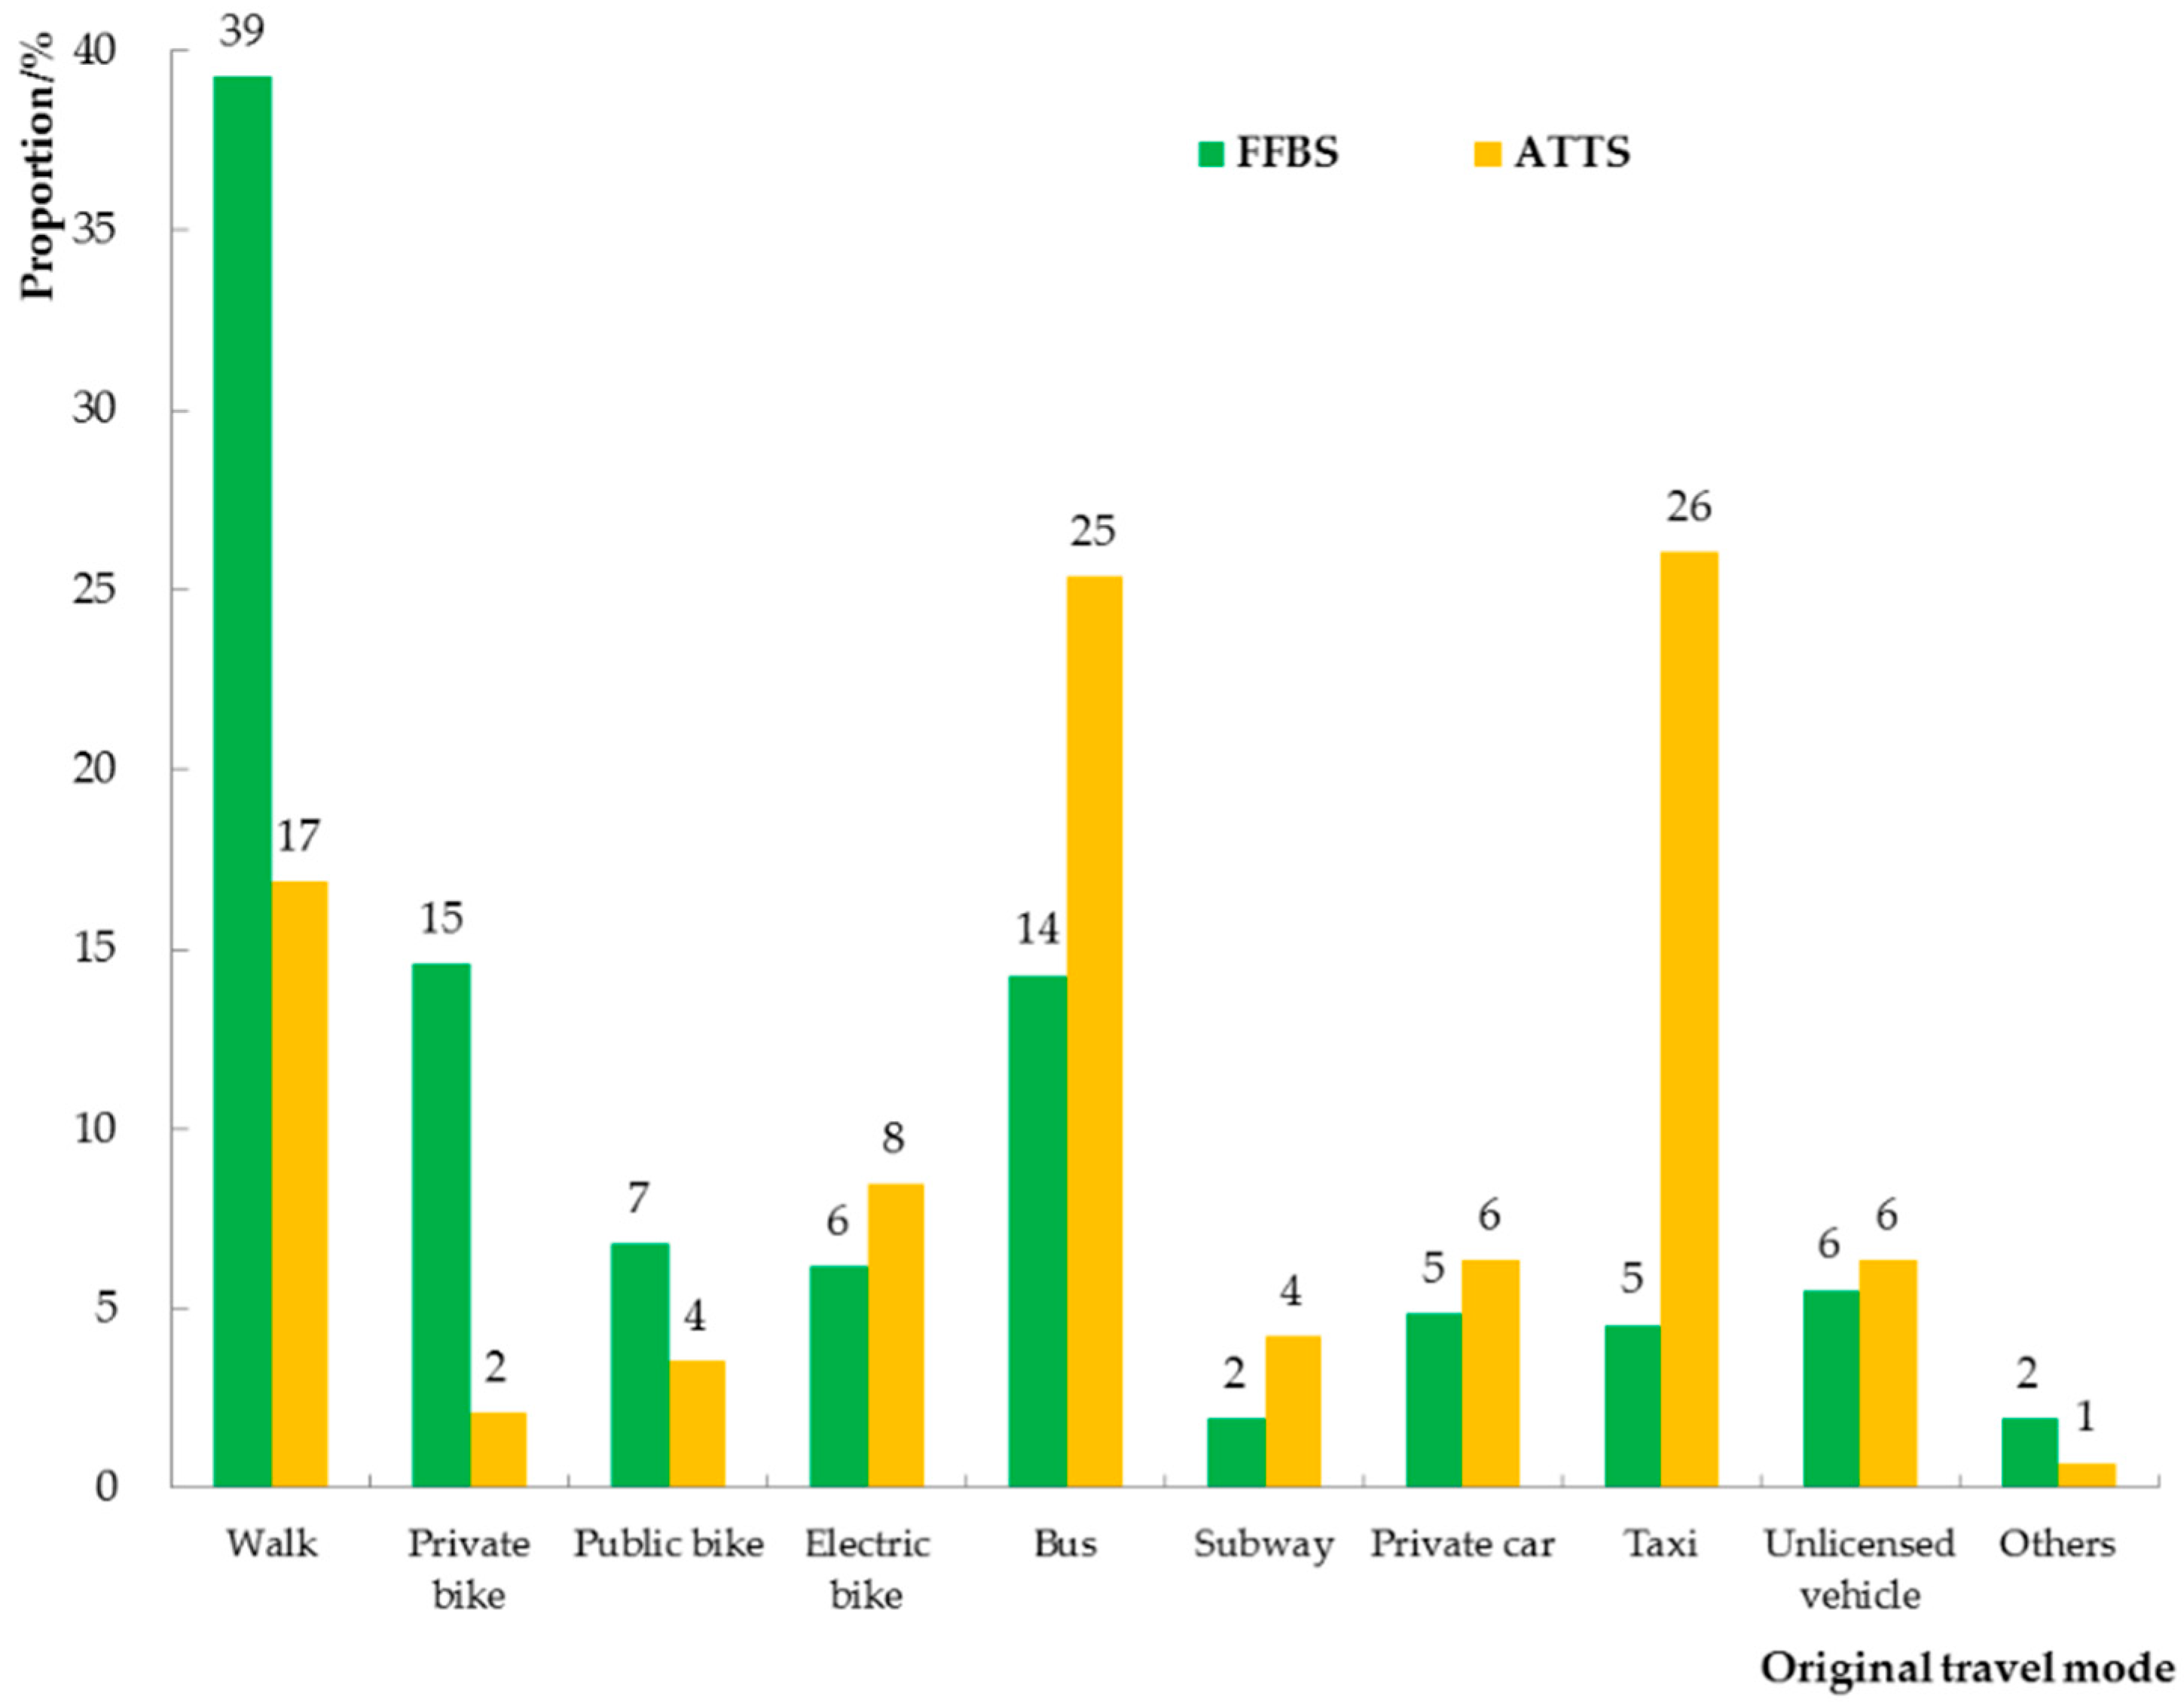
Travel information included original travel mode, travel purpose, travel duration, travel distance, travel frequency in a week, travel time, travel emergency degree, travel origin position, geographic location, and whether there is a transfer with buses or subways. Among them, the original travel mode meant that the traditional travel modes used by the respondents before ATTS and FFBS were introduced. It included motorized and non-motorized travel modes; motorized modes included conventional bus, subway, private car, taxi, and unlicensed vehicle, and non-motorized modes included walk, private bicycle, public bicycle, and electric bicycle. For each traditional travel mode (TTM), its original travel mode was itself. Then, the travel purpose included inflexible and flexible activities, and inflexible activities included attending school, commuting, and returning home. Flexible activities included business affairs, shopping, entertainment, exercise, and others. As for these two variables, in the survey, specific options were provided for respondents to choose. After the survey, we would classify them. In addition, travel duration and travel distance were continuous variables in the original survey. Finally, travel emergency degree represented the time constraint of the traveler for this travel; the greater the time constraint, the greater the value. Particularly, we set 10 levels (1–10) for respondents to choose. In order to reduce the perceived bias of different respondents, the values of travel emergency degree were explained as following: 1–2 represents that time is sufficient, 3–4 represents that time is relatively sufficient, 5–6 represents a generally sufficient amount of time, 7–8 represents that time is relatively tight, and 9–10 represents that time is very tight. The other questions presented specific options for respondents to choose.
(3)
User preferences and perceptions information included convenient to travel, low travel cost, many coupons and discount cards, easy to pay, high security, high comfort, and high accessibility. Five levels (strongly agree, relatively agree, not sure, relatively disagree, strongly disagree) were offered for respondents to choose.
To test the reasonableness of sample information, in the survey, travel time and travel distance were investigated in form of continuous variables. If the difference between these two variables were too large, we would exclude this sample. More specifically, 15 km/h was utilized as a reference speed for FFBS since it was not designed for racing, and 60 km/h was used as a reference speed for ATTS [15]. If the travel speed (travel distance divided by travel time) was more than twice the reference, this sample would be excluded. In addition, the number of bicycles, cars, and whether respondents have a public bike IC-card can test the rationality of the information in traditional travel modes, for example, if the respondent selected private bicycle, and the answer of “the number of private bicycle in household” was “0”, it was clear that the information was doubtful, this sample would be excluded. Additionally, in order to study the influence of geographical location on the choice of travel modes, this paper divided the area in Nanjing into two categories: city center and suburb.
A total of 649 surveys were sent to respondents (online samples: 506; face-to-face samples: 143). After we excluded the samples with incomplete and unreasonable information, 595 valid samples were collected back (online samples: 461; face-to-face samples: 134) and the valid recovery rate was 91.68%. The sample comparison of two survey methods was shown in Table 1. As shown in the table, the proportions of male, adults and student groups in online survey were slightly higher than those in face-to-face survey, but the differences were within the reasonable range.

3.3. Respondent Attributes

The sample proportions of FFBS, ATTS, and TTM account for 26.22%, 22.18%, and 51.60%, respectively. Their basic attributes are shown in Table 2. As seen in the Table 2, the proportions of male and female are more balanced in FFBS, while the proportion in male (57.58%) is higher than that in female (42.42%) as for ATTS, perhaps women are more concerned about the personal safety, property security, and information security problems when riding ATTSs [2]. In terms of age and education level, younger users holding a bachelor’s degree or above is the main group who usually utilize ATTS and FFBS, which coincides with the finding of Li et al. in Nanjing and the result of Rayle et al. in San Francisco [5,14]. Perhaps this group is good at applying the network and dares to accept and try new things. As for occupation and income, most of the respondents are students and employees, accounting for 34.62% and 39.74% for FFBS, 29.55% and 44.70% for ATTS. The middle and low-income population accounts for a large proportion, while the high-income group accounts for only 4.49% and 8.33%; it is probably that the high-income group is more inclined to use private cars [35].

4. Characteristic Analysis

4.1. Original Travel Mode

The original travel modes of ATTS and FFBS are shown in Figure 1. As seen in the figure, as for FFBS, the customers are mainly from the users whose original mode was walking (39%), and perhaps FFBS can improve the accessibility in short-distance travel, especially for the connection in the last kilometer. Then, the original travel mode by private bicycle accounts for 15%; perhaps private bicycle is inconvenient for parking and easily stolen [36], while FFBS could be parked in any reasonable area, and GPS devices can track the location of the bike in real-time to prevent it being stolen [5]. Additionally, the original travel mode by public bike occupies only 7%, indicating that the operation of FFBS and public bikes do not show a strong competitive relationship. However, whether there is a cooperative relationship between them still needs further research. By comparison, as for ATTS, the customers are mainly from those users whose original mode is cruising taxi (26%). One explanation is that ATTS is similar to its function in the city. Another possible explanation is that, compared with taxis, ATTS usually have discount coupons, and customers can view the number of available vehicles around through a mobile phone application, which greatly reduces the travel costs, waiting time, and makes ATTS more appealing [14].
Interestingly, the customers of FFBS and ATTS both come from the users whose original mode is conventional bus, accounting for 14% and 25%, respectively. This implies that shared modes have certain competition effects on bus use. Perhaps the customers of FFBS which come from bus use are more short-distance travel users, and the characteristics of providing door-to-door services and high accessibility in ATTS are precisely what buses lack [14]. At the same time, both of FFBS and ATTS are less attractive to private car users. The explanation may be found in previous research that Chinese families who own private cars still have strong dependence on private cars in daily travel [32]. It suggests that more shared travel users come from the groups who lack private cars. In addition, a small proportion of passenger flow comes from unlicensed vehicles, which indicates that shared modes have a positive effect on standardizing and regulating the market to a certain extent.

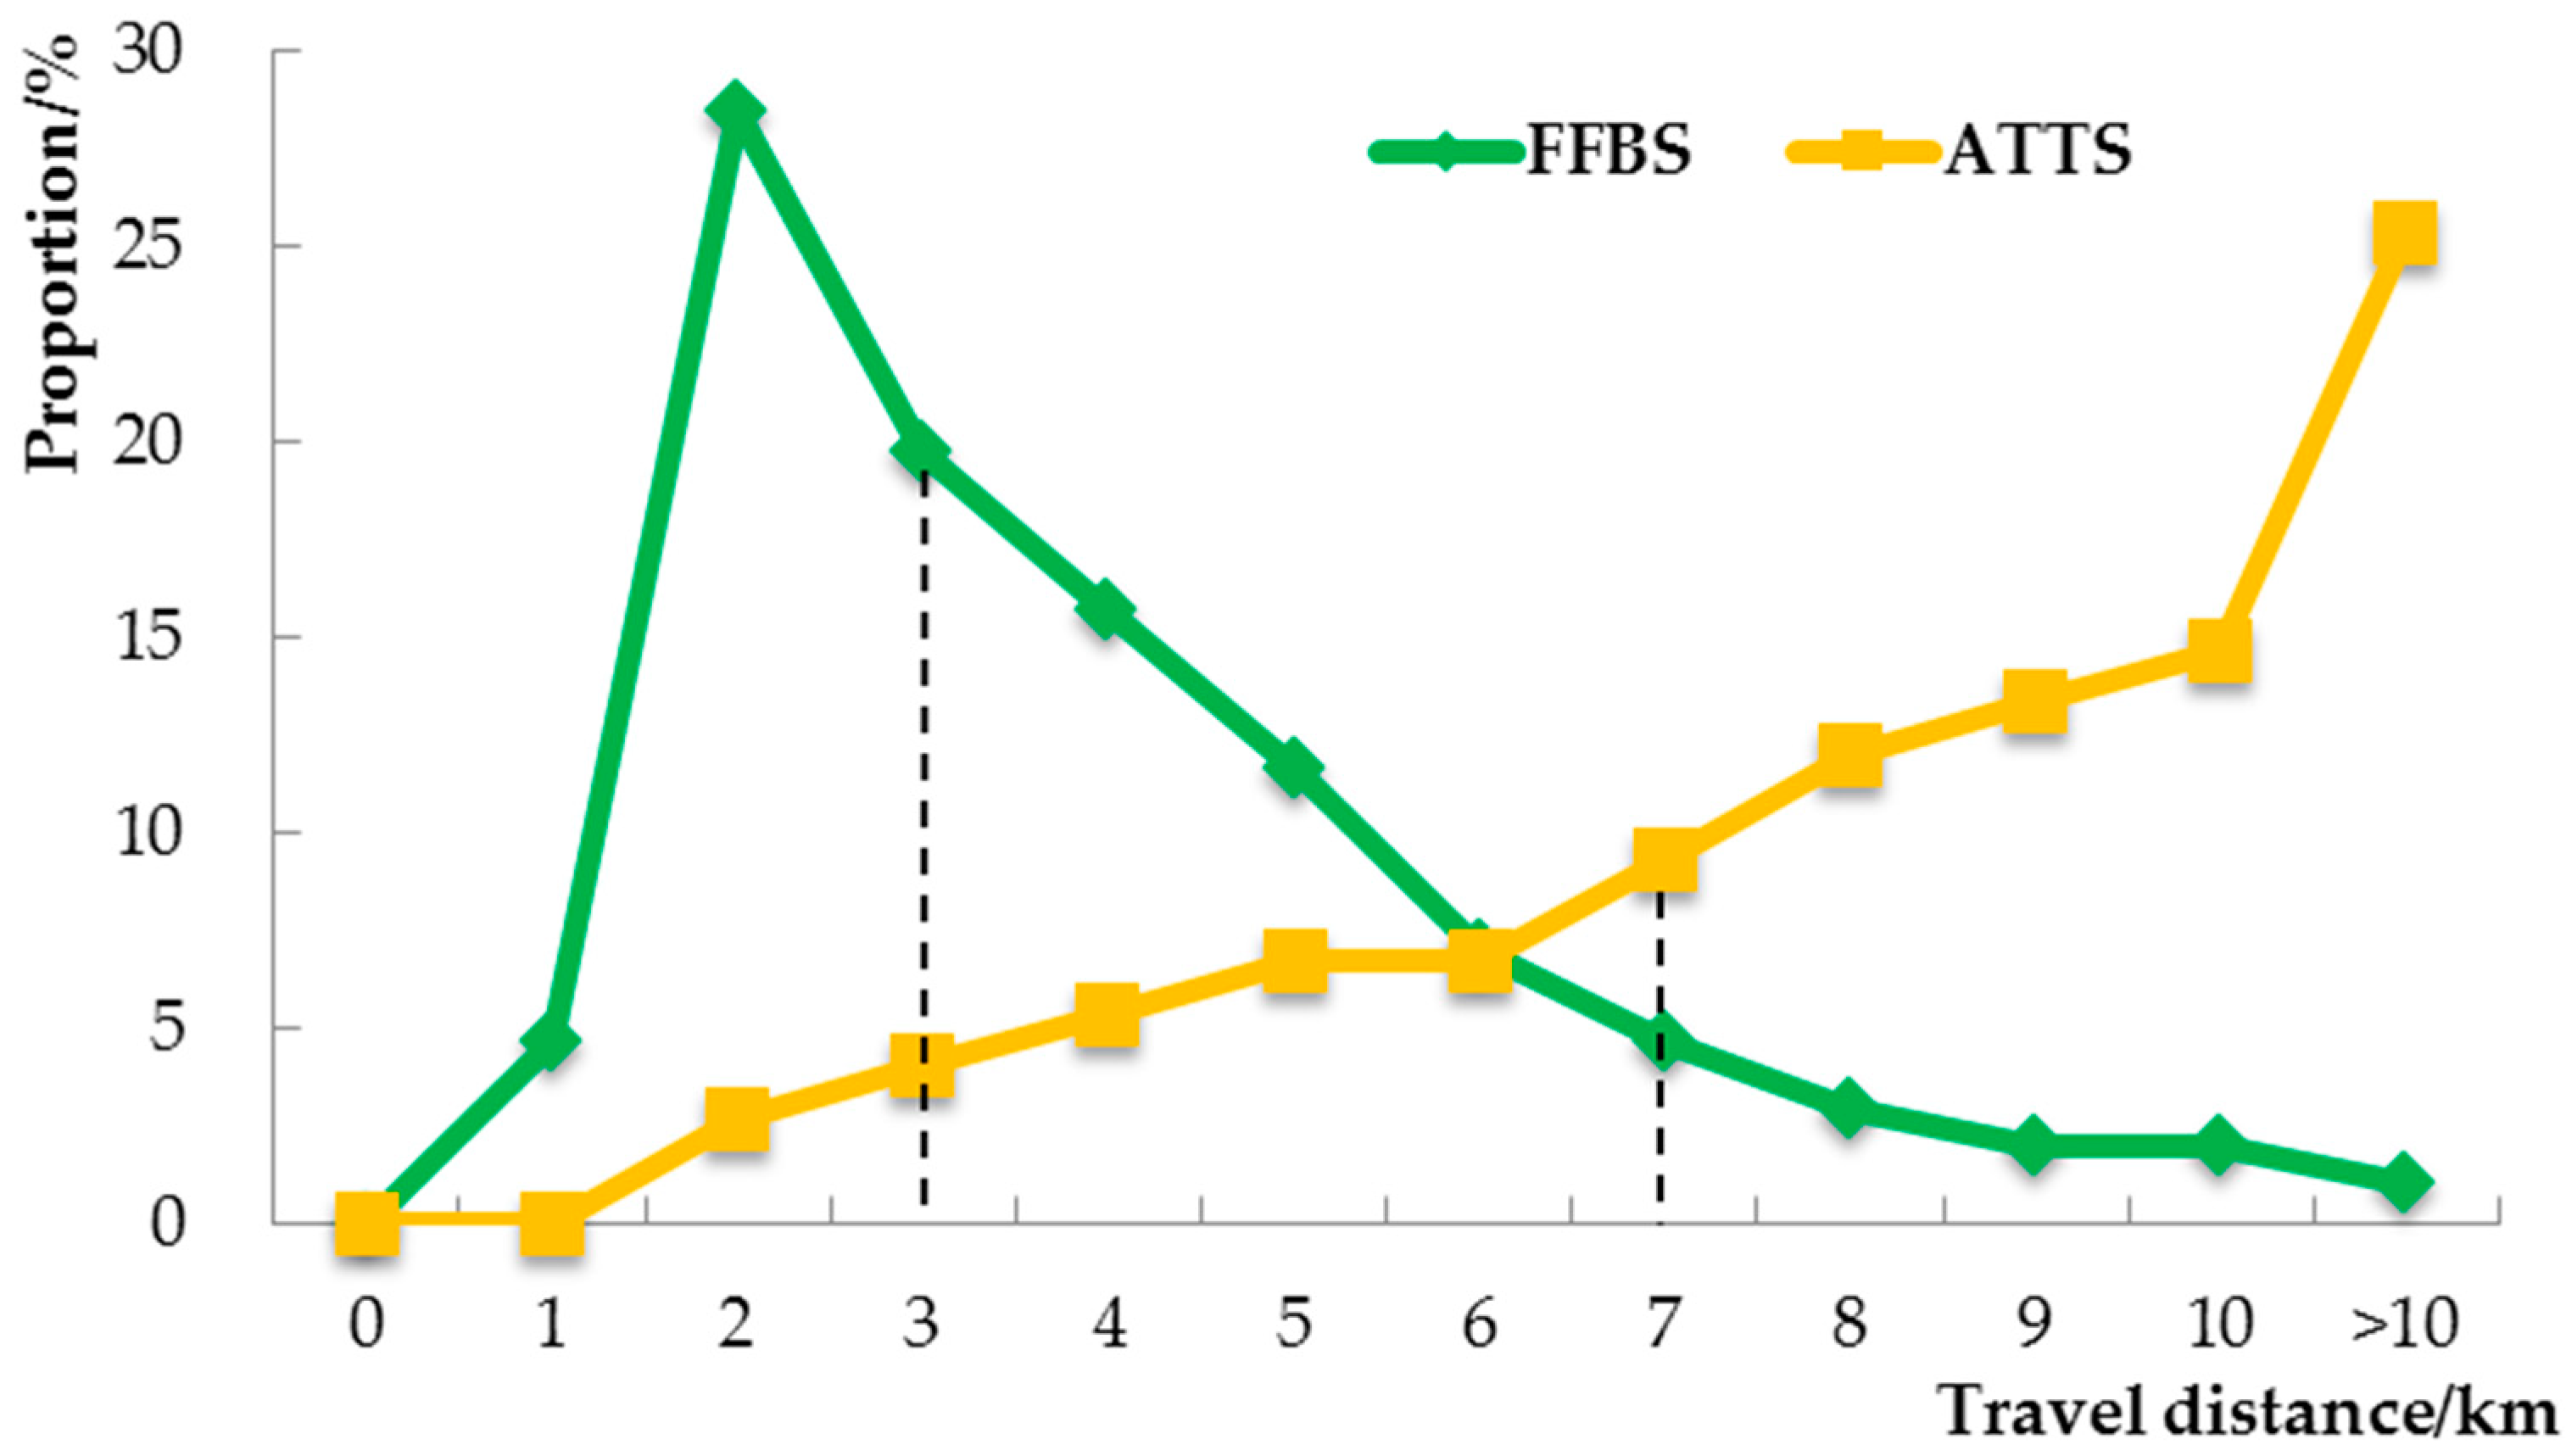
4.2. Travel Distance Distribution

The distribution of travel distance for ATTS and FFBS is shown in Figure 2. The travel distance of FFBS is mainly concentrated in 1~5 km (80%); after 5 km, the travel ratio of users is gradually reduced due to the limitations of time and effort. This implies that FFBS is primarily utilized to solve the short-distance travel, which is similar with public bike sharing [37]. By comparison, as for ATTS, the travel distance concentrates in 5 km and above (88%), suggesting that ATTS is similar to cruising taxis, which are more suitable for medium-distance travel [38]. However, there is still a competitive relationship between FFBS and ATTS in the 3~7 km range (59% and 32%, respectively).

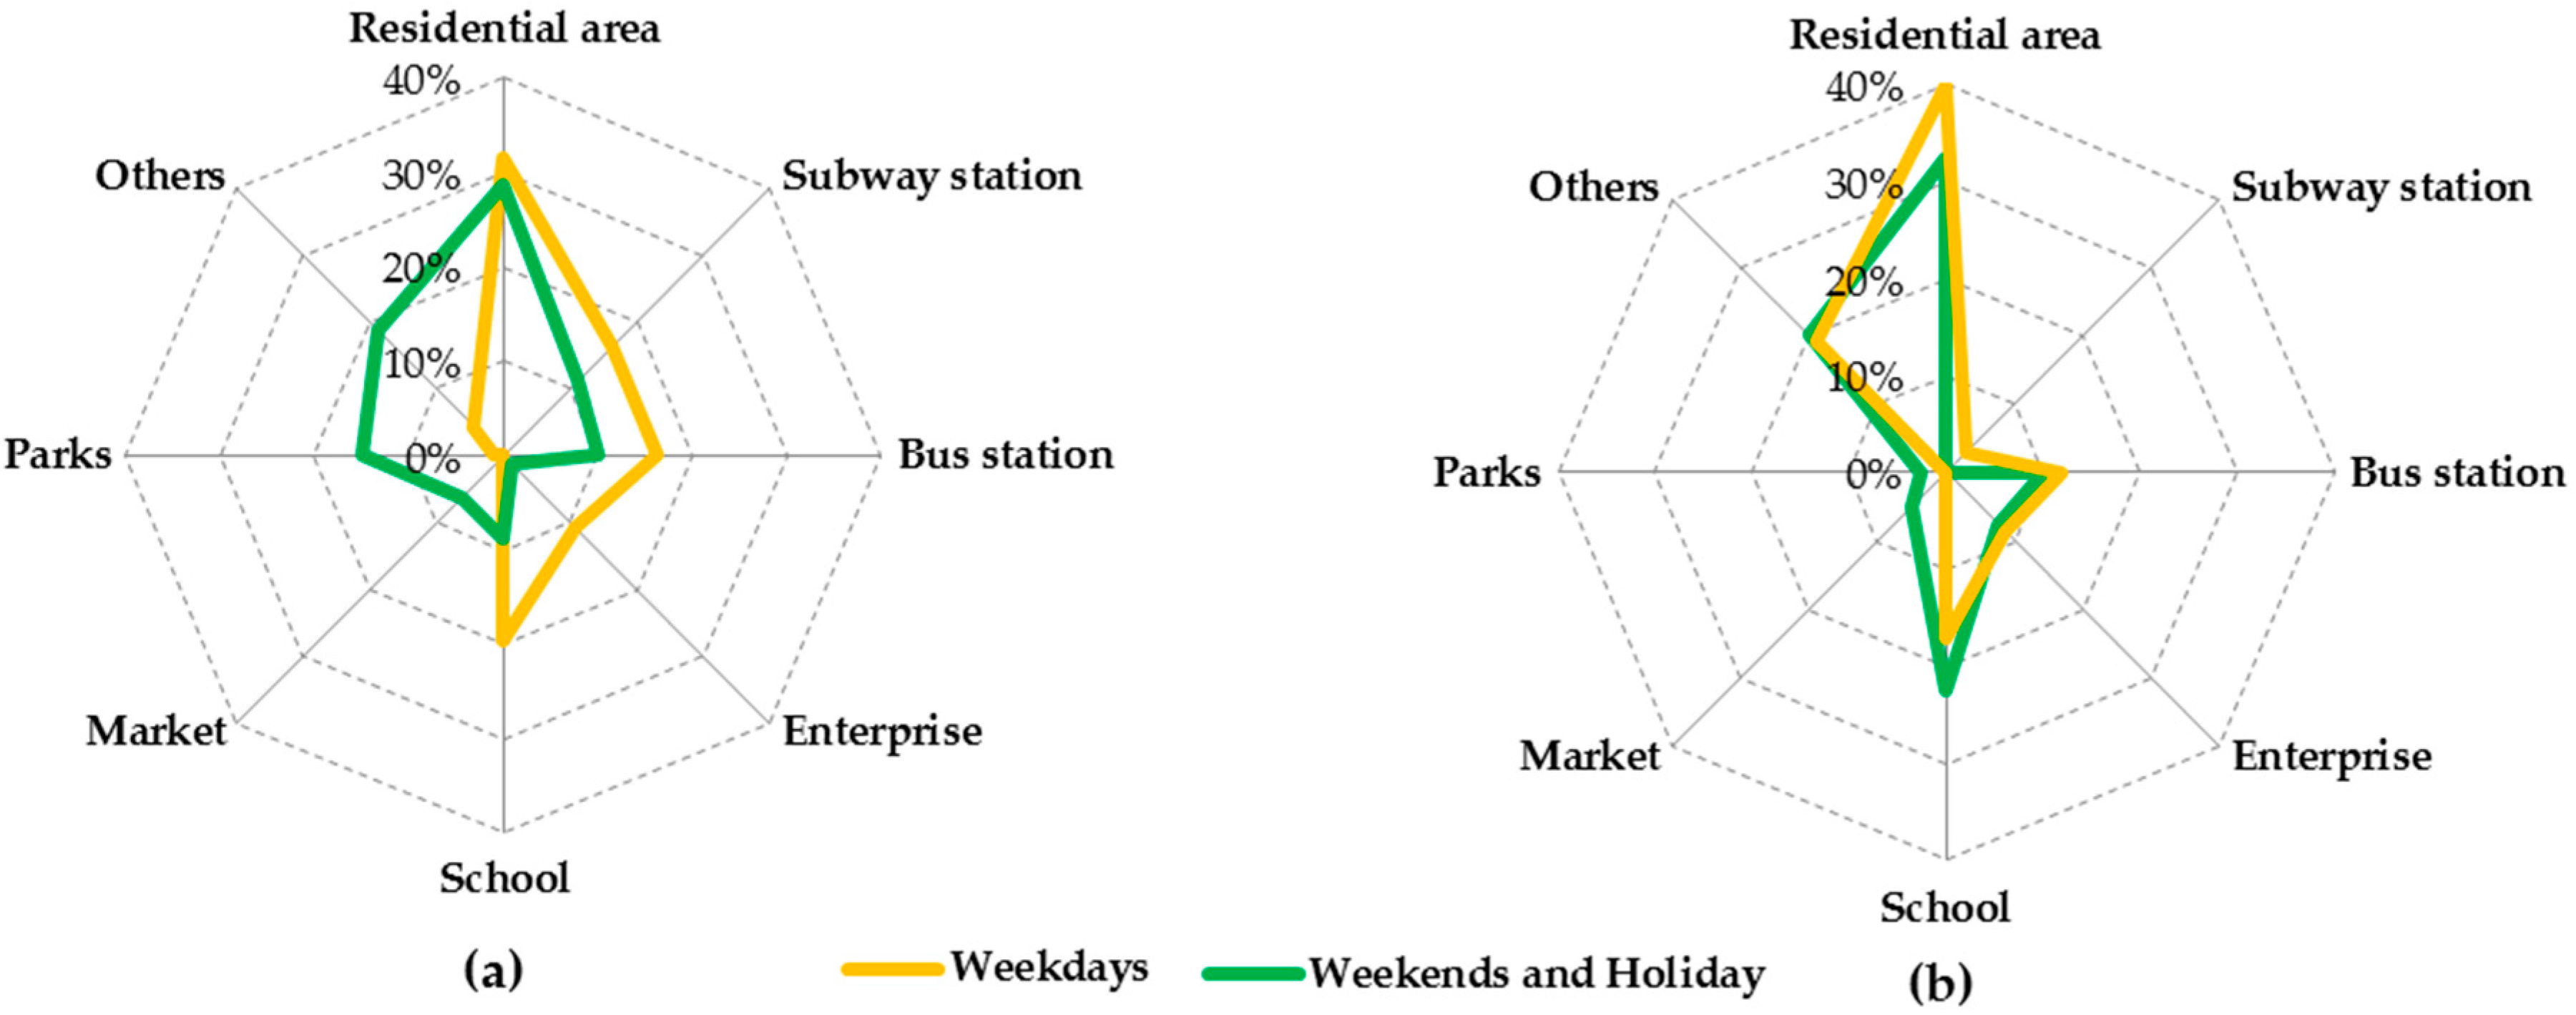
4.3. Position Distribution at Different Date

The differences of position distribution between FFBS and ATTS on weekdays and weekends are shown in Figure 3a,b. For FFBS, the demand on weekdays is mainly for commuting and attending school, while the demand on weekends is mainly for flexible travel, such as leisure and shopping. These show that the demand distributions of FFBS on weekdays and weekends are complementary, although residential areas are the main overlapping demand areas. By comparison, as for ATTS, the demand distributions on weekdays and weekends are relatively similar, and the demand is mainly located in residential areas, bus stations, schools, and other entertainment facilities. Further, a chi-square test was applied to validate whether there was a difference in the percentage distribution of the position in different dates. As expected, the results revealed a significant difference in FFBS (df = 7, p = 0.00), while there is an insignificant difference in ATTS (df = 7, p = 0.12). These are consistent with the results in Figure 3a,b. Therefore, in order to better satisfy the travel demand of users, different introduction and redistribution strategies could be adopted for FFBS and ATTS enterprises on different dates.
In addition, comparing the differences of location distribution between ATTS and FFBS on weekdays, we can conclude that more ATTSs (17%) distribute in other entertainment facilities than FFBSs (4%). Perhaps the travel time on weekdays is more restrictive, the residents will choose ATTS with high travel efficiency to take part in recreational activities outside of work and study in order to save time. By comparison, on weekends, more FFBSs (15%) distribute in parks than ATTSs (3%). This implies that FFBS could better promote the leisure exercise of residents and improve their health than ATTS [5]. In addition, no matter on weekdays and weekends, more FFBSs distribute around subway stations than ATTSs, which confirms the role of FFBS in the “last kilometer” [22].

4.4. Travel Purpose and Emergency Degree

The proportion of travel purpose and travel emergency degree of each travel purpose for FFBS, ATTS, and TTM are shown in Table 3. As seen in Table 3, as for FFBS, the proportions of flexible travel (business affairs, shopping, entertainment, exercise, and others) and inflexible travel (attending school, commute, and return home) are relatively balanced, accounting for 51.28% and 48.72%, respectively. The proportion of commute and attending school is, in total, 40.38%. By comparison, ATTS is mainly used for flexible travel activities (69.70%), and the purposes of entertainment (29.55%) and business affairs (15.91%) account for the largest proportion, while those of commute and attending school only account for 25%. In terms of travel emergency degree, on the whole, the emergency degrees of ATTS in all travel purposes are higher than that of FFBS and TTM. In particular, commute activity in FFBS has the highest emergency degree (4.64). By comparison, the emergency degree of business affairs activity (6.5) in ATTS is the highest.

5. Model and Discussion

5.1. Multinomial Logistic Model

The multinomial logistic (MNL) model is a discrete selection model based on random utility theory. It can deal with the categories and continuous variables at the same time and it is commonly found in studies of mode choices [17,32,34,39]. Therefore, it was utilized in this paper to uncover the influential factors affecting the mode choices among FFBS, ATTS, and TTM.
The utility function in MNL model consists of a fixed term and a random term, the utility of a user, n, choosing mode, i, is given as:
U i n = V i n + ε i n .
V i n = β 1 X i n 1 + β 2 X i n 2 + + β k X i n k .
where ε i n is a random term, its introduction is due to unobserved attributes, unobserved taste variations, measurement errors that are not deterministic. V i n is related to basic attributes, travel information, and attitudes and perceptions of users. It is assumed that X i n k is a linear function of these variables, and β k is the parameter estimated by the maximum likelihood method.
V i n is independent of ε i n , and ε i n obeys the assumption of a Gumel distribution, the probability of a user, n, choosing mode, i, is given as [5]:
P i n = e V i n / j C n e V j n .
where C n is the set of travel modes including FFBS, ATTS, and TTM.

5.2. Variable Calibration

The choice of urban residents’ shared travel modes has different influential factors, such as basic information, travel information, and perceptions. These variables need to be calibrated before using MNL. The results of variable calibration and notes are shown in Table 4.

5.3. Results and Discussion

In the MNL model, FFBS, ATTS, and TTM are dependent variables, and the choice of TTM is set as the reference category. As for all independent variables in Table 4, the items with a calibration value 0 are set as the reference items. All the independent variables are selected with an introducing probability of 0.05 and rejecting probability of 0.1. The independent variables and results of significance tests are listed in Table 5. Cox and Snell is 0.491 (more than 0.3), Nagelkerke is 0.562 (more than 0.3), and McFadden is 0.328 (more than 0.2), these coefficients are all within an acceptable range. The final −2 × Log-likelihood values for MNL is 467.310, the corresponding value for the equal probability model is 603.023, Chi-square is 135.713 (−2 × Log-likelihood values for the equal probability model minus the corresponding value for final MNL model), the improvement in the data fit illustrates the superiority of the established MNL model. In addition, the significance of the final model is less than 0.05, which shows that the selected variables have significant impacts on modes split under the confidence of 95%.
As presented in Table 5, as for the variable of original travel mode, for ATTS, the utility of the motorization travel mode is positive, with a high significance level when other variables are controlled. On the contrary, the utility is slightly negative for FFBS, compared to TTM. This indicates that residents who were accustomed to using non-motorized travel modes were more inclined to choose FFBS, while those who were accustomed to using motorized travel modes showed a preference for ATTS. That means the habit of residents’ travel behavior affect the decision of travel choices, and a travel mode is more likely to attract the passengers of the mode with same attributes.
In terms of “whether there is a transfer with bus or subway”, the coefficient of FFBS is positive while ATTS is opposed. This suggests that FFBS is more suitable to combine with other modes of transportation and it is an effective tool for the “first kilometer” and “last kilometer” in the city [15,40]. By contrast, ATTS is more likely to compete with bus and subway and be used alone because of its characteristic of providing door-to-door service.
In addition, as described in Section 4.1, the customers of FFBS and ATTS both come from the users whose original mode is a conventional bus, in order to explore the transfer differences between these two shared modes, the conventional bus in the original travel mode interacts with different dates. The calibration results show that the coefficient of FFBS is significantly positive on weekends and holidays, and it is small and insignificant on weekdays when other variables are controlled. By comparison, the coefficients of ATTS are both positive and significant. This indicates that residents are more likely to change from bus to FFBS on weekends and holidays, while this competition and substitution relationship between bus and ATTS has no significant difference on different dates. The possible reason is that FFBS is used more for leisure on weekends and the proportion of connecting with public transport on weekends is relatively small, as Figure 3a displays. By contrast, ATTS is more likely to compete with buses because of the reduced wait and riding times [14].
After controlling for other variables, FFBS is more sensitive to the increase in distance due to the limitation of effort, in contrast, ATTS tends to be utilized in longer-distance travel because it is a motorized mode. This is consistent with the result in Section 4.2. In addition, as the travel emergency degree increases, compared with FFBS, the residents show a tendency to use ATTS. Since the characteristics of high speed and accessibility could reduce the constraints of travel time and space, which can better serve temporary and emergency travel demand.
In order to explore the impact of the distribution of travel purpose in space on the choice of modes, the interaction between travel purpose and geography location is considered. The travel purpose is divided into two categories: flexible travel and inflexible travel. Flexible travel refers to the travel except for the purposes of attending school, commute, and return home. The higher ratio, the higher the living standards of residents are. The calibration results show that the coefficients of flexible travel in the city center and suburbs are positive and more significant than those of inflexible travel when other variables are controlled, which implies that, compared with TTM, residents show an inclination to use shared modes to participate in flexible activities. This also illustrates that FFBS and ATTS may improve the life quality of residents to a certain extent. In addition, the utility of flexible travel in suburb is larger and more significant than that in the city center. This indicates that compared with TTM, the residents in suburb are more dependent on FFBS and ATTS when they participate in flexible activities [41]. It is probably because the traffic infrastructures in suburb in Nanjing are absent, while shared modes could help to make up for this disadvantage and improve the accessibility in suburb [9,10,14]. Additionally, for FFBS, the coefficient of inflexible travel in suburb is negative compared with that in city center. It suggests that for inflexible activities, the residents in city center are more inclined to use FFBS than those in suburb. This is similar to public bicycles, which are mainly used for commuting and attending school in city center [42].
For the variable of “many coupons and discount cards”, the increase of the variable will promote residents to utilize shared travel modes. This is mainly because enterprises push coupons to users through mobile phone applications and attract customers who use TTM to utilize FFBS and ATTS by reducing their travel costs. Therefore, related enterprises can introduce and distribute coupons to users in order to attract new users to use shared modes. It is important to note that, in Section 4.1, the passengers of shared modes which come from private cars are small, which shows that, in Nanjing, the economic intervention (increased subsidies in shared travel modes) does not achieve the goal of attracting private car owners to give up driving. Similarly, the variable “time spent on the Internet every day” will also promote citizens to used shared modes.
In addition, in order to explore the impact of the number of private cars in households on residents’ shared mode choice, the number of family cars and the groups of students and non-students were interacted. This is mainly because the ownership and the use of family cars in the student group are not equivalent. As Belgiawan et al. showed for the car ownership and transportation pattern of undergraduate and graduate students in China, car owners and users accounted for 26.3%, while the car non-owners and users accounted for only 2.4% [43]. The model results show that, compared with the student group, the increase of the number of cars in a family in non-student groups will reduce the probability of using shared modes. This implies that by properly restricting the car ownership rate, the residents may use shared modes. This is in line with the conclusion in Section 4.1: more shared travel users come from the groups who lack private cars. This is contrary to the conclusion of Shaheen et al. in public bicycle system: car ownership does not lead to a reduced propensity in public bicycle use [44]. Interestingly, residents who own a registered permanent residence are less likely to use FFBS and ATTS. Perhaps residents in Nanjing who own a registered permanent residence have a higher car ownership rate (64.68%) than that of their counterparts (38.97%), and the travel inertia of using private cars for urban residents who own cars, to a certain extent, inhibits residents using shared travel modes.

6. Conclusions

This study was mainly designed to investigate the factors affecting shared travel modes. First, different characteristics between ATTS and FFBS in original travel modes, distance distribution, position distribution and travel emergency degree were compared and analyzed. The results show that: customers of FFBS are primarily from the users whose original modes are walking (39%), private bicycle (15%), and conventional bus (14%), the riding distance mainly focusing on 1~5 km (80%). By comparison, customers of ATTS mainly come from the users whose original modes are cruising taxi (26%) and conventional bus (25%), and it is more suitable for travel distance above 5 km (88%). As for FFBS, the demands on weekdays are more inflexible travel activities while those on weekends are more flexible activities. The demand distributions of FFBS on weekdays and weekends are complementary, and residential areas are the main overlapping areas. By comparison, the demand distributions of ATTS on weekdays and weekends are more consistent. The emergency degrees of ATTS in all travel purposes are higher than that of FFBS and TTM. Then, an MNL model was established to explore the factors influencing the choice among ATTS, FFBS, and TTM. The results show that the habit of residents’ travel behavior affect the decision of travel choices, and a travel mode is more likely to attract the passengers of the mode with same attributes. The competition and substitution relationship between FFBS and bus is more significant on weekends and holidays compared with weekdays, while this relationship between ATTS and bus has no significant difference on different dates. FFBS tend to combine with other public transportation, while ATTS is more inclined to be utilized in longer-distance travel and emergency travel, compared with FFBS. Compared with TTM, residents are more inclined to use shared modes to participate in flexible activities, especially in suburbs. In inflexible travel activities, the residents in the city center are more likely to use FFBS. Interestingly, residents who do not own a registered permanent residence show a preference for FFBS and ATTS, and the residents may utilize shared modes more if the car ownership rate is properly restricted.
In order to improve the usage of FFBS, ATTS, and TTM, the following management strategies and policy proposals are respectively proposed from the perspectives of enterprise operators and the government.
With respect to operators, four management actions could be taken into account. (1) Scheduling strategy. As shown by the model, FFBS and conventional bus have a more significant competition and substitution relationship on weekends and holidays, while this relationship between ATTS and conventional bus is significant both on weekdays and holidays. Therefore, in the areas with underdeveloped bus lines, a percentage of FFBS could be redistributed to these areas during weekends and holidays, and a proportion of ATTS could be guided by the platform to these places during peak demand periods. This approach may alleviate the shortcomings of inadequate conventional bus operation lines. (2) Business optimization of the ATTS platform. As the result of characteristic analysis indicates that the emergency degrees of ATTS in all travel purposes are higher than that of FFBS and TTM, at present, there is no special service for emergency-travel customers on the ATTS platform. Consequently, ATTS enterprises could consider setting up emergency services on the platform interface. In particular, the platform could carry out price control strategies, such as increasing additional costs appropriately during peak demand periods, to give e-hailing priority to users with high emergency if these customers select this service. (3) The introduction of FFBS and ATTS. As aforementioned, residents in suburbs are more likely to use shared modes to participate in flexible activities compared with TTM. For this reason, the enterprise could increase the introduction of FFBS and ATTS in suburbs where public transport facilities are very scarce, and also establish locations near flexible facilities, so that the barriers of insufficient facilities and low accessibility in these places could be alleviated. In addition, there are more demands for FFBS than ATTS near subway stations, therefore, FFBS enterprises could introduce more FFBSs near subway stations while ATTS could reduce the cruise in these places. (4) Utilization of the impact of registered permanent residence. As shown in the model, residents without a registered permanent residence show an inclination to FFBS and ATTS. Thus, in some tourist spots, these two shared modes could be properly introduced to bring benefits to visitors who come from other areas (the people do not have local registered permanent residence).
As for the government, two policy recommendations can be considered. (1) Payment system integration of FFBS and public transit and price strategy. As the model implies, FFBS is more suitable to combine with buses and subways and many discounts could promote the use of shared travel. Therefore, in order to promote a combined use of these two modes, a payment platform which integrates FFBS and public transit could be built by the government, and the government provides transfer users with a transfer discount. This method may bring about a simultaneous increase in the passenger flow for FFBS and public transit. (2) Technological innovation of traditional taxis. The results of the characteristic analysis show that customers of ATTS mainly come from the users whose original modes are cruising taxi. Faced with competition, traditional taxis can learn from ATTS, which integrates vehicle and information technology. An online taxi booking and hailing platform could be considered by the government, and the taxis could achieve e-hailing through smart phones while retaining the traditional roadside hailing by hand. This approach can satisfy the travel demand of different groups of people, such as young Internet users and the elderly, and enhance the competitiveness of traditional taxis.
The current paper is not without limitations, and further research is needed to fill the following gaps. Firstly, the differences between FFBS and ATTS among different groups and cities could be further explored. Secondly, these two shared modes were generated in the context of Internet technology; it is expected to make a more detailed and accurate exploration of the differences of travel demand and the spatial and temporal distribution between FFBS and ATTS, with the combination of their order and trajectory data. In addition, this paper only considers the single travel of the traveler; the travel behavior of the traveler over several days is also an interesting topic. Finally, the studies of car sharing service and scooter sharing are also meaningful; it is expected that these explorations will be carried out in the future.

Author Contributions

Data curation: M.D. and X.L.; investigation: M.D., X.L., and J.Y.; software: M.D. and L.C.; supervision: L.C.; writing—original draft: M.D. and X.L.; writing—review and editing: M.D., X.L., and J.Y.

Funding

This research was funded by National Natural Science Foundation of China (51578150).

Acknowledgments

We are grateful for valuable improvement suggestions from the editor and three anonymous reviewers.

Conflicts of Interest

The authors declare no conflict of interest.

References

  1. Wen, C. Analysis on the Status and Trend of Ridesharing Industry in China in 2018. Available online: https://www.qianzhan.com/analyst/detail/220/180627-bafad48a.html (accessed on 27 June 2018).
  2. Gu, T.; Kim, I.; Currie, G. To be or not to be dockless: Empirical analysis of dockless bikeshare development in China. Transp. Res. Part. A Policy Pract. 2019, 119, 122–147. [Google Scholar] [CrossRef]
  3. Ding, N.; Pan, J.; Zhang, Z.; Yang, J. Life cycle assessment of car sharing models and the effect on GWP of urban transportation: A case study of Beijing. Sci. Total Environ. 2019, 688, 1137–1144. [Google Scholar] [CrossRef]
  4. Qian, X.; Ukkusuri, S.V. Taxi Market equilibrium with third-party hailing service. Transp. Res. Part. B Methodol. 2017, 100, 43–63. [Google Scholar] [CrossRef]
  5. Li, X.; Zhang, Y.; Sun, L.; Liu, Q. Free-floating bike sharing in Jiangsu: Users’ behaviors and influencing factors. Energies 2018, 11, 1664. [Google Scholar] [CrossRef]
  6. Ministry of transport of China. Interim Measures for the Management of App-Based Third Taxi Service. Available online: http://www.miit.gov.cn/n1146295/n1146557/n1146624/c5218603/content.html (accessed on 27 July 2016).
  7. Ministry of transport of China. Guidelines on Encouraging and Standardizing the Development of Free-Floating Bike Sharing. Available online: https://www.qianzhan.com/analyst/detail/220/180627-bafad48a.html (accessed on 2 August 2017).
  8. He, F.; Wang, X.; Lin, X.; Tang, X. Pricing and penalty/compensation strategies of a taxi-hailing platform. Transp. Res. Part C Emerg. Technol. 2018, 86, 263–279. [Google Scholar] [CrossRef]
  9. Pal, A.; Zhang, Y. Free-floating bike sharing: Solving real-life large-scale static rebalancing problems. Transp. Res. Part C Emerg. Technol. 2015, 80, 92–116. [Google Scholar] [CrossRef]
  10. Haba, H.F.; Dastane, O. An empirical investigation on taxi hailing mobile app adoption: A structural equation modelling. Bus. Manag. Strategy 2018, 9, 48–72. [Google Scholar] [CrossRef]
  11. Ferrero, F.; Perboli, G.; Rosano, M.; Vesco, A. Car-sharing services: An annotated review. Sustain. Cities Soc. 2018, 37, 501–518. [Google Scholar] [CrossRef]
  12. Perboli, G.; Ferrero, F.; Musso, S.; Vesco, A. Business models and tariff simulation in car-sharing services. Transp. Res. Part. A Policy Pract. 2018, 115, 32–48. [Google Scholar] [CrossRef]
  13. Shi, W. App-Based Third Taxi Service and Free-Floating Bike Sharing have Different Fortunes. Available online: https://baijiahao.baidu.com/s?id=1612207192090418182&wfr=spider&for=pc (accessed on 21 September 2018).
  14. Rayle, L.; Dai, D.; Chan, N.; Cervero, R.; Shaheen, S. Just a better taxi? A survey-based comparison of taxis, transit, and ridesourcing services in San Francisco. Transp. Policy 2015, 45, 168–178. [Google Scholar] [CrossRef]
  15. Shen, Y.; Zhang, X.; Zhao, J. Understanding the usage of dockless bike sharing in Singapore. Int. J. Sustain. Transp. 2018, 12, 686–700. [Google Scholar] [CrossRef]
  16. Chen, M.; Wang, D.; Sun, Y.; Waygood, E.O.D.; Yang, W. A comparison of users’ characteristics between station-based bikesharing system and free-floating bikesharing system: Case study in Hangzhou, China. Transportation 2018, 1–16. [Google Scholar] [CrossRef]
  17. Li, X.; Zhang, Y.; Du, M.; Yang, J. Social factors influencing the choice of bicycle: Difference analysis among private bike, public bike sharing and free-floating bike sharing in Kunming, China. KSCE J. Civ. Eng. 2019, 23, 2339–2348. [Google Scholar] [CrossRef]
  18. Wang, J. Analysis and evaluation method on taxi booking APP in Beijing. J. Transp. Syst. Eng. Inf. Technol. 2015, 15, 223–231. [Google Scholar]
  19. Rodier, C.; Alemi, F.; Smith, D. Dynamic ridesharing: Exploration of potential for reduction in vehicle miles traveled. Transp. Res. Rec. J. Transp. Res. Board 2016, 2542, 120–126. [Google Scholar] [CrossRef]
  20. Tirachini, A.; Gomez-Lobo, A. Does ride-hailing increase or decrease vehicle kilometers traveled (VKT)? A simulation approach for Santiago de Chile. Int. J. Sustain. Transp. 2019, 1–18. [Google Scholar] [CrossRef]
  21. Ai, Y.; Li, Z.; Gan, M.; Zhang, Y.; Yu, D.; Chen, W.; Ju, Y. A deep learning approach on short-term spatiotemporal distribution forecasting of dockless bike-sharing system. Neural Comput. Appl. 2018, 1–13. [Google Scholar] [CrossRef]
  22. Du, M.; Cheng, L. Better understanding the characteristics and influential factors of different travel patterns in free-floating bike sharing: Evidence from Nanjing, China. Sustainability 2018, 10, 1244. [Google Scholar] [CrossRef]
  23. Xu, C.; Ji, J.; Liu, P. The station-free sharing bike demand forecasting with a deep learning approach and large-scale datasets. Transp. Res. Part C Emerg. Technol. 2018, 95, 47–60. [Google Scholar] [CrossRef]
  24. Jia, Y.; Fu, H. Association between innovative dockless bicycle sharing programs and adopting cycling in commuting and non-commuting trips. Transp. Res. Part A Policy Pract. 2019, 121, 12–21. [Google Scholar] [CrossRef]
  25. Nielsen, J.R.; Hovmøller, H.; Blyth, P.L.; Sovacool, B.K. Of “white crows” and “cash savers”: A qualitative study of travel behavior and perceptions of ridesharing in Denmark. Transp. Res. Part A 2015, 78, 113–123. [Google Scholar] [CrossRef]
  26. Perboli, G.; Caroleo, B.; Musso, S. Car-sharing: Current and potential members behavior analysis after the introduction of the service. In Proceedings of the 2017 IEEE 41st Annual Computer Software and Applications Conference, Turin, Italy, 4–8 July 2017; pp. 771–776. [Google Scholar]
  27. Liu, Z.Y. An Analysis of Technology Acceptance Model-Exploring User Acceptance and Intension of Taxi-Hailing app in Shanghai. Available online: http://hdl.handle.net/2077/38592. (accessed on 30 March 2015).
  28. Xin, F.; Chen, Y.; Wang, X.; Fang, X. Cyclist satisfaction evaluation model for free-floating bikesharing system: A case study of Shanghai. Transp. Res. Rec. J. Transp. Res. Board 2018, 2672, 21–32. [Google Scholar] [CrossRef]
  29. Nanjing Statistics Bureau. Statistical Communiqu of National Economic and Social Development in Nanjing in 2017. Available online: http://tjj.nanjing.gov.cn/tjxx/201803/t20180327_494674.html (accessed on 27 March 2018).
  30. Zhang, Y.; Li, N. How Many Free-Floating Bike Sharing do Nanjing Share? Available online: http://society.people.com.cn/n1/2017/1125/c1008-29667258.html (accessed on 25 November 2017).
  31. Mei, J. Nanjing Suspends the Introduction of Ridesharing. Available online: https://js.qq.com/a/20180422/002208.htm (accessed on 22 April 2018).
  32. Liu, Y.; Ji, Y.; Liu, Q.; He, M.; Ma, X. Investigating electric bicycles as a travel mode choice for escorting children to school: A case study in Kunming, China. Transp. Res. Rec. 2017, 2634, 8–16. [Google Scholar] [CrossRef]
  33. Bachand-Marleau, J.; Lee, B.H.; El-Geneidy, A.M. Better understanding of factors influencing likelihood of using shared bicycle systems and frequency of use. Transp. Res. Rec. 2012, 2314, 66–71. [Google Scholar] [CrossRef]
  34. Li, S.; Zhao, P. The determinants of commuting mode choice among school children in Beijing. J. Transp. Geogr. 2015, 46, 112–121. [Google Scholar] [CrossRef]
  35. Ji, Y.; Fan, Y.; Ermagun, A.; Cao, X.; Wang, W.; Das, K. Public bicycle as a feeder mode to rail transit in China: The role of gender, age, income, trip purpose, and bicycle theft experience. Int. J. Sustain. Transp. 2017, 11, 308–317. [Google Scholar] [CrossRef]
  36. Fishman, E.; Washington, S.; Haworth, N. Bike share’s impact on car use: Evidence from the United States, Great Britain, and Australia. Transp. Res. Part. D Transp. Environ. 2014, 31, 13–20. [Google Scholar] [CrossRef]
  37. Kou, Z.; Cai, H. Understanding bike sharing travel patterns: An analysis of trip data from eight cities. Phys. A Stat. Mech. Its Appl. 2019, 515, 785–797. [Google Scholar] [CrossRef]
  38. Zhan, X.; Hasan, S.; Ukkusuri, S.V.; Kamga, C. Urban link travel time estimation using large-scale taxi data with partial information. Transp. Res. Part C 2013, 33, 37–49. [Google Scholar] [CrossRef]
  39. Campbell, A.A.; Cherry, C.R.; Ryerson, M.S.; Yang, X. Factors influencing the choice of shared bicycles and shared electric bikes in Beijing. Transp. Res. Part C 2016, 67, 399–414. [Google Scholar] [CrossRef] [Green Version]
  40. Li, Y.; Zhu, Z.; Guo, X. Operating characteristics of dockless bike-sharing systems near metro stations: Case study in Nanjing city, China. Sustainability 2019, 11, 2256. [Google Scholar] [CrossRef]
  41. Gong, L.; Liu, X.; Wu, L.; Liu, Y. Inferring trip purposes and uncovering travel patterns from taxi trajectory data. Cartogr. Geogr. Inf. Sci. 2016, 43, 103–114. [Google Scholar] [CrossRef]
  42. Shaheen, S.A.; Cohen, A.P.; Martin, E.W. Public bikesharing in North America: Early operator understanding and emerging trends. Transp. Res. Rec. J. Transp. Res. Board 2012, 2387, 83–92. [Google Scholar] [CrossRef]
  43. Belgiawan, P.F.; Schmöcker, J.D.; Abou-Zeid, M.; Walker, J.; Lee, T.C.; Ettema, D.F.; Fujii, S. Car ownership motivations among undergraduate students in China, Indonesia, Japan, Lebanon, Netherlands, Taiwan, and USA. Transportation 2014, 41, 1227–1244. [Google Scholar] [CrossRef] [Green Version]
  44. Shaheen, S.A.; Zhang, H.; Martin, E.; Guzman, S. China’s Hangzhou public bicycle: Understanding early adoption and behavioral response to bikeshare. Transp. Res. Rec. J. Transp. Res. Board 2011, 2247, 33–41. [Google Scholar] [CrossRef]
Figure 1. Proportion of original travel modes.
Sustainability 11 04318 g001
Figure 2. Travel distance distribution.
Sustainability 11 04318 g002
Figure 3. Distribution of position on weekdays and weekends: (a) FFBS; and (b) ATTS.
Sustainability 11 04318 g003
Table 1. Sample comparison of two survey methods.
ItemDescriptionOnline (%)Face-to-Face (%)Total (%)
GenderMale53.3650.7552.77
Female46.6449.2547.23
AgeTeenagers (≤18)14.1014.1814.12
Adults (19–40)55.9749.2554.45
Middle-aged (41–65)25.1627.6125.72
Older (>65)4.778.965.72
OccupationStudent29.9323.8828.57
Teacher5.868.216.38
Officer9.765.228.74
Employee41.6545.5242.52
Retired2.398.963.86
Others10.418.219.92
Table 2. Statistics for respondent attributes.
ItemDescriptionFFBS (%)ATTS (%)TTM (%)
GenderMale51.92 (52.8) 157.58 (58.9) 251.14
Female48.08 (47.2)42.42 (41.1)48.86
AgeTeenagers (≤18)19.879.0913.36
Adults (19–40)64.7478.7938.76
Middle-aged (41–65)14.7510.6137.78
Older (>65)0.641.5110.10
Education level<High school20.51 (23.6)14.39 (12.3)45.60
Undergraduate46.80 (51.9)60.61 (69.6)44.30
Masters and higher32.69 (24.5)25.00 (18.1)10.10
OccupationStudent34.6229.5525.08
Teacher7.055.306.51
Officer8.988.338.79
Employee39.7444.7043.00
Retired0.641.516.52
Others8.9710.6110.10
Income level (CNY/month)<300026.2828.0336.81
3000–600032.6935.6143.00
6001–10,00036.5428.0315.63
>10,0004.498.334.56
1 Real FFBS statistics from Askci consulting company and BigData-Research company in brackets, 2 real ATTS statistics from Jiguang company in brackets.
Table 3. Travel purpose and emergency degree.
Travel PurposeFFBSATTSTTM
Proportion (%)ATED 1Proportion (%)ATEDProportion (%)ATED
Attending school13.463.589.095.1417.923.50
Commute26.924.6415.915.2745.934.21
Return home8.333.145.305.252.283.29
Business affairs5.773.8315.916.502.282.50
Shopping7.053.175.304.756.513.21
Entertainment10.902.6029.554.4610.422.65
Exercise13.461.251.523.124.563.47
Others14.103.4417.425.0310.103.94
1 ATED represents average travel emergency degree.
Table 4. Variable calibration and notes.
ItemsVariableDefinition and Notes
Travel informationOriginal travel modeMotorized travel modes = 1 Non-motorized travel modes = 0
Travel purposeFlexible travel = 1 Inflexible travel = 0
Travel duration (min)Continuous variable.
Travel distance (km)Continuous variable.
Travel frequency in a week<1 = 0 1~2 = 1 3~5 = 2 >5 = 3
Travel timeWeekends and holidays = 1 Weekdays = 0
Travel emergency degreeContinuous variable, the value is 1~10.
Travel origin positionResidential area = 1 Subway stations = 2 Bus stations = 3 Enterprises = 4 Schools = 5 Markets = 6 Parks = 7 Other recreational facilities = 0
Geographic locationCity center = 1 Suburb = 0
Whether there is a transfer with bus or subwayYes = 1 No = 0
PerceptionConvenient to travelStrongly agree = 4 Relatively agree = 3 Not sure = 2 Relatively disagree = 1 Strongly disagree = 0
Low travel costStrongly agree = 4 Relatively agree = 3 Not sure = 2 Relatively disagree = 1 Strongly disagree = 0
Many coupons and discount cardsStrongly agree = 4 Relatively agree = 3 Not sure = 2 Relatively disagree = 1 Strongly disagree = 0
Easy to payStrongly agree = 4 Relatively agree = 3 Not sure = 2 Relatively disagree = 1 Strongly disagree = 0
High securityStrongly agree = 4 Relatively agree = 3 Not sure = 2 Relatively disagree = 1 Strongly disagree = 0
High comfortStrongly agree = 4 Relatively agree = 3 Not sure = 2 Relatively disagree = 1 Strongly disagree = 0
High accessibilityStrongly agree = 4 Relatively agree = 3 Not sure = 2 Relatively disagree = 1 Strongly disagree = 0
Basic informationGenderMale = 1 Female = 0
AgeTeenager (≤18) = 0 Adult (19~40) = 1 Middle-aged (41~65) = 2 Older (≥66) = 3
Educational level<Junior middle school = 0 High school = 1 Undergraduate = 2 ≥Master = 3
OccupationNon-Student = 1 Student = 0, the group of non-student includes officer, employee, teacher, retired and others.
Monthly income (CNY)<3000 = 0 3000~6000 = 1 6001~10,000 = 2 >10,000 = 3
Time spend in Internet every day (h)≤4 = 0 5~8 = 1 ≥9 = 2
Whether you have a registered permanent residenceYes = 1 No = 0
Whether you have a driving licenseYes = 1 No = 0
Whether you have a public bike IC-cardYes = 1 No = 0
Number of private bicycles in household0 = 0 1 = 1 2 = 2 ≥3 = 3
Number of electronic bicycles in household0 = 0 1 = 1 2 = 2 ≥3 = 3
Number of private cars in household0 = 0 1 = 1 2 = 2 ≥3 = 3
Table 5. Estimation results of the multinomial logistic model.
VariableFFBSATTS
Bsig.Bsig.
Original travel modes
Motorized travel mode−0.881 **0.0362.649 ***0
Non-motorized travel mode----
Bus * Weekends and holidays1.91 **0.0132.97 ***0
Bus * Weekdays0.5880.2641.705 ***0.002
Non-Bus * Weekdays----
Whether there is a transfer with bus or subway
Yes1.842 ***0-1.188 **0.042
No----
Travel distance (km)−0.236 ***0.0010.161 ***0.002
Travel emergency degree−0.0260.740.395 ***0
Travel purpose * Geographic location
Flexible travel * Suburb1.733 ***0.0062.409 ***0.006
Flexible travel * City center0.702 *0.0691.575 ***0.005
Inflexible travel * Suburb−0.1580.7450.2980.667
Inflexible travel * City center----
Many coupons and discount cards
Strongly agree4.188 ***04.351 ***0
Relatively agree2.599 ***01.698 ***0.006
Strongly disagree----
Occupation * Number of private cars
Non-Student * (≥3)−2.315 ***0−2.501 **0.043
Non-Student * 2−1.573 *0.07−2.102 ***0.002
Non-Student * 1−1.476 ***0.007−1.563 **0.014
Non-Student * 0−1.291 **0.029−1.435 **0.021
Student * (≥3)1.352 **0.011−1.281
Student * 20.5750.9980.2880.819
Student * 1−1.1680.623−0.3570.607
Student * 0----
Whether you have a registered permanent residence
Yes−1.12 ***0.003-0.580.249
No----
Time spend on Internet every day (h)
≥91.178 **0.0271.695 ***0.007
5~80.4120.251.106 **0.034
≤4----
Constant−1.5730.075−8.6710
Cox and Snell0.491Nagelkerke0.562
McFadden0.328Chi-square135.713
* significance of 0.1, ** significance of 0.05, *** significance of 0.01.

