Article

Travel-To-School Mode Choice Modelling Employing Artificial Intelligence Techniques: A Comparative Study

1
Civil & Environmental Engineering Department, King Fahd University of Petroleum & Minerals, Dhahran 31261, Saudi Arabia
2
Center of Research Excellence in Renewable Energy, Research Institute, King Fahd University of Petroleum & Minerals, Dhahran 31261, Saudi Arabia
3
School of Engineering, The University of British Columbia—Okanagan, Kelowna, BC V1V 1V7, Canada
*
Author to whom correspondence should be addressed.
Sustainability 2019, 11(16), 4484; https://0-doi-org.brum.beds.ac.uk/10.3390/su11164484
Submission received: 22 July 2019 / Revised: 9 August 2019 / Accepted: 11 August 2019 / Published: 19 August 2019
(This article belongs to the Section Sustainable Urban and Rural Development)

Abstract

:
Many techniques including logistic regression and artificial intelligence have been employed to explain school-goers mode choice behavior. This paper aims to compare the effectiveness, robustness, and convergence of three different machine learning tools (MLT), namely the extreme learning machine (ELM), support vector machine (SVM), and multi-layer perceptron neural network (MLP-NN) to predict school-goers mode choice behavior in Al-Khobar and Dhahran cities of the Kingdom of Saudi Arabia (KSA). It uses the students’ information, including the school grade, the distance between home and school, travel time, family income and size, number of students in the family and education level of parents as input variables to the MLT. However, their outputs were binary, that is, either to choose the passenger car or walking to the school. The study examined a promising performance of the ELM and MLP-NN suggesting their significance as alternatives for school-goers mode choice modeling. The performances of the SVM was satisfactory but not to the same level of significance in comparison with the other two. Moreover, the SVM technique is computationally more expensive over the ELM and MLP-NN. Further, this research develops a majority voting ensemble method based on the outputs of the employed MLT to enhance the overall prediction performance. The presented results confirm the efficacy and superiority of the ensemble method over the others. The study results are likely to guide the transport engineers, planners, and decision-makers by providing them with a reliable way to model and predict the traffic demand for transport infrastructures on the basis of the prevailing mode choice behavior.

1. Introduction

School travel mode choice has altered significantly over the past century with the introduction of motorization, the predominant cause being a motor car [1]. There has been a great decline in active transportation in the last 50 years [2]. For schools located within one mile of travel in the USA, walking and bicycling represented 87 percent of the trips in 1969, which reduced to 55 percent in 2001. Conversely, automobile trips increased from 7 percent to 36 percent between 1969 and 2001. A similar situation also emerged in England where walking to primary schools reduced from 61 percent to 52 percent while car travel increased from 30 percent to 40 percent between 1992–1994 and 2002–2003 [3]. The mode choice decisions differ for the teenagers, and children–parents are the main deciders for the travel mode for their children while teenagers participate in selecting the mode for themselves [4].
For short trips, since distance is the main factor affecting the travel mode choice to the schools, students shift from walk/bicycle to cars or public transport for longer trips [5]. Students living in a neighborhood with higher residential density prefer to walk to school, while a higher number of road intersections show a decrease in the number of students using active transportation to school [6]. For children, an increase in actual and apparent dangers diminishes the opportunities for independent mobility and active travel mode [7]. Independent mobility and active travel are the main factors which promote healthy physical and mental growth of the children [8]. The parent’s income, car ownership, and socioeconomic status are positively related to car use for school children, while these factors show a negative relationship with walking/bicycling. The distance and safety concerns have been found to be pivotal barriers for the parents towards active transportation [9].
As far as the Saudi Arabian context is concerned, the variables significantly influencing the mode choice behavior are the time to school, number of family members, monthly household income, distance to school, nationality, and the number of cars owned by each family [10]. However, Assi et al. [11] found family income, travel time and parent’s income to be the most deterministic variables that influenced the mode choice behavior of high-school-going students. The empirical study suggests that multi-layer perceptron (MLP) tends to produce higher accuracy to address mode choice behavior as opposed to the most preferred logistic regression model. Others, notably Al-Atawi and Saleh [12] and Al-Ahmadi [10] used a multinomial logit model to explain the mode choice behavior.
In contemporary research, logistic regression along with artificial intelligence was found to be extensively used for modeling school-travel mode choice behavior [11,13,14]. However, the precision level has always been a subject of question as it apparently fails to capture the dynamics that are associated with the chosen variables that influence the mode choice behavior [15,16]. Moreover, the mode choice behavior has attempted to address this based on a disparate focus on high, middle and elementary-school-going Saudi students. This leaves a pervasive knowledge-gap on the choice of techniques and their relative efficiency in scientifically addressing the mode choice behavior of all levels of Saudi students. Moreover, an amalgamation of the different relevant techniques, resulting precision and comparison of the results to signify their corresponding strength onto the precision level have not yet been explored. The simulation results prove the efficacy of the employed machine learning techniques (MLT). For instance, the extreme learning machine (ELM) and multilayer perceptron neural network (MLP-NN) can almost accurately predict the students’ mode choice. While the support vector machine (SVM) is not as accurate as of the other two techniques, but can still predict the mode choice behavior with satisfactory accuracy [17]. On this backdrop, this study attempts to use three MLT i.e., (i) ELM, (ii) SVM, and (iii) (MLP-NN) to achieve the relative (higher) precision in order to describe the mode choice behavior of all school going students in the Saudi cities. Specifically, this study, first, aims to compare the strength of these artificial intelligence (AI) techniques in predicting the mode choice behavior for male school students in the Khobar-Dhahran metropolitan area. The robustness, convergence, and efficacy of the employed techniques are attempted to investigate and validate by training and testing them with different threads of travel data. Furthermore, this study develops a majority voting ensemble method based on the outputs of the employed MLT that enhances the overall prediction performance of the mode-choice problem. Secondly, it develops a consolidated policy perspective emanating from the study results.
This research is presented in the following order. Section 2 presents a short overview of the literature related to mode choice modeling. Section 3 explains the study methods. Section 4 presents data processing in which the employed MLT is discussed briefly. Section 5 discusses the results of this study. Lastly, Section 6 provides a brief summary about the conclusions of this paper.

2. Literature Review

The urbanity of any region significantly affects the travel mode choice, with fewer children walking or using a bicycle because of an increase in urbanity since urban environments have active public transportation networks [18]. Children dwelling within one kilometer (km) of school prefer walking while those living beyond three kilometers use vehicles. According to Stewarta et al. [19], the distance to school, parental attitude towards traffic, culture, climate, and family resources are some of the significant factors affecting walking and biking to school.
McMillan [3] carried out research to identify the effect of an urban form of school travel mode choice that focused on elementary schools and the data for travel behavior was collected from sixteen schools located in North and South California. The probability of walking, bicycling or using the private car was examined using a binomial logit regression model. The study concluded that in addition to the urban form, many other factors influence the probability of school mode choice. These factors include the safety of locality, vehicular safety, family mobility options, societal values, and the caregiver’s attitude along with urban form being the most significant factor.
Müller et al. [5] investigated the student’s school choice and travel mode choice for schools in Germany. The data was collected for secondary schools and was analyzed using the multinomial logit (MNL) model. The student’s profile along with the distance and responsible authority affected the school choice. According to the study, the mode choice significantly relied on the distance along with other factors like the weather conditions and seasonality. Another study conducted in Florida [20], used an MNL model to examine the factors affecting the mode choice to school. The study found that the time to walk/bike, the distance from school and the elements of the built environment around the school played a significant role in selecting the travel mode choice. Lin and Chang [21] reported that a high density of sidewalks and shade trees encourage walking to school while a higher number of road intersections have the opposite effect. According to Broberg and Sarjala [18], compared to the neighborhood schools, fewer students use a bicycle or walk to magnet schools, and the rate of bus travel was high for magnet schools.
A research study was carried out in Toronto, Canada [6] that investigated the positive effect of the built environment on the active transportation system, i.e., walking/cycling. The travel mode choice for the school students of ages eleven to twelve years was estimated using a binomial logistic regression. The study concluded that the factors associated with active travel are distance, travel walking density, signal-controlled intersections, and low-income vicinities. Panter et al. [22] investigated the effect of the environment, locality, and route for a research carried out in the United Kingdom for students aged nine to ten years. The study reported that the children having a direct road to school were less likely to use active transportation compared to those having a dense network of roads in their locality. A higher number of streetlights decreased the number of students bicycling to school. Pojani and Boussauw [23] examined the impact of the physical and cultural environment on school travel mode choice. The survey data for students aged eleven to thirteen years were collected in Tirana, Albania. The study revealed that walking to school was preferred by most of the students, while the use of a bicycle and bus was minimal. The study found that students walking to the school walk in the form of a group and attend the nearest schools with fewer road intersections. The students from high-income families who live far away from school use their own car to travel to school.
Zhang et al. [8] examined the mode choice for school students aged seven to eighteen years in Beijing, China. The tree based and logit models were employed to study the key factors affecting the mode choice. The study revealed that having a personal car, and poor active transportation encourages the use of passenger cars. Further, it was found that long-distances from schools enhances the use of passenger cars. A study in Kanpur, India investigated various factors affecting the school travel mode choice [4]. The mode choice decisions were examined using a multinomial logit framework. The study revealed that the lack of public transportation and a shortage of quality school bus services encouraged the use of the family cars and paratransit. Moreover, the distance from the school, gender, family economic status, cultural exposure towards active transportation, and proper infrastructure for walking/bicycling were recognized as the most significant factors in the school travel mode choice.
Pont et al. [24] conducted a systematic literature review to study the relationship between physical and socio-economic characteristics of the environment on active transportation of children. The active transportation of the children aged between five to eighteen years was inversely related to the distance from the destination, car ownership, and higher family income. Giles-Corti et al. [25] inspected the effect of street connectivity and traffic exposure on a child’s tendency for walking to school. It was found that more students walk to school in areas of densely connected streets and low traffic exposure compared to areas of densely connected streets and high traffic exposure. According to Stewart [26], the distance, income, traffic, crime fears, and parental attitude strongly influence the active transportation of children. A study conducted in Belgium [27] revealed that the probability of walking to schools was significantly influenced by gender, distance, smoking status, and perception towards walking. McDonald [28] reported that the most critical factors affecting school mode choice were distance and time while gender showed little effect.
Dave et al. [29] conducted a survey to examine the travel mode choice for school children in Vadodara, India and carried out a feasibility study for the use of the coordinated bus for school travel. According to the study, most of the students travel by auto-rickshaw and van as they provide door-to-door service. Moreover, the study found that the likelihood of moving to coordinated bus increases with a decrease in travel cost and distance. The most significant factors for the travel mode choice were the age, car ownership, family income, and several persons in the family. Carver et al. [30] examined the social and physical environmental factors which affect the independent movement of children to school in rural/urban areas of Norfolk, United Kingdom. The study surveyed children aged nine to ten and their parents. In addition, the features of locality, the road to school, and the school environment were measured using school audits and geographical information systems. The study revealed that land use mix, major roads in the vicinity, and parental encouragement were the factors which encouraged the independent mobility of children. Moreover, the study reported that half of the children walked or used a bicycle for school travel. A study conducted in Yorkshire, United Kingdom [9], reported that the distance, time constraints, and parent’s safety concern were the main barriers to active transportation. A study conducted in Dunedin, New Zealand [31], reported that approximately 51 percent of adolescents were admitted in the nearest school, which showed a five times higher rate of walking and lower motorization rates compared to their counterparts.
The previous studies suggest that the use of AI techniques in mode choice modeling is scarce and limited. This research aims to fill this gap by employing three common artificial intelligence techniques i.e., ELM, SVM, and MLP-NN in school mode choice modeling with a relative evaluation of their predictive performance.

3. Study Methods

Data Collection

The sample data on mode choice behavior was collected from the public schools located in Al-Khobar and Dhahran cities of KSA. The total population of these two cities is 573,671 [32], representing 2.1% of the total population of KSA. This metropolitan area is located approximately 400 km to the east of Riyadh city, the capital of KSA. The study area hosts a total number of 88 public boy’s schools at the high, middle, and elementary levels as presented in Table 1. Out of them, 13 to 15 were randomly selected from each level that makes the total number of participating schools 41. During the weekdays, a total number of 4100 self-administered questionnaires were distributed to students from the chosen schools and collected on the next day. They were designed to gather information about the present mode choice behavior of the students. Specifically, information that was found to be significant in the previous studies such as the school level, distance between home and school, travel time, family (monthly) income, family size, total number of students in family and parents’ level of education. The details about the variables used to collect the information is summarized in Table 2. The students’ mode choice options were binary i.e., passenger car or on-foot to school. The number of questionnaires received was 2747 out of which 1484 (36%) responses were considered to be valid based on the provided information for modeling, knowing that the suggested sample size for similar planning studies should not be less than 500 [33]. Moreover, the study also ensured that at least 100 valid survey forms were collected for each mode choice i.e., car and walking [34].

4. Data Processing

The machine learning tools (MLT) are very popular in analyzing physical phenomena or decision-making processes of unobservable complex problems. Hence, these tools have already been implemented to model real-life problems related to classification, clustering, and regression [35,36,37]. For instance, the techniques were employed for power quality disturbances classification [38], power system faults detection and classification [39], water quality parameter modeling [40], and many more classification, clustering, and regression problems [41,42,43] with promising results. As this study aims to predict the mode choice behavior of the school-goers, it employs three different MLT: SVM, MLP-NN, and ELM. However, this study enhances the prediction performance of the mode choice behavior through the development of a majority voting ensemble method using the outputs of the employed MLT. Therefore, this section briefly discusses the employed MLT and the majority voting ensemble method for the prediction of mode choice behavior of the school-goers.

4.1. Multilayer Perceptron Neural Networks

The artificial neural networks are encouraged by the structure, processing method and learning ability of biological neural networks that can successfully analyze unobservable complex problems with better generalization performance and efficiency [44,45,46]. The capabilities of parallel computation and adaptiveness to external disturbances are making the feedforward MLP-NN popular amongst the researchers. It maps a set of inputs onto a set of desired outputs through supervised learning algorithms by building a model in the presence of uncertainty. It consists of three types of layers (input, hidden and output) where the nodes of a layer are entirely linked to the next one (if any). Each node processes the incoming inputs through nonlinear activation functions and transfers the outputs to the nodes of the following layer. The input parameters are transferred to the nodes of the hidden layers through adjustable weighting factors. All inputs of the hidden node are processed through non-linear activation functions after the addition of an adjustable bias to each node. The outputs of hidden nodes are forwarded in the same way to the nodes of the output layer for producing desired outputs [45,47,48].
In Figure 1, a simplified structure of an MLP is shown where p numbers of inputs are connected with n numbers of hidden nodes and the hidden nodes are connected with m numbers of output nodes to generate m numbers of outputs. An MLP neural network gets trained by adjusting the connecting weights and biases in two stages [49]. The first stage propagates the inputs through hidden and output layers to predict the outputs and compare the predicted and targeted outputs for estimating their differences. This stage selects the weight and bias randomly. The second stage adjusts the connecting weights and biases by minimizing the differences between the estimated and actual outputs. The supervised learning algorithm terminates and adjusts the weights and biases while the summation of the absolute differences of the predicted and targeted outputs do not change for a pre-specified number of epochs or reaches the pre-defined maximum number of epochs.

4.2. Support Vector Machines

Support vector machines (SVM) are extensively used for the efficient analysis of data as it provides better generalization performance for high dimensional data [50,51,52]. However, the SVM was limited for classification problems only in the beginning and later extended for regression analysis as well [53]. The SVM plots available data into a high dimensional feature space by constructing an optimum geometric hyperplane through a non-linear mapping for the separation of data. This technology significantly reduces the total number of patterns to separate the group of patterns by using only the patterns closest to the separation surface instead of using all of them. It employs different functions including the polynomial, sigmoidal, Gaussian, and radial basis functions for the creation of the separation surface [54].

4.3. Extreme Learning Machines

Extreme learning machines (ELM) for the single hidden layer feedforward neural networks (FFNN) are faster than conventional FFNN in achieving better generalization performance through the effective determination of global optimum solutions [55]. This model works on the concept of synthesizing a direct relationship among many theories namely the matrix theory, linear system stability, neural network generalization performance, and ridge regression for solving complicated imperceptible problems [56]. The ELM calculates the output weights analytically by picking the input weights arbitrarily whereas the MLP-NN and SVM govern these input weights based on the selected training patterns [57].

4.4. Majority Voting Ensemble Methods

The ensemble methods develop and combine the multiple machine learning models to produce better-aggregated solutions than the individual models by compensating the mistakes [58,59,60]. Generally, they use generated solutions of the individual learning methods as inputs and produce ultimate solutions through a wide range of processing techniques, including averaging, bagging, boosting, stacking, and voting [61]. Voting and averaging are the widely used ensemble methods that are easy to understand and implement. Classification problems use the voting techniques whereas the regression problems use averaging techniques based on the results of the developed machine learning techniques. Further, the voting/averaging techniques can be ramified into two categories, namely the majority and weighted voting/averaging. In majority voting for classification problems, the ensemble methods take the predicted solutions of each model and select the one that receives more than half of the votes (for classifying two classes) or the majority votes (for classifying more than two classes) by providing same rights to each model. Unlike majority voting, the weighted voting gives more importance to a few models and less importance to others based on experience and their efficacy in prediction.

5. Results and Discussions

The descriptive statistics for the two modes used in this study are illustrated in Table 3. More than 70 percent of the school-goers use passenger cars for travel while approximately 30 percent of them walk to the school. The median time for both modes is almost the same while students who reside near the school walk to the school.
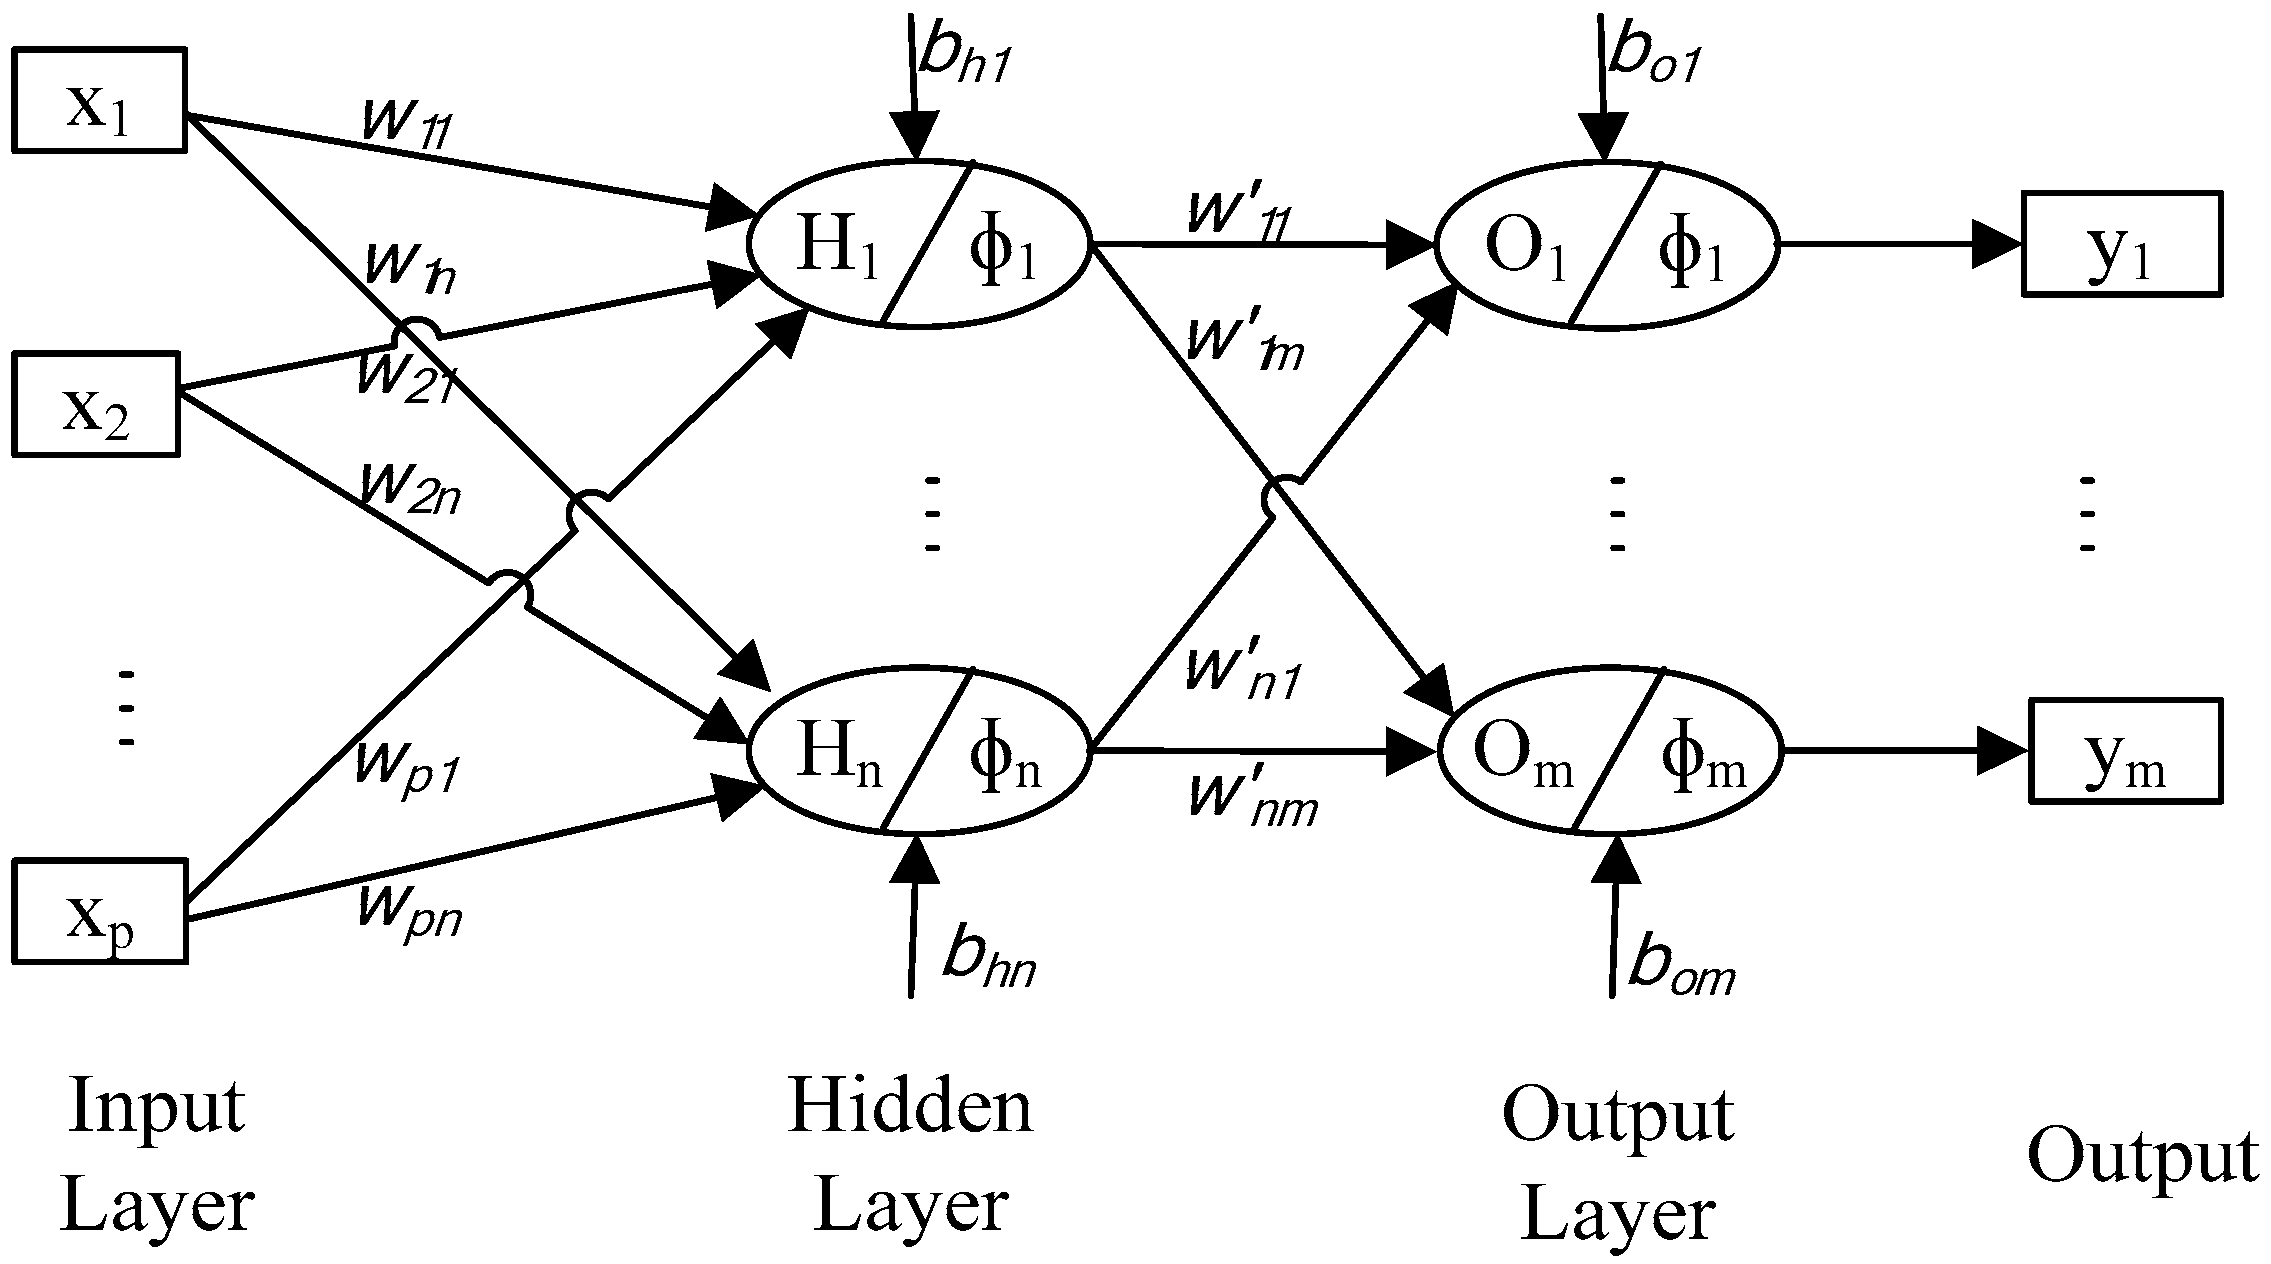
This study used the MLP-NN, SVM, and ELM for predicting the mode choice of school goers. To test the robustness and convergence of the MLT, this study employed 60, 70, and 80 percent of the available data for training the prediction models for the three different scenarios, while the remaining data were used for testing purposes. It is worth mentioning that the inputs of the MLT models were the school level, the distance between home and school, travel time, family income, family size, the number of students in the family and education level, whereas their output was binary i.e., either choosing passenger car or walking.
However, for the multilayer perceptron neural network, the Levenberg-Marquardt (LM) algorithm was employed for training in the MATLAB environment. The LM is a combination of the Gauss-Newton and steepest descent algorithms and exhibits better generalization performance in terms of stability, robustness, and convergence. This study chose five hidden neurons through a systematic trial and error approach for the MLP-NN. However, it employed a binary SVM classifier in a MATLAB environment that trained or cross-validated an SVM model for two different classes of data by mapping the predictor data using kernel functions via quadratic programming for objective-function minimization. Like MLP-NN, this study selected the key parameters of the SVM through the systematic trial and error technique. Finally, this research employed an ELM toolbox developed in a MATLAB environment to predict the mode choice behavior of the school goers. Like the other two techniques, this study chose the ELM parameters, namely the regularization coefficient, kernel parameter, and kernel option through a systematic trial and error process.
Table 4, Table 5 and 
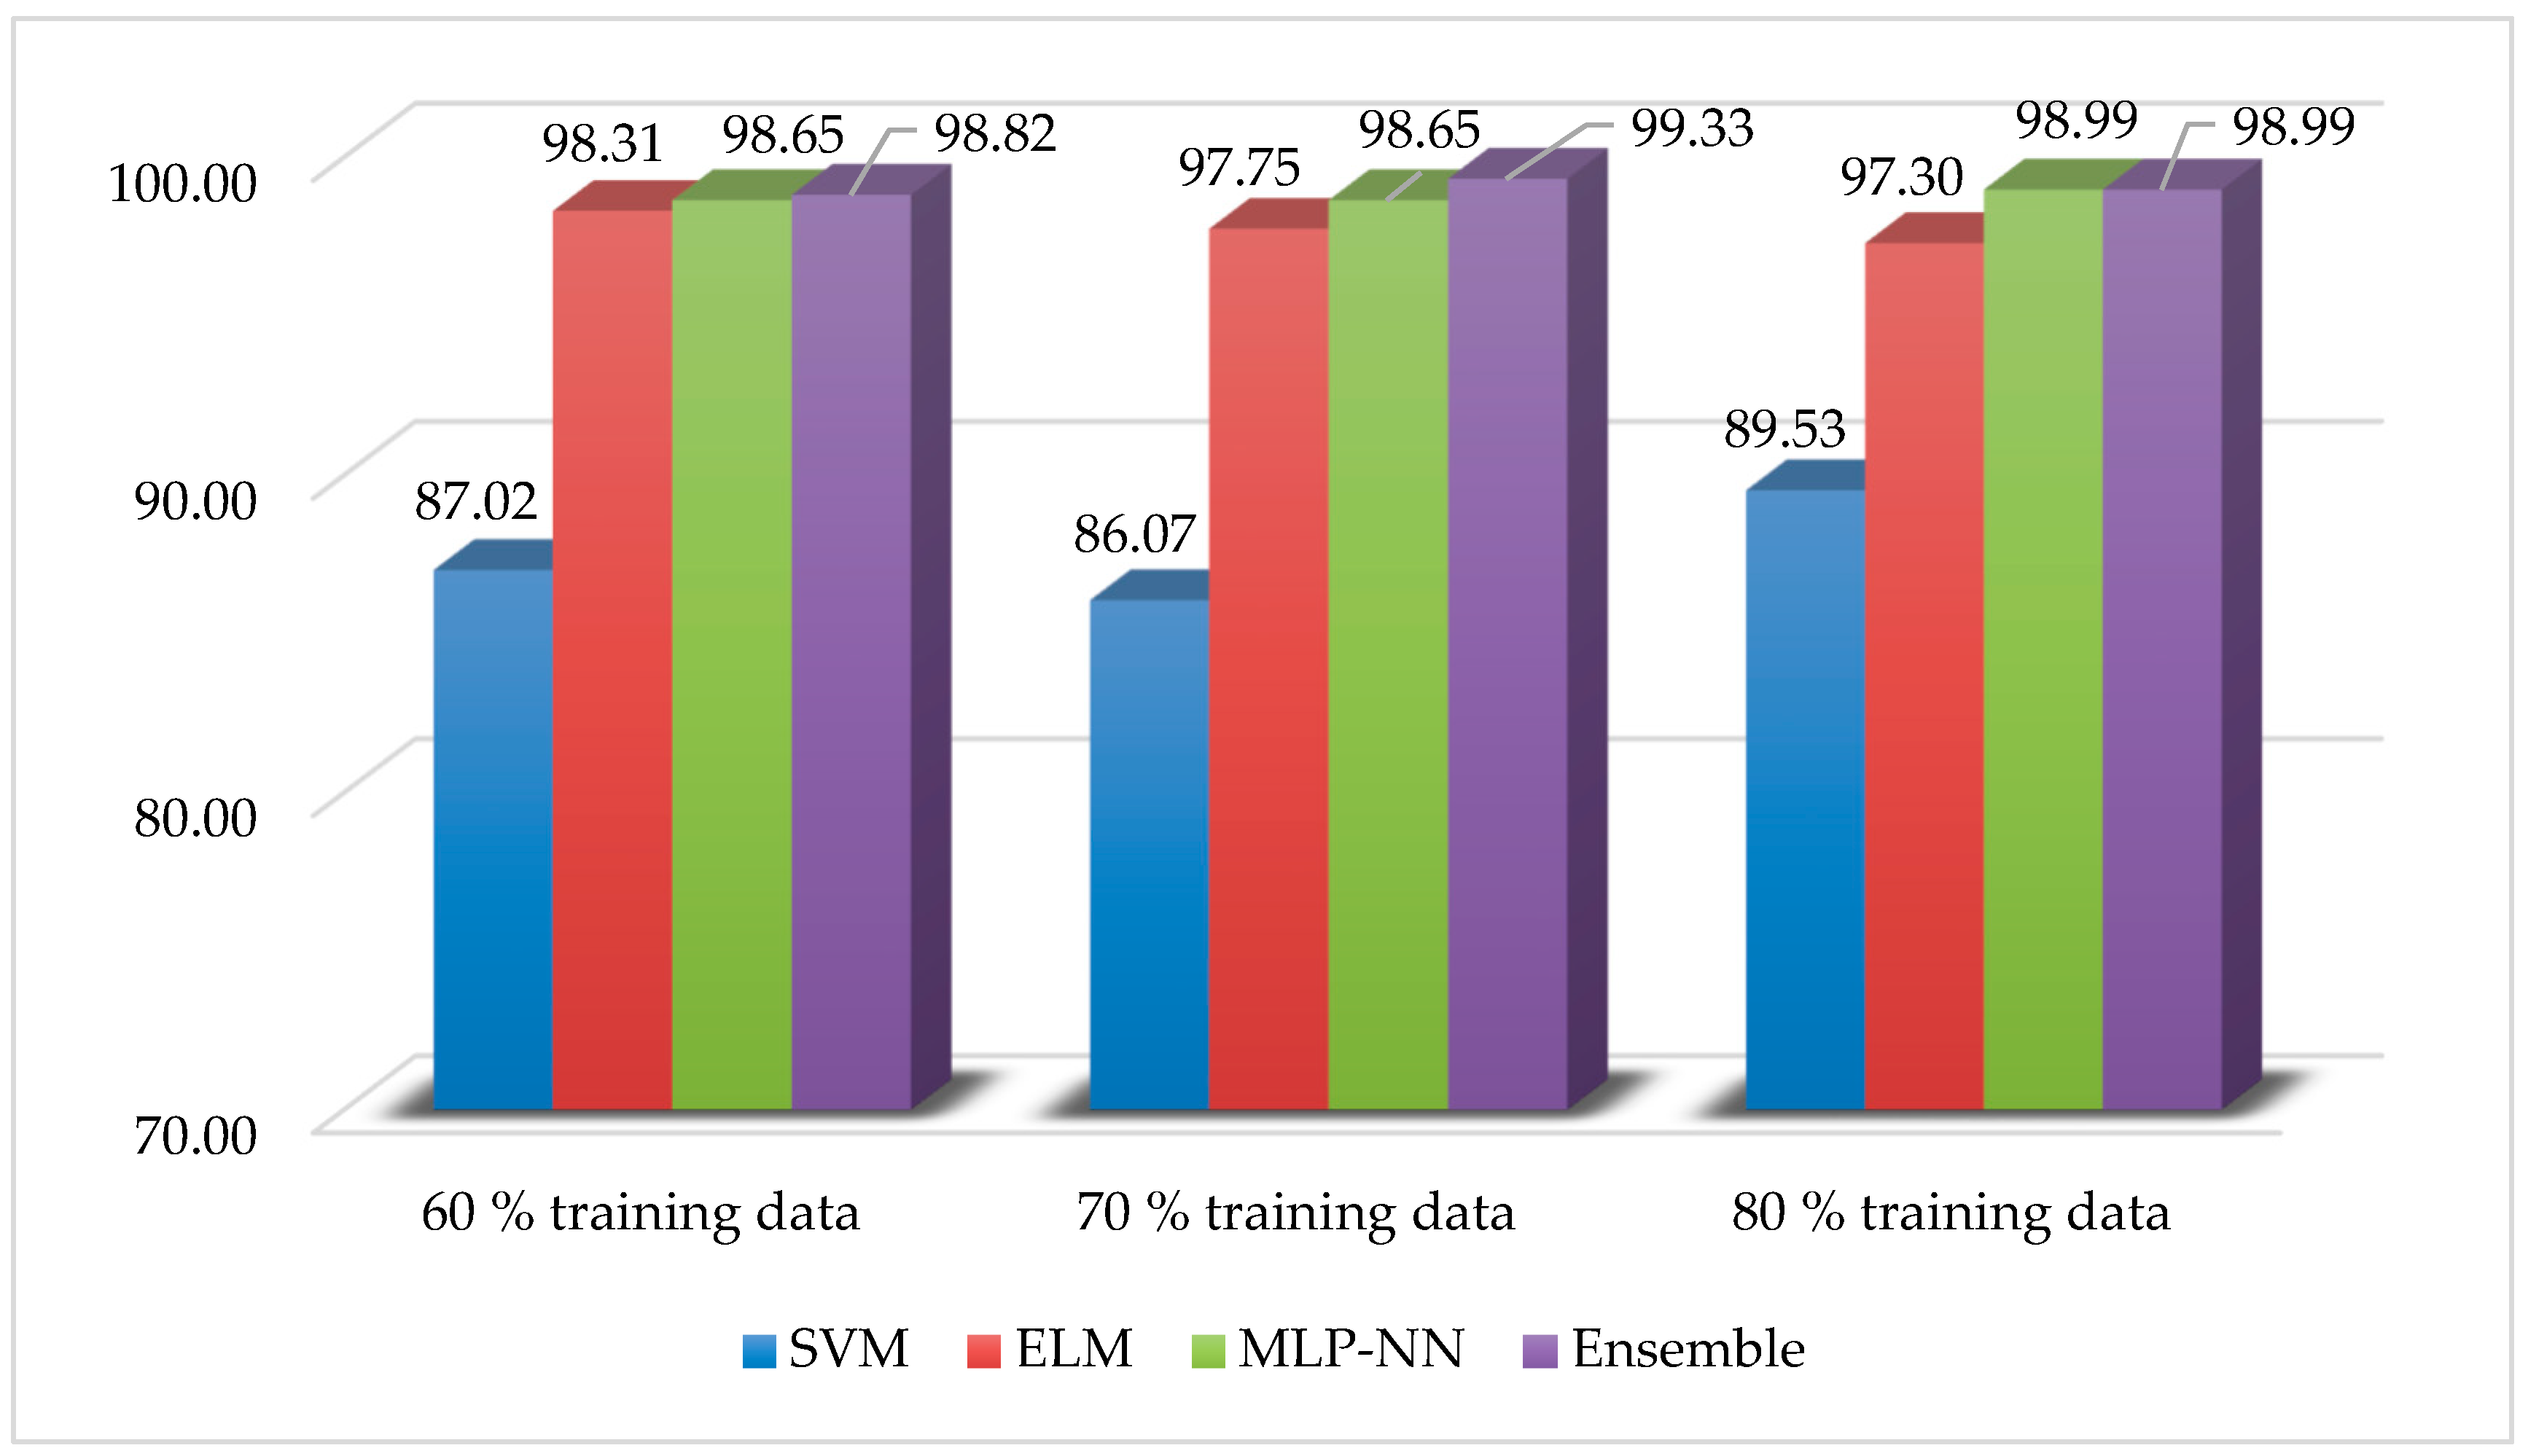
Table 6 show the operation time required for training and testing of the selected MLT along with their training and testing accuracies for a different number of training and testing data. As can be seen, the SVM required approximately 10 seconds for training purposes whereas the MLP-NN and ELM took approximately 0.05 seconds, respectively. Conversely, the SVM and MLP-NN took similar times for testing purposes that were almost double compared to the testing time of the ELM technique. Therefore, it can be concluded that in terms of computational time, the SVM technique is the most expensive one and the ELM is the least expensive one for this specific study. As can be observed, the training accuracy for the SVM technique was approximately 90 percent whereas the same for the ELM and MLP-NN techniques were more than 99 percent for all cases in predicting the mode choice behavior of the school-goers. In terms of testing accuracies, the ELM and MLP-NN achieved almost 98 percent accuracies whereas the accuracy for the SVM technique was less than 90 percent for each case.
Furthermore, this study employed a majority voting ensemble method based on the outputs of the three machine learning tools to achieve better generalization performance for the testing datasets. This technique gave the same rights to each model and chose the predicted solutions that received more than half of the votes. There was no ambiguity in the selection of the best class as this study employed odd numbers (three) of MLT. Table 7 presents and compares the accuracy of the different machine learning tools and the majority voting ensemble method. Figure 2 shows the testing accuracies of the employed MLT and the majority voting ensemble method for a different amount of training and testing data. Therefore, it can be concluded that in terms accuracies, the SVM technique showed the least performance, whereas the ELM and MLP-NN showed excellent performance that justified their employment in predicting the mode choice behavior of the school-goers of the selected area of Saudi Arabia. Moreover, the majority voting ensemble method predicted the solutions with better or at least equal accuracies of the individual models.

6. Conclusions

The promising performance of ELM and MLP-NN suggests their use for modeling the travel mode choice behavior of the school goers. Both techniques outperformed the SVM technique in terms of training and testing accuracies. The training accuracy for the SVM technique was approximately 90 percent, whereas for the ELM and MLP-NN techniques, the accuracies were more than 99 percent for all cases. In addition, the ELM and MLP-NN achieved almost 98 percent accuracies for the test datasets, whereas the accuracy for the SVM technique was less than 90 percent for each case. Furthermore, the SVM technique was computationally expensive over the other two techniques. The ELM was the best one in terms of overall computational expense. Therefore, the ELM and MLP-NN models can be applied to predict the mode choice behavior of the school going student populations in KSA with a higher precision. Moreover, the developed majority voting ensemble method also predicted the solutions with better or at least equal accuracies of the individual MLT models that confirmed the effectiveness of the ensemble method in modeling mode choice behavior problems.
It was observed that the travel time, family income, and parent education level were the prime variables to dictate the mode-choice behavior. This study expects to help and guide the transport planners, engineers, and decision-makers to devise a plan for strategic management and supporting infrastructure for both traffic and walkers based on accurate demand and its higher predictive power. This would also influence the decisions for surrounding land use changes that facilitates the commuting both in cars and on foot.

Author Contributions

Conceptualization, K.J.A. and K.M.N.; methodology, K.J.A., U.M. and M.S.; software, M.S.; validation, K.J.A. and M.S.; investigation, M.S.; resources, K.J.A., U.M. and K.M.N.; data curation, K.M.N., K.J.A. and U.M.; writing—original draft preparation, U.M., M.S. and K.J.A.; writing—review and editing, K.M.N. and M.S.; supervision, K.M.N. and K.J.A.

Funding

The APC was funded by the Deanship of Research at King Fahd University of Petroleum & Minerals (KFUPM), Saudi Arabia.

Acknowledgments

The authors would like to acknowledge the research support and facility provided by the Deanship of Research at King Fahd University of Petroleum & Minerals (KFUPM), Saudi Arabia.

Conflicts of Interest

The authors declare no conflicts of interest.

References

  1. McMillan, T.E. Urban form and a child’s trip to school: The current literature and a framework for future research. J. Plan. Lit. 2005, 19, 440–456. [Google Scholar] [CrossRef]
  2. Rothman, L.; MacPherson, A.K.; Ross, T.; Buliung, R.N. The decline in active school transportation (AST): A systematic review of the factors related to AST and changes in school transport over time in North. America. Prev. Med. 2018, 111, 314–322. [Google Scholar] [CrossRef] [PubMed]
  3. McMillan, T.E. The relative influence of urban form on a child’s travel mode to school. Transp. Res. Part A Policy Pract. 2007, 41, 69–79. [Google Scholar] [CrossRef]
  4. Singh, N.; Vasudevan, V. Understanding school trip mode choice—The case of Kanpur (India). J. Transp. Geogr. 2018, 66, 283–290. [Google Scholar] [CrossRef]
  5. Müller, S.; Tscharaktschiew, S.; Haase, K. Travel-to-school mode choice modelling and patterns of school choice in urban areas. J. Transp. Geogr. 2008, 16, 342–357. [Google Scholar] [CrossRef]
  6. Mitra, R.; Buliung, R.N. Built environment correlates of active school transportation: Neighborhood and the modifiable areal unit problem. J. Transp. Geogr. 2012, 20, 51–61. [Google Scholar] [CrossRef]
  7. Ross, N.J. ‘My journey to school…’: Foregrounding the meaning of school journeys and children’s engagements and interactions in their everyday localities. Child. Geogr. 2007, 5, 373–391. [Google Scholar] [CrossRef]
  8. Zhang, R.; Yao, E.; Liu, Z. School travel mode choice in Beijing, China. J. Transp. Geogr. 2017, 62, 98–110. [Google Scholar] [CrossRef]
  9. Ahern, S.M.; Arnott, B.; Chatterton, T.; De Nazelle, A.; Kellar, I.; McEachan, R.R. Understanding parents’ school travel choices: A qualitative study using the Theoretical Domains Framework. J. Transp. Health 2017, 4, 278–293. [Google Scholar] [CrossRef]
  10. Al-Ahmadi, H.M. Development of intercity mode choice models for Saudi Arabia. Eng. Sci. 2006, 17, 3–21. [Google Scholar] [CrossRef]
  11. Assi, K.J.; Nahiduzzaman, K.M.; Ratrout, N.T.; Aldosary, A.S. Mode choice behavior of high school goers: Evaluating logistic regression and MLP neural networks. Case Stud. Transp. Policy 2018, 6, 225–230. [Google Scholar] [CrossRef]
  12. Al-Atawi, A.; Saleh, W. Travel behaviour in Saudi Arabia and the role of social factors. Transport 2014, 29, 269–277. [Google Scholar] [CrossRef]
  13. Buehler, R. Determinants of transport mode choice: A comparison of Germany and the USA. J. Transp. Geogr. 2011, 19, 644–657. [Google Scholar] [CrossRef]
  14. Hensher, D.A.; Ton, T.T. A comparison of the predictive potential of artificial neural networks and nested logit models for commuter mode choice. Transp. Res. Part E Logist. Transp. Rev. 2000, 36, 155–172. [Google Scholar] [CrossRef] [Green Version]
  15. Nijkamp, P.; Reggiani, A.; Tritapepe, T. Modelling inter-urban transport flows in Italy: A comparison between neural network analysis and logit analysis. Transp. Res. Part C Emerg. Technol. 1996, 4, 323–338. [Google Scholar] [CrossRef] [Green Version]
  16. Sayed, T.; Razavi, A. Comparison of neural and conventional approaches to mode choice analysis. J. Comput. Civ. Eng. 2000, 14, 23–30. [Google Scholar] [CrossRef]
  17. Zhang, Y.; Xie, Y. Travel mode choice modeling with support vector machines. Transp. Res. Rec. 2008, 2076, 141–150. [Google Scholar] [CrossRef]
  18. Broberg, A.; Sarjala, S. School travel mode choice and the characteristics of the urban built environment: The case of Helsinki, Finland. Transp. Policy 2015, 37, 1–10. [Google Scholar] [CrossRef]
  19. Stewart, O.; Moudon, A.V.; Claybrooke, C. Common ground: Eight factors that influence walking and biking to school. Transp. Policy 2012, 24, 240–248. [Google Scholar] [CrossRef]
  20. Ewing, R.; Schroeer, W.; Greene, W. School location and student travel analysis of factors affecting mode choice. Transp. Res. Rec. 2004, 1895, 55–63. [Google Scholar] [CrossRef]
  21. Lin, J.-J.; Chang, H.-T. Built environment effects on children’s school travel in Taipai: Independence and travel mode. Urban Stud. 2010, 47, 867–889. [Google Scholar] [CrossRef]
  22. Panter, J.R.; Jones, A.P.; Van Sluijs, E.M.; Griffin, S.J. Neighborhood, route, and school environments and children’s active commuting. Am. J. Prev. Med. 2010, 38, 268–278. [Google Scholar] [CrossRef]
  23. Pojani, D.; Boussauw, K. Keep the children walking: Active school travel in Tirana, Albania. J. Transp. Geogr. 2014, 38, 55–65. [Google Scholar] [CrossRef]
  24. Pont, K.; Ziviani, J.; Wadley, D.; Bennett, S.; Abbott, R. Environmental correlates of children’s active transportation: A systematic literature review. Health Place 2009, 15, 849–862. [Google Scholar] [CrossRef]
  25. Giles-Corti, B.; Wood, G.; Pikora, T.; Learnihan, V.; Bulsara, M.; Van Niel, K.; Timperio, A.; McCormack, G.; Villanueva, K. School site and the potential to walk to school: The impact of street connectivity and traffic exposure in school neighborhoods. Health Place 2011, 17, 545–550. [Google Scholar] [CrossRef]
  26. Stewart, O. Findings from research on active transportation to school and implications for safe routes to school programs. J. Plan. Lit. 2011, 26, 127–150. [Google Scholar] [CrossRef]
  27. Van Dyck, D.; De Bourdeaudhuij, I.; Cardon, G.; Deforche, B. Criterion distances and correlates of active transportation to school in Belgian older adolescents. Int. J. Behav. Nutr. Phys. Act. 2010, 7, 87. [Google Scholar] [CrossRef]
  28. McDonald, N.C. Children’s mode choice for the school trip: The role of distance and school location in walking to school. Transportation 2008, 35, 23–35. [Google Scholar] [CrossRef]
  29. Dave, S.; Raykundaliya, D.; Shah, S. Modeling trip attributes and feasibility study of co-ordinated bus for school trips of children. Procedia Soc. Behav. Sci. 2013, 104, 650–659. [Google Scholar] [CrossRef]
  30. Carver, A.; Panter, J.R.; Jones, A.P.; Van Sluijs, E.M. Independent mobility on the journey to school: A joint cross-sectional and prospective exploration of social and physical environmental influences. J. Transp. Health 2014, 1, 25–32. [Google Scholar] [CrossRef]
  31. Mandic, S.; Sandretto, S.; Bengoechea, E.G.; Hopkins, D.; Moore, A.; Rodda, J.; Wilson, G. Enrolling in the Closest School or Not.? Implications of school choice decisions for active transport to school. J. Transp. Health 2017, 6, 347–357. [Google Scholar] [CrossRef]
  32. Central Department of Statistics & Information. Census Report; Ministry of Economy and Planning: Riyadh, Saudi Arabia, 2010. [Google Scholar]
  33. MacCallum, R.C.; Widaman, K.F.; Zhang, S.; Hong, S. Sample size in factor analysis. Psychol. Methods 1999, 4, 84–89. [Google Scholar] [CrossRef]
  34. Sudman, S. Applied Sampling; Academic Press: New York, NY, USA, 1976. [Google Scholar]
  35. Jiang, Z.; Lin, R.; Yang, F. A Hybrid Machine Learning Model for Electricity Consumer Categorization Using Smart Meter Data. Energies 2018, 11, 2235. [Google Scholar] [CrossRef]
  36. Shafiullah, M.; Abido, M.A.; Abdel-Fattah, T. Distribution Grids Fault Location employing ST based Optimized Machine Learning Approach. Energies 2018, 11, 2328. [Google Scholar] [CrossRef]
  37. Świetlicka, I.; Sujak, A.; Muszyński, S.; Świetlicki, M. The application of artificial neural networks to the problem of reservoir classification and land use determination on the basis of water sediment composition. Ecol. Indic. 2017, 72, 759–765. [Google Scholar] [CrossRef]
  38. Ijaz, M.; Shafiullah, M.; Abido, M. Classification of power quality disturbances using Wavelet Transform and Optimized ANN. In Proceedings of the 2015 18th International Conference on Intelligent System Application to Power Systems (ISAP), Porto, Portugal, 11–17 September 2015; IEEE: Piscataway, NJ, USA, 2015. [Google Scholar]
  39. Shafiullah, M.; Abido, M. S-Transform based FFNN approach for distribution grids fault detection and classification. IEEE Access 2018, 6, 8080–8088. [Google Scholar] [CrossRef]
  40. Bhattacharjee, N.V.; Tollner, E.W. Improving management of windrow composting systems by modeling runoff water quality dynamics using recurrent neural network. Ecol. Model. 2016, 339, 68–76. [Google Scholar] [CrossRef]
  41. Carter, J.A.; Long, C.S.; Smith, B.P.; Smith, T.L.; Donati, G.L. Combining elemental analysis of toenails and machine learning techniques as a non-invasive diagnostic tool for the robust classification of type-2 diabetes. Expert Syst. Appl. 2019, 115, 245–255. [Google Scholar] [CrossRef]
  42. Diker, A.; Avci, D.; Avci, E.; Gedikpinar, M. A new technique for ECG signal classification genetic algorithm Wavelet Kernel extreme learning machine. Optik 2019, 180, 46–55. [Google Scholar] [CrossRef]
  43. Rahman, S.M.; Khondaker, A.; Hossain, M.I.; Shafiullah, M.; Hasan, M.A. Neurogenetic modeling of energy demand in the United Arab Emirates, Saudi Arabia, and Qatar. Environ. Prog. Sustain. Energy 2017, 36, 1208–1216. [Google Scholar] [CrossRef]
  44. Haykin, S.; Network, N. A comprehensive foundation. Neural Netw. 2004, 2, 41. [Google Scholar]
  45. Haykin, S. Neural Networks and Learning Machines; Pearson Education: Upper Saddle River, NJ, USA, 2009; Volume 3. [Google Scholar]
  46. Sun, K.; Huang, S.-H.; Wong, D.S.-H.; Jang, S.-S. Design and application of a variable selection method for multilayer perceptron neural network with LASSO. IEEE Trans. Neural Netw. Learn. Syst. 2016, 28, 1386–1396. [Google Scholar] [CrossRef]
  47. Hunter, D.; Yu, H.; Pukish, I.M.S.; Kolbusz, J.; Wilamowski, B.M. Selection of proper neural network sizes and architectures—A comparative study. IEEE Trans. Ind. Inform. 2012, 8, 228–240. [Google Scholar] [CrossRef]
  48. Maiti, S.; Verma, V.; Chakraborty, C.; Hori, Y. An. adaptive speed sensorless induction motor drive with artificial neural network for stability enhancement. IEEE Trans. Ind. Inform. 2012, 8, 757–766. [Google Scholar] [CrossRef]
  49. Bui, D.T.; Tuan, T.A.; Klempe, H.; Pradhan, B.; Revhaug, I. Spatial prediction models for shallow landslide hazards: A comparative assessment of the efficacy of support vector machines, artificial neural networks, kernel logistic regression, and logistic model tree. Landslides 2016, 13, 361–378. [Google Scholar]
  50. Richhariya, B.; Tanveer, M. EEG signal classification using universum support vector machine. Expert Syst. Appl. 2018, 106, 169–182. [Google Scholar] [CrossRef]
  51. Shafiullah, M.; Ijaz, M.; Abido, M.A.; Al-Hamouz, Z. Optimized support vector machine & wavelet transform for distribution grid fault location. In Proceedings of the 2017 11th IEEE International Conference on Compatibility, Power Electronics and Power Engineering (CPE-POWERENG), Cadiz, Spain, 4–6 April 2017; IEEE: Piscataway, NJ, USA, 2017. [Google Scholar]
  52. Shahriar, M.S.; Shafiullah, M.; Rana, M.J. Stability enhancement of PSS-UPFC installed power system by support vector regression. Electr. Eng. 2018, 100, 1601–1612. [Google Scholar] [CrossRef]
  53. Vapnik, V.; Golowich, S.E.; Smola, A.J. Support vector method for function approximation, regression estimation and signal processing. In Advances in Neural Information Processing Systems; MIT Press: Cambridge, MA, USA, 1997. [Google Scholar]
  54. Cecati, C.; Kolbusz, J.; Rozycki, P.; Siano, P.; Wilamowski, B.M. A novel RBF training algorithm for short-term electric load forecasting and comparative studies. IEEE Trans. Ind. Electron. 2015, 62, 6519–6529. [Google Scholar] [CrossRef]
  55. Huang, G.-B.; Zhu, Q.-Y.; Siew, C.-K. Extreme learning machine: A new learning scheme of feedforward neural networks. Neural Netw. 2004, 2, 985–990. [Google Scholar]
  56. Shafiullah, M.; Abido, M.A.; Al-Hamouz, Z. Wavelet-based extreme learning machine for distribution grid fault location. IET Gener. Transm. Distrib. 2017, 11, 4256–4263. [Google Scholar] [CrossRef]
  57. Erik, C.; Huang, G.; Liyanaarachchi, L. Extreme learning machines [trends & controversies]. IEEE Intell. Syst. 2013, 28, 30–59. [Google Scholar]
  58. Hosni, M.; Abnane, I.; Idri, A.; De Gea, J.M.C.; Alemán, J.L.F. Reviewing Ensemble Classification Methods in Breast Cancer. Comput. Methods Programs Biomed. 2019, 177, 89–112. [Google Scholar] [CrossRef]
  59. Idri, A.; Hosni, M.; Abran, A. Systematic Mapping Study of Ensemble Effort Estimation. In Proceedings of the 11th International Conference on Evaluation of Novel Software Approaches to Software Engineering ENASE, Rome, Italy, 27–28 April 2016. [Google Scholar]
  60. Werbin-Ofir, H.; Dery, L.; Shmueli, E. Beyond Majority: Label. Ranking Ensembles based on Voting Rules. Expert Syst. Appl. 2019, 136, 50–61. [Google Scholar] [CrossRef]
  61. Demir, N. Ensemble Methods: Elegant Techniques to Produce Improved Machine Learning Results. Available online: https://www.toptal.com/machine-learning/ensemble-methods-machine-learning (accessed on 2 August 2019).
Figure 1. Simplified structure of the multi-layer perceptron (MLP) neural network.
Sustainability 11 04484 g001
Figure 2. Accuracy comparison for the testing datasets.
Sustainability 11 04484 g002
Table 1. School population in the study area.
School TypePopulationSample Size (% of the Population)
High1813 (72%)
Middle2513 (52%)
Elementary4515 (33%)
Total8841 (47%)
Table 2. The description of the variables used in mode choice modeling.
ParameterTypeAverageStandard Deviation
School-levelNominal----
School distance (km)Continuous3.282.80
Travel time (min)Continuous14.57.66
Family (monthly) income ($)Continuous27001500
Family sizeDiscrete5.70.63
Students number in the familyDiscrete3.200.93
Education level of the parentsBinary----
Table 3. Modal split, average travel time average distance, and average family income.
ModeModal Split %Average Travel Time (min)Average Distance (Km)Average Family Income ($)
Passenger Car70.5143.52850
Walking29.5130.672300
Table 4. Operation time and accuracy for 60% training and 40% testing data.
TechniqueOperation TimeAccuracy (%)
TrainingTestingTrainingTesting
SVM9.8280.013288.0987.02
ELM0.0420.008699.7898.31
MLP-NN4.6410.015699.2198.65
Table 5. Operation time and accuracy for 70% training and 30% testing data.
TechniqueOperation TimeAccuracy (%)
TrainingTestingTrainingTesting
SVM11.7660.011386.3286.07
ELM0.0450.008799.8197.75
MLP-NN4.4530.014699.7198.65
Table 6. Operation time and accuracy for 80% training and 20% testing data.
TechniqueOperation TimeAccuracy (%)
TrainingTestingTrainingTesting
SVM10.9220.015389.5589.53
ELM0.0490.006999.7597.30
MLP-NN5.9530.015699.6698.99
Table 7. Accuracy comparison for the testing datasets.
TechniqueAccuracy (%)
60% Training Data70% Training Data80% Training Data
SVM87.0286.0789.53
ELM98.3197.7597.30
MLP-NN98.6598.6598.99
Ensemble98.8299.3398.99

