Can More Accurate Night-Time Remote Sensing Data Simulate a More Detailed Population Distribution?

1
Shenzhen Institute of Building Research Co., Ltd., Shenzhen 518049, Guangdong, China
2
School of Urban Planning and Design, Peking University Shenzhen Graduate School, Shenzhen 518055, Guangdong, China
3
Engineering and Policy Analysis, Faculty of Technology, Policy and Management Delft University of Technology, 2600 GA Delft, The Netherlands
4
Rotterdam School of Management & Erasmus School of Law, Erasmus University Rotterdam, 3000 DR Rotterdam, The Netherlands
*
Author to whom correspondence should be addressed.
Sustainability 2019, 11(16), 4488; https://0-doi-org.brum.beds.ac.uk/10.3390/su11164488
Submission received: 11 June 2019
/
Revised: 9 August 2019
/
Accepted: 9 August 2019
/
Published: 19 August 2019
(This article belongs to the Section Sustainable Urban and Rural Development)
Abstract
:Aging, shrinking cities, urban agglomerations and other new key terms continue to emerge when describing the large-scale population changes in various cities in mainland China. It is important to simulate the distribution of residential populations at a coarse scale to manage cities as a whole, and at a fine scale for policy making in infrastructure development. This paper analyzes the relationship between the DN (Digital number, value assigned to a pixel in a digital image) value of NPP-VIIRS (the Suomi National Polar-orbiting Partnership satellite’s Visible Infrared Imaging Radiometer Suite) and LuoJia1-01 and the residential populations of urban areas at a district, sub-district, community and court level, to compare the influence of resolution of remote sensing data by taking urban land use to map out auxiliary data in which first-class (R1), second-class (R2) and third-class residential areas (R3) are distinguished by house price. The results show that LuoJia1-01 more accurately analyzes population distributions at a court level for second- and third-class residential areas, which account for over 85% of the total population. The accuracy of the LuoJia1-01 simulation data is higher than that of Landscan and GHS (European Commission Global Human Settlement) population. This can be used as an important tool for refining the simulation of residential population distributions. In the future, higher-resolution night-time light data could be used for research on accurate simulation analysis that scales down large-scale populations.
1. Introduction
Population changes are the driving force behind urban development and a key factor in the development of urban service industries. Distribution of populations has an important impact on society, the economy and physical environments [1]. For cities, population distribution affects important factors such as city size, pollution distribution and urban economic development. Refined modeling of small-scale population distribution forms the basis for improving city management and the construction of livable cities. The ability to quickly and accurately obtain information on refined urban population changes not only affects the timeliness of government regulation and control, but also affects the public’s satisfaction with living conditions in a city.
At present, various cities in mainland China are encountering large-scale population changes. Some cities experience large-scale population inflows caused by the formation of metropolitan areas. Other cities undergo drastic shrinkage due to weak economic structures and unfavorable locations [2]. Developed coastal cities, such as Guangzhou and Shenzhen, are faced with heavy population influxes, with the two cities experiencing a net increase in population size of 406,000 and 498,300, respectively, in 2018 alone [3]. In Shenzhen, over 60% of these new residents are university graduates and other types of talents. The same situation occurs in many developed cities such as Beijing and Shanghai, which are undergoing an urban population structure shift too. The shrinking cities are mostly located in the provinces Hubei, Sichuan, Anhui and Heilongjiang. Recently, the city of Hegang in Heilongjiang province reported that the price of second-hand housing in the district was only about 15 dollars per square meter, and the price of a house was 4000 dollars. However, despite these low housing prices, purchases have been minimal. The shrinking city brings about a decline in economy and consumption capacity, thereby creating a positive feedback loop that further decreases the population.
In 2018, China’s urbanization rate increased to over 59% [4]. It is predicted that by 2030 it will reach 70% as the population living in cities and towns exceeds 1 billion, and the rural population will be reduced to less than 500 million [5]. Although 500 million is still a considerable amount in absolute terms, the rural population in China is declining rapidly. In 2010, the total population was 1.341 billion, with 671 million rural citizens, while in 2018 the total population was 1.395 billion, with 564 million citizens living in rural areas. The urbanization rate has risen by almost 10% between 2010 and 2018. As China’s development is shaped by its changes in demography, obtaining timely, objective and accurate population distribution data has been essential for revealing its hierarchical design, economic development and urban layout. This revelation will allow its cities to improve their urban competitiveness and overall attractiveness with minimal financial resources.
Official population census data often associate spatial with administrative units [6,7,8]. However, this method has certain problems for urban research: (1) The interval period between measurements is long; the Chinese census is conducted at intervals of 10 years or more. The last census in China was taken in 2010 [9]. (2) The minimum administrative unit is too large, and does not reflect the heterogeneous distribution of the population within the unit. The census from 2010 shows the sub-district as its smallest level of detail. (3) Census and spatial unit boundary changes are not always synchronized. A finer resolution of night-time remote sensing data, combined with smaller land use units than the census unit and a spatialized decomposition of statistical population data are an effective way to solve these problems.
In recent years, the use of mobile phone signaling data, taxis, maps and other big data to analyze population distribution has led to high levels of accuracy and spatial resolution [10,11]. However, these methods are prone to problems such as data security, data acquisition and double counting (e.g., one person may have more than one mobile phone). Another good approach has been to obtain relevant data through methods such as data desensitization to randomize or remove confidential information. In addition, building data such as building profiles and heights have been shown to more accurately decompose population distributions [12]. But this method is applicable to some developed countries only, as the availability of building data is limited in most developing countries.
In addition to the traditional government census and big data methods used to obtain population distribution data, the use of night-time light imagery data to analyze population distribution has gradually become a universal means, with relatively fair and objective features. Studies have been conducted that show cases of night-time light data used for the study of urban population distribution. These studies have reported a good correlation between night-time light data and urban population distributions in urban, regional, national and worldwide regions [13,14]. However, the analytical units used in these studies have been large, at either city or sub-city levels [15,16,17].
In recent years, various population simulation methods have been applied globally (e.g., Landscan [18] and GHS population [15,19]) at regional (e.g., Southeast Asia [20], Europe [21,22]), country-wide (e.g., China [23]), provincial [24], city-wide (e.g., Barcelona, Spain [25]) and county/district and township/street levels [26]. Based on population–land use models, specialization of population data can be obtained by dividing the spatial cell grid and weighing the corresponding grid by land use types [24,27,28]. Using this method, grid resolutions of over 100 m can be achieved [20,21]. There are also other auxiliary methods for obtaining population information, such as random forest [29]. However, these methods are not unproblematic either, for instance: (1) Spatial units and administrative boundaries are different, which is not convenient for government intervention and management. (2) DMSP-OLS (the Meteorological Satellite Program’s Operational Linescan System) (2.7 km, 1992–2013) and NPP-VIIRS (742 m, December 2011–present) data are often used, but lack of data availability and spatial resolution may affect the accuracy of their research results. (3) These methods ignore the internal grid differences and differences in the population distributions caused by factors other than land use type.
Based on the above research experience, the goal of this paper is to (1) find out if the spatial resolution of remote sensing data affects the accuracy of the research results; (2) explore whether the use of higher resolution night-time light data (LuoJia1-01) can reduce the minimum unit of analysis that is significantly relevant to the population, such as sub-districts, communities or finer scales; and (3) investigate whether there is a significant correlation between the high-resolution LuoJia1-01 night-time lighting data and the statistical population data of different types of residential areas in the presence of ancillary data.
2. Materials and Methods
The night-time remote sensing data used in this paper are NPP-VIIRS and LuoJia1-01. The NPP-VIIRS data is the Version 1 VIIRS Day/Night Band Nighttime Lights of NOAA National Centers for Environmental Information (NVEI), in which monthly average data were used that excluded the effects of stray light, lightning, lunar illumination and cloud cover. Data of the Tile3 (75N060E) product with the average of the time period for October 2018 was used. The LuoJia1-01 data are open-source high-resolution night-time remote sensing data, for which the corresponding satellite (LuoJia-1A) was successfully launched by Wuhan University on 2 June 2018. The spatial resolution of LuoJia1-01 is greatly improved compared to DMSP-OLS (OLS sensor 2.7 km) and NPP-VIIRS (VIIRS visible infrared imaging radiometer 740 m), and artificial light sources can be clearly distinguished by LuoJia1-01 night-time remote sensing imaging. The data used in this paper were cloud free imagery data (in which users can set an acceptable amount of cloud in the system; e.g., less than 5%), which were obtained on 3 September 2018. The data acquisition time of LuoJia1-01 was 14:44:24 GMT (22:44:24 CST), meaning a large portion of the citizens were likely asleep at the time. It is reasonable to assume that most commercial activities were suspended and traffic was minimal in residential areas, which means that there was limited interference from these sources. The NPP-VIIRS and LuoJia1-01 data are currently running, and the data has no saturation value. Table 1 below shows a comparison of the data.
The ancillary data came from official community grid data of Futian District released by Shenzhen and other online maps.
The comparative data included the Landscan™ global population database (Landscan) and GHS population grid (GHS-POP). Among them, Landscan shows the geographical distribution of the population at a 1-km resolution over an average 24-h period. Its latest data comes from 2017, and are updated on a yearly basis. GHS-POP provides demographic data for four periods, including 1975, 1990, 2000 and 2014 with a resolution of 250 m. GHS-POP data combines census data and built-up area data into grid data that does not consider administrative boundaries.
Before the data analysis, the geographic coordinate system of the night-time light data, auxiliary data and comparison data were converted to the projected coordinates of WGS_1984_UTM_Zone_50 in ArcGIS 10.2 (ESRI Inc., Redlands, Cal. USA). Spatial adjustment was then performed on all data. Since the LuoJia1-01 can clearly recognize roads and other information in high resolution, its adjustment accuracy is higher than that of NPP-VIIRS, Landscan and GHS-POP.
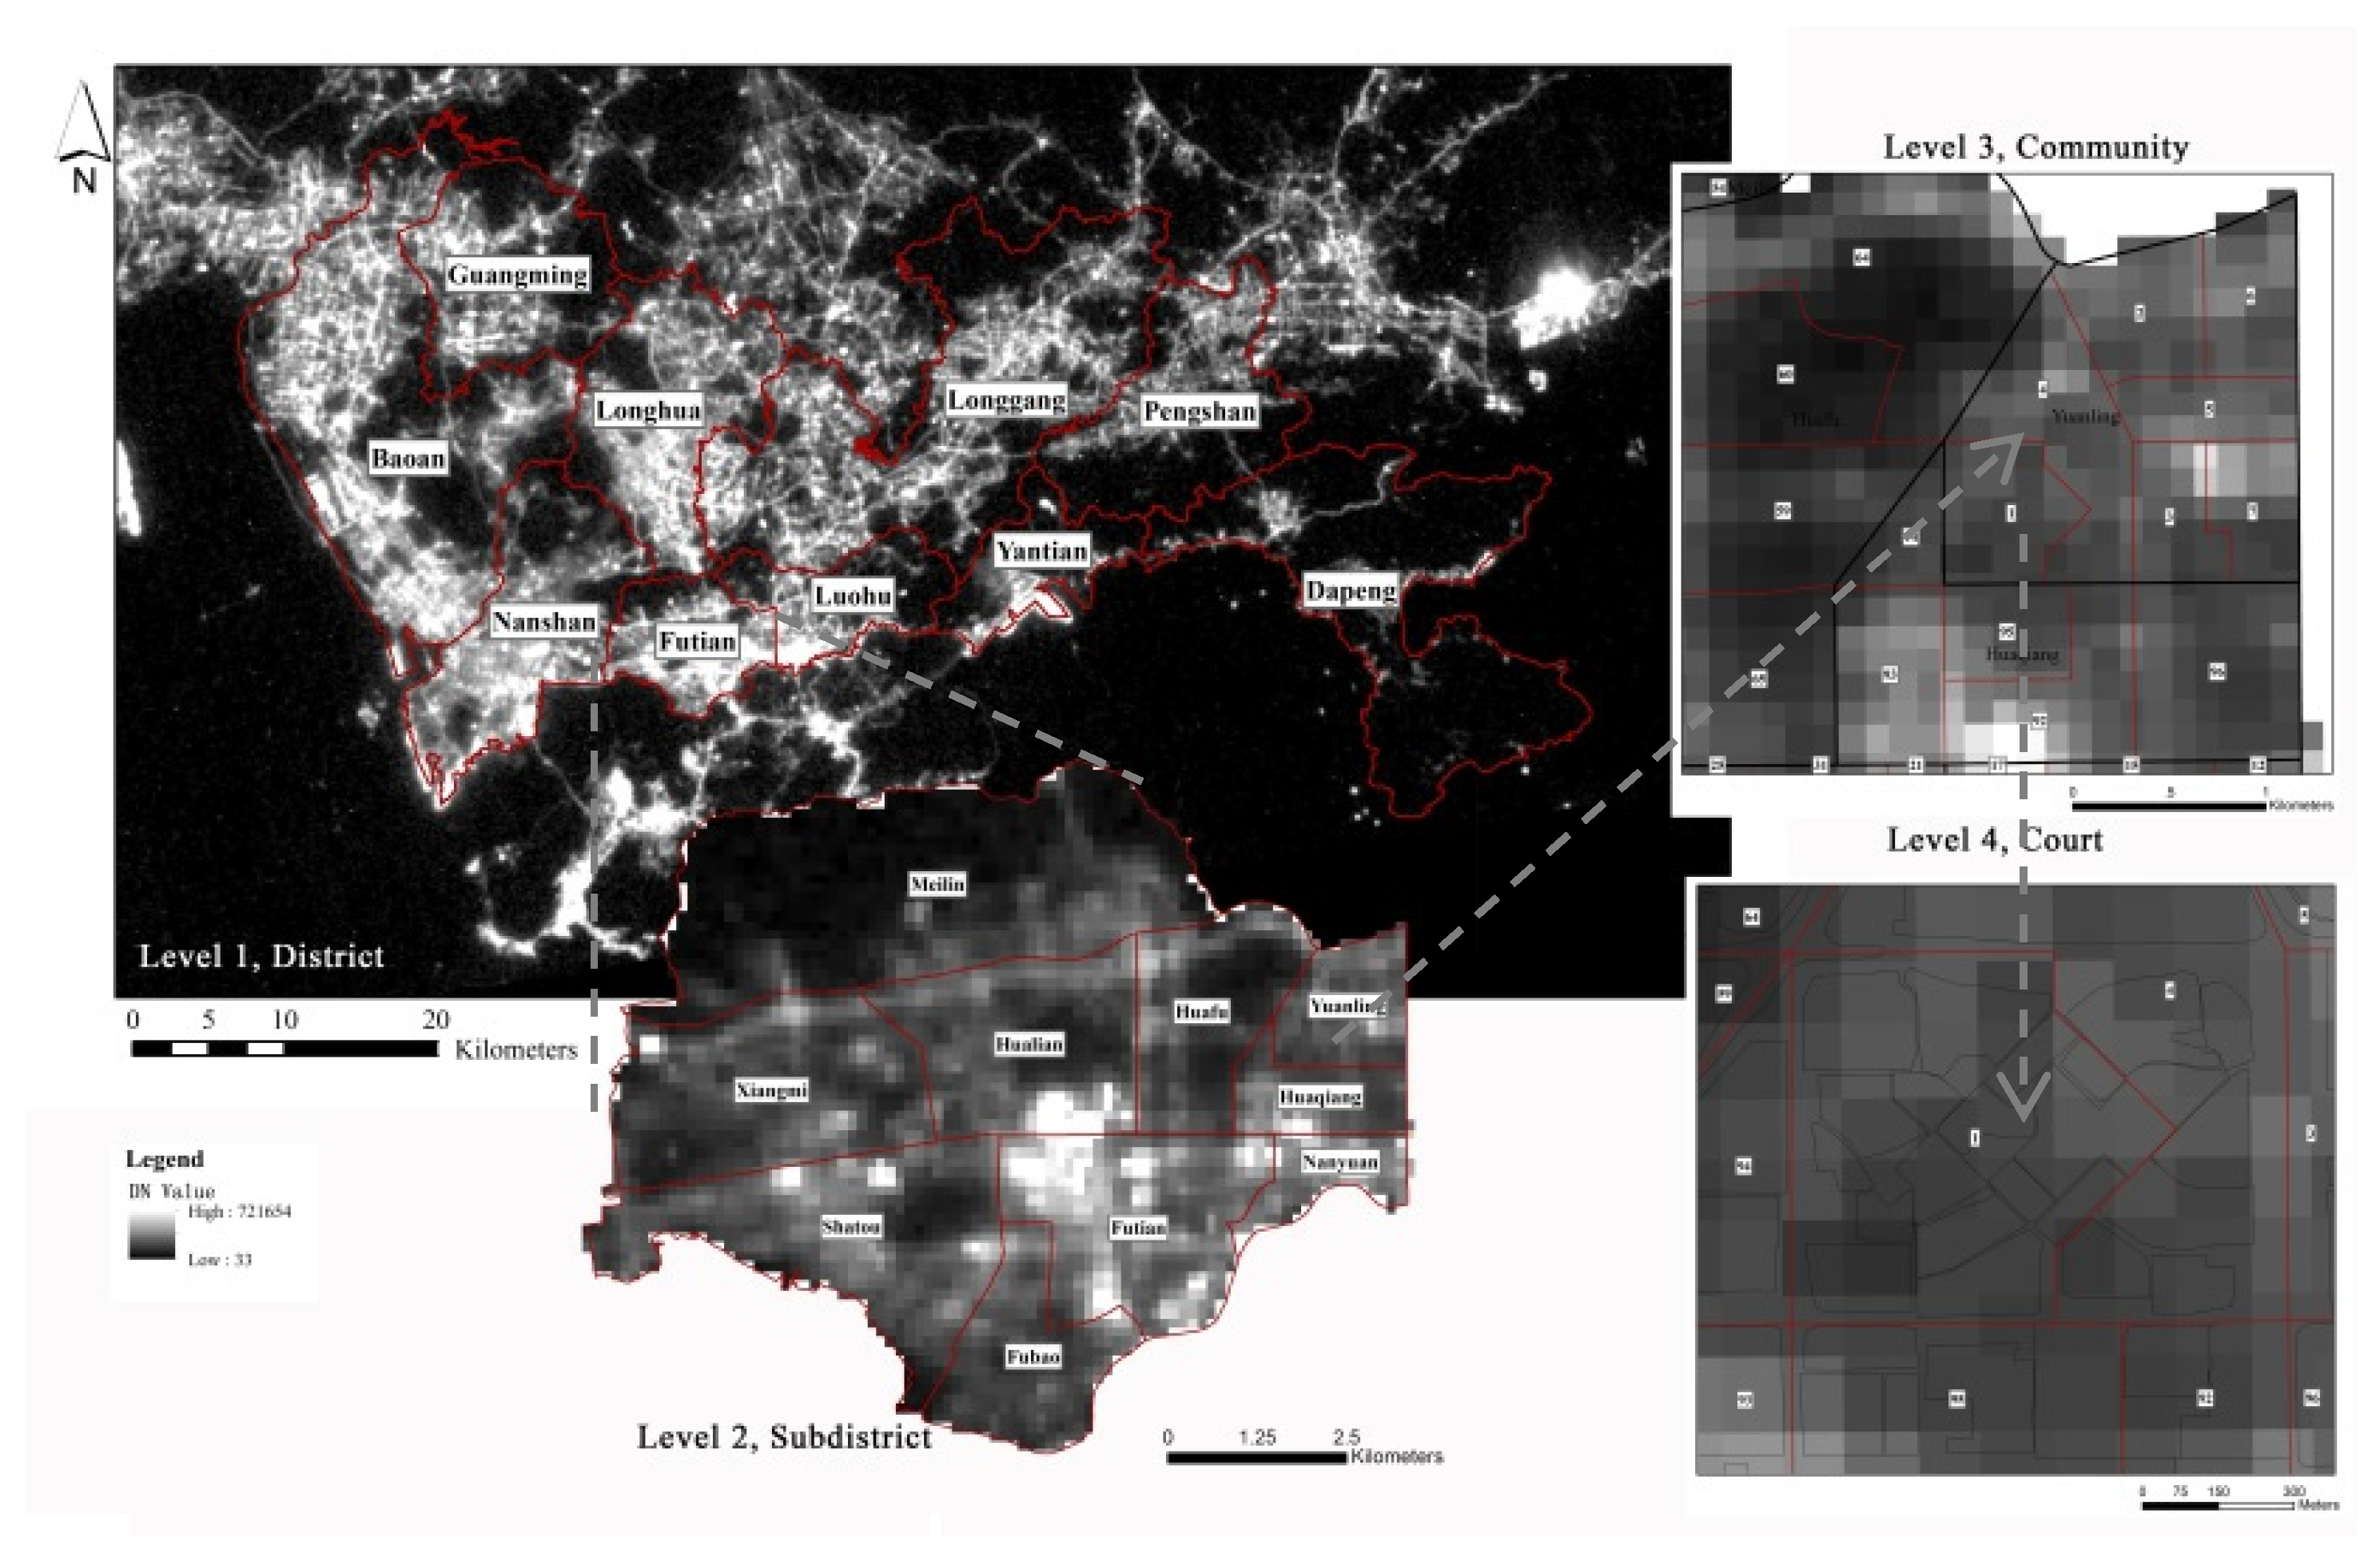
Taking Futian District in Shenzhen as a case city, four levels in the Chinese administrative systems were adopted to analyze the relationship between night-time light data and census data; these were districts, sub-districts, communities and courts (Figure 1). The sub-district was the smallest unit of China’s fifth and sixth censuses.
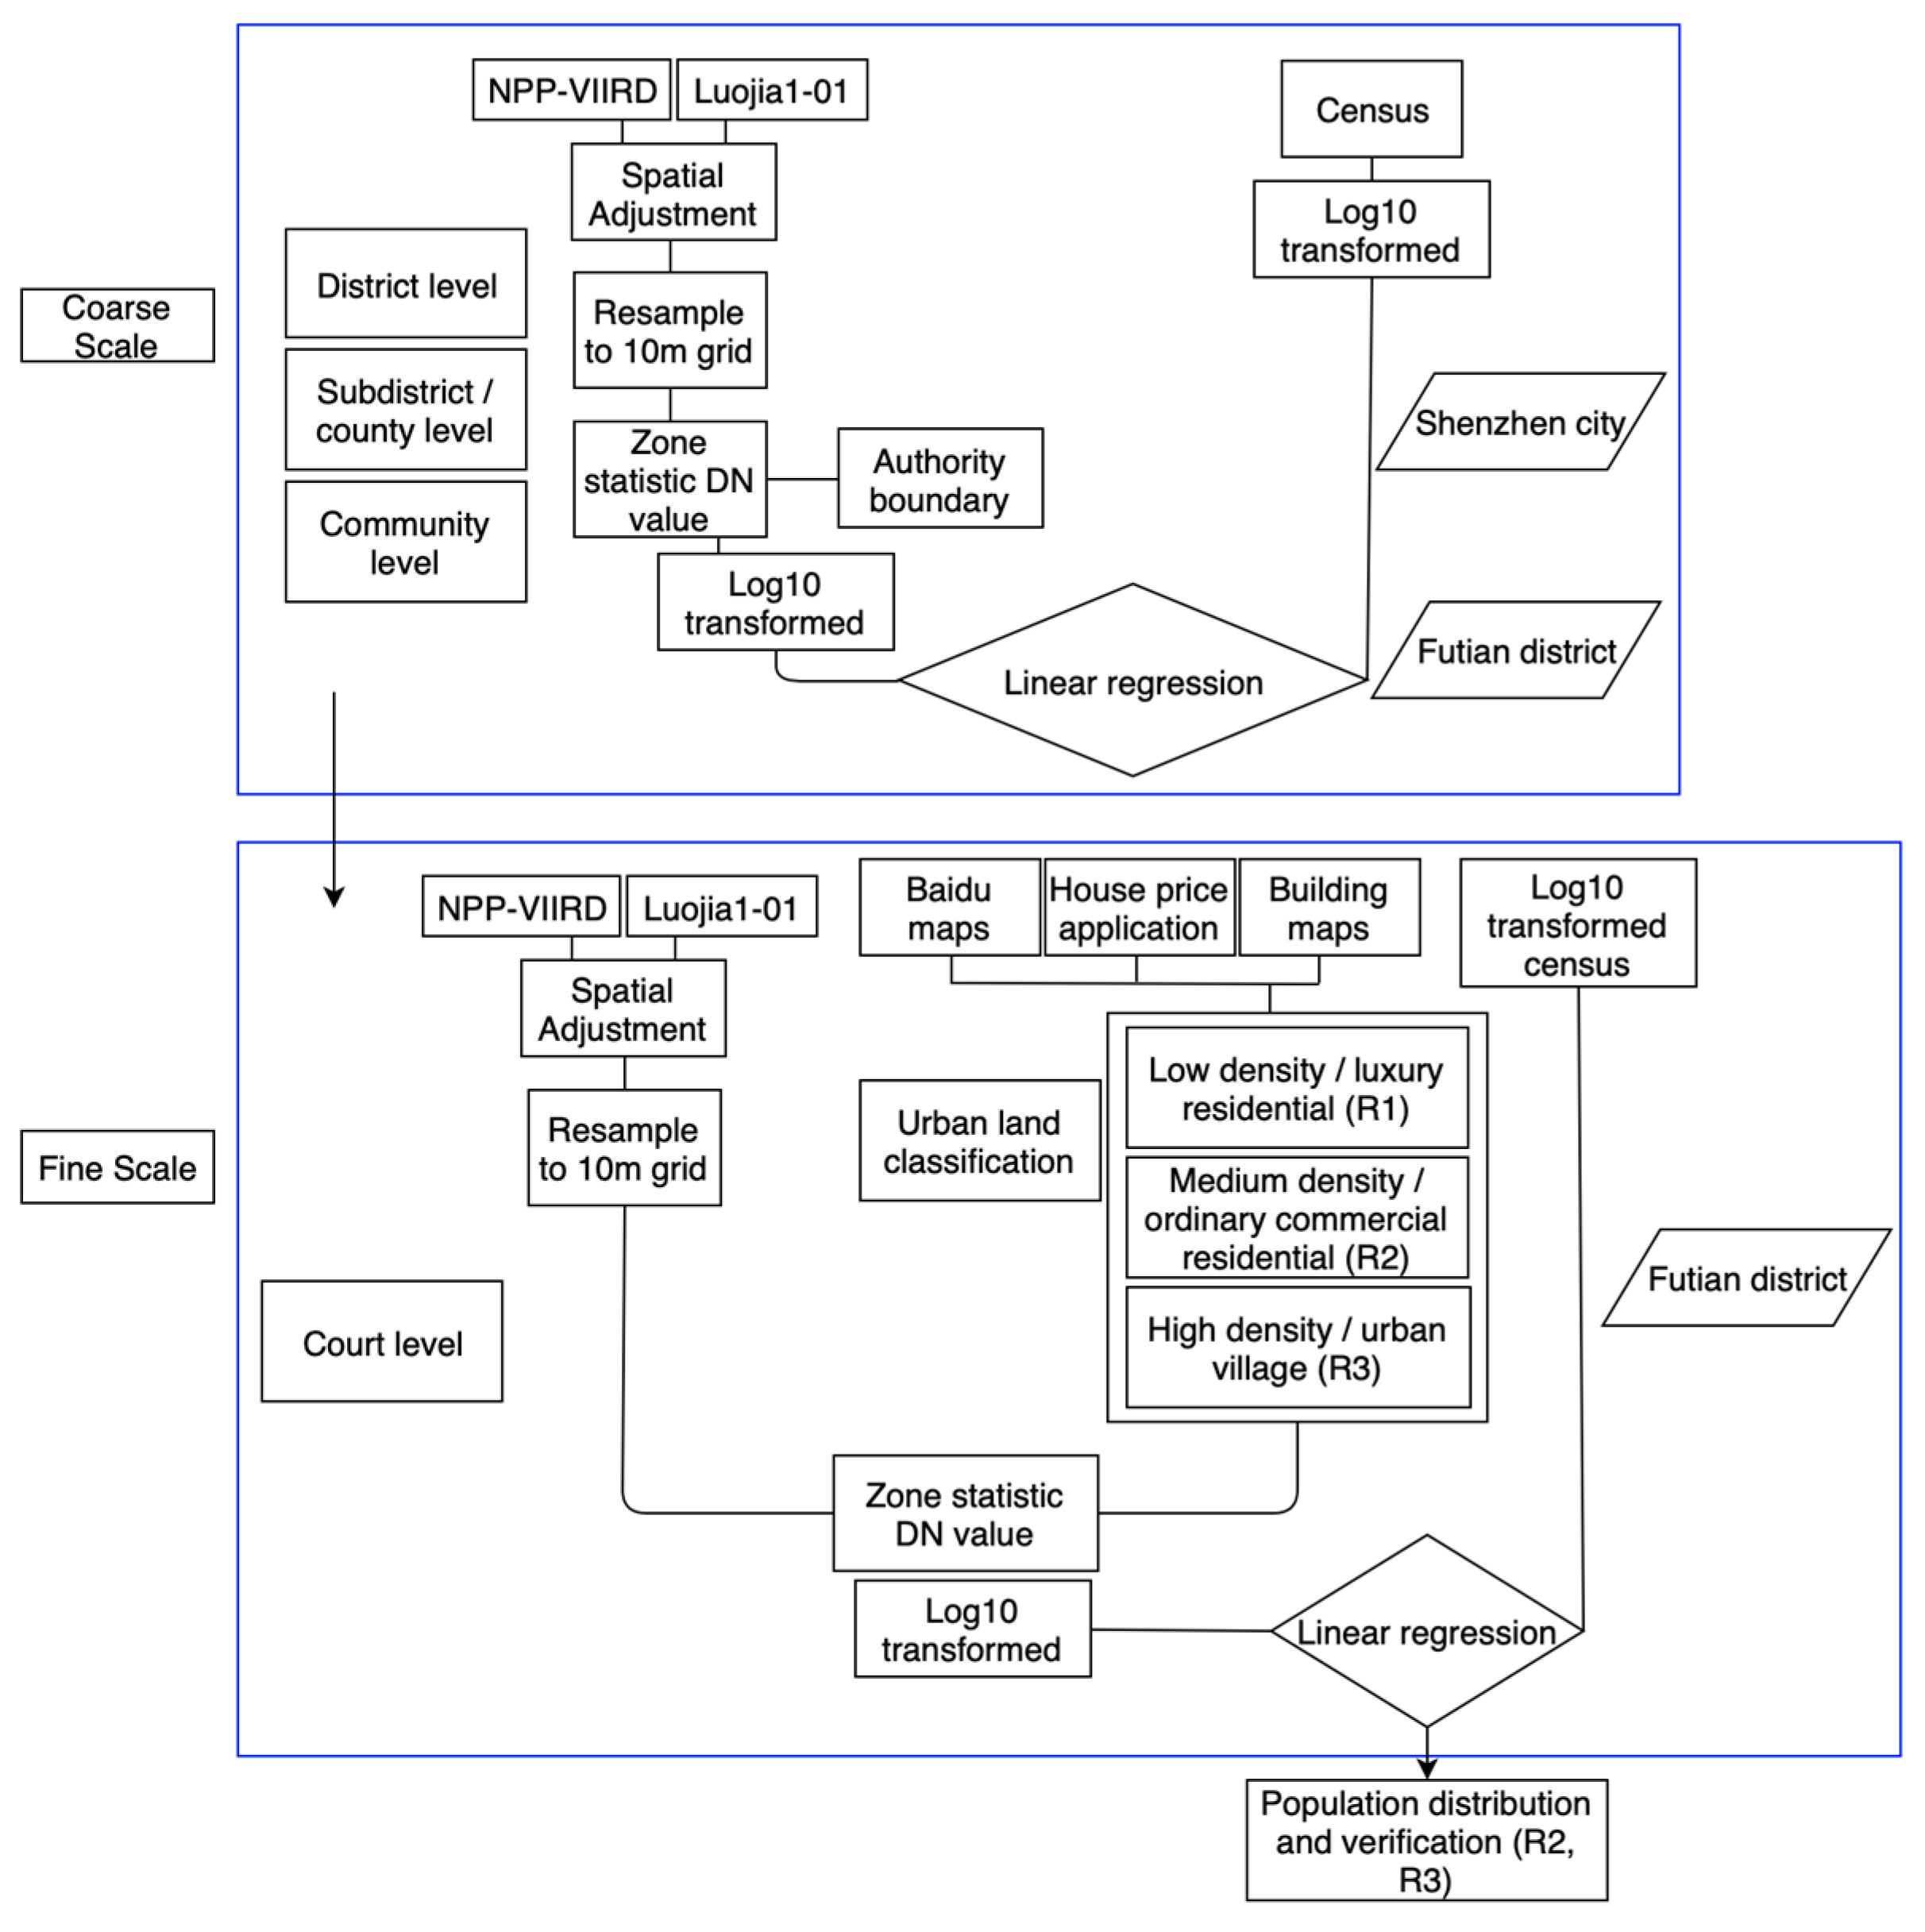
As is shown in Figure 2 below, the data of Shenzhen NPP-VIIRS and LuoJia1-01 after spatial adjustment were used to examine the situation at the district, sub-district and community levels. The sum DN value of night-time light data in 10 districts of Shenzhen, 10 sub-districts of Futian District and 10 communities of Futian District were investigated using Zonal Statistic in ArcGIS. After the log transformation of both the remote sensing DN value and population, linear regression analysis was performed using Sigmaplot 12.5 of log10 for the official statistical population.
Urban land use data was assigned at the court level through the use of building data, road network data, Shenzhen community grid data and landmarks in Baidu maps as supplementary data. The land type of Futian District was divided into nine types: residential (R); administration and public services (A); commercial and business facilities (B); industrial and manufacturing (M); logistics and warehouse (W); road, street and transportation (S); municipal utilities (U); green space and square (G); and non-development land (E) according to MOHURD [30]. The principle objective was to ensure that more than 90% of each court had a single land use function (e.g., residential, commercial or business land).
As this paper mainly considers the distribution of the residential population, the land use types were used to determine population numbers in different residential buildings, such as urban villages, general commercial housing and high-end residential buildings. Housing prices and court boundaries were used to divide residences into three groups. This was done in accordance with housing prices on Anjuke (Chinese housing prices are listed on this website, https://beijing.anjuke.com/, which can be achieved freely by Web Crawler code using Python), while the relationship between housing price and night-time light data was used as a preliminary estimate. Areas in which houses had an estimated price of ≥$6000/m2 were classified as “first-class residential areas” (R1). These residential areas are of low density or considered important areas of the city. Areas in which houses had an estimated price of $2500–6000/m2 were classified as “second-class residential areas” (R2). These areas are of medium density, which are general commodity housing or policy-protected housing. Areas in which houses had an estimated price of <$2500/m2 were classified as “third-class residential areas” (R3). These types of residential area are generally high-density residential areas, such as urban villages, which are inhabited by low-income groups. The DN value of each different residential area was calculated using ArcGIS’s Zonal Statistic function. After a log transformation, a linear regression analysis was performed between the log-transformed DN value of LuoJia1-01 and the log-transformed official statistical population in Sigmaplot 12.5 (Systat Software, Inc, San Jose, Cal. USA).
3. Results
3.1. Sample Analysis
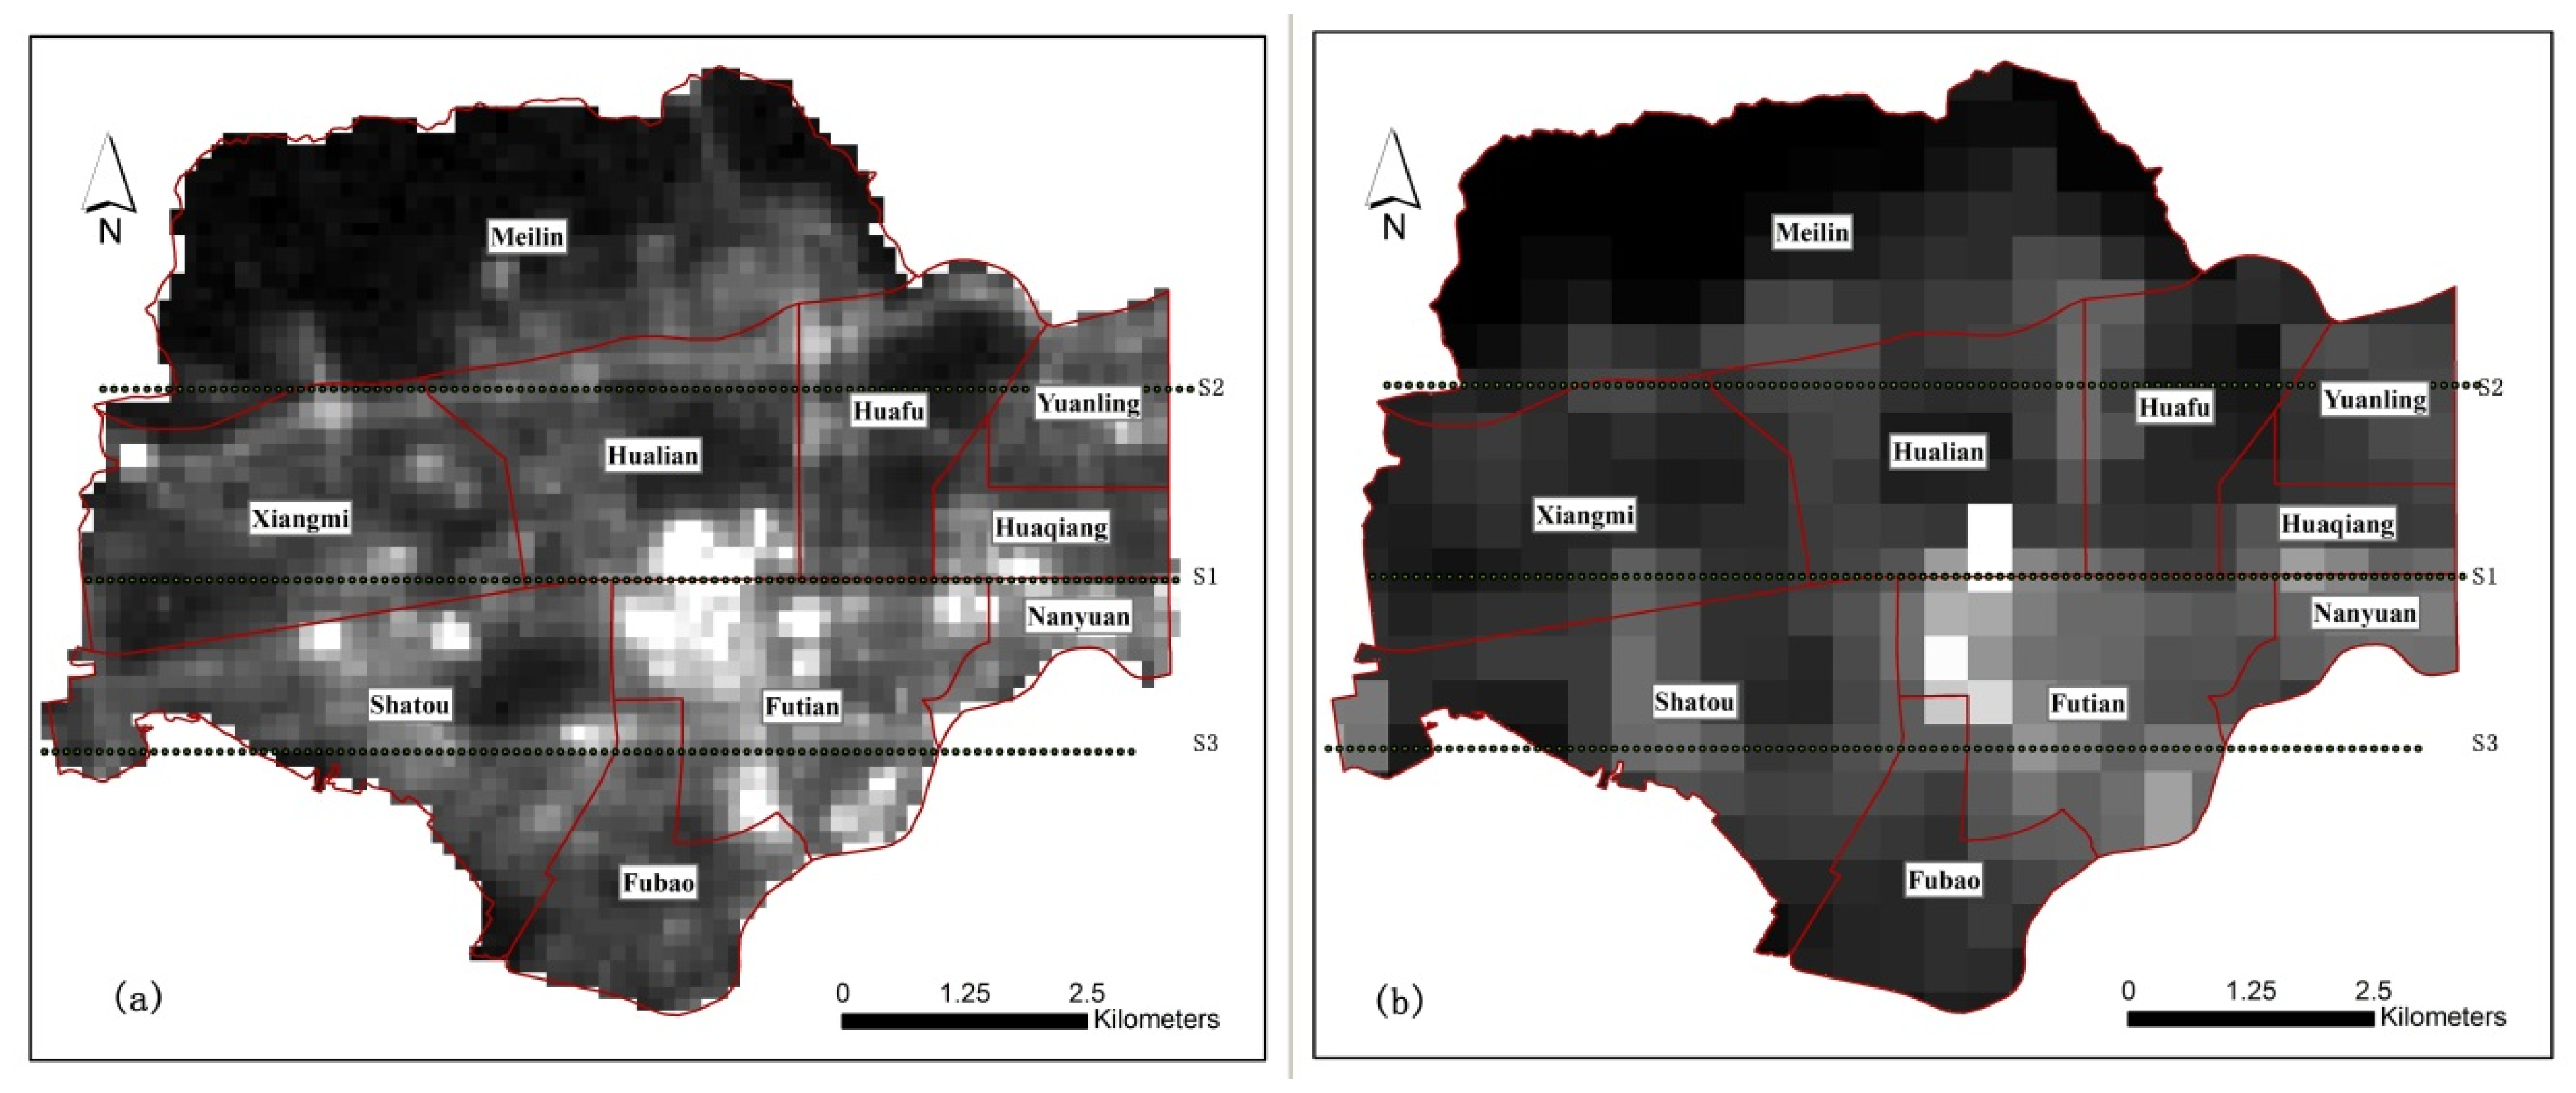
Three transects of S1, S2, and S3 were set for NPP-VIIRS and LuoJia1-01, and 100 samples were set for each transect to observe the change of DN values of different data sources, as is shown in Figure 3 below.
The results showed that the change of frequency of LuoJia1-01’s DN value was more than that of NPP-VIIRS, and provided more information (Figure 4). At many sampling points the trends of NPP-VIIRS and LuoJia1-01 significantly opposed to one another, and at many sites when LuoJia1-01’s DN value had an upward trend, NPP-VIIRS showed a downward slope. This was because the pixel size of NPP-VIIRS was much larger than that of LuoJia1-01, and was not equipped to distinguish small range changes that were observed by LuoJia1-01.
3.2. Relationship between Night-Time Light Data and Census Population Data of Various Scales
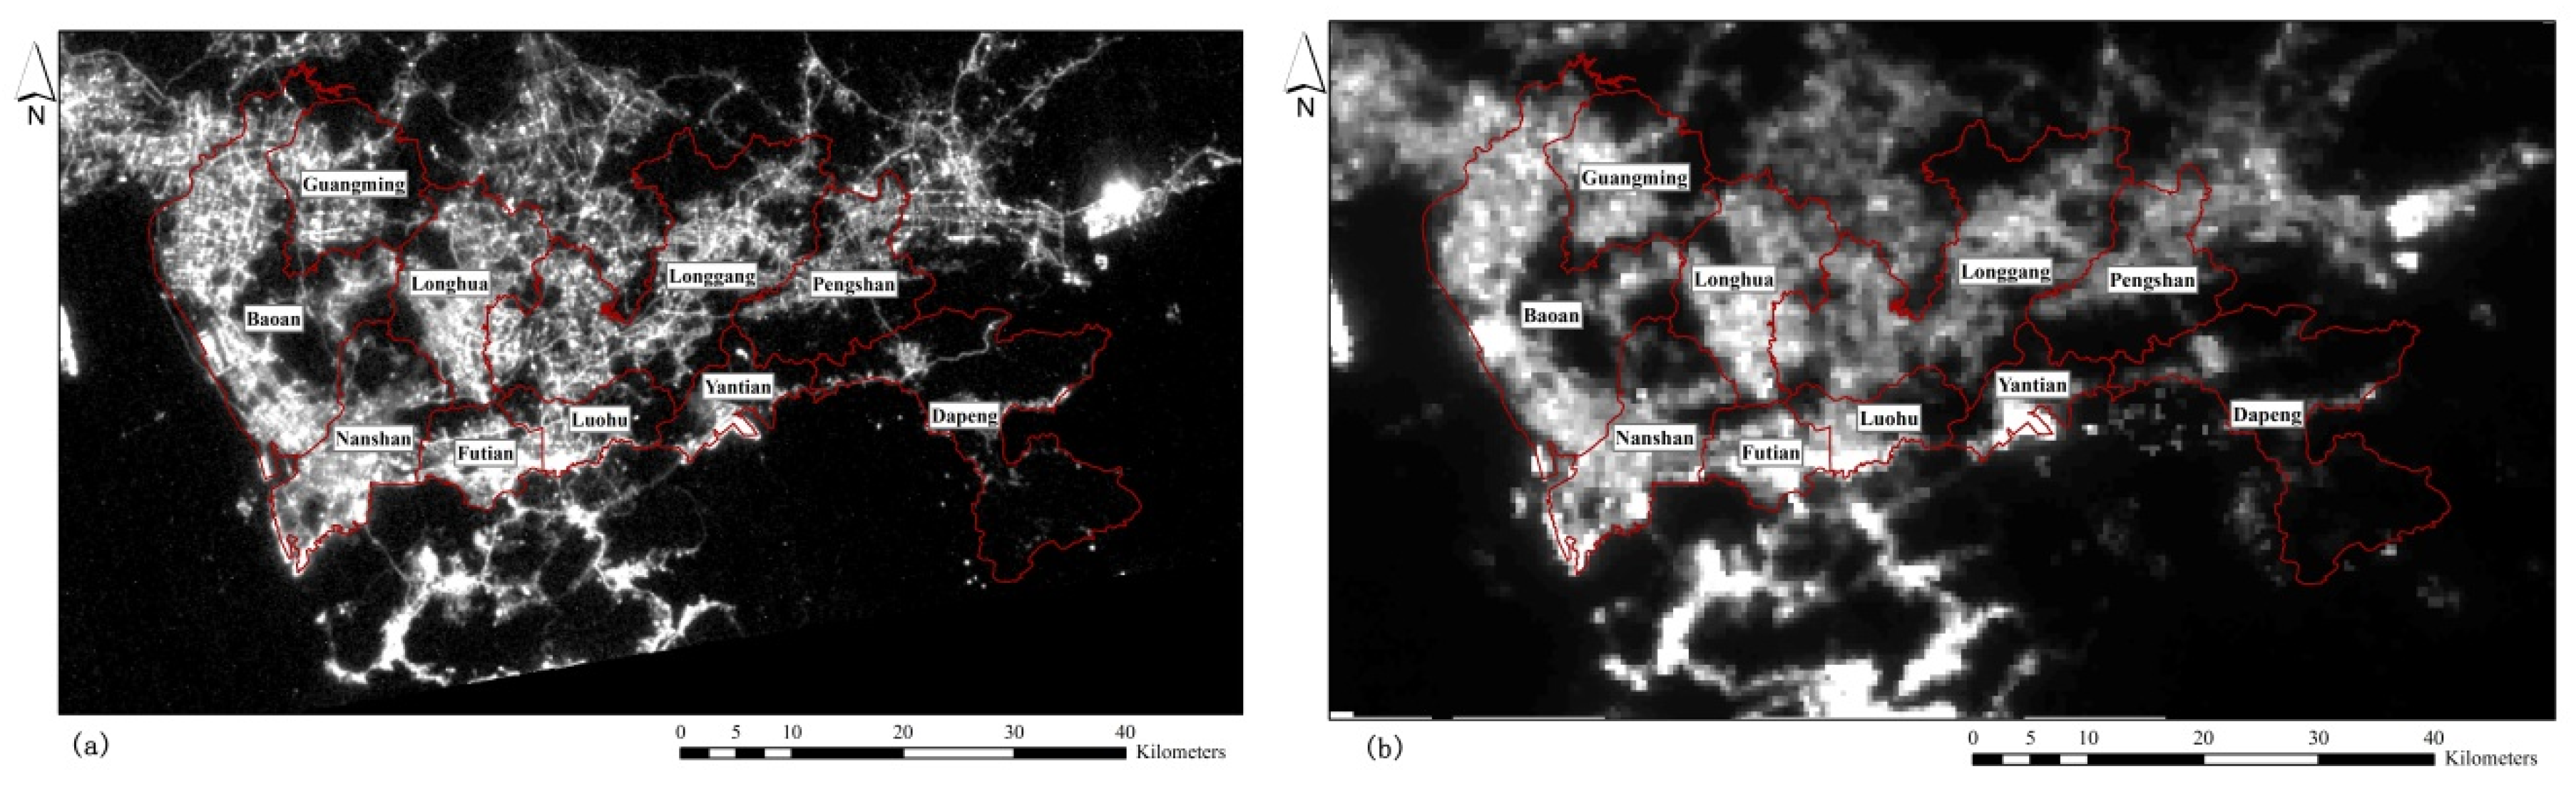
At a district scale, the LuoJia1-01 data revealed more details of the distribution of night lights in Shenzhen than the NPP-VIIRS, as can be seen in Figure 5. This made it possible to match road information when LuoJia1-01 data was spatially adjusted, allowing for a more accurate correction effect than could be have been done using the NPP-VIIRS imagery.
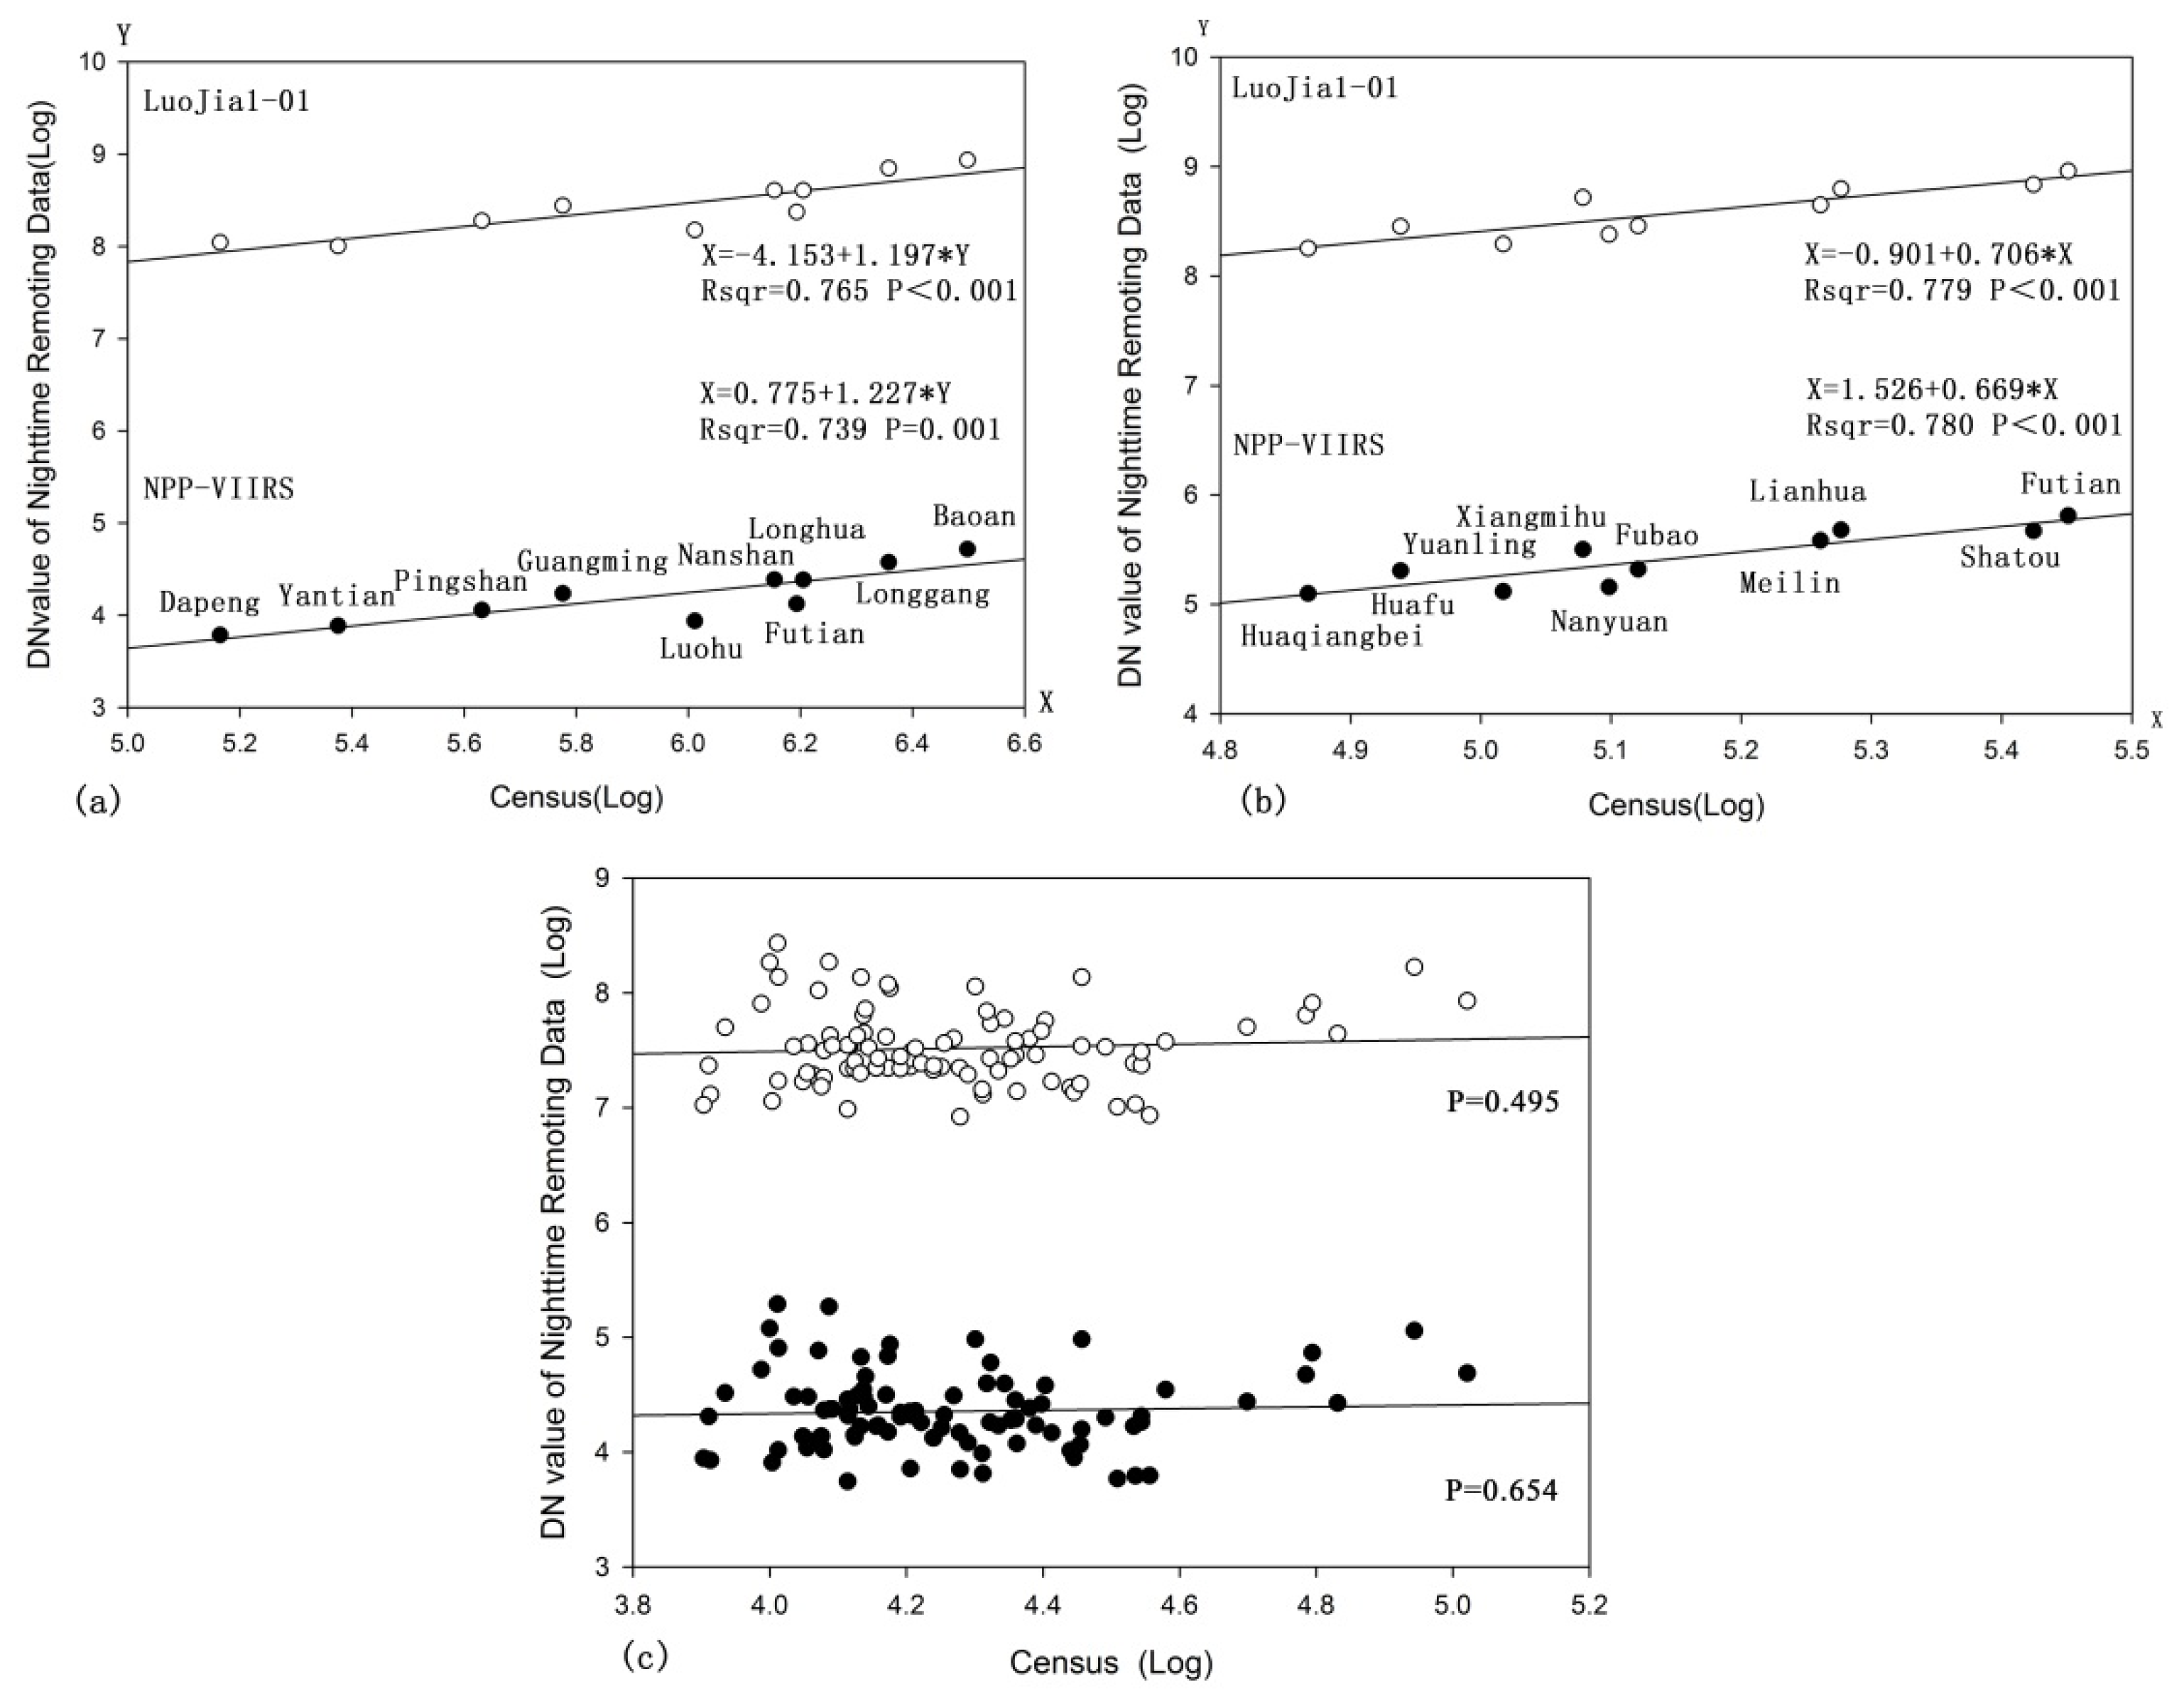
It can be seen that, at a district scale (Figure 6a), both LuoJia1-01 and NPP-VIIRS demonstrated a good fit with the official census data, R2 > 0.7. The R2 value of LuoJia1-01 (R2 = 0.765) was higher than that of NPP-VIIRS (R2 = 0.739). The fitting data and census data in other regions were better than those of Luohu and Futian. Luohu and Futian are the two central district areas in Shenzhen, and have a much more developed traffic network. Light intensity is therefore much higher than in other districts, which has led to a high population fit in these two districts.
At a sub-district scale (Figure 6b), both the LuoJia1-01 and the NPP-VIIRS demonstrated a good fit with the official census data, R2 > 0.75. The Xiangmihu sub-district is a famous low-density residential area within Futian District. The traffic network density is low, and the afforestation coverage is high. Due to the absorption of light by plants [31], the light intensity is low, which has led to a low population fit in the Xiangmihu sub-district. At the same time, Nanyuan has more than 20 large-scale residential areas such as Binhe, Dongyuan, Nanyuan, Jiulong new village, and so on. As Nanyuan is Shenzhen’s old commercial area, its traffic network and infrastructure are dense and its business is developed, which has resulted in high light intensity. The high intensity [13] has led to a high population fit for the Nanyuan sub-district.
At a community scale (Figure 6c), night-time light data and census data exhibited a poor fit. The p-value between DN value and the census data reached 0.495 for the LuoJia-01, and 0.654 for NPP-VIIRS.
At a court scale, the relationship between night-time light data and populations of different land types was explored. Next, the relationship between night-time light data and populations in various residential areas was explored on a finer scale considering the auxiliary data (Figure 7).
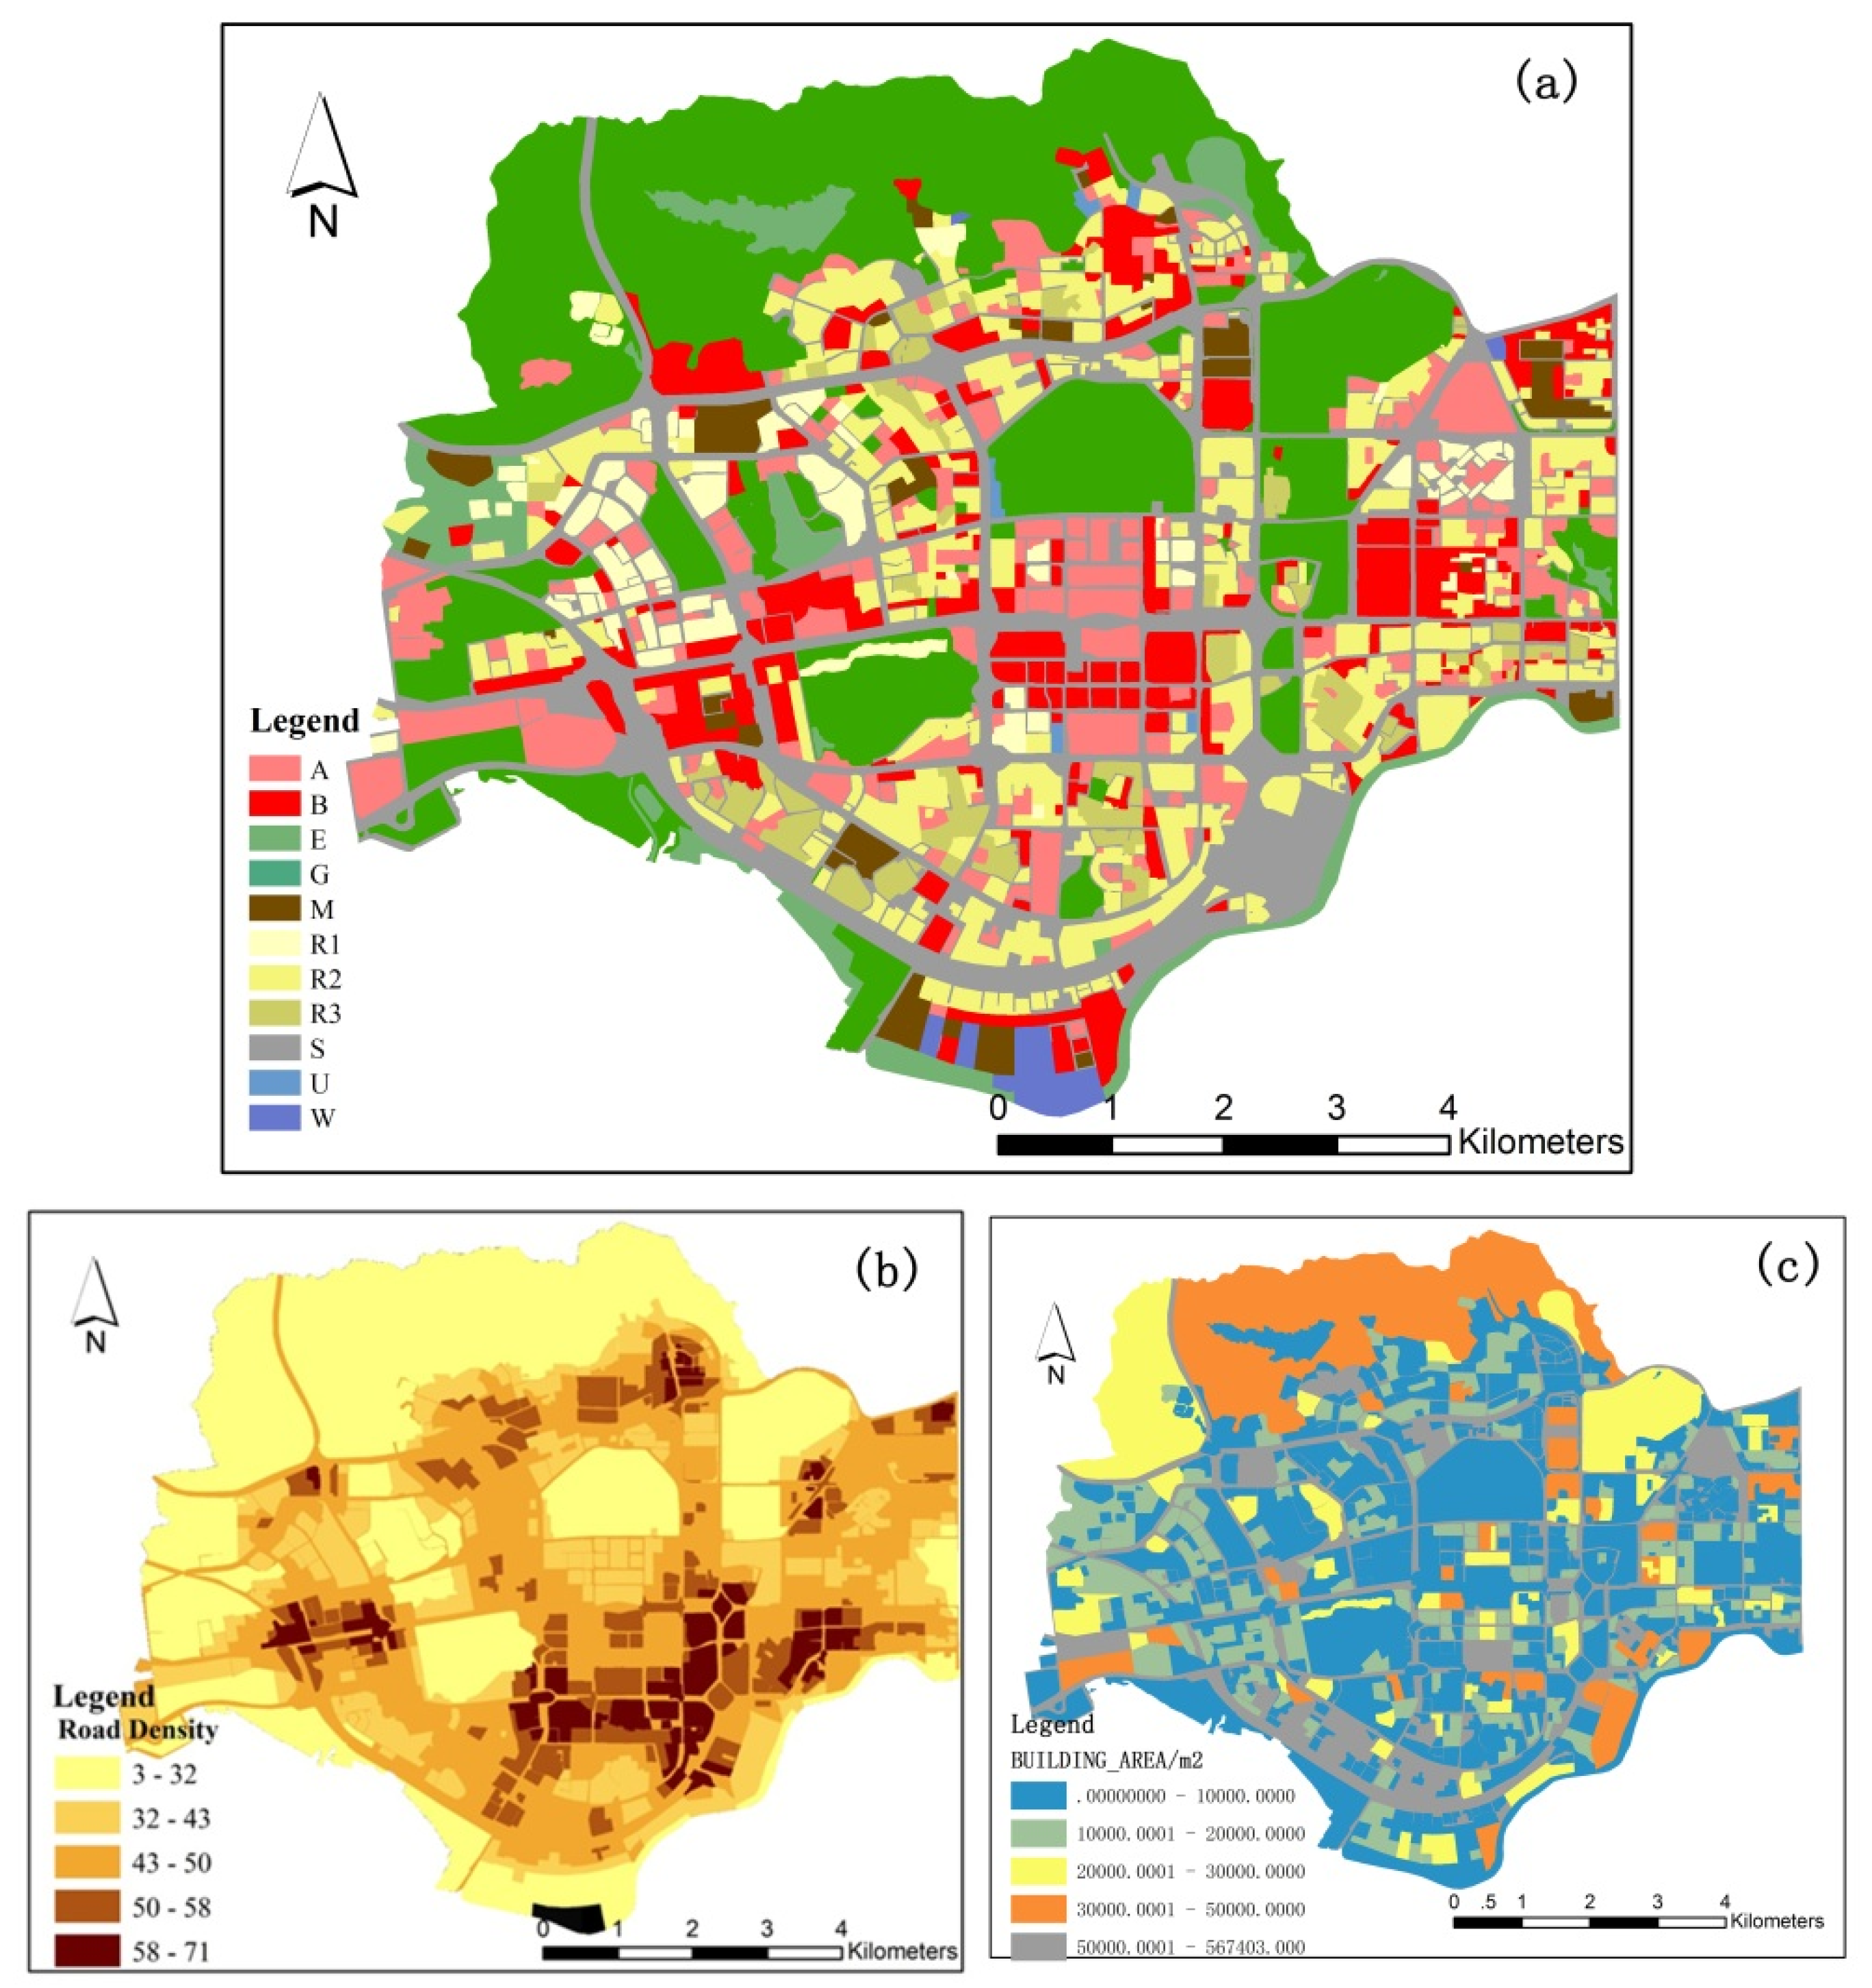
First, the community grid data of Futian District and Baidu maps were used to refine the official community grid data to a court scale, with a minimum area of 0.1 hectare. After using auxiliary information such as road density and total building area to further mine the information that can be explained by night-time light data (Figure 7b,c), we found that the road density and total building area correlated strongly with the night-time light DN value, but not with the residential population.
According to the urban land use map in Futian District (Figure 7a), the population living in R1, R2 and R3 accounted for 89.51% of the total population, of which R1 accounted for 5.43%, R2 accounted for 44.19% and R3 accounted for 39.89%. The calculation showed that the population living in R2 and R3 accounted for 84.08% of the population living in Futian District. There was a correlation between R2 and R3, and the DN value of the night-time light data could essentially represent the relationship between night-time light data and population at a court scale.
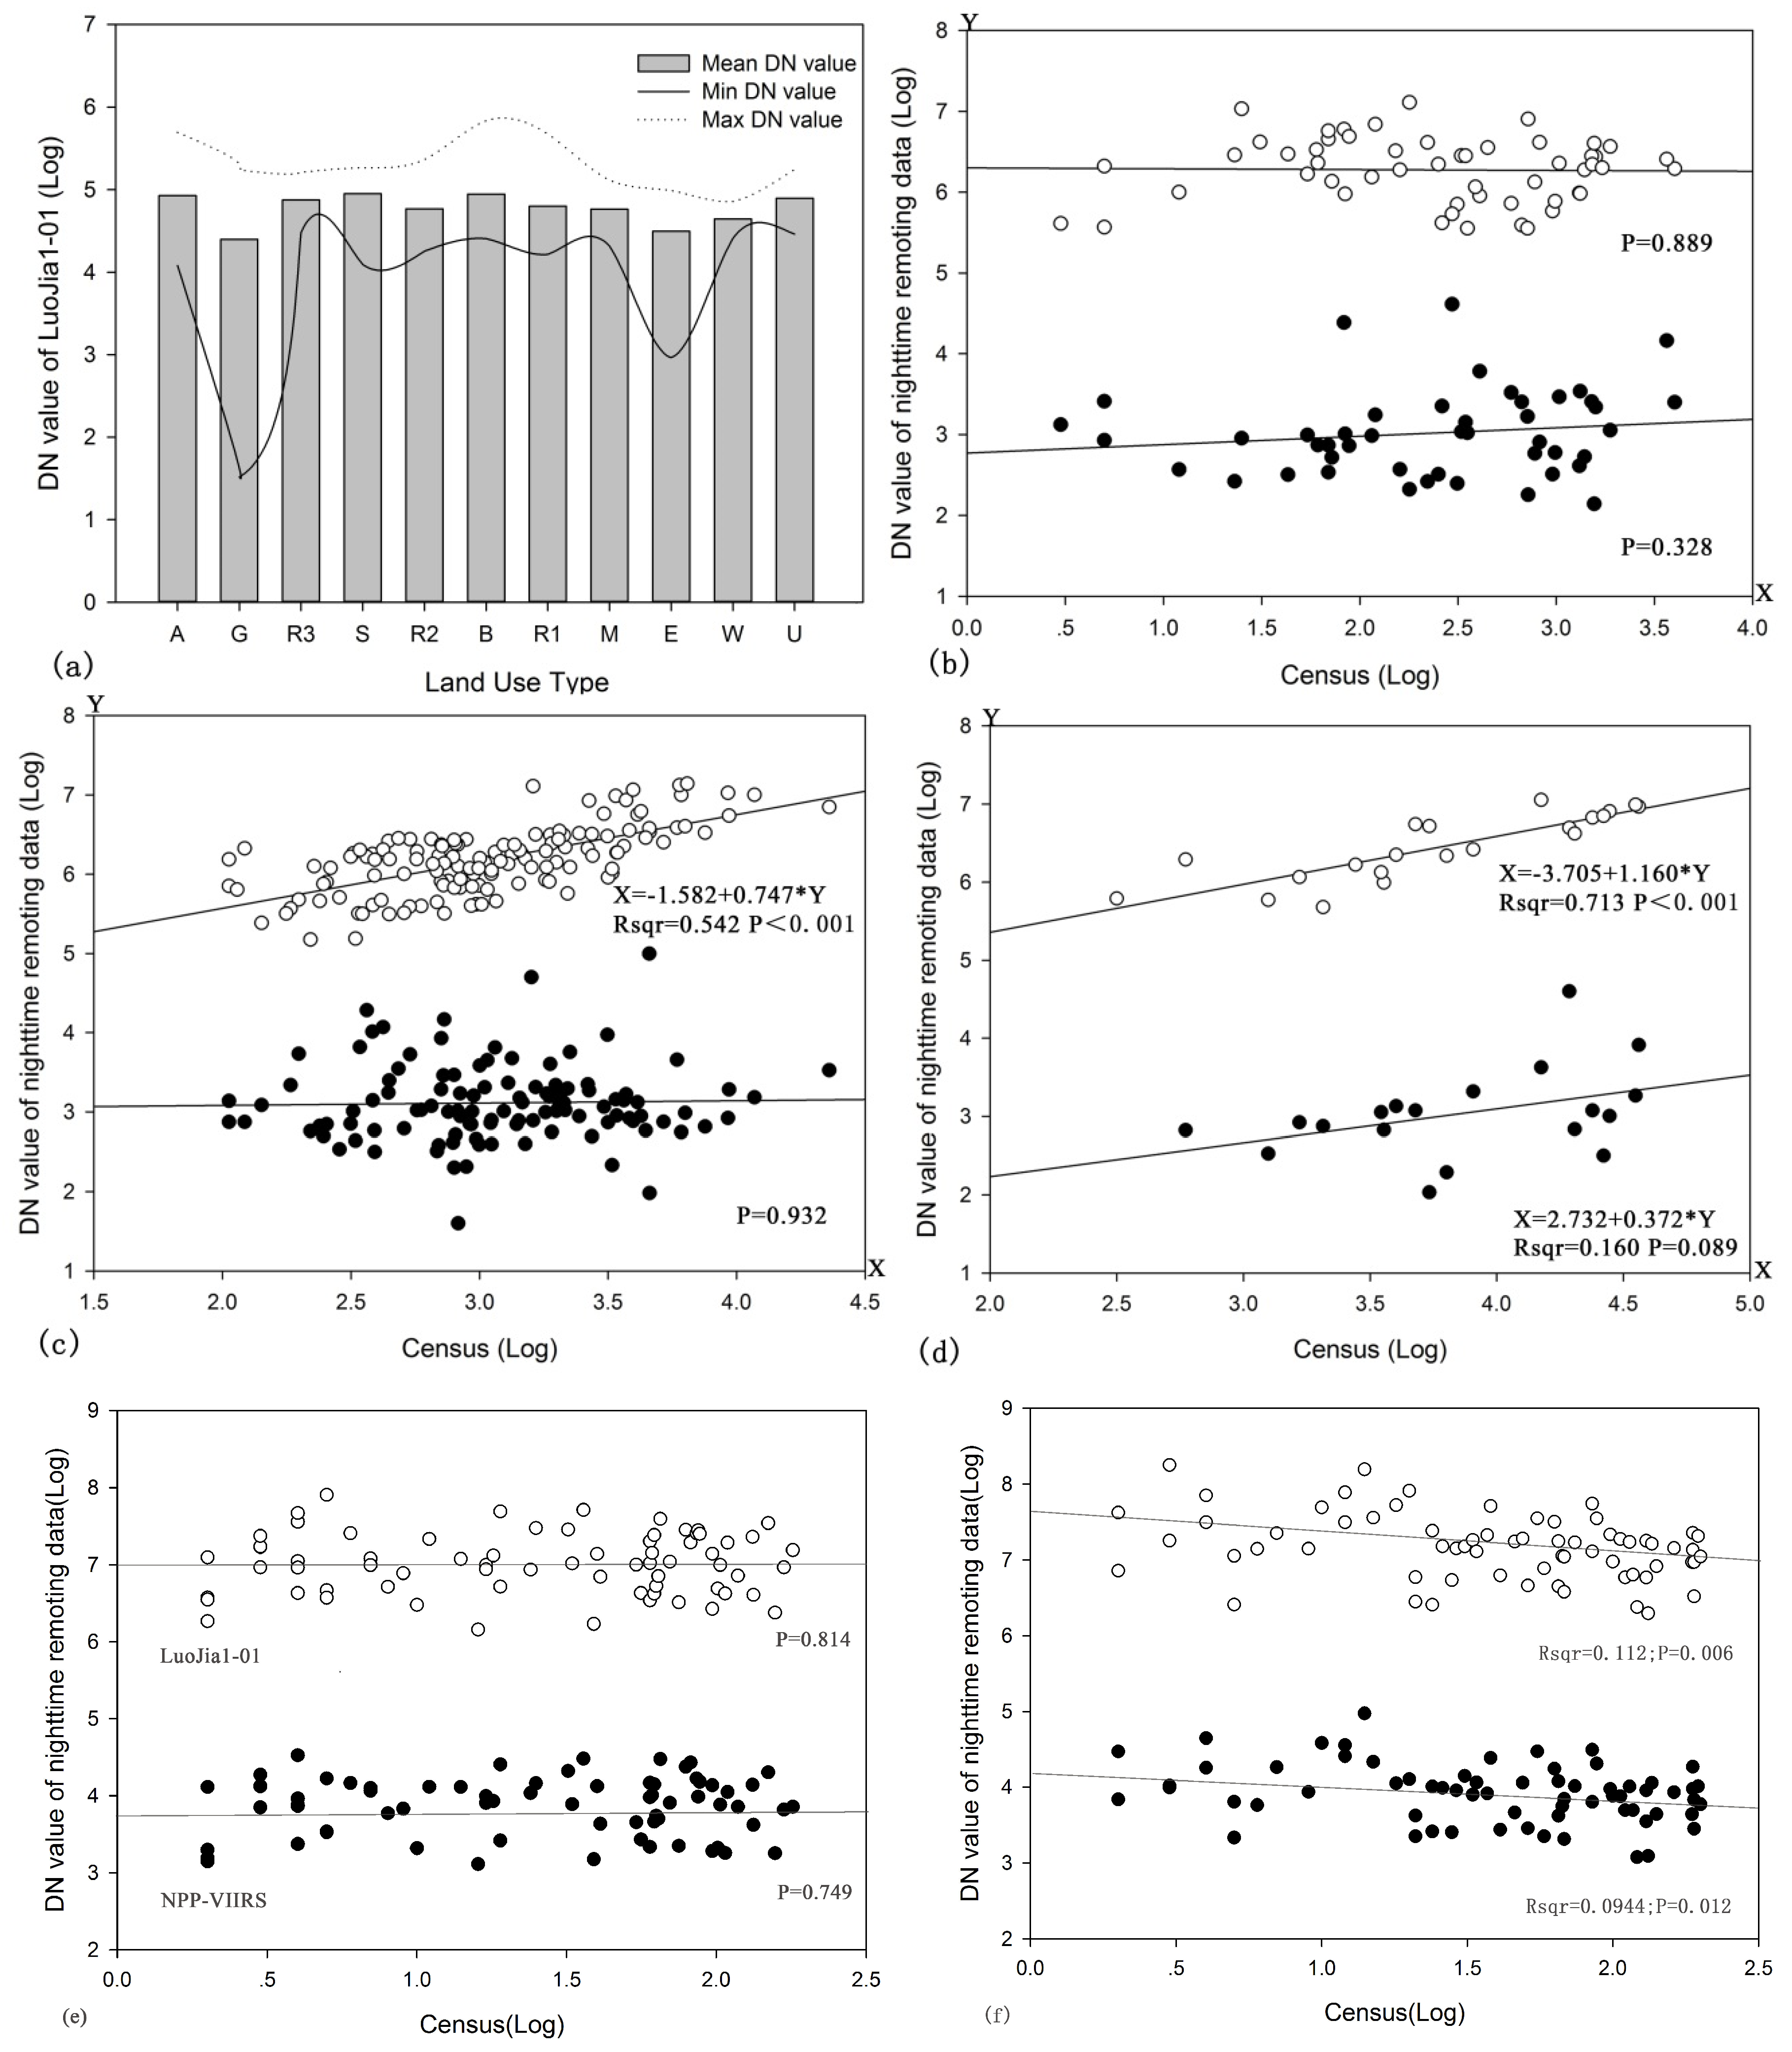
Figure 8 shows that, for R1, the night-time light data and the census data had a poor fit. The p-values of NPP-VIIRS and LuoJia1-01 were 0.328 and 0.889, respectively. For R2, the DN value of LuoJia1-01 and the census data were positively related, with an R2 value of 0.542. The DN value of NPP-VIIRS had a poor fit with the census data, and the p-value reached 0.932. For R3, the LuoJia1-01 DN value and the census data were positively correlated, with the R2 value reaching 0.713, while the DN value of NPP-VIIRS showed a poor fit with the census data, having a p-value of only 0.089.
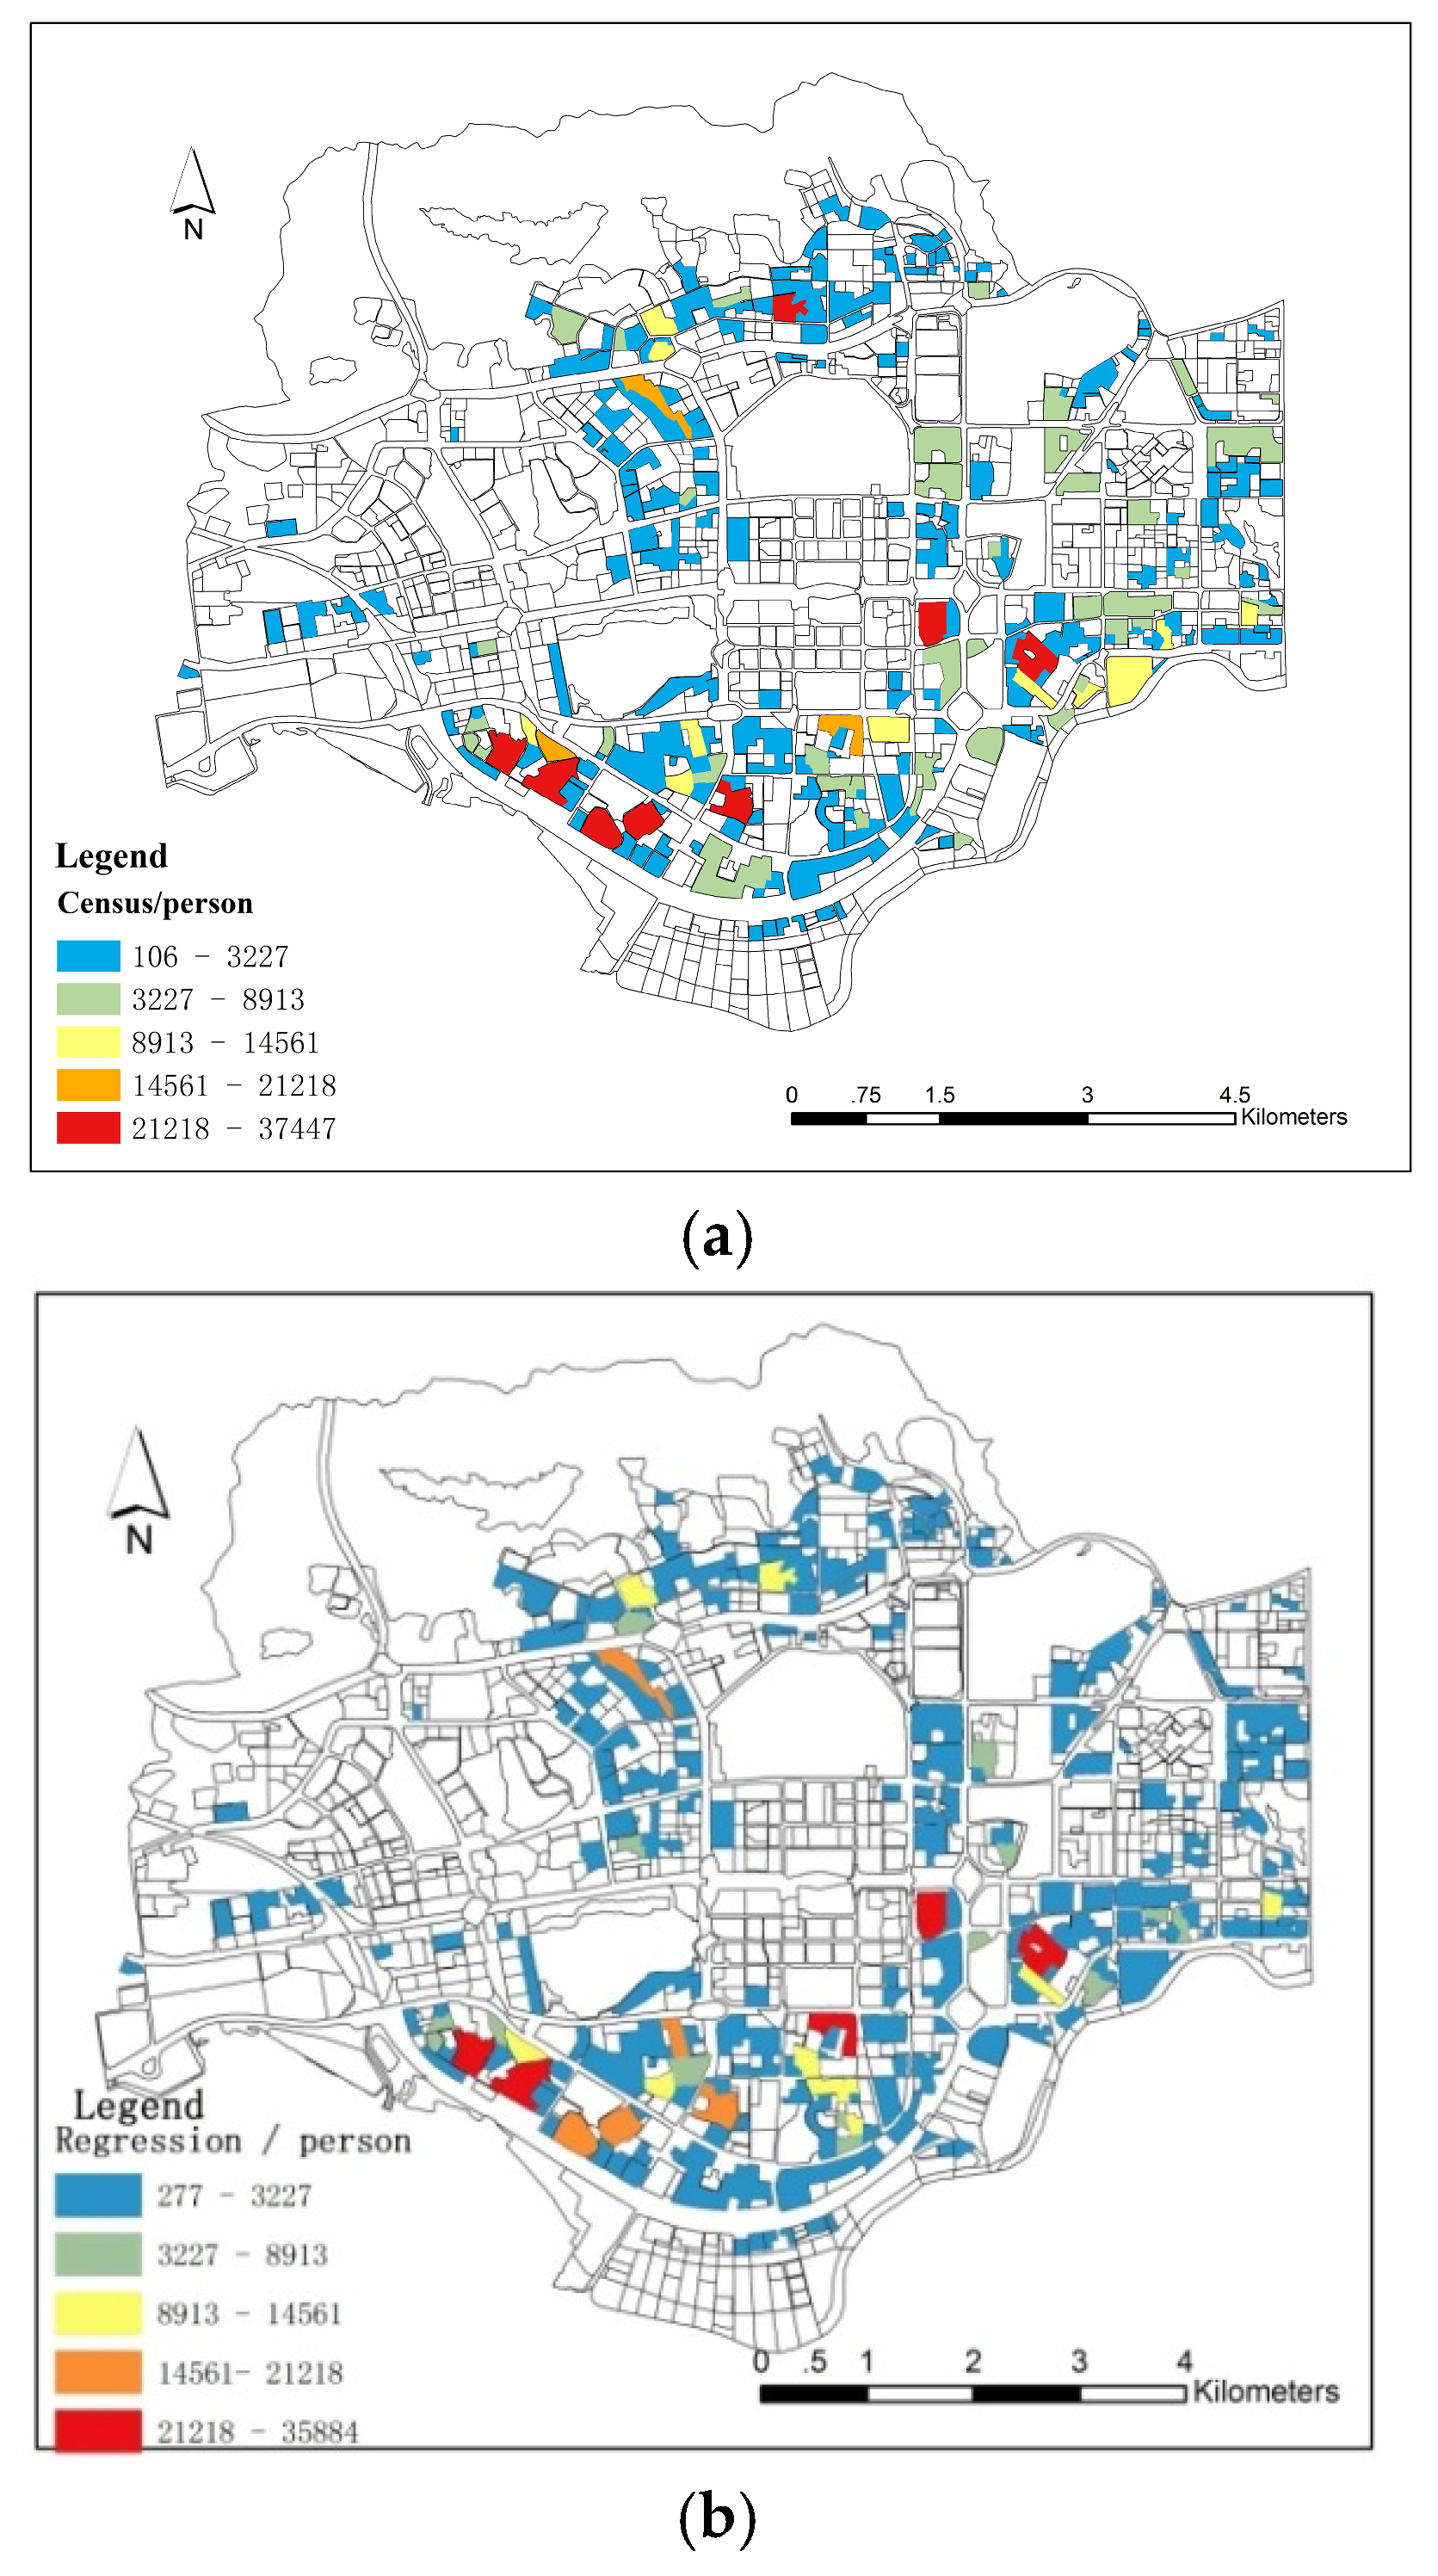
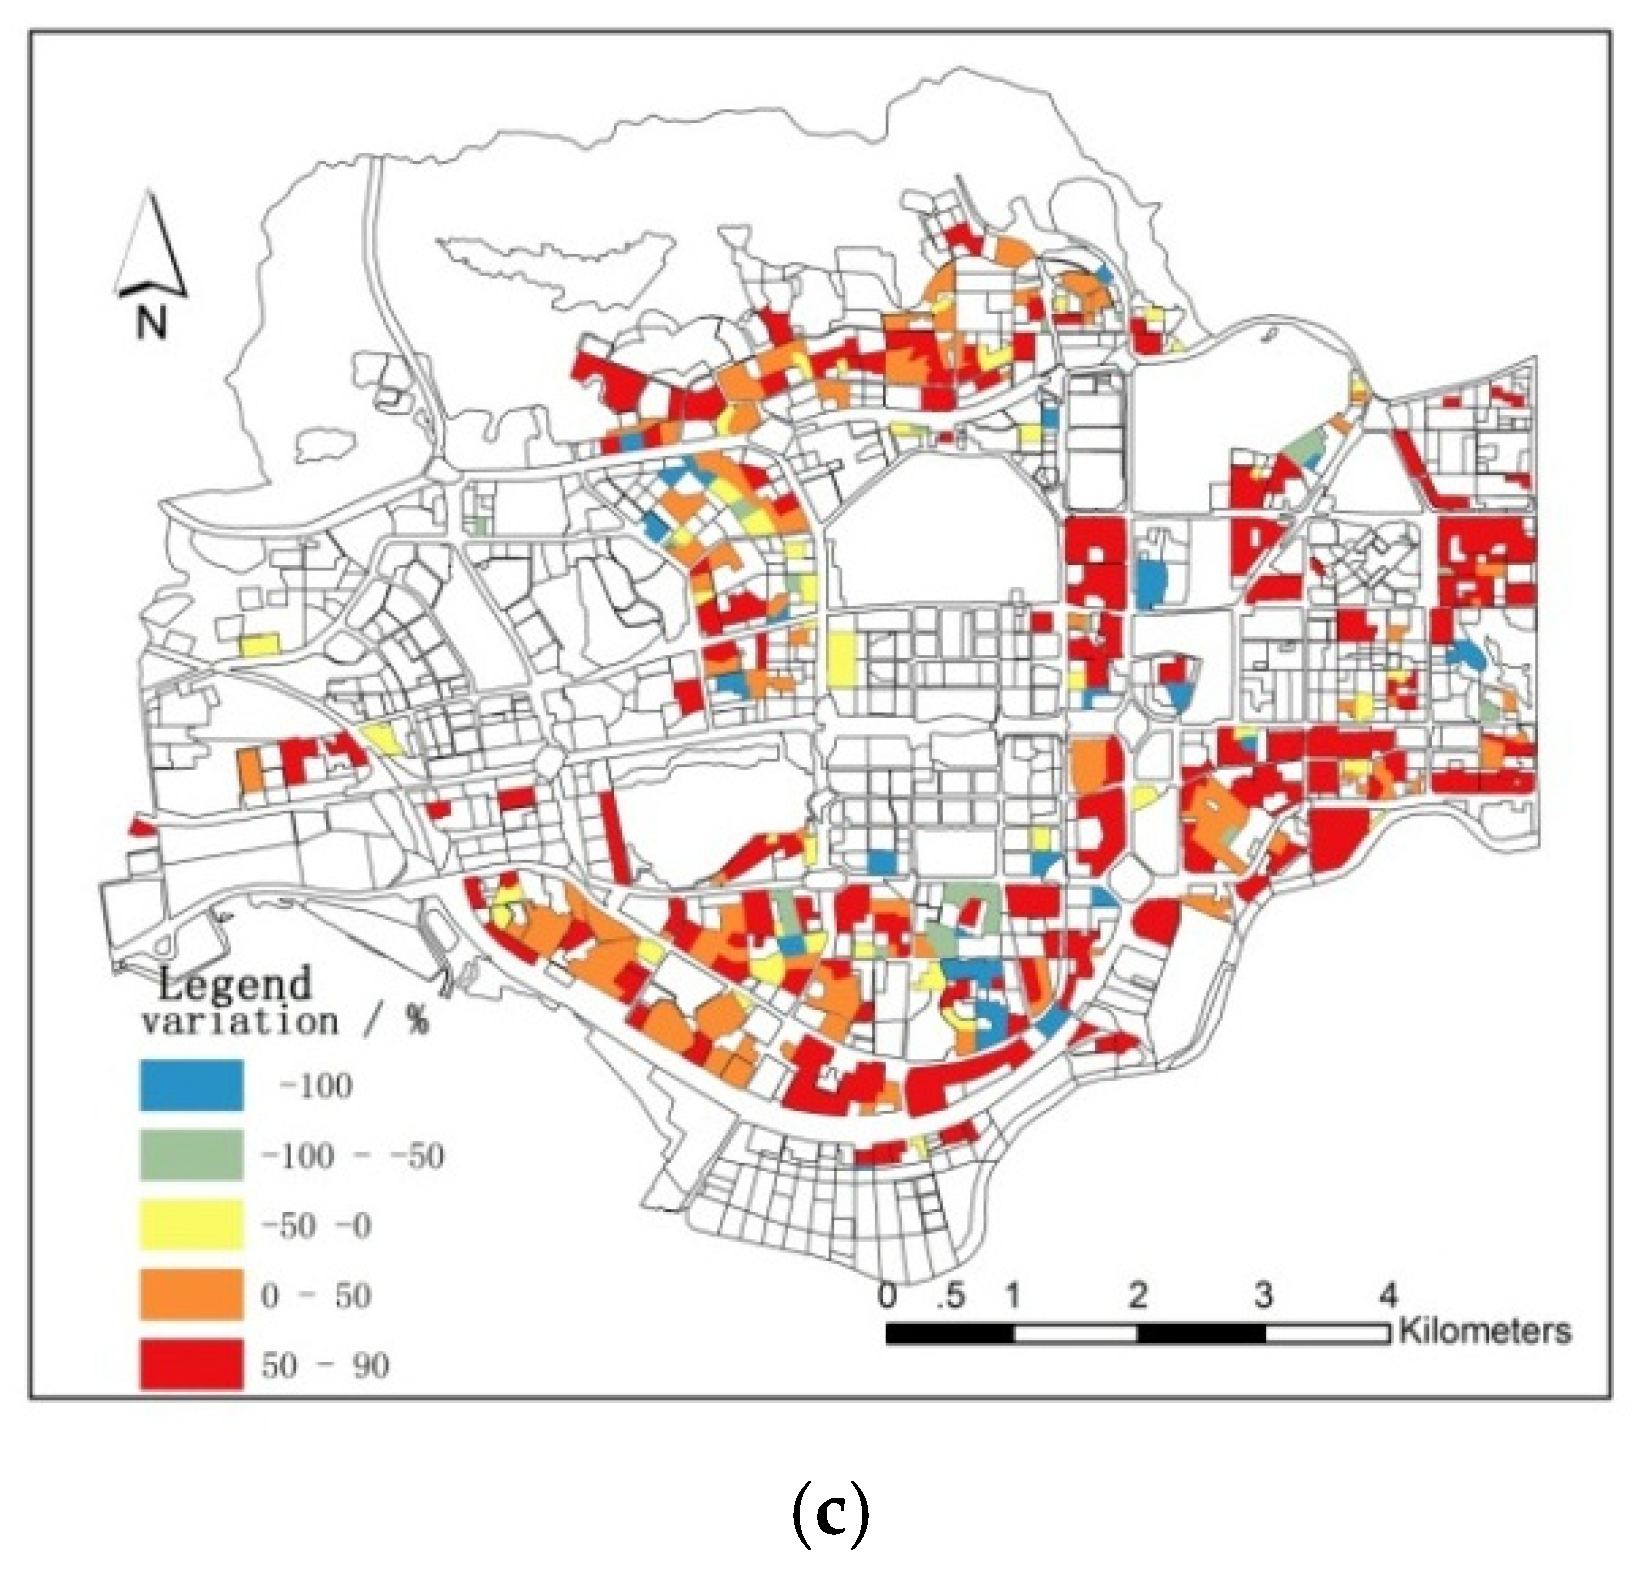
Using the equations in Table 2, the populations of R2 and R3 in Futian District were simulated separately (Figure 9). The deviations of the simulated populations in R3 were generally 0–50%, which is acceptable. However, the deviations from the simulated population of R2 were significant. This may have been caused by the large deviations in building area across various R2 parcels.
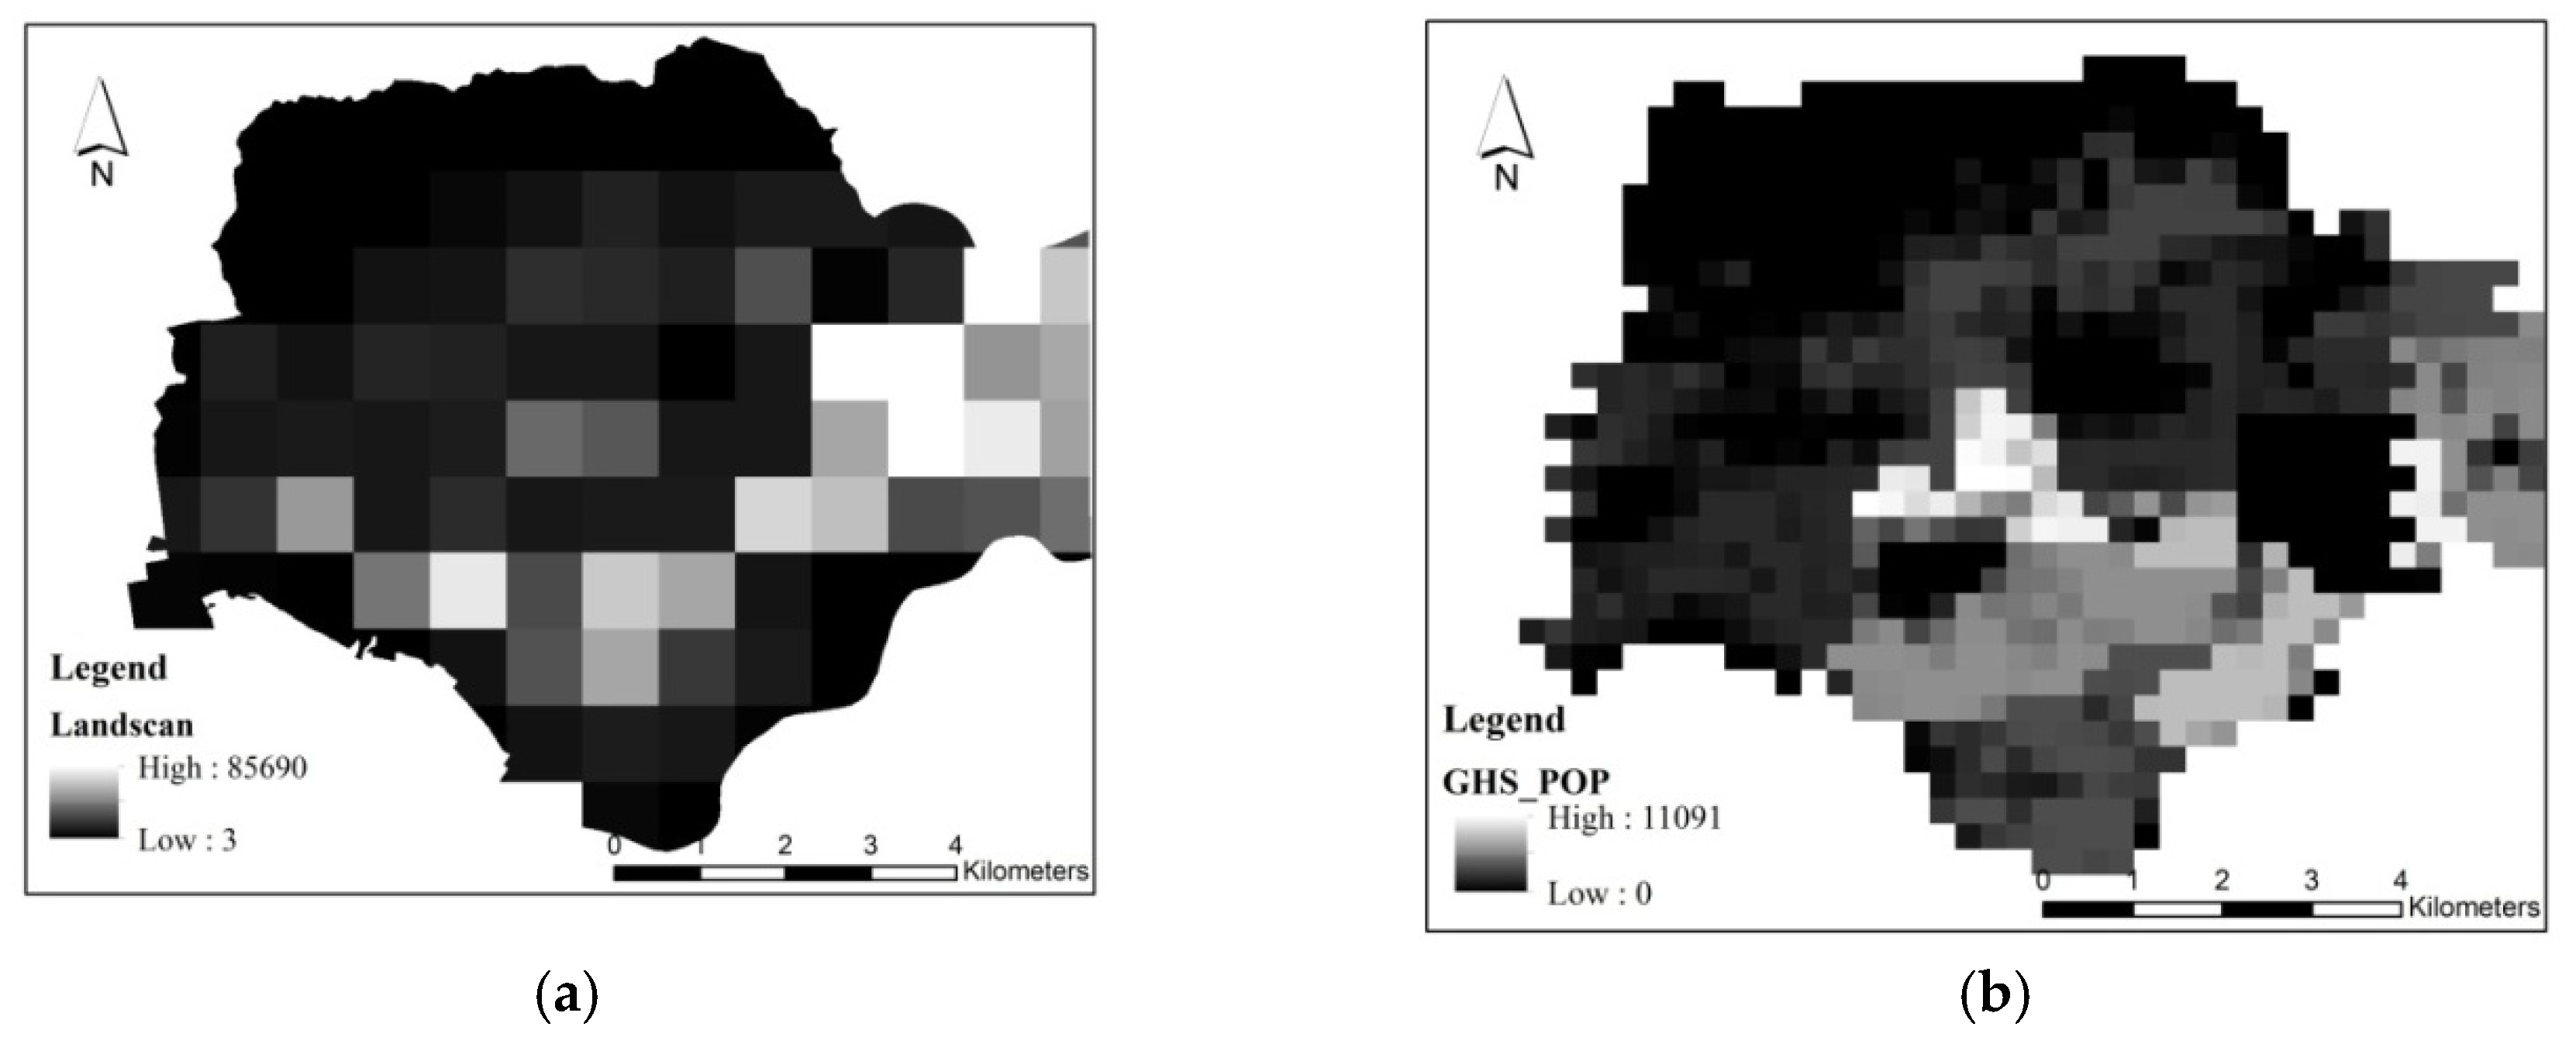
Following the population distribution data of Landscan [18] (Figure 10), we found that the area with the largest population was distributed across the Huaqiang and Yuanling sub-districts. This is quite different from the actual population distribution data. In fact, the Huaqiang sub-district has the lowest population in Futian District. Therefore, this data did not correctly reflect the population distribution in Futian District on the sub-district level at a finer scale. The GHS population data [32] could more accurately reflect the population distribution at sub-district scales than Landscan. However, at the court scale, it could not distinguish the population distribution differences of each court unit, as it configured too many people in commercial and administrative areas. In fact, the total population of all types, other than the type of residential area, only accounted for about 10% of the total population of Futian District.
4. Discussion
In recent years, research on the spatial distribution of small-scale populations has led to some important new insights, but it is still difficult to obtain reliable and timely information on small-scale population distributions. For example, Briggs and other researchers eventually obtained a population distribution map with an accuracy of 1 km via DMSP-OLS with a spatial resolution of 1 km, land use data and population data of land parcels. This study proposes to improve the accuracy of land use and night-time light data for more accurate results [28]. This study used the 130-m resolution LuoJia1-01 data and fine urban land use data to simulate small-scale population distribution at four scales: district, sub-district, community and court. At the district and sub-district scales, a regression of the night-time light data and population showed a significant correlation. The R2 values of the LuoJia1-01 simulation at the district and sub-district scales were 0.765 and 0.779, respectively (p < 0.001). Meanwhile the R2 values of the NPP-VIIRS simulation were 0.739 and 0.780, respectively (p < 0.001). This is consistent with other studies [26]. Few studies have examined the relationship between DN values and census data for night-time light data at community and finer scales. In fact, at the community scale, the fit between the DN value of night-time light data and census data was very poor. The simulated p-values of LuoJia1-01 and NPP-VIIRS were 0.495 and 0.654, respectively. This may be related to the fact that various types of urban land use were not effectively distinguished at this scale. Within the same sub-district, the main functions of each community are different, and the community can be divided into economic, cultural and touristic communities [33]. The intensity of artificial light sources in different functional types varies greatly. The DN values of different functional areas in Futian District were road land > commercial area > industrial area > residential area (Figure 8a), which is very different from the residential population in the various functional communities [27,34]. At the court scale, the higher-resolution night-time light data, LuoJia1-01, correlated clearly with the census data in R2 and R3, which comprise 84.08% of the population in Futian District, with R2 values equaling 0.542 and 0.713, respectively (p < 0.001). The relationship between night-time light data and the populations of different land use types was first analyzed, then the relationship between night-time light data and the populations of different residential areas were analyzed. For NPP-VIIRS, the p-values of R2 and R3 were 0.932 and 0.089, respectively, which indicates that the simulation exercise was unsatisfactory. Remote sensing data with coarser resolution did not meet the requirements either. The area of R2 parcels varied greatly, and the areas of some R2 parcels were smaller than those of the NPP-VIIRS pixels. This resulted in the NPP-VIIRS not effectively reflecting information on the populations of different R2 parcels. Similar results were achieved when using coarser remote sensing data. The pixels of LuoJia1-01 are much smaller, and better reflect the information of different groups in residential areas. NPP-VIIRS was more effective in reflecting the population of R3 (R2 = 0.160, p = 0.089) than that of R2 (p = 0.932). This is because the areas in R3 parcels are often larger than those in R2, as people in urban villages are likely to be more densely concentrated. In the marginal areas, however, there were still large pixels that did not allow for distinguishing between residential types, and variations in brightness between different residential types were not detected. Compared to NPP-VIIRS, LuoJia1-01 reduces the pixel area from 54.76 to 1.69 hectares. Thus, the correlation analysis of urban population distribution increased from an uncorrelated to a correlated level. This increases the potential for using night-time light data to analyze the distribution of the residential populations.
When studying the distribution of small-scale populations, a data validation problem normally appears. Large-scale population distribution data do not accurately demonstrate the distribution of small-scale populations, and its verification results of these data are not convincing. Some scholars subdivide settlements into urban, suburban and rural, and do not distinguish between different residential area types in urban areas [28]. Other scholars classify population density according to the intensity of development. However, the study results of small-scale populations viewed through the distribution of night-time lights has proved inadequate [35]. This study classified small-scale populations into three residential area types (R1, R2 and R3), as this has proven to be a good method for solving this inadequacy. The high-resolution population distribution map currently studied reached 100 m by area-weighting [36] and the use of a Dasymetric mapping model [28,37] and a population decomposition method [29]. Verification data at that scale is too large, and unclassified residential populations and unsuitable classification methods may lead to small-scale population distribution data problems. A lot of research thus far has focused solely on image acquisition time within remote sensing of population location data, thereby lacking consideration of residential populations. In such investigations, a region’s information is not adequately addressed, and the population location data is inconsistent with the population information in the census, which may lead to errors in policy making for infrastructure development if assumptions are based on it. This study counted the number of people living in each residential parcel at a court level using Zonal statistics in ArcGIS and the residential address data of the residential area as surveyed by the Shenzhen Municipal Government. The data was used as the verification data to analyze the accuracy of the regression relationship between night-time light data and the residential populations.
In summary, the use of higher-resolution night-time light data reduced the minimum unit area, which correlates significantly with population size. In the presence of auxiliary data, high-resolution LuoJia1-01 night-time light data in Futian District also correlated with the statistical population data of R2 and R3, which account for 84.08% of the residential population in the area. Thus, the LuoJia1-01 data effectively reflected the distribution of the population at a court scale, which low-resolution night-time light data and other internationally used global population data have not achieved. The data at a court scale can provide the government with reliable information for refined decision making regarding urban resource allocation, and provide a supplementary basis for the study of population flows.
However, as the images used in the paper do not discriminate between stationary and moving sources, Light-at-Night (LAN) captured by satellites reflected not only residential populations, but also visitors of commercial areas and (most importantly) the motor traffic of both residents and nonresidents. The extent to which interferences complicate the issue depends on the time of night when the satellite overpasses the area, and on the filtering of unstable lights. The thoroughfare traffic, which generates a lot of light but is not filtered out in satellite images, as well as the non-resident population from other areas that is present in commercial parts of the residential areas under study after dusk, are likely to lead to biased estimates of residential populations. Furthermore, due to errors in some residential address data surveyed by the Shenzhen Municipal Government, the accuracy of the results may be underestimated. The acquisition of the urban land use classification map used in this paper was very time consuming. Based on the combination of court boundaries and plot identification, a high-accuracy urban land use map can be quickly obtained, which is helpful for the promotion of this method. In addition, improving the resolution of night-time remote sensing data will further increase its potential in accurately surveying population sizes and locations.
Author Contributions
Conceptualization, F.L. and N.G.; methodology, N.G.; software, N.G.; validation, N.G. and F.L.; formal analysis, N.G. and D.v.B.; investigation, N.G.; resources, N.G.; data curation, N.G.; writing—original draft preparation, N.G.; writing—review and editing, F.L., M.D.J. and D.v.B.; visualization, N.G.; supervision, H.Z. and F.L.; project administration, F.L.; funding acquisition, F.L.
Funding
This research was funded by International S&T Cooperation Projects of Inter-government: Technologies and demonstration of integrated energy system & carbon emission research on city level grant number 2017YFE0101700 and Research on Urban Livable Space Smart Model & Individual Decision Support System, grant number JSGG20170413173425899.
Acknowledgments
We thank the anonymous reviewers for their valuable comments. We further express our gratitude to the Wuhan University, NOAA and Oak Ridge National Laboratory for providing the supporting data from LuoJia1-01, NPP-VIIRS and LandScan Global, respectively. We would also like to thank the European Commission EU Science Hub for the GHS Population Grid data.
Conflicts of Interest
The authors declare no conflict of interest. The founding sponsors had no role in the design of the study; in the collection, analyses, or interpretation of data; in the writing of the manuscript, and in the decision to publish the results.
References
- Sutton, P. Modeling population density with night-time satellite imagery and GIS. Comput. Environ. Urban. Syst. 1997, 21, 227–244. [Google Scholar] [CrossRef]
- NDRC. Key Tasks of New-Type Urbanization Construction in China in 2019. NDRC(2019)0617. 2019; (In Chinese). Available online: http://www.ndrc.gov.cn (accessed on 31 March 2019).
- Statistics Bureau of Guangdong Province. Analysis of Population Development in Guangdong in 2018. 2018; (In Chinese). Available online: http://www.stats.gd.gov.cn (accessed on 2 April 2019).
- National Bureau of Statistics. Statistical Bulletin of National Economic and Social Development in 2018. 2018; Type: Government Report; (In Chinese). Available online: http://www.stats.gov.cn/ (accessed on 28 February 2019).
- United Nations. Human Development Report 2013: The Rise of the South Human Progress in a Diverse World; United Nations: New York, NY, USA, 2013; ISBN 978-92-1-126340-4. [Google Scholar]
- National Bureau of Statics of China. Bulletin of the main data of the sixth national census in 2010 (No. 2). The Central People’s Government of the People’s Republic of China: Beijing, China; (In Chinese). Available online: http://www.gov.cn/ (accessed on 28 February 2019).
- Population Census Office under the State Council. Tabulation on the 2000 Population Census of People’s Republic of China; China Statistics Press: Beijing, China, 2002; ISBN 978-75-0-373872-2. (In Chinese) [Google Scholar]
- United Nations. The 2014 Revision World Urbanization Prospects: Population Division of the Department of Economic and Social Affairs of the United Nations Secretariat; United Nations: New York, NY, USA, 2014; ISBN 978-92-1-151517-6. [Google Scholar]
- National Bureau of Statics of China. Tabulation on the 2010 Population Census of People’s Republic of China; China Statistics Press: Beijing, China, 2012; ISBN 978-75-0-376507-0. (In Chinese) [Google Scholar]
- Peytchev, A.; Carley-Baxter, L.R.; Black, M.C. Coverage Bias in Variances, Associations, and Total Error from Exclusion of the Cell Phone-Only Population in the United States. Soc. Sci. Comput. Rev. 2010, 28, 287–302. [Google Scholar] [CrossRef]
- Shen, J.; Liu, X.; Chen, M. Discovering spatial and temporal patterns from taxi-based Floating Car Data: A case study from Nanjing. GIScience Remote Sens. 2017, 54, 617–638. [Google Scholar] [CrossRef]
- Biljecki, F.; Ohori, K.A.; LeDoux, H.; Peters, R.; Stoter, J. Population Estimation Using a 3D City Model: A Multi-Scale Country-Wide Study in the Netherlands. PLoS ONE 2016, 11, e0156808. [Google Scholar] [CrossRef] [PubMed]
- Amaral, S.; Câmara, G.; Monteiro, A.M.V.; Quintanilha, J.A.; Elvidge, C.D. Estimating population and energy consumption in Brazilian Amazonia using DMSP night-time satellite data. Comput. Environ. Urban. Syst. 2005, 29, 179–195. [Google Scholar] [CrossRef]
- Amaral, S.; Monteiro, A.M.V.; Câmara, G.; Quintanilha, J.A. DMSP/OLS night-time light imagery for urban population estimates in the Brazilian Amazon. Int. J. Remote Sens. 2006, 27, 855–870. [Google Scholar] [CrossRef]
- Sutton, P.; Roberts, D.; Elvidge, C.; Baugh, K. Census from Heaven: An estimate of the global human population using night-time satellite imagery. Int. J. Remote Sens. 2001, 22, 3061–3076. [Google Scholar] [CrossRef]
- Sutton, P.C.; Taylor, M.J.; Elvidge, C.D. Using DMSP OLS Imagery to Characterize Urban Populations in Developed and Developing Countries. In Remote Sensing and Digital Image Processing; Springer Science and Business Media LLC: Berlin, Germany, 2010; Volume 10, pp. 329–348. [Google Scholar]
- Welch, R. Monitoring urban population and energy utilization patterns from satellite Data. Remote Sens. Environ. 1980, 9, 1–9. [Google Scholar] [CrossRef]
- Bhaduri, B.; Bright, E.; Coleman, P.; Urban, M.L. LandScan USA: A high-resolution geospatial and temporal modeling approach for population distribution and dynamics. GeoJournal 2007, 69, 103–117. [Google Scholar] [CrossRef]
- Freire, S.; MacManus, K.; Pesaresi, M.; Doxsey-Whitfield, E.; Mills, J. Development of new open and free multi-temporal global population grids at 250 m resolution. In Proceedings of the 19th AGILE Conference on Geographic Information Science (AGILE), Helsinki, Finland, 14–17 June 2016. [Google Scholar]
- Gaughan, A.E.; Stevens, F.R.; Linard, C.; Jia, P.; Tatem, A.J. High resolution population distribution maps for Southeast Asia in 2010 and 2015. PLoS ONE 2016, 8, e55882. [Google Scholar] [CrossRef]
- Batista e Silva, F.; Gallego, J.; Lavalle, C. A high-resolution population grid map for Europe. J. Maps 2013, 9, 16–28. [Google Scholar] [CrossRef]
- Archila Bustos, M.F.; Hall, O.; Andersson, M. Night-time lights and population changes in Europe 1992–2012. Ambio 2015, 44, 653–665. [Google Scholar] [CrossRef]
- Huang, Q.; Yang, Y.; Li, Y.; Gao, B. A Simulation Study on the Urban Population of China Based on Night-time Light Data Acquired from DMSP/OLS. Sustainability 2016, 8, 521. [Google Scholar]
- Li, L.; Lu, D. Mapping population density distribution at multiple scales in Zhejiang Province using Landsat Thematic Mapper and census data. Int. J. Remote Sens. 2016, 37, 4243–4260. [Google Scholar] [CrossRef]
- Pavía, J.M.; Cantarino, I. Can Dasymetric Mapping Significantly Improve Population Data Reallocation in a Dense Urban Area? Geogr. Anal. 2017, 49, 155–174. [Google Scholar] [CrossRef]
- Bai, Z.; Wang, J.; Yang, Y.; Sun, J. Characterizing spatial patterns of population distribution at township level across the 25 provinces in China. Acta Geogr. Sin. 2015, 70, 1229–1242. [Google Scholar]
- Zeng, C.; Zhou, Y.; Wang, S.; Yan, F.; Zhao, Q. Population spatialization in China based on night-time imagery and land use data. Int. J. Remote Sens. 2011, 32, 9599–9620. [Google Scholar] [CrossRef]
- Briggs, D.J.; Gulliver, J.; Fecht, D.; Vienneau, D.M. Dasymetric modelling of small-area population distribution using land cover and light emissions data. Remote Sens. Environ. 2007, 108, 451–466. [Google Scholar] [CrossRef]
- Stevens, F.R.; Gaughan, A.E.; Linard, C.; Tatem, A.J. Disaggregating Census Data for Population Mapping Using Random Forests with Remotely-Sensed and Ancillary Data. PLoS ONE 2015, 10, e0107042. [Google Scholar] [CrossRef]
- MOHURD (Ministry of Housing and Urban-Rural Development of the People’s Republic of China). Code for Classification of Urban Land Use and Planning Standards of Development Land; GB 50137-2011; China Building Industry Press: Beijing, China, 2011. (In Chinese) [Google Scholar]
- Enríquez, S.; Sand-Jensen, K. Variation in Light Absorption Properties of Mentha aquatica L. as a Function of Leaf Form: Implications for Plant Growth. Int. J. Plant. Sci. 2003, 164, 125–136. [Google Scholar] [CrossRef]
- Doxsey-Whitfield, E.; MacManus, K.; Adamo, S.B.; Pistolesi, L.; Squires, J.; Borkovska, O.; Baptista, S.R. Taking Advantage of the Improved Availability of Census Data: A First Look at the Gridded Population of the World, Version 4. Pap. Appl. Geogr. 2015, 1, 1–9. [Google Scholar] [CrossRef]
- Sanders, I.T. The Community: An. Introduction to a Social System; The Ronald Press Company: New York, NY, USA, 1966; Volume 19, p. 160. [Google Scholar]
- Li, X.; Zhou, W. Dasymetric mapping of urban population in China based on radiance corrected DMSP-OLS night-time light and land cover data. Sci. Total Environ. 2018, 643, 1248–1256. [Google Scholar] [CrossRef] [PubMed]
- Zandbergen, P.A.; Ignizio, D.A. Comparison of Dasymetric Mapping Techniques for Small-Area Population Estimates. Cartogr. Geogr. Inf. Sci. 2010, 37, 199–214. [Google Scholar] [CrossRef]
- Goodchild, M.F.; Anselin, L.; Deichmann, U. A Framework for the Areal Interpolation of Socioeconomic Data. Environ. Plan. A Econ. Space 1993, 25, 383–397. [Google Scholar] [CrossRef]
- Tapp, A.F. Areal Interpolation and Dasymetric Mapping Methods Using Local Ancillary Data Sources. Cartogr. Geogr. Inf. Sci. 2010, 37, 215–228. [Google Scholar] [CrossRef]
Figure 1.
Relationship diagram of four research scales: district, sub-district, community and court.
Figure 1.
Relationship diagram of four research scales: district, sub-district, community and court.

Figure 2.
Population fit flowchart based on night-time light data and census at four scales.

Figure 3.
Night-time light data and sample set of sub-districts in Futian District, Shenzhen. (a) LuoJia1-01 data. (b) NPP-VIIRS data.
Figure 3.
Night-time light data and sample set of sub-districts in Futian District, Shenzhen. (a) LuoJia1-01 data. (b) NPP-VIIRS data.

Figure 4.
Comparison of observations of LuoJia1-01 and NPP-VIIRS samples in Futian District, Shenzhen.
Figure 4.
Comparison of observations of LuoJia1-01 and NPP-VIIRS samples in Futian District, Shenzhen.

Figure 5.
Shenzhen night-time light data at a district scale. (a) LuoJia1-01 data, with a spatial resolution of about 130 m. (b) NPP-VIIRS data, with a spatial resolution of about 742 m.
Figure 5.
Shenzhen night-time light data at a district scale. (a) LuoJia1-01 data, with a spatial resolution of about 130 m. (b) NPP-VIIRS data, with a spatial resolution of about 742 m.

Figure 6.
Relationship between the DN values of the LuoJia1-01, NPP-VIIRS and census data of the three scales of Shenzhen: (a) district, (b) sub-district and (c) community.
Figure 6.
Relationship between the DN values of the LuoJia1-01, NPP-VIIRS and census data of the three scales of Shenzhen: (a) district, (b) sub-district and (c) community.

Figure 7.
Urban land use map and auxiliary data in Futian District, Shenzhen. (a) Current land use map. (b) Road density distribution map. (c) Building area map.
Figure 7.
Urban land use map and auxiliary data in Futian District, Shenzhen. (a) Current land use map. (b) Road density distribution map. (c) Building area map.

Figure 8.
Correlation between night-time light DN values of different residential types and census data in Futian District, Shenzhen. (a) DN values of each land use type. (b) Correlation of R1, (c) R2 and (d) R3. (e) Correlation of administration and public services (A). (f) Correlation of commercial and business facilities (B). Note: There is no census population in other land use type, so only A, B, R1, R2 and R3 regression results are shown in Figure 8.

Figure 9.
Futian District resident population simulation, excluding a type of residential area: (a) resident population (source: census), (b) simulation result and (c) simulation deviation.
Figure 9.
Futian District resident population simulation, excluding a type of residential area: (a) resident population (source: census), (b) simulation result and (c) simulation deviation.


Figure 10.
Population distribution data. (a) Landscan. (b) GHS population.


Table 1.
Parameter comparison of the Suomi National Polar-Orbiting Partnership Visible Infrared Imaging Radiometer Suite (NPP-VIIRS), and LuoJia 1-01.
Table 1.
Parameter comparison of the Suomi National Polar-Orbiting Partnership Visible Infrared Imaging Radiometer Suite (NPP-VIIRS), and LuoJia 1-01.
| Satellite | NPP-VIIRS | LuoJia1-01 |
|---|---|---|
| Operator | NASA/NOAA | Wuhan University |
| Available year | December 2011–present | June 2018–present |
| Wavelength range | 505–890 μm | 480–800 μm |
| Orbital altitude | 830 km | 645 km |
| Spatial resolution | 742 m | 130 m |
| Width | 3000 km | 260 km |
| Revisit time | 12 h | 15d |
| Pixel saturated | No saturated | No saturated |
| On-board calibration | Yes | Yes |
Notes: Census data regarding the Shenzhen districts were taken from the 2017 Shenzhen Statistical Yearbook. Census data of Futian sub-districts were taken from the 2017 Futian District Statistical Yearbook. The census data of communities in Futian District were downloaded from the Futian Government Online at http://www.szft.gov.cn/. The census data of courts in Futian District were taken from the Shenzhen Municipal Government.
Table 2.
Equation between census data and LuoJia1-01 DN-value data at various administrative levels in Shenzhen.
Table 2.
Equation between census data and LuoJia1-01 DN-value data at various administrative levels in Shenzhen.
| Level | Land Use Type | Equation | R2 | P |
|---|---|---|---|---|
| District | X = −4.153 + 1.197 × Y | 0.765 | <0.001 | |
| Sub-district | X = −0.901 + 0.706 × Y | 0.779 | <0.001 | |
| Community | 0.495 | |||
| Court | R1 | 0.889 | ||
| R2 | X = −1.582 + 0.747 × Y | 0.542 | <0.001 | |
| R3 | X = −3.705 + 1.160 × Y | 0.713 | <0.001 |
Note: Y is the log-transformed (Log10) value of the night-time light data DN value, and X is the log- transformed (Log10) value of the census data value.
© 2019 by the authors. Licensee MDPI, Basel, Switzerland. This article is an open access article distributed under the terms and conditions of the Creative Commons Attribution (CC BY) license (http://creativecommons.org/licenses/by/4.0/).
Share and Cite
MDPI and ACS Style
Gao, N.; Li, F.; Zeng, H.; van Bilsen, D.; De Jong, M. Can More Accurate Night-Time Remote Sensing Data Simulate a More Detailed Population Distribution? Sustainability 2019, 11, 4488. https://0-doi-org.brum.beds.ac.uk/10.3390/su11164488
AMA Style
Gao N, Li F, Zeng H, van Bilsen D, De Jong M. Can More Accurate Night-Time Remote Sensing Data Simulate a More Detailed Population Distribution? Sustainability. 2019; 11(16):4488. https://0-doi-org.brum.beds.ac.uk/10.3390/su11164488
Chicago/Turabian StyleGao, Nannan, Fen Li, Hui Zeng, Daniël van Bilsen, and Martin De Jong. 2019. "Can More Accurate Night-Time Remote Sensing Data Simulate a More Detailed Population Distribution?" Sustainability 11, no. 16: 4488. https://0-doi-org.brum.beds.ac.uk/10.3390/su11164488
Note that from the first issue of 2016, this journal uses article numbers instead of page numbers. See further details here.