An Optimum Irrigation Schedule with Aeration for Greenhouse Tomato Cultivations Based on Entropy Evaluation Method

1
College of Engineering, Huazhong Agricultural University, Wuhan, Hubei 430070, China
2
College of Water Resources and Architectural Engineering, Northwest A&F University, Yangling, Shaanxi 712100, China
3
Key Laboratory of Agricultural Soil and Water Engineering in Arid and Semiarid Areas of Ministry of Education, Northwest A&F University, Yangling, Shaanxi 712100, China
*
Author to whom correspondence should be addressed.
Sustainability 2019, 11(16), 4490; https://0-doi-org.brum.beds.ac.uk/10.3390/su11164490
Submission received: 16 July 2019
/
Revised: 14 August 2019
/
Accepted: 15 August 2019
/
Published: 19 August 2019
Abstract
:To balance multiple objectives of high yield by farmers, high quality by customers, and high irrigation water use efficiency (IWUE) for sustainable development of agriculture, a two-growing-season study was performed to test the effect of aeration at three irrigation levels (60%, 80%, and 100% of full irrigation) on crop growth, nutrient uptake, yield, IWUE, and fruit quality of tomato. The results showed that compared to the control, aeration significantly increased total dry weight at harvest, total N and K accumulation, which increased tomato yield by 23% and IWUE by 23% (p < 0.05). Yield and IWUE were significantly affected by irrigation with the increasing rate of 20.5% and 14.3% for yield, and with the decreasing rate of 27.7% and 8.6% for IWUE under 100% of full irrigation than that under 60% and 80% of full irrigation, respectively. Aeration positively impacted fruit quality while irrigation had a negative impact (p > 0.05). Based on these indicators, full irrigation with aeration could be an appropriate schedule for greenhouse tomato cultivations by the entropy evaluation method with the comprehensive score of 0.879 and 0.77 for the spring-summer and autumn-winter season, respectively. The result is of great significance to the farmers’ or researchers’ management of aerated irrigation in greenhouse tomatoes.
1. Introduction
Tomato (Lycopersicon esculentum Mill.), as the world’s main vegetable crop, is widely cultivated on account of its high potential yield and abundant nutrition for human diet [1]. With the planting area of tomato increasing, China planted 1 million hectares in 2016 [2]. Due to high consumption, tomatoes are mainly cultivated in solar greenhouses that can provide off-season production. Meanwhile, agricultural management must be studied and adopted to improve tomato production due to the increasing demand. Previous research has demonstrated that tomato is one of the most sensitive crops to soil aeration and moisture [3]. Hypoxia and deficit irrigation existed in the planting process would inhibit crop growth, which resulted in low crop production ultimately [4,5]. Therefore, aeration of the root zone and irrigation management is needed to ensure the yield while improving the quality of tomatoes and their water use efficiency (WUE).
Aerated irrigation (AI) has been extensively proven to alleviate soil oxygen deficiency by providing the slurry of air and water into the soil root zone through venturi injectors installed on subsurface drip irrigation tape [5,6]. The conduction of AI not only improves the soil-crop root micro-environment in which microorganisms can dwell and propagate [7], but also enhances the physiological characteristics of plants [8,9]. AI is well recognized to increase crop yield and WUE [5,6,10]. For example, Bhattarai et al. [5] found that compared to non-aerated irrigation, fruit yield with aeration was 21% and 38% higher, and WUE of biomass as gram of biomass per liter of applied water with aeration was 16% and 32% larger in the moisture and salinity experiments, respectively. Du et al. [10] concluded that AI improved crop yields by 19.3% and WUE by 17.9% on average through a meta-analysis. Zhu et al. [6] revealed that with respect to the control, tomato yield per plant and WUE under AI was increased by 29% and 28.1%, respectively. However, these previous studies mainly attributed the increase in yield to crop growth parameters such as dry matter, plant height, stem diameter, and leaf area [5,6]. Mineral nutrients, which are indispensable for completing the life cycle and dry matter accumulation of plants, are directly involved in various physiological metabolic processes, thus further affecting crop yield [11]. Nevertheless, the effect of AI on plant nutrient uptake has not been previously reported. Therefore, the study of nutrient uptake under AI provides the basis for the analysis of the change of crop yield and environmental pollution (e.g., nutrients loss).
Irrigation, which influences soil aeration in turn, is another important factor affecting the crop growth, yield, WUE, and fruit quality [4,12,13]. Lots of researchers concluded that deficit irrigation decreased crop yield, restricted crop growth, and increased WUE by the reductions in leaf transpiration rate, photosynthesis rate, assimilation rate, dry biomass, and leaf relative water content that were caused by stomata closure responses to water stress [4,11,13,14]. Agbna et al. [4] noted that tomato yield increased as irrigation amount increased, and deficit irrigation significantly increased the fruit quality and WUE compared to the full irrigation regime. Wang et al. [15] revealed that the fruit yield of cucumber increased while WUE presented an increase then decrease trend with the amount of irrigation water. Zhu et al. [6] observed that with the irrigation level increasing from 0.6 to 1.0, tomato yield per plant was increased by 25.3%, while lycopene, soluble sugar, and organic acid content of fruit was reduced by 18.3%, 16.8%, and 13.9%, respectively.
However, single scenario (AI or deficit irrigation) was often challenging to balance multiple objectives of high yield by farmers, high quality by customers, and high WUE for sustainable development of agriculture [15]. The entropy method is well recognized to solve multi-objective decision-making problems [16]. Therefore, the entropy weight method in this study was employed to investigate the coupling effects of aeration and irrigation on economic and environmental indexes. The aims of this study were: (1) to test the effects of aeration and irrigation on tomato growth, nutrient absorption, yield, WUE, and fruit quality; and (2) to explore an effective irrigation schedule that can comprehensively improve the crop growth, nutrient uptake, yield, WUE, and quality of greenhouse tomato. Our results will be used to facilitate the establishment of scientific greenhouse catch crop irrigation systems, to maintain the sustainable use of soil, and to provide a theoretical basis for the sustainable development of agriculture.
2. Materials and Methods
2.1. Experimental Site
The experiment was conducted in a solar greenhouse across the two-consecutive tomato-growing seasons: in the spring-summer season from April to July 2017 and in the autumn-winter season from August to December 2017. The site was located at 34°20′ N, 108°04′ E, at the Key Laboratory of Agricultural Soil and Water Engineering in Arid and Semi-Arid Areas of the Ministry of Education, Northwest A&F University, Yangling, Shaanxi Province, China. The annual sunshine duration was 2164 h. The annual frost-free period was 210 days. The site had a Lou soil type with silt clay loam texture (sand 26%; silt 33%; clay 41%), which was classified as Eum-Orthic Anthrosols [17]. The top soil (0–20 cm) had a field capacity of 23.8% (gravimetric water content), dry bulk density of 1.35 g·cm−3, pH of 7.65, organic matter content of 13.71 g·kg−1, total N of 1.86 g·kg−1, total P of 1.40 g·kg−1, and total K of 20.22 g·kg−1.
Maximum, mean, and minimum air temperatures throughout the two growing seasons inside the greenhouse, collected by Automatic Meteorological Observing Station (Hobo event logger, Onset Computer Corporation, USA), were shown in Figure 1. The weather station, which placed 2 m above the ground, recorded meteorological data at an interval of 15 min.
2.2. Experimental Design
Across the two growing seasons, tomato cultivar “JINPENG SEED” was respectively transplanted on 4 April 2017 and on 6 August 2017 when the seedlings had 3 to 4 leaves and 1 heart [18]. Each plot (4 × 0.8 m in size) with one row had 11 plants, spaced 35 cm apart. All plots were covered with plastic films to minimize surface evaporation. A drip irrigation pipe was buried at 15 cm below the soil surface with a dripper interval of 35 cm [19]. The experiment ended on 4 July 2017 and on 25 December 2017, with a total growth period of 90 and 142 days, respectively.
Three irrigation levels included during this study: 60% (W0.6), 80% (W0.8) and 100% (W1.0) of full irrigation amount (W), as calculated by Equation (1). Each irrigation level included aeration (O) and control (S), totaling six treatments (W0.6O, W0.6S, W0.8O, W0.8S, W1.0O, and W1.0S). Three replicates per treatment were established, and totaling 18 plots were arranged in a completely randomized design.
Based on the evaporation measured through an E601 evaporation pan, the full irrigation amount was calculated as Hou et al. [18] and Chen et al. [19]:
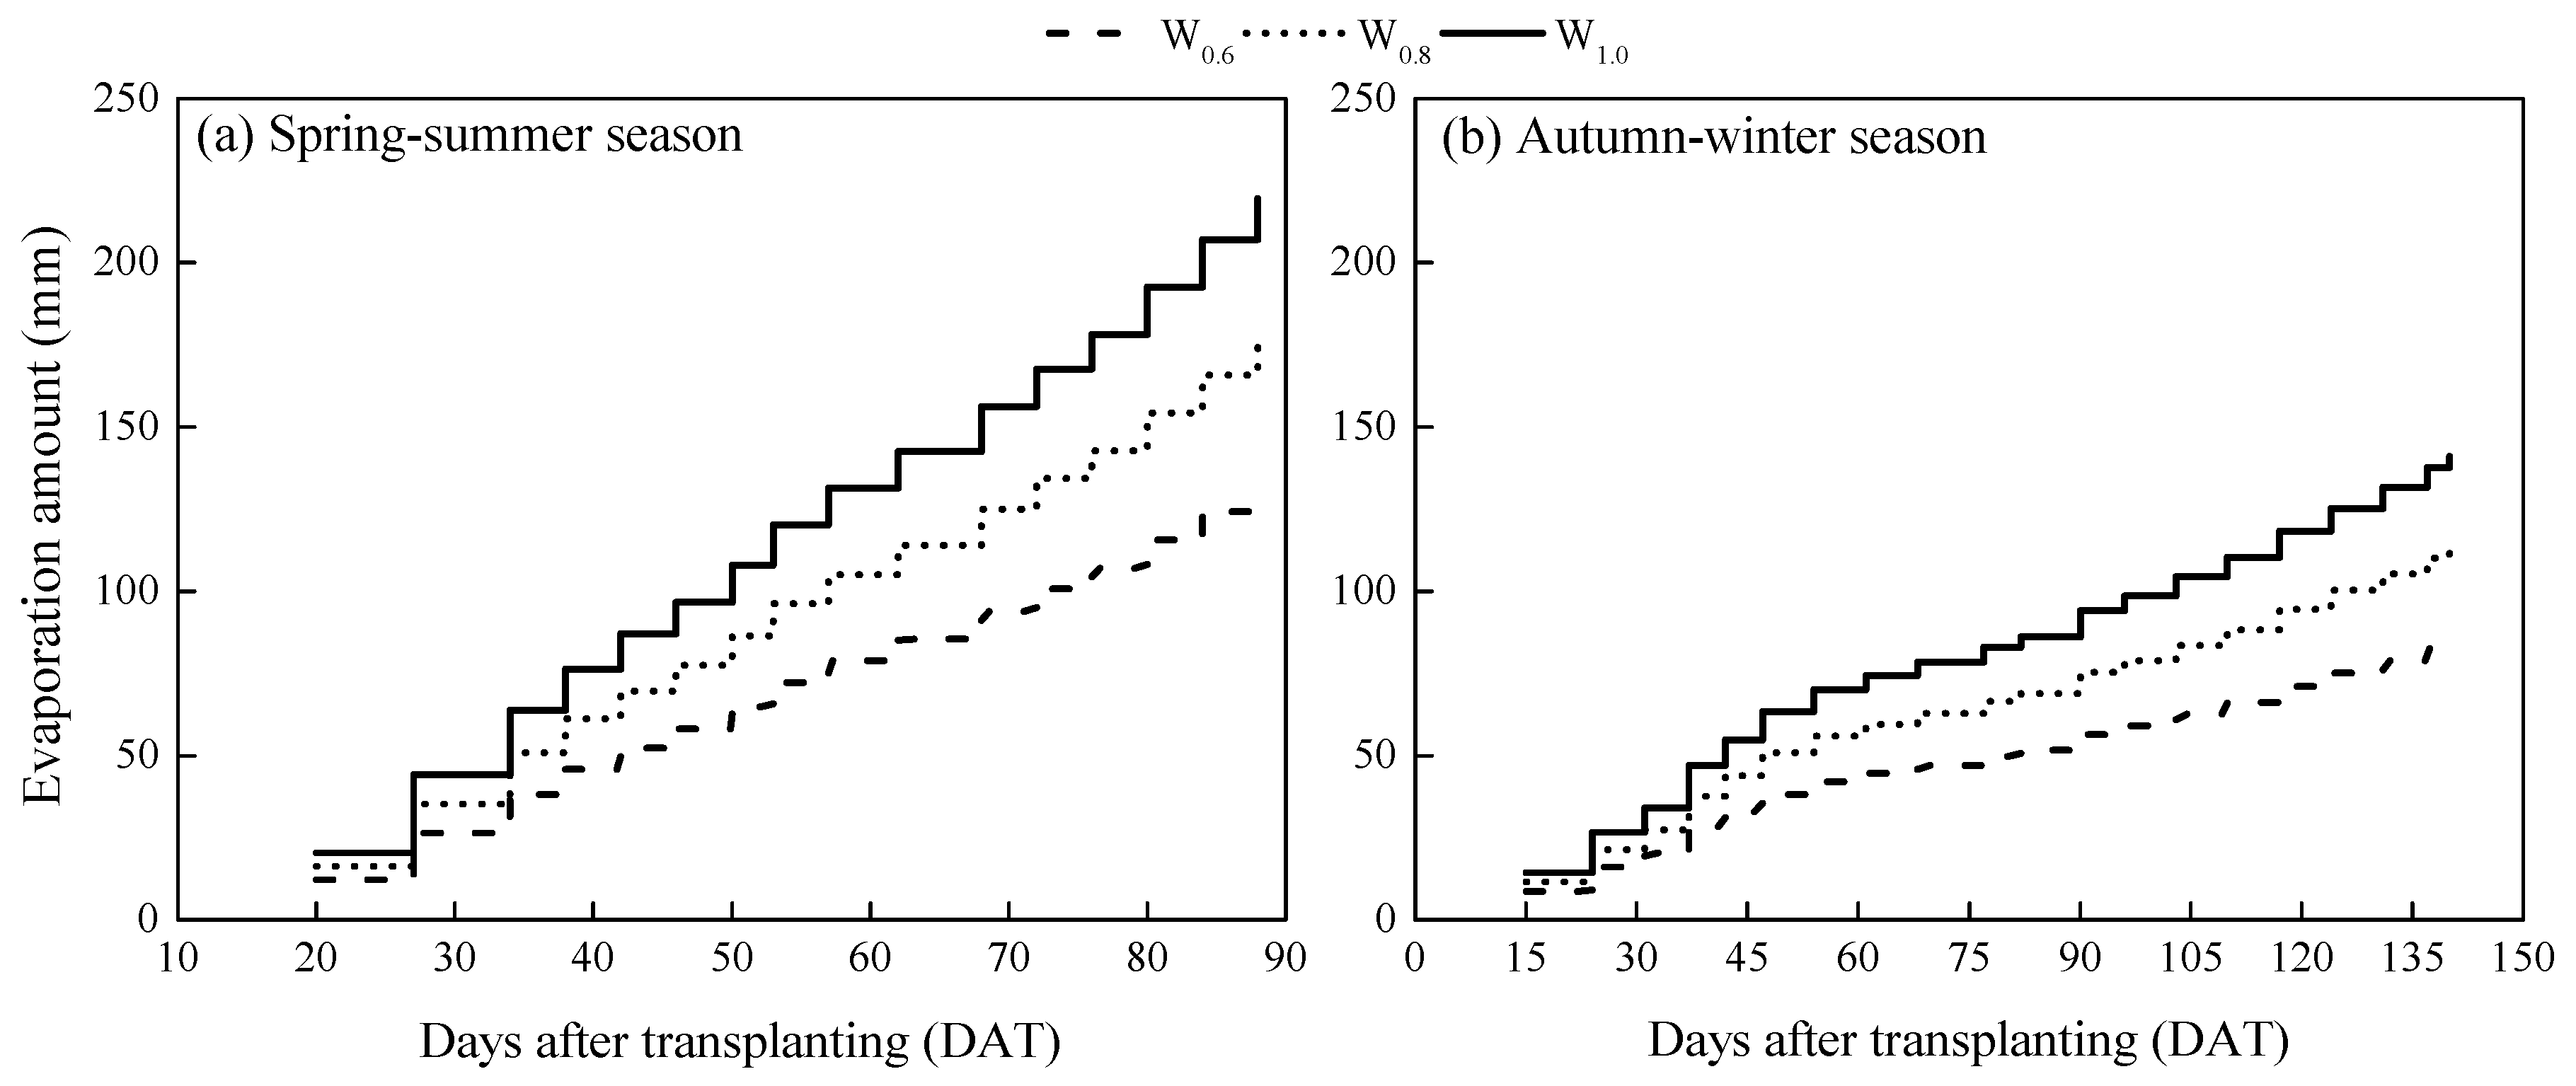
where W is the full irrigation amount (L); A is the effective plot area irrigated by one dripper, which in this experiment is 0.14 m2 (0.35 × 0.4 m); Epan is the total evaporation following the last irrigation event (mm), as seen in Figure 2; and kcp is the crop-pan coefficient, being 1 in this study.
W = A × Epan × kcp
Irrigation was carried out through a bucket connected to a pump [19,20]. For each growing season, 16 and 20 irrigation events at an interval of 3–7 days were applied. Total evaporation between the two irrigation events across the two growing seasons was shown in Figure 2. Hence, a total of 30.74 and 19.80 L for W were applied for the spring-summer season and autumn-winter season, respectively.
For aeration, a “Mazzei 287” venturi air-injector (Mazzei Injector Company, LLC, USA) was installed in-line immediately following a control valve and pump. The inlet and outlet pressure was respectively 0.1 and 0.02 MPa, which established a volumetric air concentration of 17% in the water [6].
Only basal fertilizer, including organic fertilizer (N-P2O5-K2O ≥ 10%, organic matter ≥ 45%) and compound fertilizer (total nutrients ≥ 45%, including N, P2O5 and K2O each at 15%), was applied for all plots. Each fertilizer application was achieved at a rate of 3437.5 and 2187.5 kg·ha−1 on 17 January 2017 to a total amount of 442.7 kg·ha−1 N, 442.7 kg·ha−1 P2O5, 442.7 kg·ha−1 K2O, and 1546.9 kg·ha−1 organic matter for the spring-summer season [19], and at a rate of 1875 and 1250 kg·ha−1 on 3 August 2017 to a total amount of 250 kg·ha−1 N, 250 kg·ha−1 P2O5, 250 kg·ha−1 K2O, and 843.8 kg·ha−1 organic matter for the autumn-winter season. Other agronomic managements, such as field preparation, planting, spraying, pruning, pollination and bactericide-application, were consistent with local production practices.
2.3. Measurement and Methods
Plant height and stem diameter of tomato was respectively measured by a steel ruler and a digital Vernier caliper [21]. The plant height and stem diameter were measured at an average interval of 6 days during the early growing period while at an average interval of 18 days during the late growing period since 20 and 14 days after transplanting (DAT) for the spring-summer season and autumn-winter season, respectively. Three plants from each treatment were sampled to measure dry weight on 30, 46, 68, and 90 DAT during the spring-summer season, and on 42, 68, 104, and 142 DAT during the autumn-winter season. All plant samples were first separated into roots, stems, leaves, and fruits. Every part was put into a 105 °C oven for 1 h to deactivate enzymes and then dried at 75 °C until the parts reached a constant weight. The dry biomass of each part was weighed on an electronic scale with a 0.05 g precision [21]. Total dry weight was the sum of root, stem, leaf, and fruit. Moreover, the plant tissues at harvest (spring-summer season: 90 DAT; autumn-winter season: 142 DAT) were then ground using a sample mill. Previous research showed that N and K were major elements for tomato growth [11]. Hence, we merely measured N and K accumulation for nutrient uptake analysis for the two growing seasons in 2017 in our study. According to Bao [22], the plant biomass was digested with H2SO4–H2O2 for N concentration analysis by an AA3 Continuous Flow Analytical System (Bran+Luebbe Company, Germany), and for K concentration analysis by the atomic absorption spectrophotometer (AA370MC, Shimadzu, Tokyo, Japan). Finally, we calculated N and K accumulation by multiplying the dry weight by the N and K concentration in different organs.
The ripened fruits picked manually with five plants per plot were labeled to measure the tomato production. The weight of each fruit was measured by an electronic balance with a 0.05 g precision. Tomato yield per plant was the average value of five plants, and then converted into tomato yield per hectare (t·ha−1) [19]. Irrigation water use efficiency (IWUE, kg·m−3) was the ratio of tomato yield to irrigation amount. In addition, nitrogen production efficiency (NPE) was the ratio of yield to the cumulative N uptake of plant, and potassium production efficiency (KPE) was the ratio of yield to the cumulative K uptake of plant [11].
For the autumn-winter season in 2017, four uniform, mature and disease-free fruits were selected from each plot at harvest for fruit quality measurement [23]. Fruits from each treatment were homogenized using a fruit blender, to prepare for analysis of the fruit’s chemical composition [6]. Total soluble solids were determined by a handheld refractometer (ATAGO, PR-32, Co., Ltd., Tokyo, Japan). Lycopene was measured using an ultraviolet spectrophotometer (EV300PC, Thermo Fisher, England). Vitamin C content was measured by molybdenum blue colorimetry. Soluble sugar was measured by anthrone colorimetry. Organic acid was titrated with 0.1 mol·L−1 NaOH. Sugar-acid ratio was calculated as the ratio of soluble sugar to organic acid.
2.4. Statistical Analysis
Differences of aeration, irrigation, and season on crop growth (plant height, stem diameter, and dry weight), nutrient uptake (N and K accumulation), tomato yield, IWUE, and tomato fruit quality (total soluble solids, lycopene, vitamin C, soluble sugar, organic acid, and sugar-acid ratio) were tested with analysis of variance (ANOVA) followed by an Least-Significant Difference test (LSD test, 95% confidence level, p < 0.05) using SPSS Statistics 22.0 (SPSS Inc., Chicago, USA). A Pearson correlation test was performed using SPSS Statistics 22.0. All figures were created in OriginPro9.0 (OriginLab Corporation, Northampton, MA 01,060 USA). The comprehensive evaluation on crop growth, nutrient uptake, yield, IWUE, and tomato fruit quality was tested under different treatments. The weight of each index was calculated by entropy method, and the comprehensive scores was the product of weight and normalized value. The modeling of the entropy method was as follows [16,24].
Supposing that there are n evaluation indexes and m aeration-irrigation schedules, m schedules with n indexes can form a matrix:
where rij is the jth evaluation index of the ith schedule. For rj, there is information entropy (average amount of information after excluding redundancy):
where pij is the proportion of indicator value of the jth evaluation index of the ith schedule, calculated as follows:
The entropy value of jth index:
The objective weight of jth index:
It is clear that:
The comprehensive index weight can be obtained by combining the subjective weight αj (j = 1, 2, 3,…n) by decision maker with the objective weight ωj (j = 1, 2, 3,…n):
The highest entropy weight evaluation value of each aeration-irrigation schedule can be adopted as the optimal management for greenhouse tomato cultivations in this study.
3. Results and Discussion
3.1. Plant Growth
Seasonal changes of tomato plant height (Figure 3a,b) and stem diameter (Figure 3c,d) with and without aeration under different irrigation levels were similar across the two growing seasons. Plant height and stem diameter presented a sharp increase before 50 DAT, while the increasing rate was relatively stable after 50 DAT. Analysis of variance indicated that, plant height and stem diameter were positively and insignificantly affected by aeration and irrigation (p > 0.05), while the effect of season on these two indexes was extremely significant (p = 0.000, Table 1). As for the plant height and stem diameter at last determination (spring-summer season: 90 DAT; autumn-winter season: 126 DAT), the maximum values were observed under W1.0O treatment. Tomato plant height was 122.1 and 162.4 cm, which was increased by 0.3–4.7% and by 0.6–3.8% than other five treatments for the spring-summer season and autumn-winter season, respectively (Figure 3a,b). Stem diameter was 12.25 and 7.47 mm, which was increased by 5.2–12% and by 0.9–6% than other five treatments for the spring-summer season and autumn-winter season, respectively (Figure 3c,d).
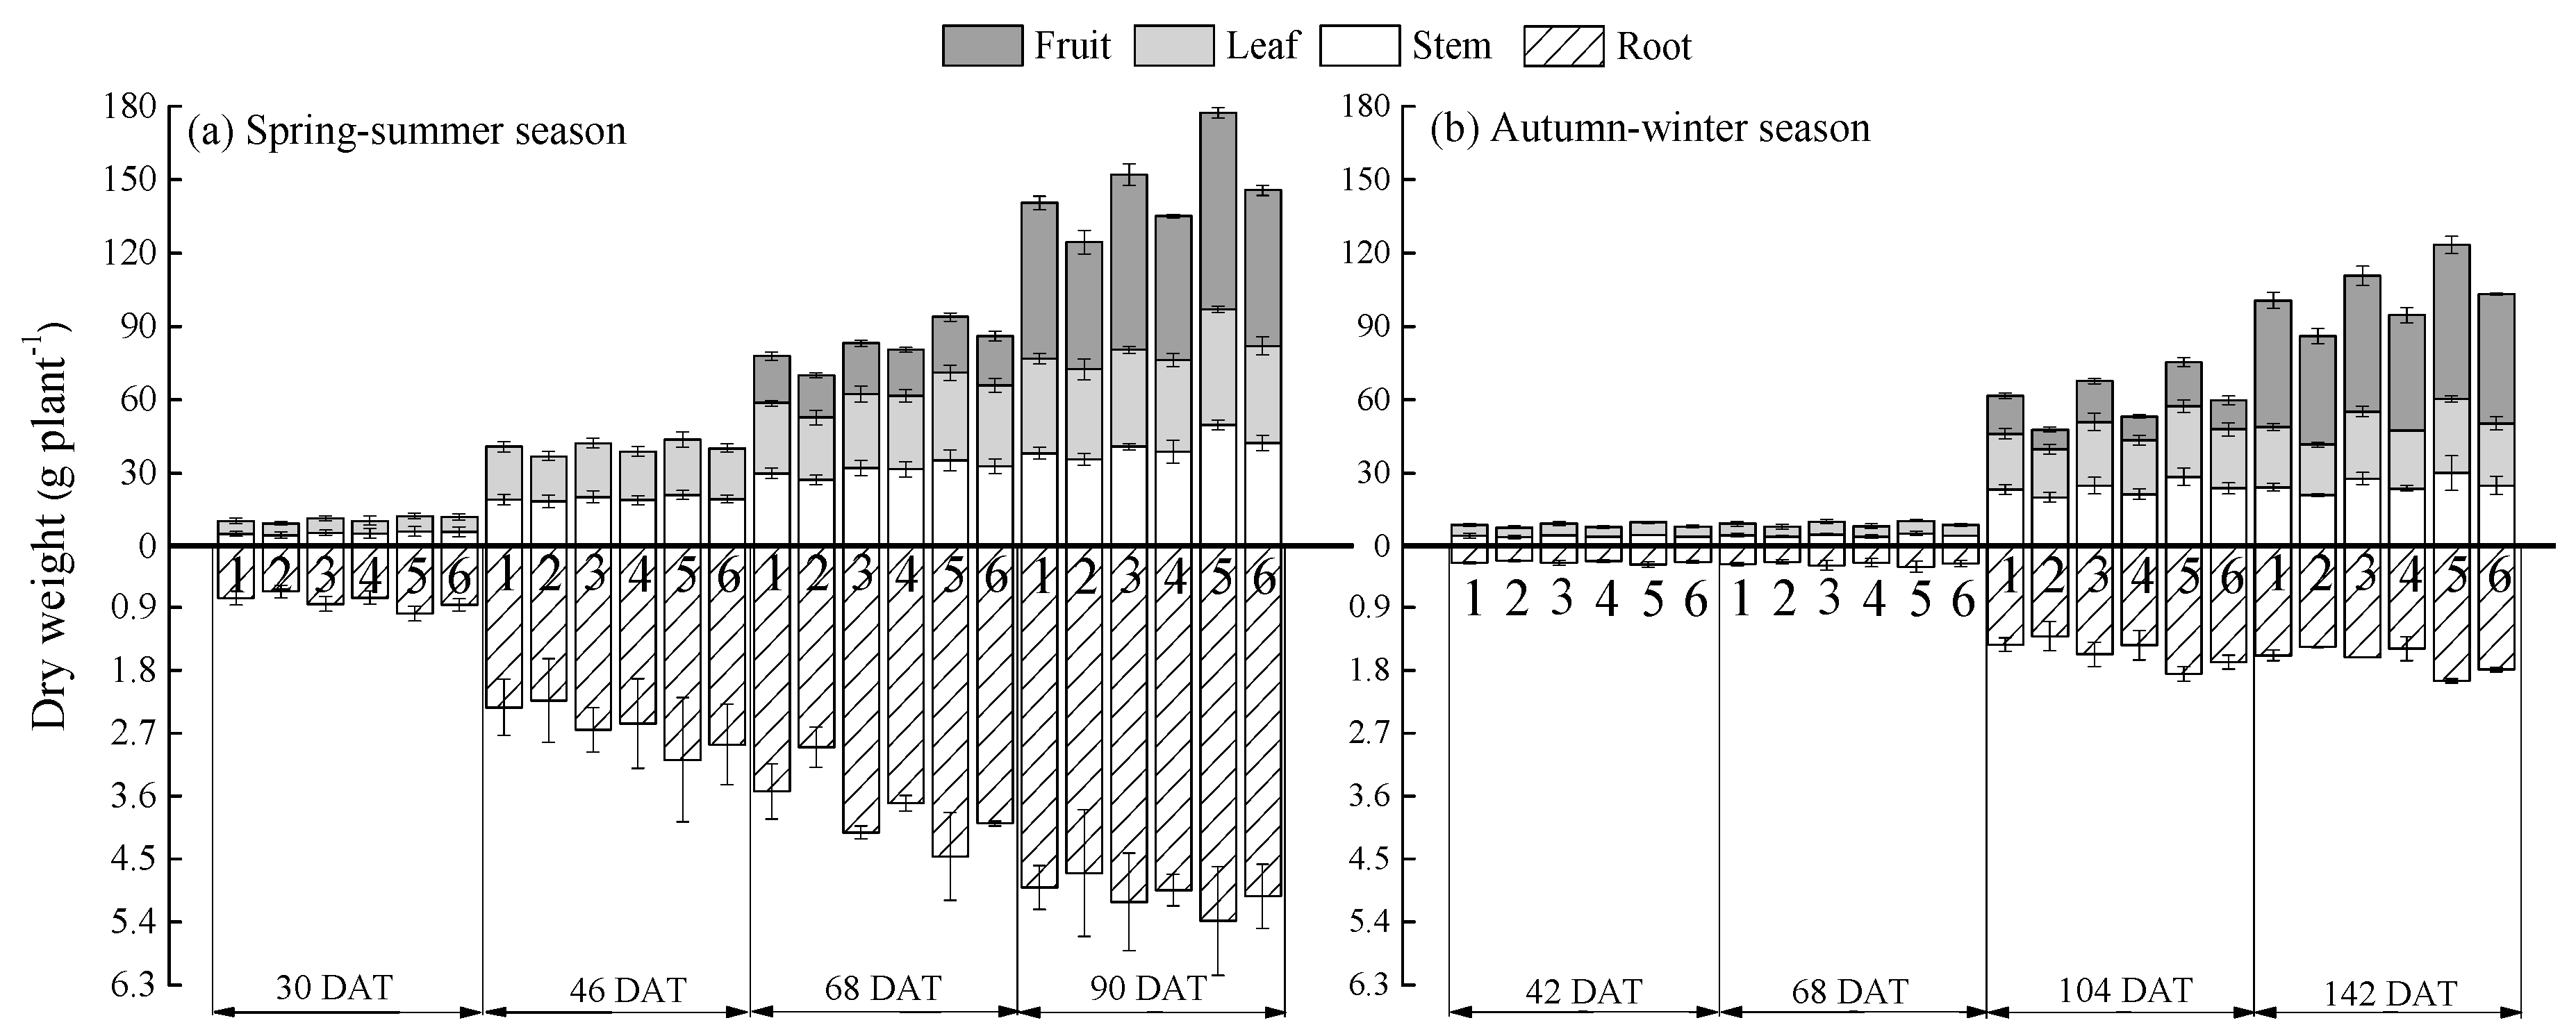
Dry weight of tomato root, stem, leaf, and fruit under aeration and high irrigation level was always greater than those under control and low irrigation level, leading to the highest values under W1.0O treatment (Figure 4). During the spring-summer season, dry weight of root, stem, and leaf on 30, 46, 68, and 90 DAT showed significant difference, and the dry weight of fruit on 90 DAT was significantly greater than that on 68 DAT (p < 0.05). During the autumn-winter season, dry weight of each tomato organ on 42 and 68 DAT was similar, and dry weight of root, stem, and leaf on 104 and 142 DAT was similar. Meanwhile, dry weight on 104 and 142 DAT were significantly higher than those on 42 and 68 DAT (p < 0.05, Figure 4).
Taking dry weight at harvest as an example (spring-summer season: 90 DAT; autumn-winter season: 142 DAT), dry weight of root, stem, leaf, and fruit under aeration during the spring-summer season was respectively increased by 4.9%, 9.8%, 10.1%, and 23.5% than the control, and the effect was significant for fruit (p < 0.05). During the autumn-winter season, dry weight of root, stem, leaf, and fruit under aeration was respectively increased by 8.4%, 17.7%, 17.8%, and 17.8% with respect to the control, and the effect was significant for stem, leaf, and fruit (p < 0.05). These improvements of dry weight were in accordance with the findings of previous researches [6,8], which were beneficial from increased soil aeration and reduced phytohormones (e.g., ABA and C2H4) under AI. As reported by Yu et al. [25], a significant positive correlation between soil respiration and aboveground dry biomass was determined. The elevated CO2 emissions under AI [18,26] would promote crop photosynthesis, which was also conducive to dry matter accumulation [27]. As seen in Figure 4, dry weight of tomato organs showed an increasing trend with the increase of irrigation amount (W1.0 > W0.8 > W0.6). During the spring-summer season, dry weight of root, stem, leaf, and fruit under W1.0S was respectively increased by 7.1%, 18.8%, 7.7%, and 22.5% than that under W0.6S treatment. Meanwhile, dry weight of root, stem, leaf, and fruit under W1.0S was respectively increased by 1.8%, 9%, 6%, and 8.2% than that under W0.8S treatment. During the autumn-winter season, dry weight of root, stem, leaf, and fruit under W1.0S was respectively increased by 22.2%, 19.3%, 22.5%, and 19.0% than that under W0.6S treatment. Simultaneously, dry weight of root, stem, leaf, and fruit under W1.0S was respectively increased by 20.1%, 5.4%, 7%, and 12.1% than that under W0.8S treatment. The decrease of dry weight under deficit irrigation were primarily ascribed to reduced canopy and leaf area index [6], and decreased assimilation rate [13].
Aeration and irrigation had positive and significant effects on total dry weight (Table 1, Figure 4). At harvest, total dry weight of tomato under aeration was 16.5% higher than that of the control (p < 0.05). Total dry weight under W1.0S was 18.3% and 8.4% greater than that of W0.6S and W0.8S, respectively. The maximized total dry weight was 182.76 and 125.28 g·plant−1 under W1.0O, which was 1.16–1.42 and 1.12–1.43 times higher than that of other treatments for the spring-summer season and autumn-winter season, respectively (Figure 4).
3.2. Nutrient Accumulation and Distribution
Mineral nutrients are directly involved in various physiological metabolic processes of plants and are indispensable to complete the life cycle of plants [11]. The accumulation of mineral elements by plants is the base of dry matter accumulation [28]. However, the effect of AI on plant nutrient uptake has not been previously reported. Therefore, the study of nutrient uptake under AI provides the basis for the analysis of the change of crop yield and environmental pollution (e.g., nutrients loss). The distribution of water and nutrients in soil directly affects the change of nutrient content in plants, as well as the number and average fruit weight of plants, thus affecting the absorption and utilization of nutrients. In our study, nutrient concentration in tomato organs were significantly influenced by aeration and irrigation across the two growing seasons in 2017 (p < 0.05, Table 1, Figure 5). Total N accumulation among treatments fluctuated from 106.7 to 181 kg·ha−1 for the spring-summer season and from 65.7 to 113 kg·ha−1 for the autumn-winter season (Figure 5a,b), which were within the ranges of previous results for tomato cultivation fields [11,14]. Total K accumulation among treatments varied from 65.1 to 106.1 kg·ha−1 for the spring-summer season and from 48 to 75.6 kg·ha−1 for the autumn-winter season (Figure 5c,d), which were slightly lower than report summarized by Xing et al. [11]. The differences existed were largely subject to different irrigation amount applied into the soils (our study: 84.7–219.6 mm; their study: 159.8–279.5 mm), which obviously influenced dry matter accumulation and nutrient absorption. Moreover, different methods and amounts of fertilizer were also the reasons for the different results of the two experiments, which impacted soil substrate content for nutrient absorption of plants. Analysis of variance showed that the effect of growing season on total N and K accumulation was extremely significant (p < 0.01, Table 1). As can be seen in Figure 5, total N and K accumulation for the spring-summer season were greater than the values for the autumn-winter season, which was mainly ascribed to higher dry weight (Figure 4) and fertilizer amount applied for the spring-summer season. Higher fertilizer amount applied provided more soil nutrients for plants’ uptake. Meanwhile, dry weight was the main cause of total N and K accumulation (Table 2), which was calculated by multiplying the dry weight by the N and K concentration.
In our study, total N and K accumulation under aeration were respectively 1.24- and 1.22-fold higher than the control (p < 0.05). Previous research evaluated that the root was the primary organ for the water and nutrient uptake, and its distribution determined the plant’s ability to uptake water and nutrients [14]. The enhancements of nutrient concentration with aeration might be associated with promoted root growth [9,29], which increased area and capacity of root absorption, and thus increased nutrient absorption and transport. Total N and K accumulation under W1.0S were respectively increased by 34.5% and 27.8% on average compared to W0.6S (p < 0.05), while total N and K accumulation under W1.0S were respectively increased by 16.8% and 14.2% on average compared to W0.8S treatment. The enhancement of nutrient accumulation with irrigation amount increasing was similar to the findings of Xing et al. [11] and Wang et al. [14]. Three explanations might be interpreted for this phenomenon. Firstly, higher soil moisture under high irrigation level was conducive to accelerating the diffusion of ions and increasing the transpiration rate, which increased nutrient absorption by plants [11,30]. Secondly, enhanced root growth and root hydraulic conductivity under higher soil moisture [14], which were the major organ for nutrient uptake, were probably linked to increased N and K accumulation under high irrigation level. Lastly, Xing et al. [11] concluded that the accumulation of mineral elements was closely related to the accumulation of dry matter. The increase tendency in dry weight under aeration or high irrigation level (Figure 4) might be another reason for increase of nutrients.
For each treatment, N accumulation in tomato organs presented a distribution of fruit > leaf > stem > root (Figure 5), and the accumulation in each organ accounted for 45.1–62.9%, 22.5–35.3%, 11.3–18.7%, and 1.3–3.3% of total N accumulation, respectively. N accumulation in tomato root, stem, leaf, and fruit under aeration was 14.9–21.8%, 6.7–30.2%, 6.8–33.2%, and 22.3–29.6% greater than the value under the control, respectively. N accumulation in tomato root, stem, leaf, and fruit under W1.0S was averagely increased by 26%, 30.2%, 25.1%, and 40.7% in comparison to the value under W0.6S, and by 16%, 11.1%, 9.2%, and 22.7% compared to the value under W0.8S, respectively. While, K accumulation in tomato organs showed a distribution of fruit > stem > leaf > root (Figure 5), and the proportion of accumulation in each organ to total K accumulation was 40.1–59.5%, 20.6–29.2%, 17.9–27.9%, and 1.3–3.2%, respectively. K accumulation in tomato root, stem, leaf, and fruit under aeration was 5.0–16.8%, 11.3–33.6%, 9.1–25.6%, and 20.3–33.9% greater than the value under the control, respectively. K accumulation in tomato root, stem, leaf, and fruit under W1.0S was averagely increased by 25.5%, 26.6%, 27.5%, and 30.7% in comparison to the value under W0.6S, and by 16.1%, 10.6%, 14.2%, and 15.8% compared to the value under W0.8S, respectively. Higher N and K accumulation in tomato fruit is primarily because N and K nutrients would be transferred and distributed from source to reservoir as crop grows. That is, nutrients would be transferred to areas where life was most active [31]. Furthermore, higher dry weight of fruit in tomato organs (Figure 4) might be another reason for the higher nutrient accumulation of fruit, which was attributed to the positive relation between dry weight and nutrient accumulation [11].
3.3. Tomato Yield and IWUE
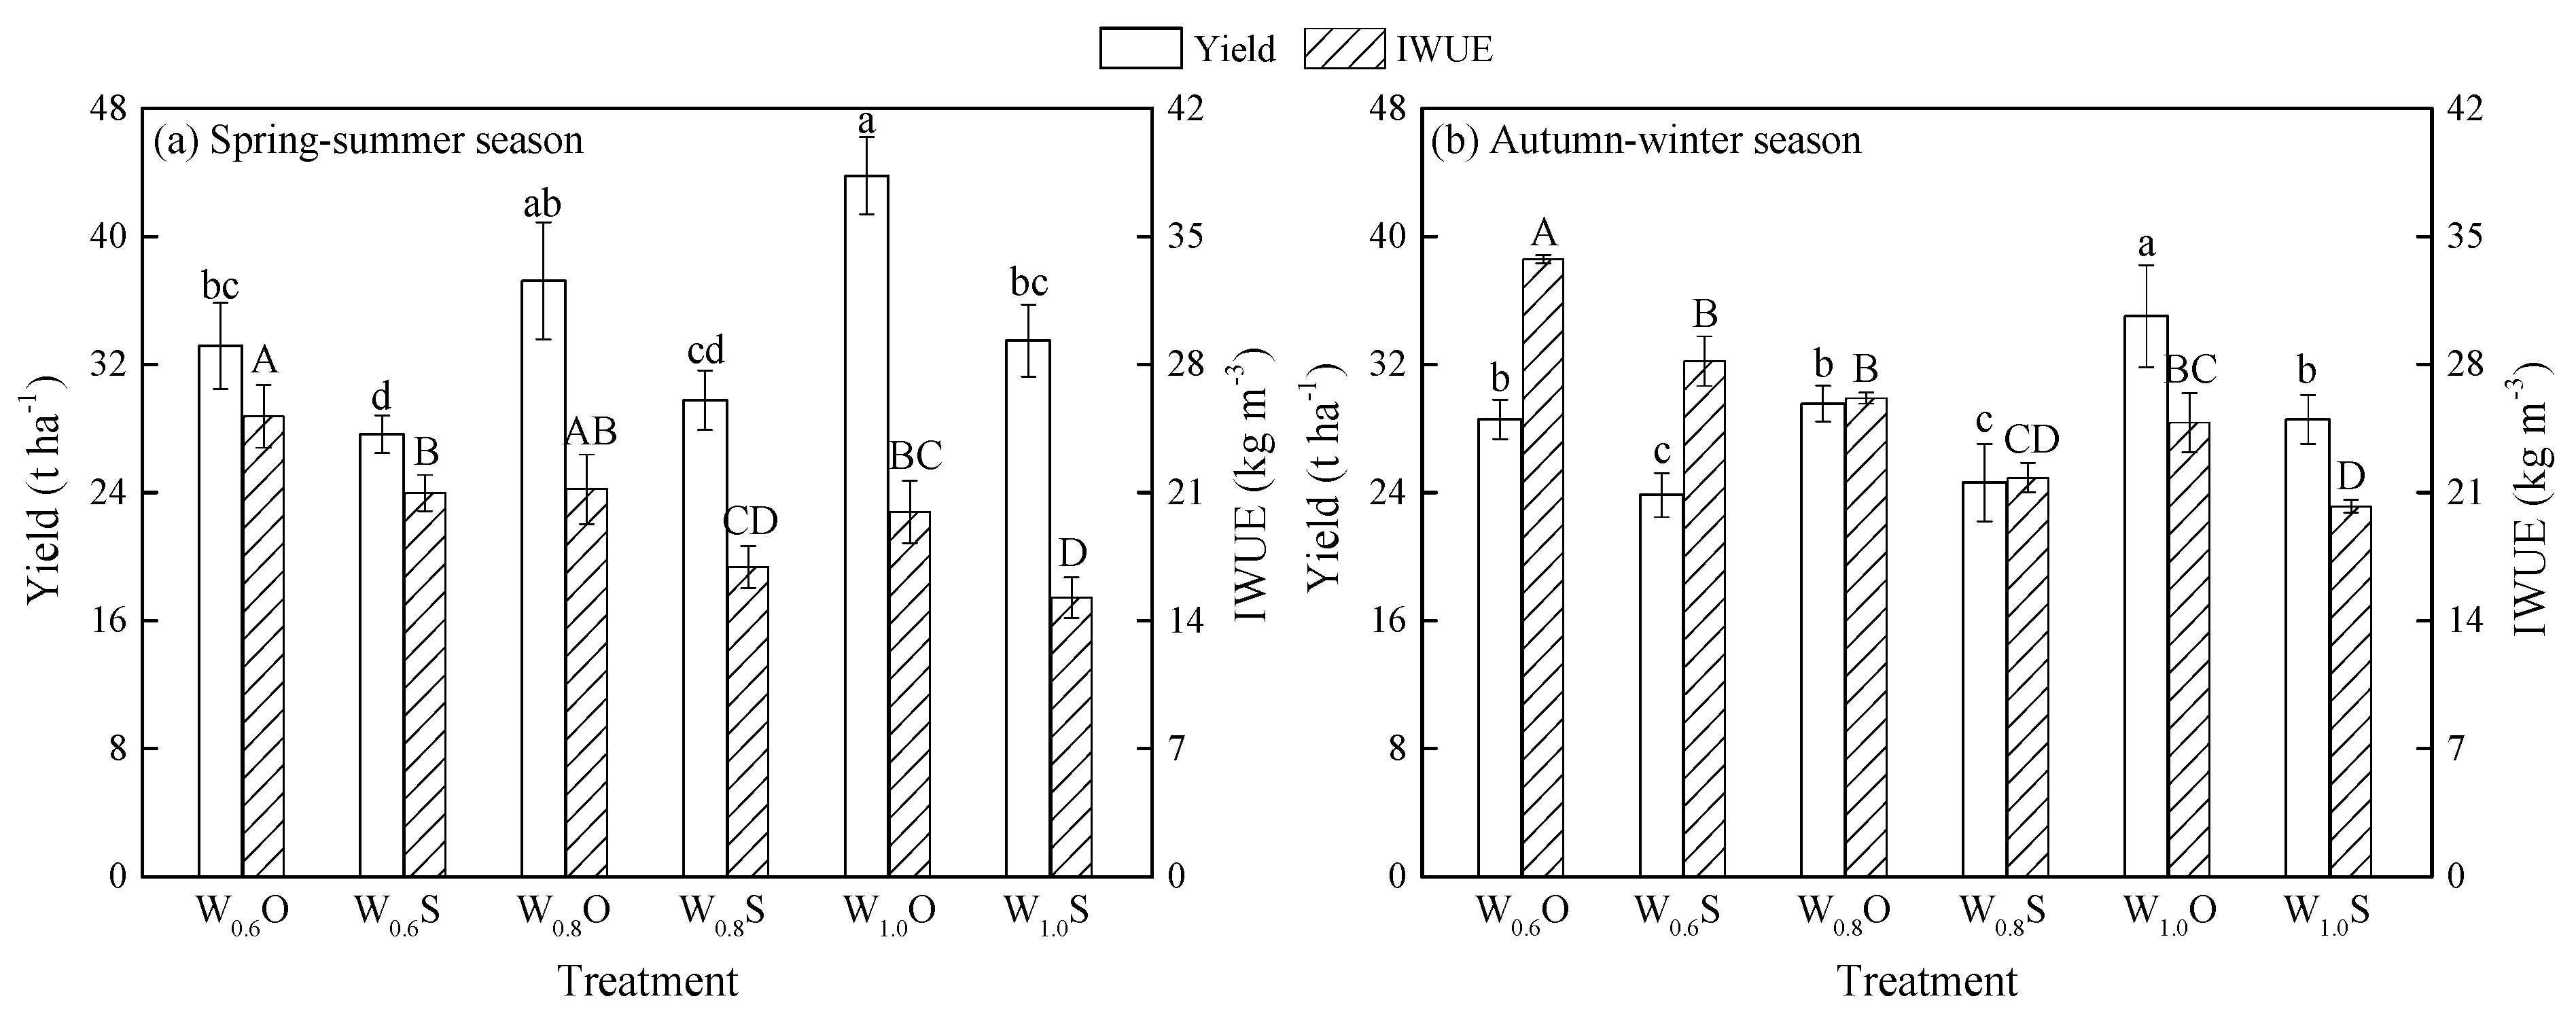
Tomato yield among treatments varied from 27.6 to 43.8 t·ha−1 for the spring-summer season and from 23.9 to 35.0 t·ha−1 for the autumn-winter season (Figure 6), which were similar to the results for a two season cropping within one year [6,12,19,26], however, they were lower than studies where the growth period was similarly 4–5 months [5,11,14]. The reason for these differences existed among researches may be greatly due to fertilization, irrigation, fruit spike number per plant, and climate impacts.
Hypoxia may reduce the net photosynthetic rate and prompt stomatal closure [8], which negatively impacts crop growth and yield. In line with previous studies [5,6], aeration significantly improved tomato yield by 23.0% compared to the control across the two growing seasons (p < 0.05, Figure 6). However, researchers have come to different conclusions of main factors causing the change in crop yield. For instance, Zhu et al. [6] found that enhanced crop yield under AI was due to delayed flowering, increased fruit dry weight and size, and improved leaf biomass. Bowles et al. [32] concluded that higher fruit biomass must have resulted from an increase in fruit number and in N and P uptake. Bhattarai et al. [5] reported that higher tomato yield under AI was mainly responsible for the increase of weight per fruit and dry fruit biomass, but not the increase of fruit number. Higher dry weight (Figure 4) and nutrient accumulation (Figure 5) with aeration in this study, which had significant and positive effects on tomato yield (p < 0.01, Table 2), were probably beneficial to yield production.
There was a significant difference in tomato yield between irrigation treatments (p < 0.05, Table 1). Compared to W1.0S, W0.6S and W0.8S decreased tomato yield by 17.0% and 12.5%, respectively (Figure 6). Similar conclusions had been drawn by previous workers [14,19]. This could be expected, because the air pathway becomes more tortuosity at higher irrigation levels, which reduces diffusion rates of soil oxygen [10]. With respect to the high irrigation level, lower yield under low irrigation level was investigated, which was primarily the result of restricted crop growth (Figure 3 and Figure 4) and reduced nutrient uptake (Figure 5). As concluded by other researchers, decreased photosynthesis and leaf transpiration rates [4], as well as reduced assimilation rate under deficit irrigation [13] could also be the cause of lower yield production. Deficit irrigation reduced water amount applied into the soils and simultaneously diminished tomato production. Tomato yield was positively and linearly correlated with irrigation amount (p = 0.004, Figure 7).
Besides, the effect of season on tomato yield was extremely significant (p = 0.000, Table 1). Yield in the spring-summer cultivation was 20.2% higher than in the autumn-winter cultivation. The reason for the lower tomato yield during the autumn-winter season (Figure 6) was primarily ascribed to the reduced dry matter production (Figure 4), photosynthesis due to weather condition (Figure 1), water consumption (Figure 2) and nutrient uptake (Figure 5). From the results of the present study, we recommended that choosing the warmer (spring-summer) season as often as possible would keep high yield for crops that can be cultivated several times a year in greenhouse systems. This recommendation was in line with the study of year-round tomato production where farmers growing tomatoes during the kharif season with high temperatures, high rainfall, and high humidity have received high profits [33,34]. Meanwhile, analysis of variance showed that the interactive effect of aeration and season on tomato yield was significant (p = 0.045, Table 1).
Compared to the control, significantly greater tomato yield under aeration with equal irrigation amounts applied into the soils at the same irrigation levels resulted in a significant increase in IWUE (p < 0.05, Figure 6), which was in accordance with previous results [14,19]. Additionally, IWUE under W0.6S and W0.8S was respectively 38.3% and 9.4% higher than that under W1.0S (Figure 6), which was similar to former studies [4,6,19,35]. This was probably due to the fact that stomatal closure occurred responses to water stress, and transpiration decreased more than photosynthesis under water deficit, and consequently IWUE increased [12,36]. Throughout the two growing seasons of tomato, the W0.6O treatment had the largest IWUE among the six treatments, with IWUE of 25.17 and 33.76 kg·m−3 for the spring-summer season and autumn-winter season in 2017, respectively (Figure 6).
3.4. Nitrogen and Potassium Production Efficiency
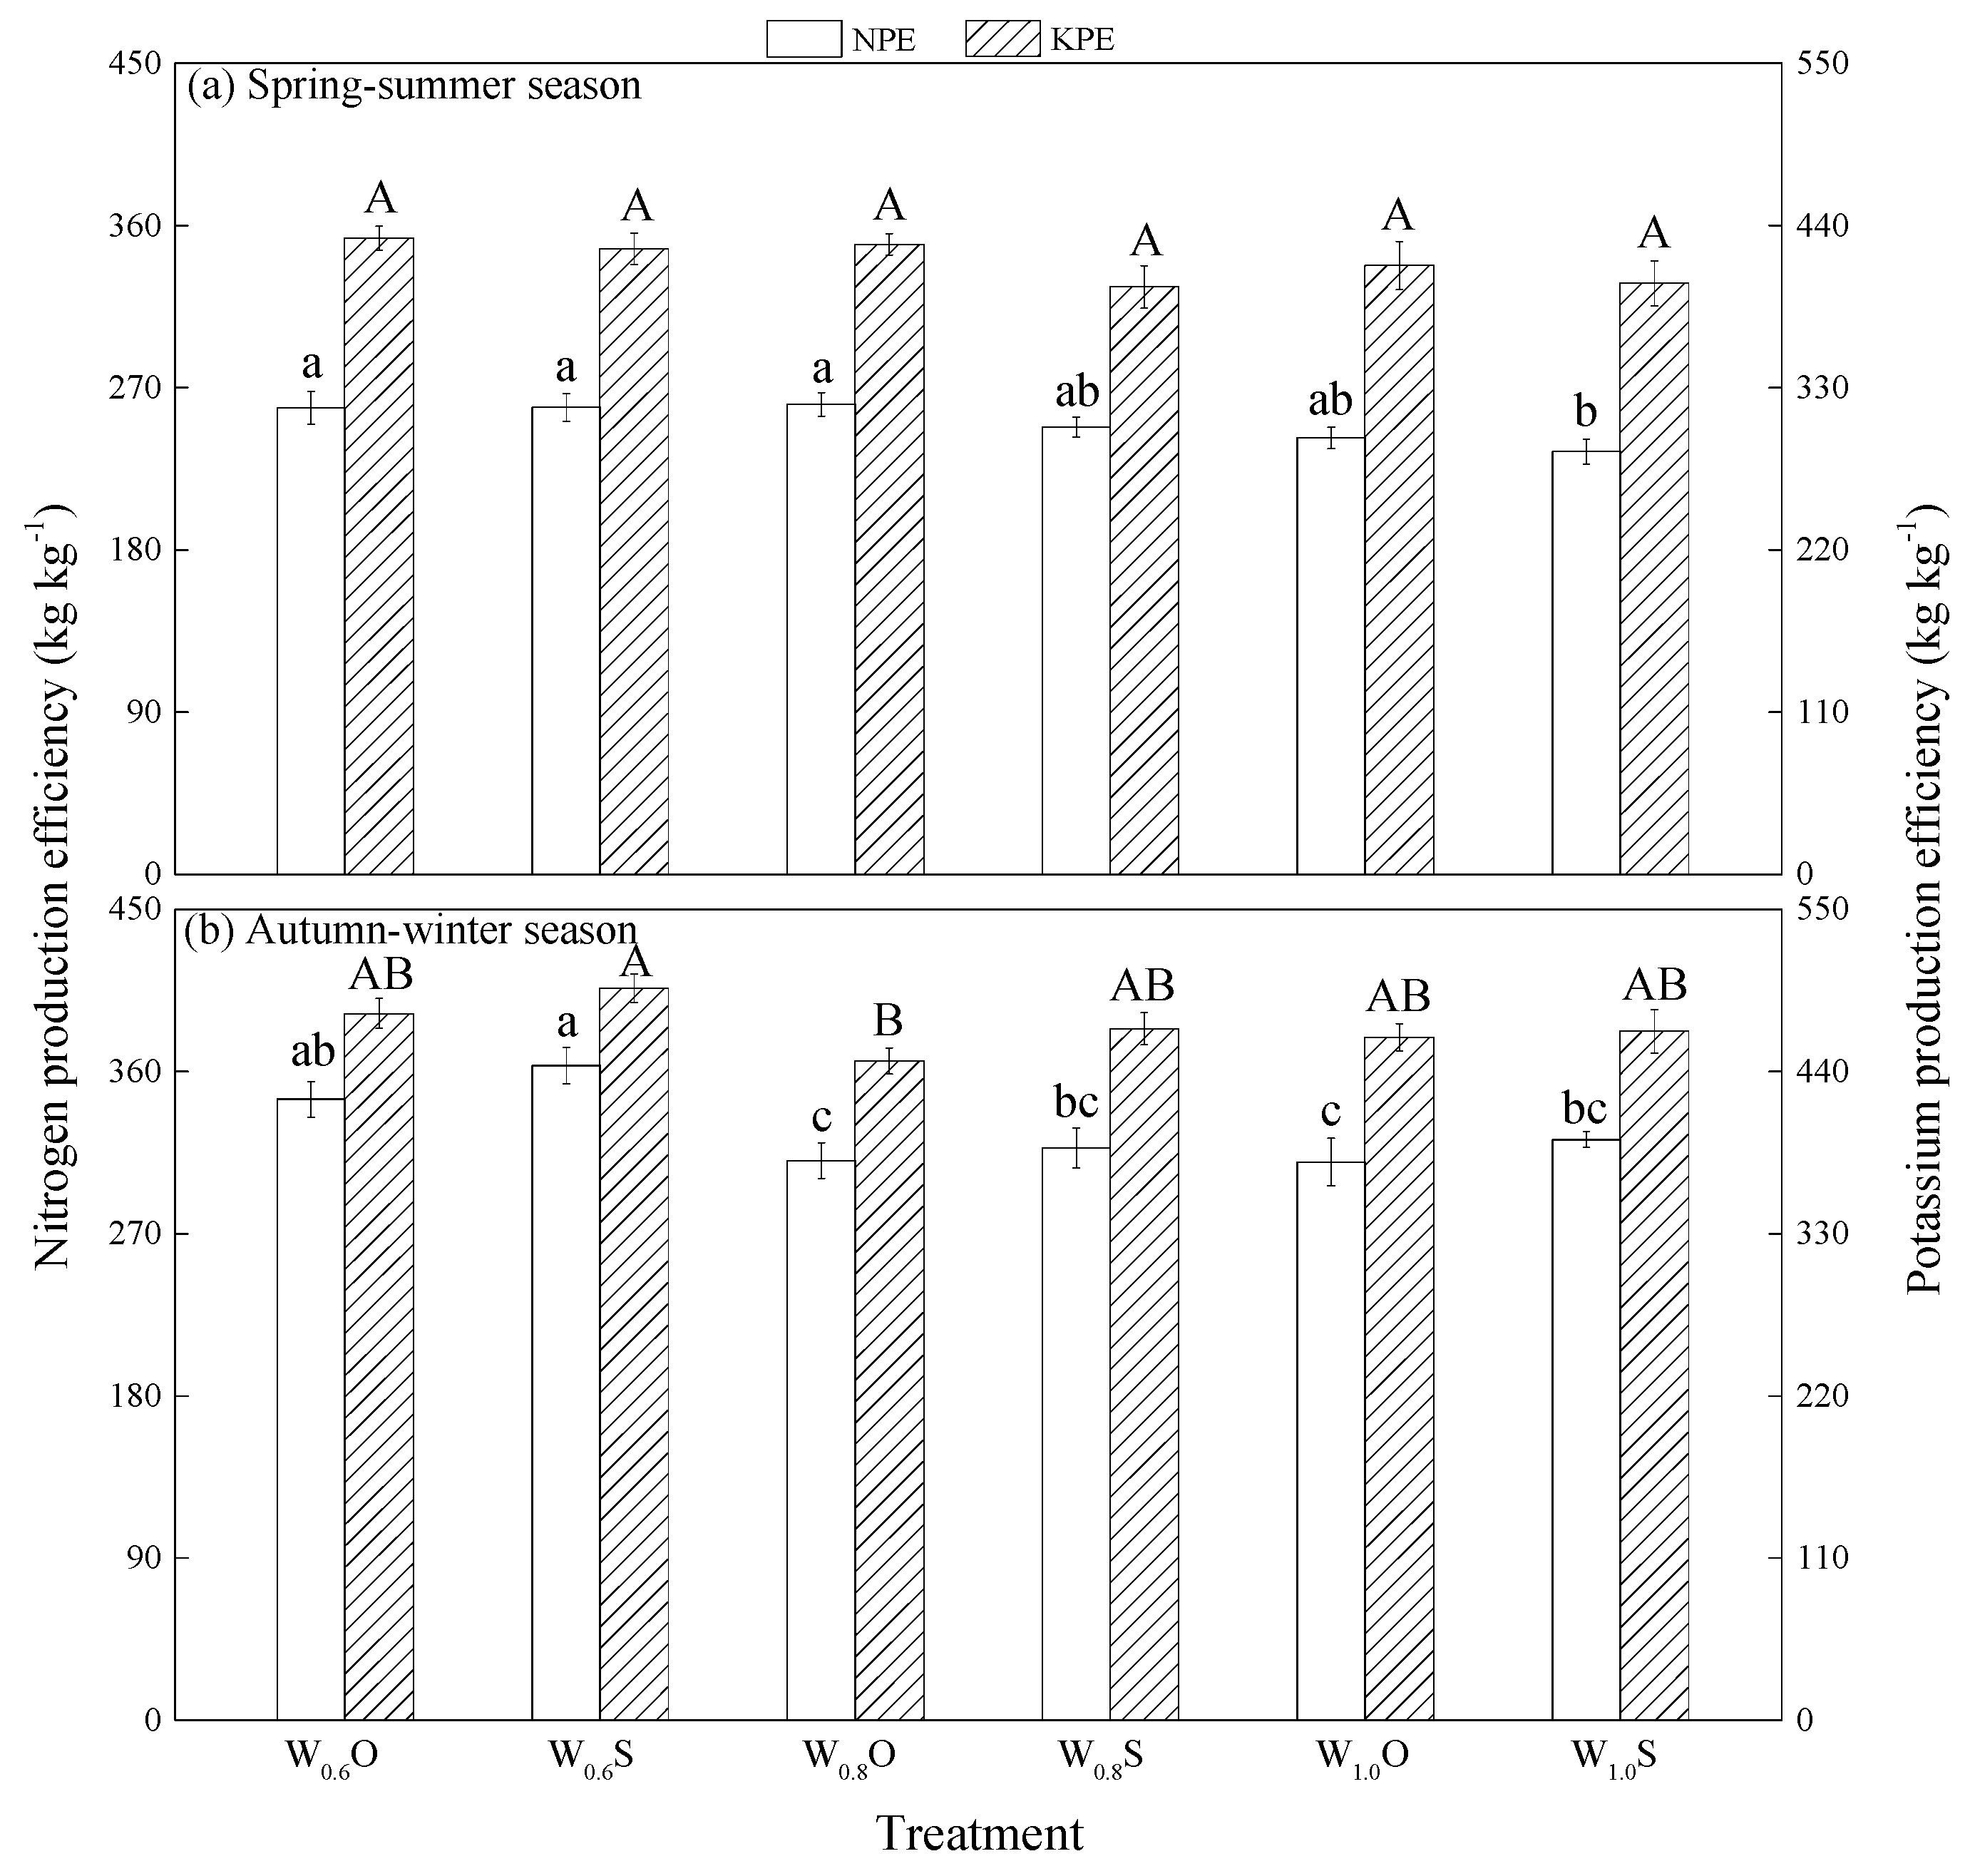
On the premise of obtaining the same yield, increasing the uptake of plant nutrients can reduce the residual nutrients in soil and appropriately reduce the risk of soil environmental pollution [11]. As seen in Figure 8, aeration and irrigation had slight effects on NPE and KPE. NPE under the six treatments ranged from 234.61 to 260.79 kg·kg−1 and from 309.81 to 363.26 kg·kg−1 for the spring-summer season and autumn-winter season in 2017, respectively. KPE varied from 398.43 to 431.36 kg·kg−1 and from 447.13 to 496.46 kg·kg−1 for the spring-summer season and autumn-winter season in 2017, respectively. For the spring-summer season in 2017, aeration increased NPE by 2.7% and KPE by 4% on average with respect to the control. For the autumn-winter season in 2017, NPE and KPE under aeration were 3.8% and 3% lower than the control, respectively. The different effect of aeration on NPE and KPE across the two growing seasons was largely because the yield increase caused by AI was larger than the total N and K accumulation increase during the spring-summer season, while the enhancement was lower during the autumn-winter season (spring-summer season: yield by 25.3%, N accumulation by 21.9%, and K accumulation by 20.5%; autumn-winter season: yield by 20.8%, N accumulation by 25.5%, and K accumulation by 24.5%; Figure 5 and Figure 6).
For the spring-summer season in 2017, NPE presented a decreasing trend with irrigation amount increasing (W0.6S > W0.8S > W1.0S). NPE under W0.6 was increased by 4.3% and 10.4% compared to the treatment of W0.8 and W1.0, respectively. However, NPE during the autumn-winter season showed a decreasing and then increasing trend with the increase of irrigation amount (W0.6S > W1.0S > W0.8S). NPE under W0.6 was increased by 6.5% and 5.8% compared to the treatment of W0.8 and W1.0, respectively. In addition, KPE during the spring-summer season presented a decreasing and then increasing trend with increase of irrigation amount (W0.6S > W1.0S > W0.8S). KPE under W0.6 was increased by 6.5% and 5.9% compared to the treatment of W0.8 and W1.0, respectively. KPE during the autumn-winter season presented a decreasing trend as irrigation amount increasing (W0.6S > W0.8S > W1.0S). KPE under W0.6 was increased by 5.9% and 6.3% compared to the treatment of W0.8 and W1.0, respectively. Severe deficit irrigation (W0.6) increased NPE and KPE compared to full irrigation, which were in agreement with the previous study [15]. These results provided evidence that a mode with a small amount and high frequency of irrigation could be a suitable schedule under the condition of drip irrigation for improving nutrient production efficiency and reducing the risk of environmental pollution [11].
3.5. Fruit Quality
For the autumn-winter season in 2017, aeration had a slight and positive impact on tomato fruit quality, and the increasing rate of total soluble solids, lycopene, vitamin C, soluble sugar, organic acid, and sugar-acid ratio was 4.7%, 9.4%, 5.5%, 14.3%, 8.5%, and 6.8% than the control, respectively (Table 3), which was similar to previous results [6,37].
Moreover, high irrigation level decreased tomato fruit quality compared to low irrigation level, and the difference was significant for lycopene (p < 0.05, Table 3). With respect to W0.6S, total soluble solids, lycopene, vitamin C, soluble sugar, organic acid, and sugar-acid ratio was 2.4%, 22.3%, 5.1%, 3.9%, 2.8%, and 1.8% lower under W0.8S, and each parameter was 4%, 29.3%, 11.8%, 8.9%, 2.8%, and 7.1% lower under W1.0S, respectively. As interpreted by Agbna et al. [4], the improvement of fruit quality under low irrigation is ascribed to the tomato fruit being the strongest sink for assimilated nutrients among the plant’s organs (Figure 5). When low irrigation amount was applied during the tomato growing period, the plant would control some metabolic activities, such as osmotic adjustment, to preferentially re-allocate more sucrose to the sink organs and to increase the organic acid transformation rate [4]. As a result, the gradient of sucrose concentration between the leaves and fruits would increase under water deficit [38]. Hence, more assimilates were directed into the fruits, enhancing the tomato fruit parameters [4].
3.6. Optimal Management for Greenhouse Tomato Cultivations
Above all, we could conclude that AI played a positive role in crop growth, production, IWUE, and fruit quality. Irrigation had a positive effect on crop growth and production while had a negative impact on IWUE and fruit quality (Figure 3, Figure 4 and Figure 6; Table 3). To balance multiple objectives of high yield by farmers, high quality by customers, and high IWUE for sustainable development of agriculture [15], the entropy method in this study was adopted to solve multi-objective decision-making problems among treatments.
The weight of each index for the autumn-winter season, calculated by entropy method, was shown in Figure 9. Similar analytical method was adopted for the spring-summer season (data not shown). As can be seen in Table 4, a comprehensive evaluation of crop growth, nutrient uptake, yield, and IWUE during the spring-summer season from good to bad was in order of W1.0O > W0.8O > W0.6O > W1.0S > W0.8S > W0.6S, while a comprehensive evaluation when synchronously taking tomato fruit quality into account during the autumn-winter season from good to bad was in order of W1.0O > W0.6O > W0.8O > W1.0S > W0.6S > W0.8S. These results suggested that the treatment of W1.0O could be recommended as an appropriate way for greenhouse tomato cultivations when synthetically considering the trade-off amongst yield by farmers, fruit quality by customers and IWUE for sustainable development of agriculture. The result of recommended schedule management was in line with previous study when taking greenhouse effect and tomato yield into account [19]. In the following research, a comprehensive evaluation of soil-plant-atmosphere combined with economic aspects should be performed for more objectives by makers.
4. Conclusions
Our results showed that aeration significantly enhanced total dry weight at harvest, total N and K accumulation, tomato yield, and irrigation water use efficiency. Irrigation had a significant effect on improving total dry weight at harvest, total N and K accumulation, and tomato yield, while irrigation water use efficiency was reduced significantly as irrigation amount increased. Aeration and irrigation had slight effects on promoting plant height and stem diameter. Aeration positively impacted fruit quality while irrigation had a negative impact. Considering the trade-off amongst yield by farmers, fruit quality by customers, and water use efficiency for sustainable development of agriculture, full irrigation with aeration could be recommended as an appropriate way for greenhouse tomato cultivations in Northwest China. This study provides an irrigation model with high yield, high quality, and high water use efficiency for the planting of tomato and also provides a new theoretical basis for the sustainable utilization, optimization, and management of greenhouse soil in this area.
Author Contributions
Conceptualization, H.C. and H.-J.C.; methodology, H.C. and H.-J.C.; software, H.C. and Z.-H.S.; validation, H.-J.C.; formal analysis, H.C.; investigation, Z.-H.S., Y.Z. and H.-J.C.; resources, H.-J.C.; data curation, H.C.; writing—original draft preparation, H.C.; writing—review and editing, H.C.; visualization, Z.-H.S., Y.Z. and H.-J.C.; supervision, H.-J.C.; project administration, H.-J.C.; funding acquisition, H.-J.C.
Funding
This work was supported by the National Key Research and Development Program of China (2016YFC0400201) and the National Natural Science of China (51309192).
Conflicts of Interest
The authors declare no conflict of interest.
References
- Sánchez-Moreno, C.; Plaza, L.; De Ancos, B.; Cano, M.P. Nutritional characterisation of commercial traditional pasteurised tomato juices: Carotenoids, vitamin C and radical-scavenging capacity. Food Chem. 2006, 98, 749–756. [Google Scholar] [CrossRef]
- FAOSTAT: Food and Agriculture Organization of the United Nations, Statistical Data; FAO: Rome, Italy, 2017.
- Bradford, J. Physiological responses of plants to waterlogging. HortScience 1981, 16, 25–30. [Google Scholar]
- Agbna, G.H.D.; She, D.; Liu, Z.; Elshaikh, N.A.; Shao, G.; Timm, L.C. Effects of deficit irrigation and biochar addition on the growth, yield, and quality of tomato. Sci. Hortic. 2017, 222, 90–101. [Google Scholar] [CrossRef]
- Bhattarai, S.P.; Pendergast, L.; Midmore, D.J. Root aeration improves yield and water use efficiency of tomato in heavy clay and saline soils. Sci. Hortic. 2006, 108, 278–288. [Google Scholar] [CrossRef]
- Zhu, Y.; Cai, H.J.; Song, L.B.; Chen, H. Impacts of oxygation on plant growth, yield and fruit quality of tomato. Trans. Chin. Soc. Agric. Mach. 2017, 48, 199–211. (In Chinese) [Google Scholar]
- Li, Y.; Niu, W.; Wang, J.; Liu, L.; Zhang, M.; Xu, J. Effects of artificial soil aeration volume and frequency on soil enzyme activity and microbial abundance when cultivating greenhouse tomato. Soil Sci. Soc. Am. J. 2016, 80, 1208–1221. [Google Scholar] [CrossRef]
- Bai, T.; Li, C.; Li, C.; Liang, D.; Ma, F. Contrasting hypoxia tolerance and adaptation in Malus species is linked to differences in stomatal behavior and photosynthesis. Physiol. Plant. 2013, 147, 514–523. [Google Scholar] [CrossRef]
- Li, Y.; Niu, W.; Xu, J.; Wang, J.; Zhang, M.; lv, W. Root morphology of greenhouse produced muskmelon under sub-surface drip irrigation with supplemental soil aeration. Sci. Hortic. 2016, 201, 287–294. [Google Scholar] [CrossRef]
- Du, Y.D.; Niu, W.Q.; Gu, X.B.; Zhang, Q.; Cui, B.J.; Zhao, Y. Crop yield and water use efficiency under aerated irrigation: A meta-analysis. Agric. Water Manag. 2018, 210, 158–164. [Google Scholar] [CrossRef]
- Xing, Y.; Zhang, F.; Zhang, Y.; Li, J.; Qiang, S.; Li, Z.; Gao, X. Irrigation and fertilization coupling of drip irrigation under plastic film promotes tomato’s nutrient uptake and growth. Trans. CSAE 2014, 30, 70–80. (In Chinese) [Google Scholar]
- Cantore, V.; Lechkar, O.; Karabulut, E.; Sellami, M.H.; Albrizio, R.; Boari, F.; Stellacci, A.M.; Todorovic, M. Combined effect of deficit irrigation and strobilurin application on yield, fruit quality and water use efficiency of “cherry” tomato (Solanum lycopersicum L.). Agric. Water Manag. 2016, 167, 53–61. [Google Scholar] [CrossRef]
- Intrigliolo, D.S.; Bonet, L.; Nortes, P.A.; Puerto, H.; Nicolas, E.; Bartual, J. Pomegranate trees performance under sustained and regulated deficit irrigation. Irrig. Sci. 2013, 31, 959–970. [Google Scholar] [CrossRef]
- Wang, X.; Yun, J.; Shi, P.; Li, Z.; Li, P.; Xing, Y. Root growth, fruit yield and water use efficiency of greenhouse grown tomato under different irrigation regimes and nitrogen levels. J. Plant Growth Regul. 2019, 38, 400–415. [Google Scholar] [CrossRef]
- Wang, H.; Li, J.; Cheng, M.; Zhang, F.; Wang, X.; Fan, J.; Wu, L.; Fang, D.; Zou, H.; Xiang, Y. Optimal drip fertigation management improves yield, quality, water and nitrogen use efficiency of greenhouse cucumber. Sci. Hortic. 2019, 243, 357–366. [Google Scholar] [CrossRef]
- Hou, M.; Lin, Z.; Chen, J.; Zhai, Y.; Jin, Q.; Zhong, F. Optimization on the buried depth of subsurface drainage under greenhouse condition based on entropy evaluation method. Entropy 2018, 20, 859. [Google Scholar] [CrossRef]
- Li, S.; Li, Y.; Li, X.; Tian, X.; Zhao, A.; Wang, S.; Wang, S.; Shi, J. Effect of straw management on carbon sequestration and grain production in a maize-wheat cropping system in Anthrosol of the Guanzhong Plain. Soil Till Res. 2016, 157, 43–51. [Google Scholar] [CrossRef]
- Hou, H.; Chen, H.; Cai, H.; Yang, F.; Li, D.; Wang, F. CO2 and N2O emissions from Lou soils of greenhouse tomato fields under aerated irrigation. Atmos. Environ. 2016, 132, 69–76. [Google Scholar] [CrossRef]
- Chen, H.; Hou, H.; Hu, H.; Shang, Z.; Zhu, Y.; Cai, H.; Qaisar, S. Aeration of different irrigation levels affects net global warming potential and carbon footprint for greenhouse tomato systems. Sci. Hortic. 2018, 242, 10–19. [Google Scholar] [CrossRef]
- Chen, H.; Shang, Z.; Cai, H.; Zhu, Y. Response of soil N2O emissions to soil microbe and enzyme activities with aeration at two irrigation levels in greenhouse tomato (Lycopersicon esculentum Mill.) fields. Atmosphere 2019, 10, 72. [Google Scholar] [CrossRef]
- Zou, X.; Niu, W.; Liu, J.; Li, Y.; Liang, B.; Guo, L.; Guan, Y. Effects of residual mulch film on the growth and fruit quality of tomato (Lycopersicon esculentum Mill.). Water Air Soil Poll 2017, 228, 71. [Google Scholar] [CrossRef]
- Bao, S.D. Soil and Agricultural Chemistry Analysis; China Agricultural Press: Beijing, China, 2000. (In Chinese) [Google Scholar]
- AOAC. Official Methods of Analysis, 16th ed.; 5th Reversion. Method 942.15 and 967.21; AOAC International: Gaithersburg, MD, USA, 1999. [Google Scholar]
- Zhong, F.; Hou, M.; He, B.; Chen, I. Assessment on the coupling effects of drip irrigation and organic fertilization based on entropy weight coefficient model. Peer J. 2017, 5, 3855. [Google Scholar] [CrossRef]
- Yu, C.L.; Hui, D.; Deng, Q.; Kudjo, D.E.; Fay, P.A.; Shen, W.; Luo, Y. Responses of switchgrass soil respiration and its components to precipitation gradient in a mesocosm study. Plant Soil 2017, 420, 105–117. [Google Scholar] [CrossRef]
- Chen, H.; Hou, H.; Wang, X.; Zhu, Y.; Saddique, Q.; Wang, Y.; Cai, H. The effects of aeration and irrigation regimes on soil CO2 and N2O emissions in a greenhouse tomato production system. J. Integr. Agric. 2018, 17, 449–460. [Google Scholar] [CrossRef]
- Erice, G.; Irigoyen, J.J.; Perez, P.; Martínez-Carrasco, R.; Sanchez-Diaz, M. Effect of elevated CO2, temperature and drought on dry matter partitioning and photosynthesis before and after cutting of nodulated alfalfa. Plant Sci. 2006, 170, 1059–1067. [Google Scholar] [CrossRef]
- Van Iersel, M. Nutrient solution concentration affects shoot:root ratio, leaf area ratio, and growth of subirrigated Salvia (Salvia splendens). HortScience 2004, 39, 49–54. [Google Scholar]
- Bhattarai, S.P.; Midmore, D.J.; Pendergast, L. Yield, water-use efficiencies and root distribution of soybean, chickpea and pumpkin under different subsurface drip irrigation depths and oxygation treatments in vertisols. Irrig. Sci. 2008, 26, 439. [Google Scholar] [CrossRef]
- Sánchez-Rodríguez, E.; Romero, L.; Ruiz, J.M. Role of grafting in resistance to water stress in tomato plants: Ammonia production and assimilation. J. Plant Growth Regul. 2013, 32, 831–842. [Google Scholar] [CrossRef]
- Xu, F.; Li, J.; Wu, P.; Zhang, D.; Zhao, Z.; Li, J. Effects of water on dry matter accumulation and nutrition absorption of tomato seedling under sub-low temperature. Sci. Agric. Sin. 2013, 46, 3293–3304. (In Chinese) [Google Scholar]
- Bowles, T.M.; Barrios-Masias, F.H.; Carlisle, E.A.; Cavagnaro, T.R.; Jackson, L.E. Effects of arbuscular mycorrhizae on tomato yield, nutrient uptake, water relations, and soil carbon dynamics under deficit irrigation in field conditions. Sci. Total Environ. 2016, 566–567, 1223–1234. [Google Scholar] [CrossRef]
- Zaman, M.M.; Anawarul Huq, A.S.M.; Chowdhury, M.J.A. Production potentiality of summer tomato in Jamalpur region. Int. J. Sustain. Crop Prod. 2006, 1, 12–15. [Google Scholar]
- Zaman, M.; Hemel, R.A.; Ferdous, T. Comparative profitability of winter vegetables in a selected area of Dhaka district. ASA Univ. Rev. 2010, 4, 217–223. [Google Scholar]
- Liu, C.; Rubæk, G.H.; Liu, F.; Andersen, M.N. Effect of partial root zone drying and deficit irrigation on nitrogen and phosphorus uptake in potato. Agric. Water Manag. 2015, 159, 66–76. [Google Scholar] [CrossRef]
- Giuliani, M.M.; Gatta, G.; Nardella, E.; Tarantino, E. Water saving strategies assessment on processing tomato cultivated in Mediterranean region. Ital. J. Agron. 2016, 10, 69–76. [Google Scholar] [CrossRef]
- Li, Y.; Niu, W.Q.; Dyck, M.; Wang, J.W.; Zou, X.Y. Yields and nutritional of greenhouse tomato in response to different soil aeration volume at two depths of subsurface drip irrigation. Sci. Rep. 2016, 6, 39307. [Google Scholar] [CrossRef] [PubMed]
- Qi, H.; Li, T.; Zhang, J.; Wang, L.; Chen, Y. Effects of irrigation on sucrose metabolism, dry matter distribution and fruit quality of tomato under water deficit. Zhongguo Nong Ye Ke Xue 2004, 37, 1045–1049. [Google Scholar]
Figure 1.
Monthly maximum, mean, and minimum air temperatures throughout the two growing seasons inside the greenhouse.
Figure 1.
Monthly maximum, mean, and minimum air temperatures throughout the two growing seasons inside the greenhouse.

Figure 2.
Process of irrigation application during the spring-summer season (a) and the autumn-winter season (b) in 2017. W0.6, W0.8, and W1.0 meant the irrigation level of 60%, 80%, and 100% of full irrigation, respectively.
Figure 2.
Process of irrigation application during the spring-summer season (a) and the autumn-winter season (b) in 2017. W0.6, W0.8, and W1.0 meant the irrigation level of 60%, 80%, and 100% of full irrigation, respectively.

Figure 3.
Seasonal changes of plant height and stem diameter of tomato. W0.6O, W0.6S, W0.8O, W0.8S, W1.0O, and W1.0S meant 60% of full irrigation with aeration, 60% of full irrigation with the control, 80% of full irrigation with aeration, 80% of full irrigation with the control, 100% of full irrigation with aeration, 100% of full irrigation with the control, respectively. The same as below.

Figure 4.
Seasonal changes of dry weight in tomato organs. The number 1, 2, 3, 4, 5, and 6 represented treatment of W0.6O, W0.6S, W0.8O, W0.8S, W1.0O, and W1.0S, respectively.
Figure 4.
Seasonal changes of dry weight in tomato organs. The number 1, 2, 3, 4, 5, and 6 represented treatment of W0.6O, W0.6S, W0.8O, W0.8S, W1.0O, and W1.0S, respectively.

Figure 5.
Seasonal changes of N and K accumulation in tomato organs. Different letters indicate significant differences among treatments at p < 0.05. The same as below.
Figure 5.
Seasonal changes of N and K accumulation in tomato organs. Different letters indicate significant differences among treatments at p < 0.05. The same as below.

Figure 6.
Seasonal changes of tomato yield and irrigation water use efficiency (IWUE).

Figure 7.
Relationship between tomato yield and irrigation amount.

Figure 8.
Seasonal changes of nitrogen production efficiency (NPE) and potassium production efficiency (KPE).
Figure 8.
Seasonal changes of nitrogen production efficiency (NPE) and potassium production efficiency (KPE).

Figure 9.
Hierarchy model and final result of greenhouse tomato cultivation during the autumn-winter season in 2017. The number meant the weight of each index by entropy method.
Figure 9.
Hierarchy model and final result of greenhouse tomato cultivation during the autumn-winter season in 2017. The number meant the weight of each index by entropy method.


Table 1.
Differences in plant height, stem diameter, total dry weight, total N and K accumulation, yield and IWUE of tomato among the irrigation, aeration, and season.
Table 1.
Differences in plant height, stem diameter, total dry weight, total N and K accumulation, yield and IWUE of tomato among the irrigation, aeration, and season.
| Factor | Analysis of Variance (p Value) | ||||||
|---|---|---|---|---|---|---|---|
| Plant Height | Stem Diameter | Total Dry Weight | N Accumulation | K Accumulation | Yield | IWUE | |
| I | 0.443 | 0.487 | 0.000 ** | 0.000 ** | 0.000 ** | 0.000 ** | 0.000 ** |
| O | 0.427 | 0.164 | 0.000 ** | 0.000 ** | 0.000 ** | 0.000 ** | 0.000 ** |
| S | 0.000 ** | 0.000 ** | 0.000 ** | 0.000 ** | 0.000 ** | 0.000 ** | 0.410 |
| I × O | 0.448 | 0.295 | 0.055 | 0.019 * | 0.044 * | 0.374 | 0.974 |
| I × S | 0.364 | 0.646 | 0.249 | 0.001 ** | 0.009 ** | 0.191 | 0.726 |
| O × S | 0.646 | 0.728 | 0.609 | 0.050 * | 0.245 | 0.045 * | 0.546 |
| I × O × S | 0.459 | 0.903 | 0.271 | 0.511 | 0.186 | 0.736 | 0.926 |
Note: IWUE—irrigation water use efficiency. I—irrigation; O—aeration; S—season. *, **—significance at p < 0.05 and p < 0.01, respectively. The same as below.
Table 2.
Pearson correlation coefficients among tomato yield, plant height, stem diameter, total dry weight, total N and K accumulation.
Table 2.
Pearson correlation coefficients among tomato yield, plant height, stem diameter, total dry weight, total N and K accumulation.
| Yield | Plant Height | Stem Diameter | Total Dry Weight | N Accumulation | K Accumulation | |
|---|---|---|---|---|---|---|
| Yield | 1 | −0.791 ** | 0.911 ** | 0.993 ** | 0.986 ** | 0.967 ** |
| Plant Height | 1 | −0.971 ** | −0.796 ** | −0.728 ** | −0.638 * | |
| Stem Diameter | 1 | 0.914** | 0.866 ** | 0.799 ** | ||
| Total Dry Weight | 1 | 0.992 ** | 0.973 ** | |||
| N Accumulation | 1 | 0.989 ** | ||||
| K Accumulation | 1 |
Table 3.
Tomato fruit quality under the six treatments for the autumn-winter season in 2017.
| Treatment | Parameters | |||||
|---|---|---|---|---|---|---|
| Total Soluble Solids (%) | Lycopene (μg g−1) | Vitamin C (mg 100g−1) | Soluble Sugar (%) | Organic Acid (%) | Sugar-Acid Ratio | |
| W0.6O | 6.5a | 23.4a | 12.47a | 2.31a | 0.39a | 6a |
| W0.6S | 6.3a | 20.93a | 11.9ab | 2.03ab | 0.36a | 5.6a |
| W0.8O | 6.46a | 17.6b | 11.81ab | 2.22a | 0.38a | 5.8a |
| W0.8S | 6.15a | 16.27bc | 11.29ab | 1.95ab | 0.35a | 5.5a |
| W1.0O | 6.4a | 16bc | 11.25ab | 2.13ab | 0.38a | 5.6a |
| W1.0S | 6.05a | 14.8c | 10.5b | 1.85b | 0.35a | 5.2a |
| Analysis of Variance (p-value) | ||||||
| I | 0.064 | 0.033 * | 0.421 | 0.198 | 0.469 | 0.271 |
| O | 0.878 | 0.536 | 0.364 | 0.377 | 0.388 | 0.368 |
| I × O | 0.922 | 1.021 | 0.428 | 0.688 | 0.411 | 0.643 |
Table 4.
Comprehensive scores under the six treatments for the spring-summer and autumn-winter season in 2017.
Table 4.
Comprehensive scores under the six treatments for the spring-summer and autumn-winter season in 2017.
| Treatment | Spring-Summer Season | Autumn-Winter Season | ||
|---|---|---|---|---|
| Synthesis Score | Rank | Synthesis Score | Rank | |
| W0.6O | 0.461 | 3 | 0.632 | 2 |
| W0.6S | 0.132 | 6 | 0.218 | 5 |
| W0.8O | 0.59 | 2 | 0.582 | 3 |
| W0.8S | 0.184 | 5 | 0.156 | 6 |
| W1.0O | 0.879 | 1 | 0.77 | 1 |
| W1.0S | 0.33 | 4 | 0.285 | 4 |
© 2019 by the authors. Licensee MDPI, Basel, Switzerland. This article is an open access article distributed under the terms and conditions of the Creative Commons Attribution (CC BY) license (http://creativecommons.org/licenses/by/4.0/).
Share and Cite
MDPI and ACS Style
Chen, H.; Shang, Z.-H.; Cai, H.-J.; Zhu, Y. An Optimum Irrigation Schedule with Aeration for Greenhouse Tomato Cultivations Based on Entropy Evaluation Method. Sustainability 2019, 11, 4490. https://0-doi-org.brum.beds.ac.uk/10.3390/su11164490
AMA Style
Chen H, Shang Z-H, Cai H-J, Zhu Y. An Optimum Irrigation Schedule with Aeration for Greenhouse Tomato Cultivations Based on Entropy Evaluation Method. Sustainability. 2019; 11(16):4490. https://0-doi-org.brum.beds.ac.uk/10.3390/su11164490
Chicago/Turabian StyleChen, Hui, Zi-Hui Shang, Huan-Jie Cai, and Yan Zhu. 2019. "An Optimum Irrigation Schedule with Aeration for Greenhouse Tomato Cultivations Based on Entropy Evaluation Method" Sustainability 11, no. 16: 4490. https://0-doi-org.brum.beds.ac.uk/10.3390/su11164490
Note that from the first issue of 2016, this journal uses article numbers instead of page numbers. See further details here.