Article

Influence of Repeated Application of Wetting Agents on Soil Water Repellency and Microbial Community

1
Agriculture Development Group, INC., 2621 Ringold Rd, Eltopia, WA 99330, USA
2
School of Natural Resources, University of Missouri, Columbia, MO 65211, USA
3
Department of Forest Resources and Environmental Conservation, Virginia Polytechnic Institute and State University, Blacksburg, VA 24061, USA
4
Division of Plant Sciences, University of Missouri, Columbia, MO 65211, USA
*
Author to whom correspondence should be addressed.
Sustainability 2019, 11(16), 4505; https://0-doi-org.brum.beds.ac.uk/10.3390/su11164505
Submission received: 3 July 2019 / Revised: 12 August 2019 / Accepted: 15 August 2019 / Published: 20 August 2019

Abstract

:
Wetting agents are the primary tool used to control soil water repellency (SWR) and localized dry spot (LDS), especially on sand-based soils. However, the effect of repeated applications of wetting agents on soil microbial populations is unknown. This two-year field experiment investigated six wetting agents representing different chemistry effects on a creeping bentgrass (Agrostis stolonifera L.) putting green with existing SWR. Four out of the six wetting agents improved soil volumetric water content in the second growing season, while others showed no effect. This result was negatively correlated to the development of LDS, and positively correlated to occurrence of an air-borne turf disease. Soil microbial populations, determined by soil phospholipid fatty acid (PLFA) analysis, found that none of the treatments applied caused a shift in microbial populations between fungi and bacteria, or gram-positive and gram-negative bacteria. The stress indicators such as saturated to mono-unsaturated fatty acids were not affected by the wetting agents applied as well. However, the wetting agent that contains alkyl block polymers (ABP; Matador) with proven capability for removal of soil organic coatings showed inhibition of microbial populations at one evaluation timing. This result suggested a temporary restriction in soil carbon availability for soil microorganisms following repeated ABP application, which likely contributed to the elevated LDS development observed. Another wetting agent, a combined product of a nonionic surfactant plus acidifiers (NIS; pHAcid), which is designed to reduce inorganic carbonates while enhancing wetting, elevated all soil microbial populations tested at the end of the experiment, indicating a desirable improvement in soil health. However, repeated application of NIS did not reduce SWR at the conclusion of this experiment, which, in combination with a previous report, suggested a minimal disturbance of soil organic coatings of the hydrophobic sand. Overall, this experiment suggested that soil microbial populations can be affected by wetting agents which may further influence SWR, yet the actual effect on soil microorganisms varies depending on the chemistry of the wetting agents.

1. Introduction

Soil water repellency (SWR) is a common problem on intensively managed turfs, especially on sand-based growing media such as putting greens [1,2]. When SWR exists, water moves into the soil profile following preferential flow patterns, which leads to randomly distributed wetting fronts and development of localized dry spots (LDS). This issue is particularly problematic in sand media [3,4], primarily due to the large size yet small specific surface area of the sand particles. Due to this characteristic, sand is especially prone to be covered by soil organic matter (Figure 1), compared to smaller size minerals such as clay [1,5,6]. Consequently, these organic coatings reduce the surface free energy and increase soil hydrophobicity [7,8,9]. Although SWR has not been fully explained, previous studies have validated the crucial role of microbial decomposition of plant materials in forming soil hydrophobic organic coatings [7,10,11,12].
To manage SWR and prevent the development of LDS on putting greens, wetting agents are commonly applied as a part of the maintenance program on a regular basis. Wetting agents contain amphiphilic molecules with polar (hydrophilic) and nonpolar (hydrophobic) affinities [13] that form “bridges” between hydrophobic sand surfaces and water molecules in the soil and thus, improve wetting. Turf managers use wetting agents for different purposes, such as enhancing water infiltration, improving water retention, and promoting lateral water movement for uniformity of wetting. Numerous studies have investigated the direct impact of wetting agents on turf quality, and soil physical properties including water infiltration, wetting front stability, preferential flow, and the interactions with ponding depth and water entry pressure [3,4,14,15,16,17].
However, it is uncertain if wetting agent applications influence soil microbial populations, and hence soil and plant health. Karnok and Tucker [18] conducted a field study to investigate the effect of a fungicide, flutolanil, and a wetting agent through separate or mixed applications on a water repellent putting green. As expected, the wetting agent alone or in combination with the fungicide reduced SWR from severe to moderate levels after two applications. Interestingly, the flutolanil application alone also reduced the SWR to a moderate level, presumably due to reduced soil microbial activities, mainly fungi, and ultimately resulted in a reduction in soil hydrophobicity. This study again confirmed that any management practices that interfere with soil microbial populations need to be thoroughly investigated. Thus, this research aimed to investigate the potential impact of repeated wetting agent applications on turf performance, soil hydrophobicity, and soil microbial populations.

2. Materials and Methods

This two-year field experiment was carried out on a creeping bentgrass (Agrostis stolonifera L.) putting green at the University of Missouri South Farm Research Center in Columbia, MO, USA. The green was built based on the recommendations of the United States Golf Association for green construction [19]. Individual plots, measuring 1.5 by 1.5 m each, were established in areas where LDS had been previously observed. During the experiment, the green was mowed 5 days per week to 3.5 mm and fertilized every 3 weeks with 18 kg N ha−1 using a NO3-N based product between March to April and September to November. To prevent drought, plots were irrigated six times per week with 25 mm of water unless rainfall occurred.
In addition to an untreated control (UC), six treatments that represented different wetting agent chemistry were applied (Table 1). The wetting agents applied included products that contained alcohol ethoxylates (AE) (Cascade Plus; Precision Laboratories LLC, Waukegan, IL, USA), poloxanlene (PXL) (Hydro-Wet; KALO Inc., Overland Park, KS, USA), alkyl block polymer (ABP) (Matador; EnP Investments LLC., Mendota, IL, USA), polyoxyalkylene polymers (PoAP) (OARS, AQUA-AID Inc., Rocky Mount, NC, USA), nonionic surfactant (NIS) plus acidifiers (pHAcid, Numerator Technologies Inc., Sarasota, FL, USA), and alkyl polyglycoside (APG) (Tournament- Ready, KALO Inc., Overland Park, KS, USA). All treatments were applied monthly from May to September in 2015 and 2016 at the highest labeled rates (Table 1), using a backpack sprayer that delivered 0.04 L m−2 spray volume.
Changes in SWR were monitored monthly from May to October by the molarity of ethanol droplet (MED) test [20,21]. Specifically, five soil cores from the top 10 cm were collected randomly from each plot in each month before wetting agent application, and cores were air-dried at room temperature for 2 weeks. The MED tests were conducted by applying droplets with different ethanol concentrations on the soil core surface, and the ethanol solutions with the lowest molarity that penetrated the surface within 5 s were recorded as the final MED values. Other measurements included soil volumetric water content (VWC; %) that was determined by using a time domain reflectometry (TDR) (HydroSense System, Campbell Scientific Inc., Salt Lake City, UT, USA) with 12 cm probes. Visual assessment included LDS (%), and percent disease coverage (%) for dollar spot (Sclerotinia homoeocarpa F.T. Benn.) occurrence. Additionally, turf quality was assessed visually on 1 to 9 scale where 1 represented a total turf death, 9 indicated a perfect turf, and 6 was the minimum acceptable quality. Except for SWR, all measurements described above were recorded every other week throughout the growing season in both years.
At the end of the 2015, and the beginning and end of 2016 growing season, soil samples were collected for measurement of soil microbial community composition and diversity. This was carried out by randomly collecting five soil cores using a cup-cutter with 7.5-cm diameter and 10-cm depth. The soils were immediately separated from the thatch layers, passed through a 2-mm sieve, and mixed thoroughly before storing at −20 °C for future analysis. The microbial community was evaluated using soil phospholipid fatty acid (PLFA) analysis as described by Buyer and Sasser [22]. Briefly, soil samples between 2.0 to 2.5 g collected from each plot were freeze-dried before the total lipid contents were extracted and fractionated into glycol, neutral, and polar lipid fractions. The polar lipid fraction was trans-esterified by mild alkali into the form of fatty acid methyl esters. The recovered PLFA (methyl esters) were identified and quantified by an Agilent 6890 gas chromatograph (Agilent Technologies, Santa Clara, CA, USA) equipped with a flame ionizer detector. The chromatographic responses were converted to molar responses by an internal standard, and peaks were compared with a database of known microbial fingerprints for determination of the molar responses of taxonomic microbial groups. This included marker 16:1w5, 18:1w9, 18:1w9c, 18:2w6,9, 18:3w3, 18:3w6, and 18:3w6c for fungi [23,24], 16:1w5 and 18:2w6,9 for mycorrhizae [25] and 16:1w5 for arbuscular mycorrhizae fungi [26], 16:1w7, 16:1w7t, and 18:1w7 for aerobic and 15:1cy, 17:0cyc, and 19:0cyc for anaerobic bacteria [25], and 16:0Me10 and 17:0me10 for actinomycetes [25]. The PLFA concentrations of various microbial groups were calculated based on the mass of soil sample and reported as nmol g−1 soil [27].
All treatments were arranged in a randomized complete block design with four replications. Data collected were subjected to analysis of variance (ANOVA) using the Proc Glm procedure of SAS 9.4 (SAS Institute, Cary, NC, USA). Due to the detection of three-way interactions, data were analyzed separately for each year. Within the same year, data collected over time were analyzed as a split in time, and when it interacted with treatment, multiple comparisons were performed accordingly. When only the treatment main effect was detected, means were pooled over evaluation timings for comparison. Significant differences were separated based on Fisher’s Protected LSD at p < 0.05.

3. Results and Discussion

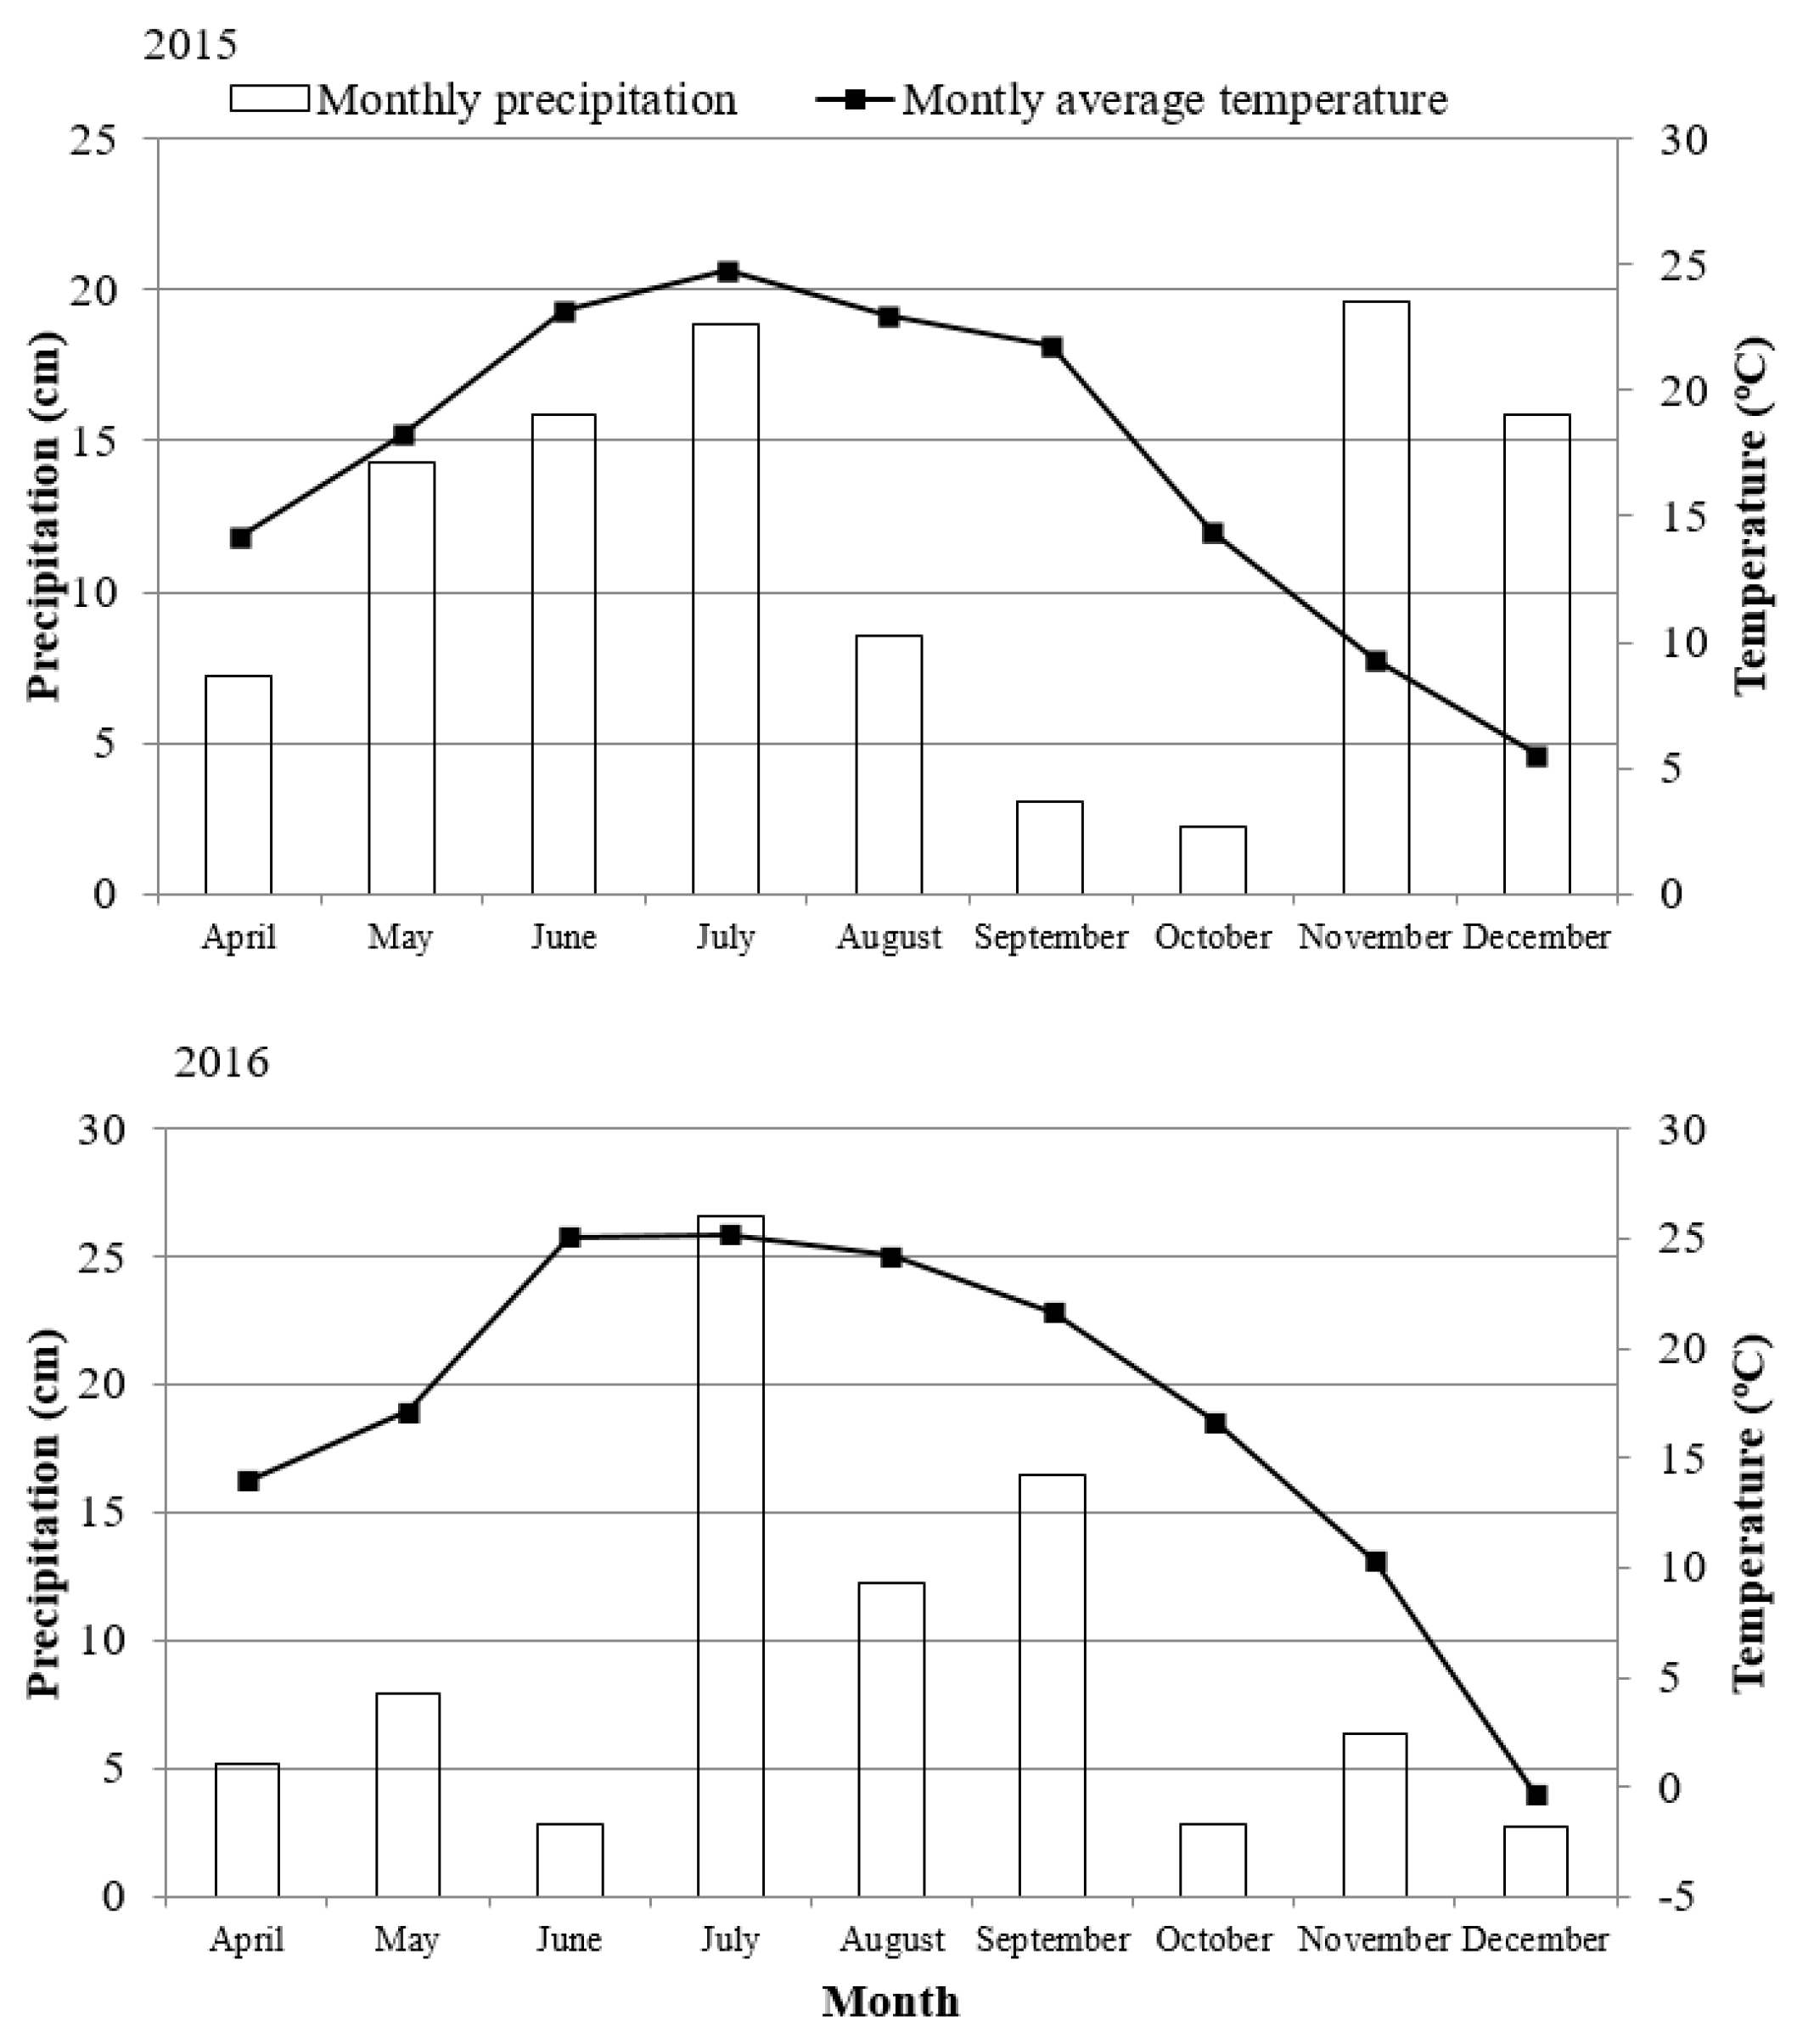
3.1. Weather Conditions

Air temperature and precipitation information in 2015 and 2016 were retrieved from a weather station located at the same research center where the field experiment took place. In both years, a similar temperature pattern was observed from April through December (Figure 2), although substantial variations in precipitation were found in the two years. Compared to 2016, there were nearly 50%, 100%, or 500% greater amounts of precipitation recorded in April, May, or June of 2015, respectively. While this study was initiated in mid-May and finished in mid-October, the wet condition in early summer of 2015 led to a relatively moist environment in the topsoil (12 cm), which likely minimized drought stress and hence, development of LDS. In the early summer of 2016, however, reduced precipitation likely enhanced the drought stress, which might have facilitated the occurrence of LDS. Subsequently, ANOVA revealed a significant interaction between year and treatments with respect to all parameters. Therefore, data were analyzed and presented separately by year.

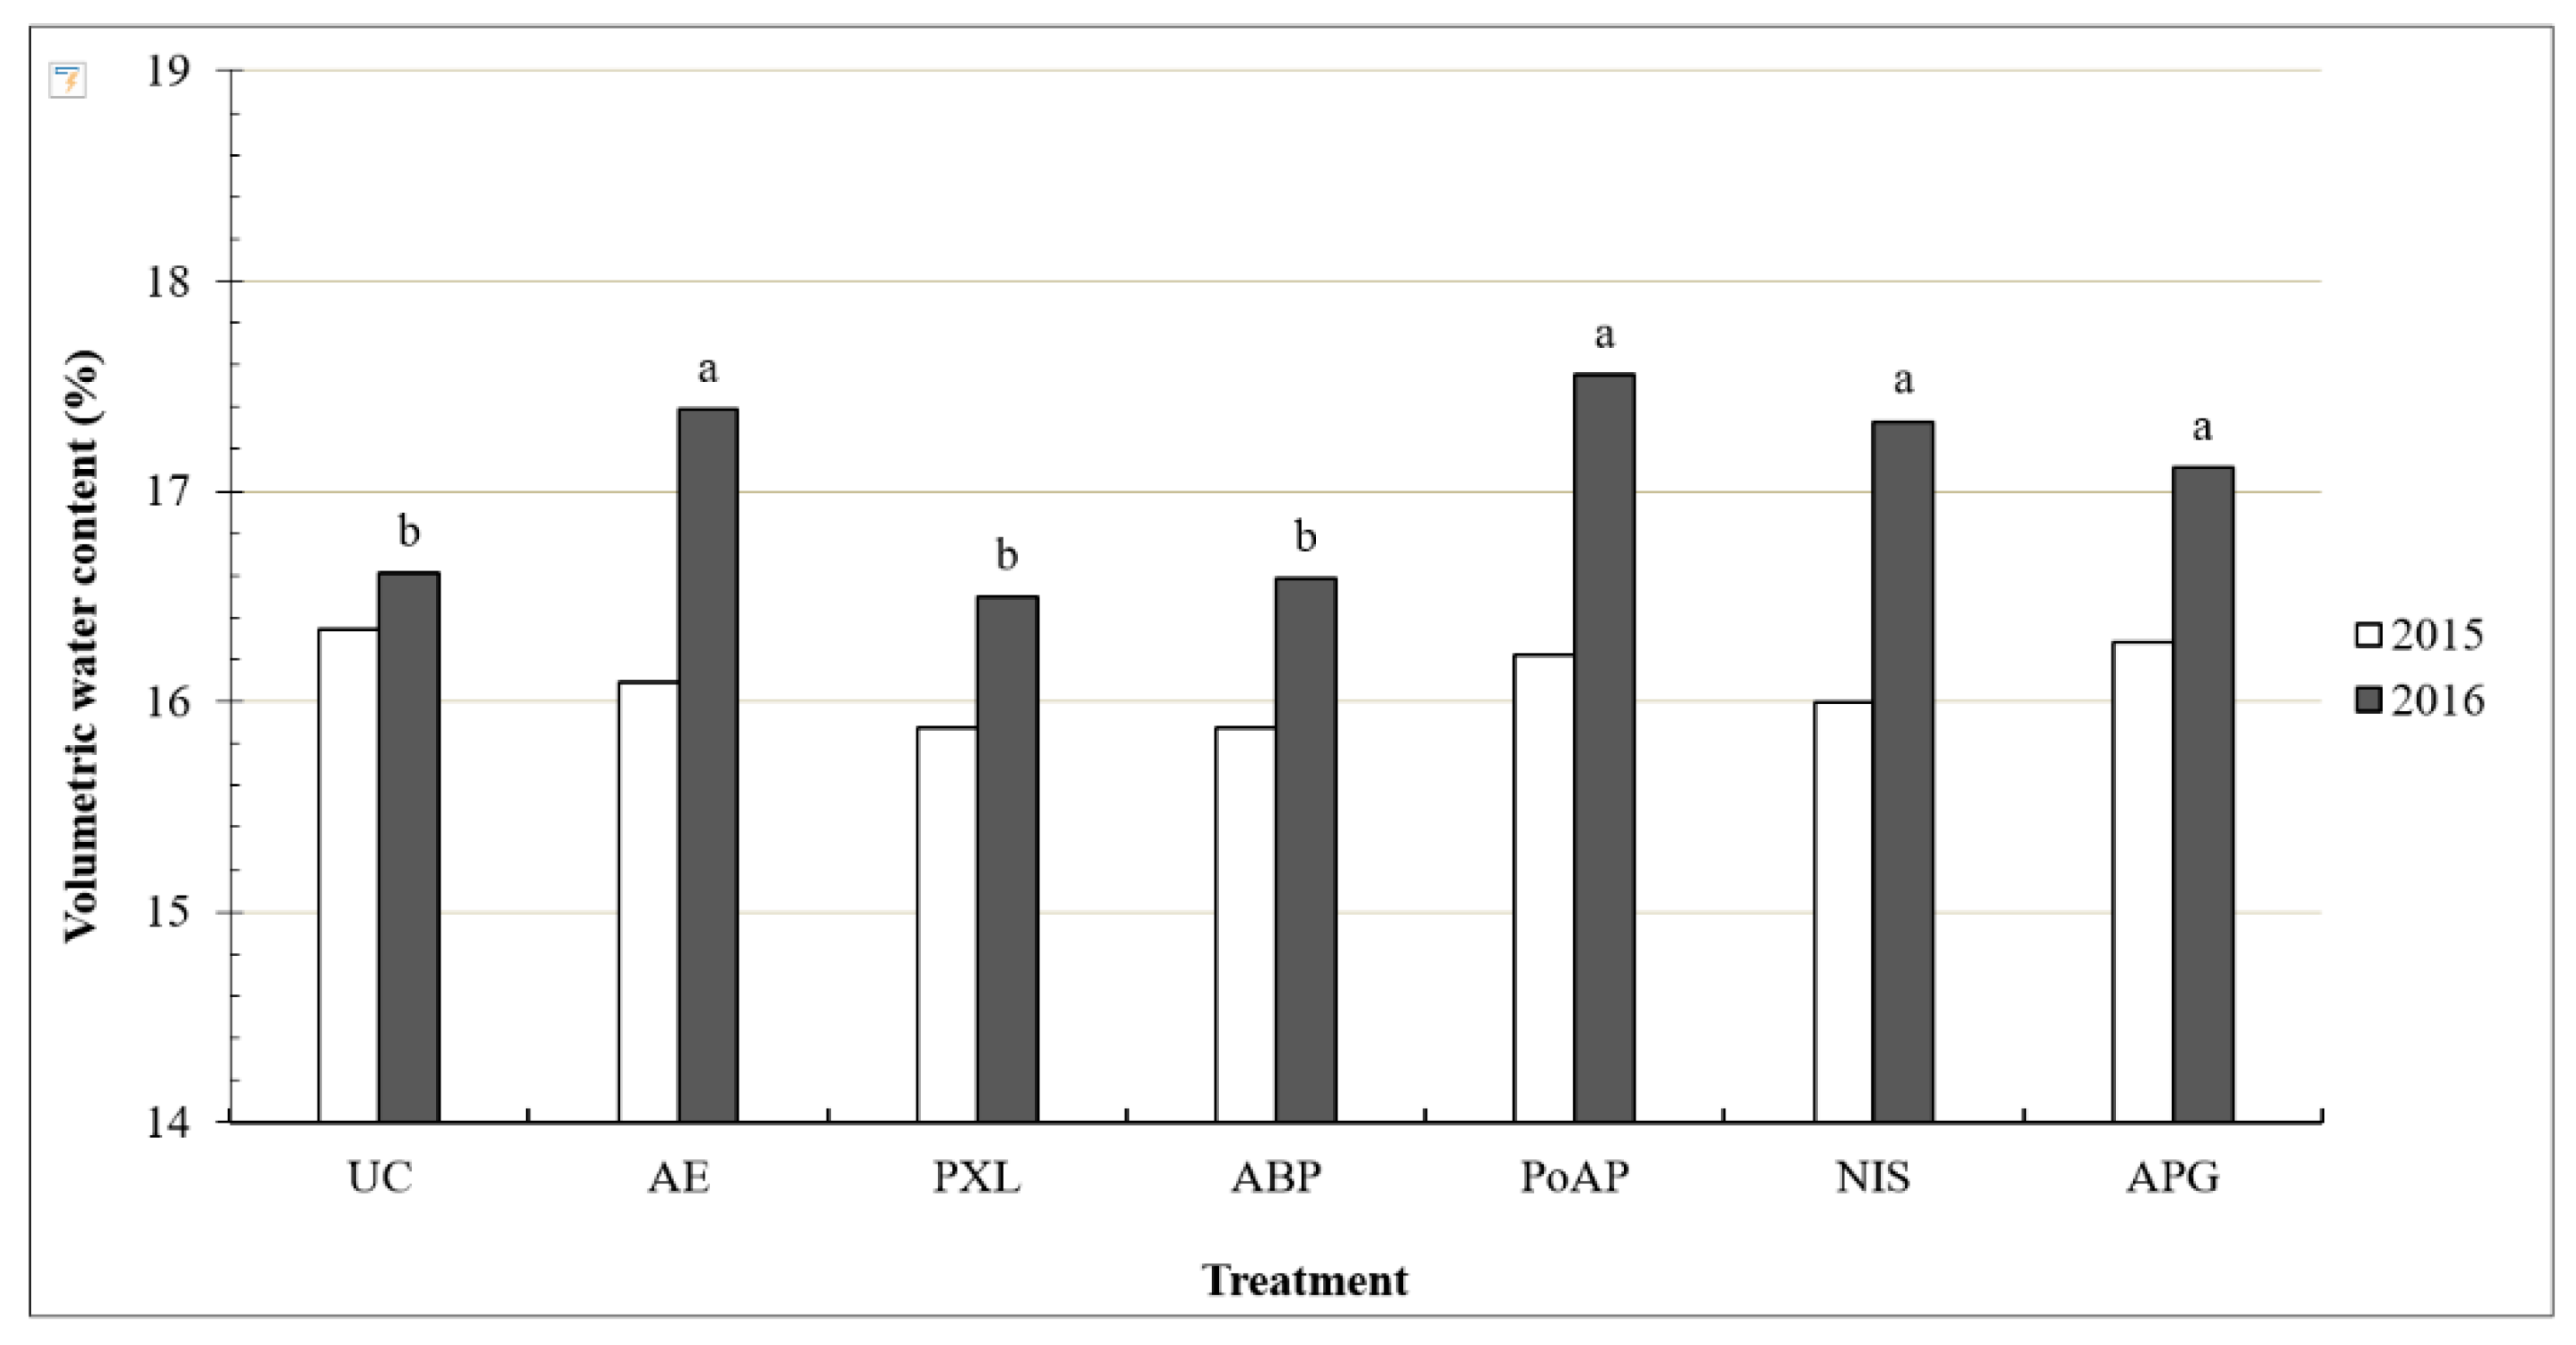
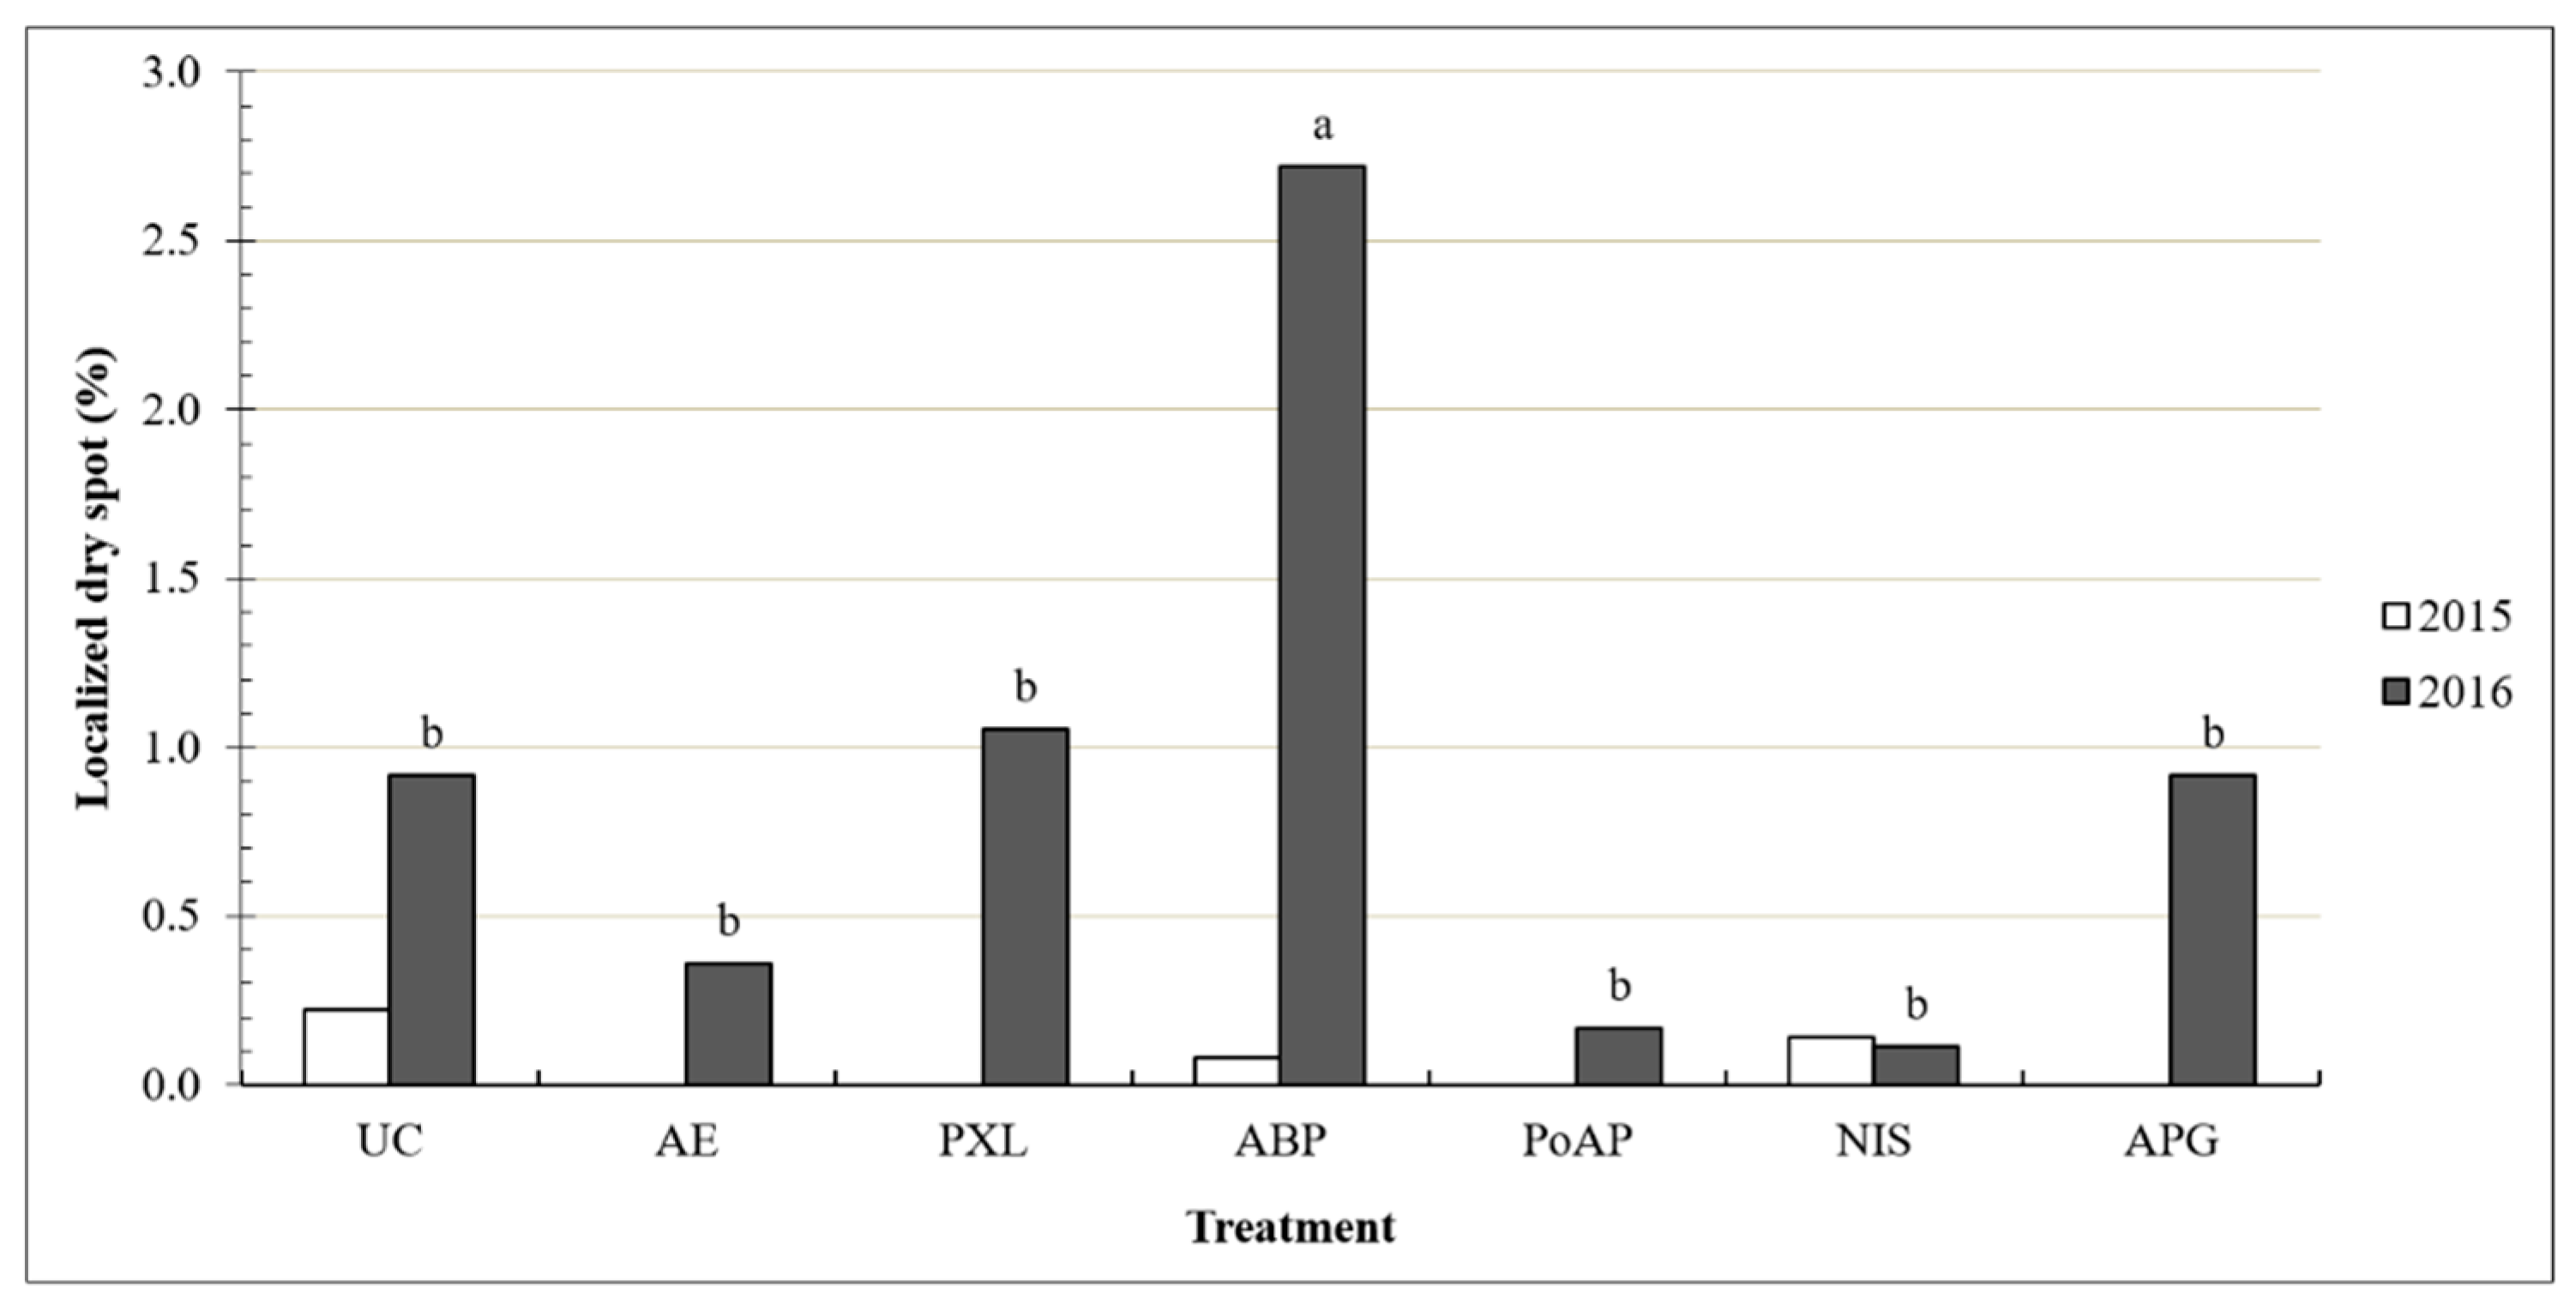
3.2. Soil VWC, LDS, and SWR

In 2015, soil VWC ranged between 15.9% and 16.3% in all plots (Figure 3). Treatments applied did not significantly affect soil water content, likely due to the abundant rainfall during the first four months of the growing season in 2015 (Figure 2). In 2016, however, monthly wetting agent applications significantly affected VWC. Among the six wetting agents evaluated, four wetting agents including AE, PoAP, NIS, and APG significantly increased the water content to 17.1% or above. In contrast, monthly applications of PXL or ABP did not significantly alter VWC relative to the UC.
Subsequently, LDS observed in 2015 was at a minimal level (0.2% or less) and was not influenced by the wetting agents (Figure 4). This is again, likely attributable to the abundance of precipitation received in 2015. In 2016, the plots receiving ABP experienced the only treatment that resulted in an elevated LDS at 2.7%, while the majority of other treatments maintained an LDS below 1%. A close examination revealed that another treatment, PXL, resulted in an LDS that was above 1%, while treatments with AE, PoAP, and NIS showed LDS at 0.4% or less. This result resembles the trend observed in soil VWC (Figure 3), where only PXL and ABP failed to improve soil VWC compared to the UC.
Soil hydrophobicity or SWR, measured by the MED test, showed a significant interaction between treatment and sampling timing in both years (Table 2). While SWR gradually built up in UC plots over time in the two years, wetting agent-treated plots generally showed a declining trend in SWR along with monthly treatment applications. The only exception was NIS-treated plots where the MED value maintained steady despite the treatment applied. In 2015, plots receiving AE, ABP, and PoAP consistently maintained lower MED values, especially between 3 and 5 months after the initial treatment (MAIT), which corresponded to August and October when less precipitation was recorded. These results indicated a superior effect of AE, ABP, and PoAP for SWR mitigation, compared to other wetting agents included in this experiment. Previous research reported that hydrophobic sands treated with certain wetting agents, such as AE, maintained their wettability for an extended period, compared with other compounds such as PXL [28].
In 2016, a similar trend was observed where treated plots, except plots receiving NIS, showed an overall declining SWR over time (Table 2). At 0 MAIT, all plots including the NC showed a sustainably lower SWR compared to the beginning of 2015. This is likely attributable to treatment applications in the previous season, as well as the cool conditions in late 2015 and early 2016 (Figure 2). Increased temperature and limited rainfall in May and June 2016 (0 and 1 MAIT) (Figure 2) likely induced drought conditions and led to increased SWR especially in plots receiving NIS and UC (Table 2). By the end of 2016 growing season, all treatments, except UC, NIS and APG, reduced MED to 2.2 or less, indicating a reduction of soil hydrophobicity from severe (MED ≥2.4) to moderate (MED ≤2.2) [20].
Although repeated application of ABP over two growing seasons reduced SWR (Table 2), soil VWC (Figure 3) and the control of LDS (Figure 4) was not improved compared to the control. ABP is formulated to remove soil organic carbon, and an earlier laboratory-based experiment reported that a single application of ABP followed by three distinct rinses removed 2.3-fold greater organic carbon in both dissolved and particulate forms in the leachates, compared to other wetting agents such as PoAP [29]. It is therefore likely, that frequent applications of ABP removed an excessive amount of soil organic carbon which resulted in a reduced water holding capacity and consequently, elevated the risk for drought development. This drought stress, related to reduced soil water retention, might be independent of the development of SWR. Therefore, this result suggests that, unlike other wetting agents commonly used, ABP use might need to be limited with less frequent applications.

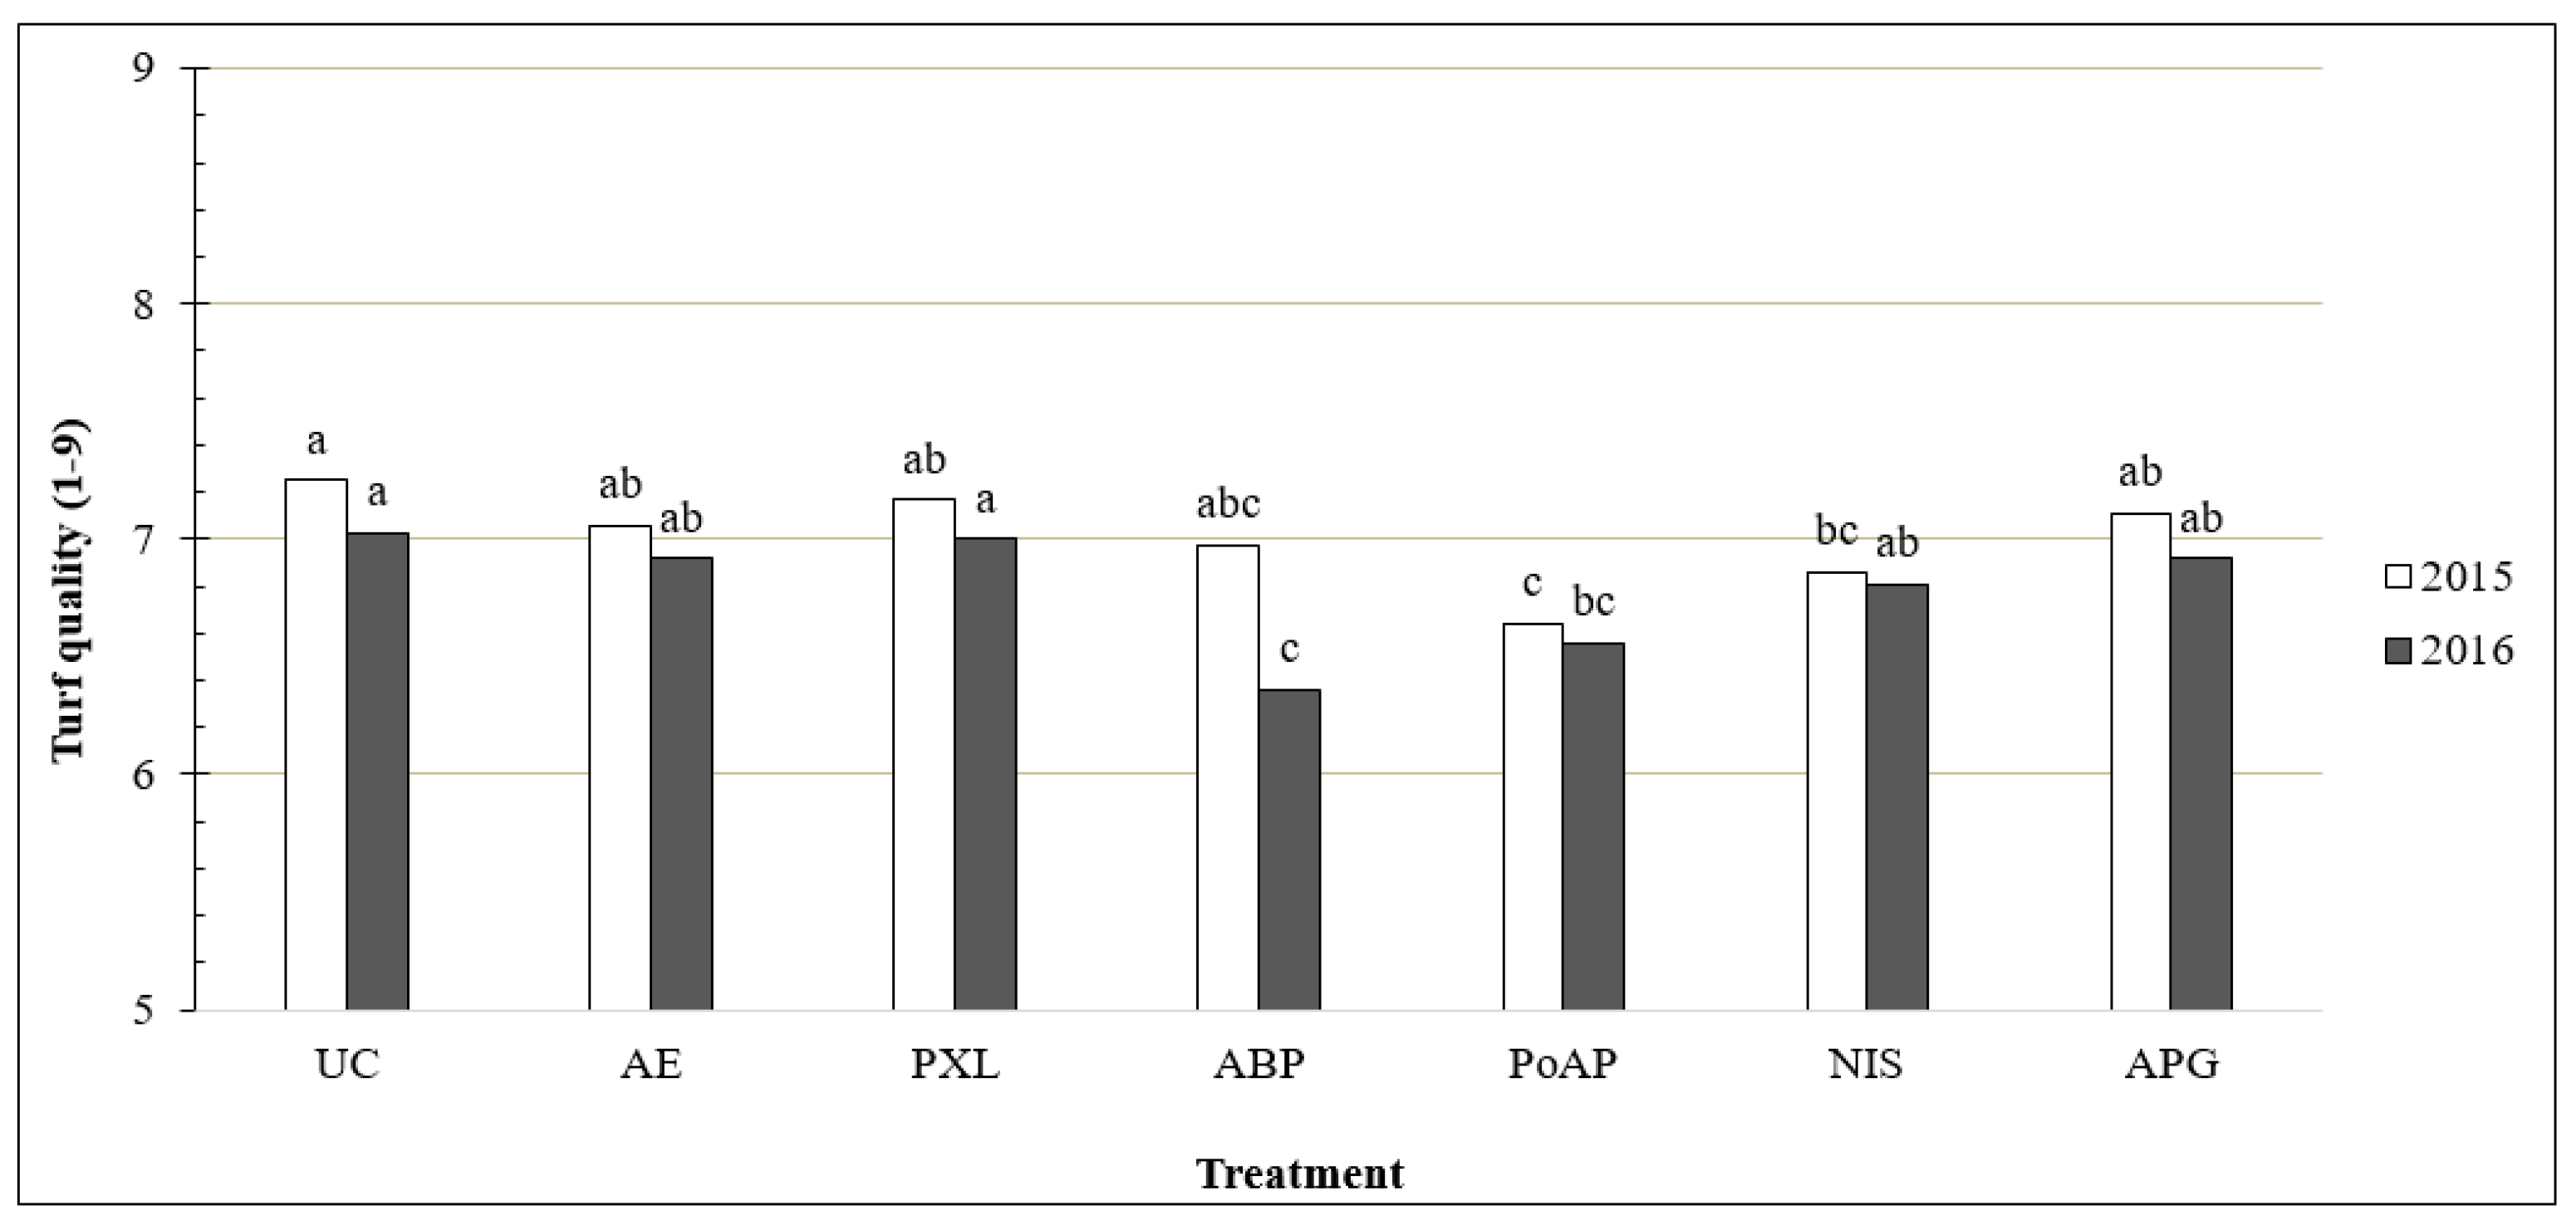
3.3. Disease and Turf Quality

During this experiment, occurrence of dollar spot, an air-borne pathogen that commonly infects creeping bentgrass was recorded. In both years, wetting agents applied resulted in either the same or significantly greater occurrence of dollar spot relative to the UC (Figure 5). Compared to the UC, wetting agents PXL, ABP, and APG did not increase dollar spot incidence. In contrast, applications with AE, and especially PoAP and NIS consistently induced greater dollar spot occurrence in both years. It was previously reported that increased precipitation led to elevated disease activities [30,31]. In this present study, plots that showed elevated dollar spot pressure demonstrated elevated soil moisture, and plots that had the same VWC as UC showed the same level of disease severity compared to the UC (Figure 3). This result is different from an early report where wetting agent application did not increase dollar spot intensity [32]. However, in this early report, only one wetting agent was tested and its effect on soil moisture was not directly determined [32]. Collectively, these results suggest that certain wetting agents, especially those that significantly improve soil moisture, might lead to elevated fungal disease for intensively managed turfgrass plants.
Subsequently, turf quality, which reflects the turf overall performance, showed a significant treatment main effect in both years (Figure 6). Although none of the treatments improved the turf quality compared to the UC, declined turf quality was found following applications of ABP, PoAP, and NIS in one or two years. These reductions in turf quality, although still acceptable (>6), were most likely caused by elevated LDS for plots treated with ABP (Figure 4), or increased disease pressure in plots receiving PoAP or NIS (Figure 5).

3.4. Soil Microbial Diversity and Community

To evaluate the effects of repeated wetting agent application on soil microbial diversity and communities, soil samples from the surface 10-cm depth were collected during October 2015, and May and October 2016 for PLFA analysis. These sampling timings were determined to capture possible changes in soil microbial populations at the end of the first growing season, and the beginning and end of the second growing season. Significant interactions between treatment and sampling timing on various soil microbial groups, including aerobic and anaerobic bacteria, actinomycetes, arbuscular mycorrhizae, mycorrhizae, and total bacteria were found (Table 3). The total PLFA, representing the overall microbial biomasses, were found to be significantly influenced by the interaction between treatment and sampling timing as well (Table 3).
Across the three sampling timings, all the tested microbial groups, with the exception of actinomycetes, showed a general trend where stable populations were maintained between October 2015 and May 2016, and then the populations increased significantly in October 2016, regardless of the wetting agents applied. It was known that moisture and temperature can be limiting factors for soil microbial growth due to constrained uptake of C and N [33,34,35,36]. Compared to 2015, October 2016 had an average temperature of 16.6 °C, higher than 14.4 °C in October 2015 (Figure 2). Between July and September 2016, a total of 55 cm of precipitation occurred, which was more than double the amount of precipitation received in the same period during 2015 (Figure 2). Collectively, the abundance of moisture and higher temperature likely boosted the soil microbial growth observed in October 2016 (Table 3).
Although treatments did not influence microbial populations at the end of 2015, plots receiving ABP consistently showed reduced microbial biomasses in May 2016, compared to UC and other treatments for all microbial groups except actinomycetes (Table 3). Wetting agent ABP is manufactured to break down organic coatings from hydrophobic soils, and a previous laboratory- based experiment revealed that one single application of ABP removed 6.9 times of particulate organic carbon in leachates, compared to the control where distilled deionized water was used [29]. In the same report, application of PoAP or NIS removed only 1.6 or 0.8 times of particulate organic carbon compared to the control, indicating minimal effect on soil organic matter. It is well recognized that soil micro-organisms mediate decomposition of plant residues and consume organic carbon for metabolism [37]. Therefore, the removal of soil organic carbon following five consecutive applications of ABP in 2015 might have restricted the microbial growth due to a declining available soil carbon pool. On the other hand, between May and September 2016, ABP was applied an additional five consecutive times. Most of the wetting agents contain organic compounds, and following each application, a certain amount of organic carbon is introduced to the rootzone soil. Based on an earlier report, five applications of ABP would have added 64 times more organic carbon to the plots, compared to the carbon that could have been removed in leachates [29]. This addition of a substantial amount of organic carbon following ABP applications likely created a sufficient although not readily available C source and may partially explain the rebounded soil microbial populations in ABP-treated plots observed a year later in October 2016 (Table 3).
In October 2016, plots receiving NIS consistently showed 110% to 122% increase in total microbial biomass in all functional groups, compared to the UC (Table 3). In addition to a nonionic surfactant, the NIS product contains a blend of acidifying agents. This unique combination is designed to enhance wetting while reducing soil pH and hence, to release Ca2+ and Mg2+ from inorganic carbonates that could otherwise, deposit rapidly in the soil and clog the soil pore spaces [38]. Removal of inorganic carbonates in the soil following NIS application improved the soil moisture as discussed above (Figure 3), which might have contributed to the increasing microbial biomass production observed. Despite the nonionic surfactant that this product contains, applications of NIS did not reduce SWR compared to the UC (Table 2). This result supports the early report that unlike other wetting agents tested, NIS application does not interact with the organic carbon in the soil [29]. Collectively, application of NIS might have created an environment that is beneficial for soil microorganisms, compared to other wetting agents applied.
Among all the microbial groups evaluated, actinomycetes are the only group that decreased in biomass from October 2015 to May 2016 in most wetting agent-treated plots, with the exception of PoAP and APG where actinomycete populations appeared to stay the same at both sampling times (Table 3). Actinomycetes are a group of filament-forming gram-positive bacteria that are abundant in soil. They are generally considered beneficial organisms for soil and plant health, as they play significant roles in decomposing organic matter, fixing nitrogen in certain woody plants, protecting plants from soil-borne pathogens such as Fusarium spp., and stimulating plant growth by producing auxin-forms of plant growth hormones [39]. Previous research also reported that some members of the actinomycetes, including Streptomyces spp., Rhodococcus spp., and Mycobacterium spp., reduced hydrophobic coatings and hence SWR [40], by metabolizing the wax coatings (Streptomyces spp. and Mycobacterium spp.) or producing bio-surfactants (Rhodococcus spp.) [40,41,42]. In this present study, a significantly lower MED was found in plots receiving PoAP collected in May 2016 (0 MAIT in 2016) (Table 2), supporting these findings. Although not fully understood, it is intriguing to discover that certain wetting agents, such as AE, PXL, ABP, and NIS, could inhibit actinomycetes in the soil.
It is important to point out that the wetting agents applied did not cause a shift in microbial groups between fungi and bacteria, or gram-positive (15:00, 15:00 all, 15:0a, 15:0i, 16:0Me 10, 16c alcohol, 17:0a, and 17:0i) to gram-negative (10:0B + 12:0b + 12c alcohol + 17:0cyc + 18:1w7c + 19:0cyc) bacteria. It was also revealed that none of the treatments applied created a constant sub-optimum environment for the soil microorganisms in the two years. This was determined by the fact that no significant stress indicators were found, such as ratios of cyclopropyl fatty acids to their monoenoic precursors (cy17:0 + cy19:0/16:1w7c + 18:1w7c), or saturated to mono-unsaturated fatty acids (sat/mono: 12:0 + 13:0 + 14:0 + 15:0 + 16:0 + 17:0 + 18:0 + 20:0/14:1w5c + 15:1w6c + 16:1w7c + 16:1w5c + 17:1w9c + 18:1w9c + 18:1w7c) [30,31].

4. Conclusions

This two-year field experiment revealed that the performance of wetting agents could vary substantially, due to their differences in chemistry. Despite the inconsistent weather pattern in the two years, certain wetting agents such as AE, PoAP, NIS, and APG maintained an overall higher soil moisture level compared to the control, while others including PXL and ABP showed no effect on soil water retention. This effect on soil moisture was found to be negatively correlated with the development of LDS, and positively correlated with the severity of an air-borne turf disease. Except for NIS and APG, all other wetting agents reduced SWR from severe to modest level, suggesting their effectiveness in mitigating soil hydrophobicity. During this two-year period, the tested wetting agents did not cause a shift in soil microbial populations, nor an overall adverse environment for the microorganisms. However, wetting agent ABP, which is capable of removing organic coatings from the sand surface, was found to cause a reduced biomass in most microbial groups at the beginning of the second growing season, suggesting a temporary restriction in the available soil carbon pool. Our data also suggested that frequent application of ABP might reduce water retention, and subsequently increase the risk of drought independent of the development of SWR. Another wetting agent NIS, which contains acidifying agents and is designed to remove inorganic carbonates, was found to boost all microbial populations tested by the end of the study. This result suggested that a desirable environment was created for the soil microbes, likely through a combined effect of soil water enhancement and a minimal disturbance in soil organic carbon following NIS applications. However, applications of NIS did not alleviate the SWR, and increased the occurrence of an air-borne fungal disease. In conclusion, this experiment discovered that wetting agents can have a significant impact on soil microbial populations though interferences of soil water condition and soil organic carbon, where both positive and negative influences on soil and plant health should be expected. Future research to investigate the long-term impact of wetting agent applications on SWR, soil organic materials, and soil microbial populations/diversity is needed.

Author Contributions

E.S. performed this research, collected data and developed the initial manuscript. X.P. assisted in PLFA analysis and data interpretation. R.J.K. provided instructions for soil health analysis. K.W.G. provided critical reviews in developing and performing this research, as well as manuscript preparation. S.H.A. assisted with calibration of root zone water content sensors and monitoring of soil water content data, as well as interpretation of root zone water repellency. X.X. conceived the experimental objectives and experimental design, and assisted in data analysis and interpretation, and manuscript development.

Funding

This research was supported by the National Institute of Food and Agriculture, U.S. Department of Agriculture, under award number 1006256. Partial funding was also received from the United States Golf Association (USGA).

Conflicts of Interest

The authors declare that there is no conflict of interest.

References

  1. Karnok, K.J.; Tucker, K.A. The cause and control of localized dry spots on bentgrass greens. Golf Course Manag. 1989, 57, 28–34. [Google Scholar]
  2. Wilkinson, J.F.; Miller, R.H. Investigation and treatment of localized dry spots on sand golf greens. Agron. J. 1978, 70, 299–304. [Google Scholar] [CrossRef]
  3. Nektarios, P.A.; Steenhuis, T.S.; Petrovic, A.M. Fingered flow in laboratory golf putting greens. J. Turfgrass Sci. 1999, 3, 53–67. [Google Scholar]
  4. Wang, Z.; Wu, L.; Wu, Q.J. Water-entry value as an alternative indicator of soil water-repellency and wettability. J. Hydrol. 2000, 231, 76–83. [Google Scholar] [CrossRef]
  5. Larsbo, M.; Aamlid, T.S.; Persson, L.; Jarvis, N. Fungicide leaching from golf greens: Effects of root zone composition and surfactant use. J. Environ. Qual. 2008, 37, 1527–1535. [Google Scholar] [CrossRef] [PubMed]
  6. Roberts, F.J.; Carbon, B.A. Water repellence in sandy soils of Southwestern Australia. II. Some chemical characteristics of hydrophobic skins. Austral. J. Soil Res. 1972, 10, 35–42. [Google Scholar] [CrossRef]
  7. Doerr, S.H.; Shakesby, R.A.; Walsh, R.P.D. Soil water repellency: Its causes, characteristics and hydro-geomorphological significance. Earth Sci. Rev. 2000, 51, 33–65. [Google Scholar] [CrossRef]
  8. Kern, K.; David, R.; Palmer, R.L.; Comsa, G. Complete wetting on ‘strong’ substrates: Xe/Pt (111). Phys. Rev. Lett. 1986, 56, 2823–2927. [Google Scholar] [CrossRef]
  9. Tucker, K.A.; Karnok, K.J.; Radcliffe, D.E.; Landry, G.; Roncadori, R.W.; Tan, K.H. Localized dry spots as caused by hydrophobic sands on bentgrass greens. Agron. J. 1990, 82, 549–555. [Google Scholar] [CrossRef]
  10. Czarnes, S.; Hallett, P.D.; Bengough, A.G.; Young, I.M. Root- and microbial-derived mucilages affect soil structure and water transport. Eur. J. Soil Sci. 2000, 51, 435–443. [Google Scholar] [CrossRef]
  11. Feeney, D.S.; Hallett, P.D.; Rodger, S.; Bengough, A.G.; White, N.A.; Young, I.M. Impact of fungal and bacterial biocides on microbial induced water repellency in arable soil. Geoderma 2006, 135, 72–80. [Google Scholar] [CrossRef]
  12. Sun, Y.; Unestam, T.; Lucas, S.D.; Johanson, K.J.; Kenne, L.; Finlay, R. Exudation-reabsorption in a mycorrhizal fungus, the dynamic interface for interaction with soil and soil microorganisms. Mycorrhiza 1999, 9, 137–144. [Google Scholar] [CrossRef]
  13. Müller, K.; Deurer, M. Review of the remediation strategies for soil water repellency. Agric. Ecosyst. Environ. 2011, 144, 208–221. [Google Scholar] [CrossRef]
  14. Carrillo, M.L.K.; Letey, J.; Yates, S.R. Unstable Water Flow in a Layered Soil: I. Effects of a Stable Water-Repellent Layer. Soil Sci. Soc. Am. J. 2000, 64, 450–455. [Google Scholar] [CrossRef]
  15. Feng, G.L.; Letey, J.; Wu, L. Water ponding depths affect temporal infiltration rates in a water repellent sand. Soil Sci. Soc. Am. J. 2001, 65, 315–320. [Google Scholar] [CrossRef]
  16. Ritsema, C.J.; Dekker, L.W.; Hendrickx, J.M.H.; Hamminga, W. Preferential flow mechanism in a water repellent sandy soil. Water Resour. Res. 1993, 29, 2183–2193. [Google Scholar] [CrossRef]
  17. Song, E.; Schneider, J.G.; Anderson, S.H.; Goyne, W.K.; Xiong, X. Wetting agent influence on water infiltration into hydrophobic sand: II. Physical properties. Agron. J. 2014, 106, 1879–1885. [Google Scholar] [CrossRef]
  18. Karnok, K.J.; Tucker, K.A. Effects of flutolanil fungicide and primer wetting agent on water repellent soil. HortTech 2001, 11, 437–440. [Google Scholar] [CrossRef]
  19. U.S. Golf Association. USGA Recommendations for a Method of Putting Green Construction; USGA: Far Hills, NJ, USA, 2004; Available online: https://www.usga.org/content/dam/usga/images/course-care/2004%20USGA%20Recommendations%20For%20a%20Method%20of%20Putting%20Green%20Cons.pdf (accessed on 19 August 2019).
  20. King, P.M. Comparison of methods for measuring severity of water repellence of sandy soils and assessment of some factors that affect measurement. Aust. J. Soil Res. 1981, 19, 275–285. [Google Scholar] [CrossRef]
  21. Watson, C.L.; Letey, J. Indices for characterizing soil-water repellency based upon contact angle-surface tension relationships. Soil Sci. Soc. Am. Proc. 1970, 34, 841–844. [Google Scholar] [CrossRef]
  22. Buyer, J.S.; Sasser, M. High throughput phospholipid fatty acid analysis of soils. Appl. Soil Ecol. 2012, 61, 127–130. [Google Scholar] [CrossRef]
  23. Frostegård, A.; Tunlid, A.; Bååth, E. Phospholipid Fatty Acid composition, biomass, and activity of microbial communities from two soil types experimentally exposed to different heavy metals. Appl. Environ. Microb. 1993, 59, 3605–3617. [Google Scholar]
  24. Frostegård, A.; Bååth, E. The use of phospholipid fatty acid analysis to estimate bacterial and fungal biomass in soil. Biol. Fertil. Soils. 1996, 22, 59–65. [Google Scholar] [CrossRef]
  25. Unger, I.M.; Goyne, K.W.; Kremer, R.J.; Kennedy, A.C. Microbial community diversity in agroforestry and grass vegetative filter strips. Agrofor. Syst. 2013, 87, 395–402. [Google Scholar] [CrossRef]
  26. Olsson, P.A. Signature fatty acids provide tools for determination of the distribution and interactions of mycorrhizal fungi in soil. FEMS Microbiol. Ecol. 1999, 29, 303–310. [Google Scholar] [CrossRef]
  27. Buyer, J.S.; Teasdale, J.R.; Roberts, D.P.; Zasada, I.A.; Maul, J.E. Factors affecting soil microbial community structure in tomato cropping systems. Soil Biol. Biochem. 2010, 42, 831–841. [Google Scholar] [CrossRef]
  28. Song, E.; Schneider, J.G.; Anderson, S.H.; Goyne, W.K.; Xiong, X. Wetting agent influence on water infiltration into hydrophobic sand: I. Rewettability. Agron. J. 2014, 106, 1873–1878. [Google Scholar] [CrossRef]
  29. Song, E.; Goyne, K.W.; Kremer, R.J.; Anderson, S.H.; Xiong, X. Surfactant chemistry effects on organic matter removal from water repellent sand. Soil Sci. Soc. Am. J. 2018, 82, 1252–1258. [Google Scholar] [CrossRef]
  30. Pan, X.; Richardson, M.D.; Deng, S.; Kremer, R.J.; English, J.E.; Mihail, J.D.; Sams, C.E.; Scharf, P.C.; Veum, K.S.; Xiong, X. Effect of organic amendment and cultural practice on large patch occurrence and soil microbial community. Crop Sci. 2017, 57, 2263–2272. [Google Scholar] [CrossRef]
  31. Fierer, N.; Schimel, J.P.; Holden, P.A. Variations in microbial community composition through two soil depth profiles. Soil Biol. Biochem. 2003, 35, 167–176. [Google Scholar] [CrossRef]
  32. Couch, H.B.; Bloom, J.R. Influence of environment on diseases of turf-grasses. II. Influence of nutrition, pH and soil moisture on Sclerotinia dollar spot. Phytopathology 1960, 50, 761–763. [Google Scholar]
  33. McDonald, S.J.; Dernoedern, P.H.; Bigelow, C.A. Dollar spot and gray leaf spot severity as influenced by irrigation, chlorothalonil, paclobutrazol and a wetting agent. Crop Sci. 2006, 46, 2675–2684. [Google Scholar] [CrossRef]
  34. Ren, C.; Chen, J.; Lu, X.; Doughty, R.; Zhao, F.; Zhong, Z.; Han, X.; Yang, G.; Feng, Y.; Ren, G. Responses of soil total microbial biomass and community compositions to rainfall reductions. Soil Biol. Biochem. 2018, 116, 4–10. [Google Scholar] [CrossRef]
  35. Mikan, C.J.; Schimel, J.P.; Doyle, A.P. Temperature controls of microbial respiration in arctic tundra soils above and below freezing. Soil Biol. Biochem. 2002, 34, 1785–1795. [Google Scholar] [CrossRef]
  36. Herron, P.M.; Stark, J.M.; Holt, C.; Hooker, T.; Cardon, Z.G. Microbial growth efficiencies across a soil moisture gradient assessed using 13C-acetic acid vapor and 15N-ammonia gas. Soil Biol. Biochem. 2009, 41, 1262–1269. [Google Scholar] [CrossRef]
  37. Gougoulias, C.; Clark, J.M.; Shaw, L.J. The role of soil microbes in the global carbon cycle: Tracking the below-ground microbial processing of plant-derived carbon for manipulating carbon dynamics in agricultural systems. J. Sci. Food Agric. 2014, 94, 2362–2371. [Google Scholar] [CrossRef]
  38. Ogino, T.; Suzuki, T.; Sawada, K. The formation and transformation mechanism of calcium carbonate in water. Geochim. Cosmochim. Acta 1987, 51, 2757–2767. [Google Scholar] [CrossRef]
  39. Bhatti, A.A.; Haq, S.; Bhat, R.A. Actinomycetes benefaction role in soil and plant health. Microb. Pathog. 2017, 111, 458–467. [Google Scholar] [CrossRef]
  40. Roper, M.M. The isolation and characterization of bacteria with the potential to degrade waxes that cause water repellency in sandy soils. Aust. J. Soil Res. 2004, 42, 427–434. [Google Scholar] [CrossRef]
  41. Lang, S.; Philp, J.C. Surface-active lipids in rhodococci. Antonie Van Leeuwenhoek 1998, 74, 59–70. [Google Scholar] [CrossRef]
  42. Walter, U.; Beyer, M.; Klein, J.; Rehm, H.J. Degradation of pyrene by Rhodococcus sp. UW1. Appl. Microbiol. Biotechnol. 1991, 34, 671–676. [Google Scholar] [CrossRef]
Figure 1. Scanning electron microscope (SEM) images of a hydrophobic sand grain (left) collected from a severe hydrophobic area on a sand-based putting green, and a sand grain that was never used (right).
Sustainability 11 04505 g001
Figure 2. Monthly precipitation and average air temperature collected at the University of Missouri South Farm Research Center in Columbia, MO from April to December in years 2015 and 2016.
Sustainability 11 04505 g002
Figure 3. Soil volumetric water content (VWC; %) influenced by the wetting agents in 2015 and 2016. Data were collected at 2, 4, 6, 8, 10, 12, 14, 16, and 18 weeks after the initial treatment application. Bars for 2016 labeled with different letters were significantly different based on Fisher’s Protected LSD at p < 0.05. Treatments applied did not significantly influence VWC in 2015; hence, mean separation was not performed. UC, untreated control; AE, alcohol ethoxylates; PXL, poloxanlene, 2-butoxyethanol; ABP, alkyl block polymer; PoAP, polyoxyalkylene polymers; NIS, nonionic surfactant + acidifiers; and APG, alkyl polyglycoside.
Sustainability 11 04505 g003
Figure 4. Localized dry spot (LDS; %) influenced by the wetting agents in 2015 and 2016. Data were collected at 2, 4, 6, 8, 10, 12, 14, 16, and 18 weeks after the initial treatment application. Bars for 2016 labeled with different letters were significantly different based on Fisher’s Protected LSD at p < 0.05. Treatments applied did not significantly influence LDS in 2015; hence, mean separation was not performed. UC, untreated control; AE, alcohol ethoxylates; PXL, poloxanlene, 2-butoxyethanol; ABP, alkyl block polymer; PoAP, polyoxyalkylene polymers; NIS, nonionic surfactant + acidifiers; and APG, alkyl polyglycoside.
Sustainability 11 04505 g004
Figure 5. Percent disease cover (%) influenced by the wetting agents in 2015 and 2016. Data were collected at 2, 4, 6, 8, 10, 12, 14, 16, and 18 weeks after the initial treatment application. Bars for 2015 or 2016 labeled with different letters were significantly different based on Fisher’s Protected LSD at p < 0.05. UC, untreated control; AE, alcohol ethoxylates; PXL, poloxanlene, 2-butoxyethanol; ABP, alkyl block polymer; PoAP, polyoxyalkylene polymers; NIS, nonionic surfactant + acidifiers; and APG, alkyl polyglycoside.
Sustainability 11 04505 g005
Figure 6. Turf quality (1–9) influenced by the wetting agent in 2015 and 2016. Data were collected at 2, 4, 6, 8, 10, 12, 14, 16, and 18 weeks after the initial treatment application. Bars for 2015 or 2016 labeled with different letters were significantly different based on Fisher’s Protected LSD at p < 0.05. UC, untreated control; AE, alcohol ethoxylates; PXL, poloxanlene, 2-butoxyethanol; ABP, alkyl block polymer; PoAP, polyoxyalkylene polymers; NIS, nonionic surfactant + acidifiers; and APG, alkyl polyglycoside.
Sustainability 11 04505 g006
Table 1. Wetting agent treatment list. All wetting agents were applied at the spray volume of 0.04 L m−2.
TreatmentActive IngredientCodeRate (mL·L−1)
Untreated Control--UC--
Cascade Plus10% alcohol ethoxylates and 90% polyethylene and polypropylene glycols.AE62
Hydro-Wet87.5% poloxanlene, 2-butoxyethanol.PXL62
Matador100% alkyl block polymer.ABP47
OARS80% polyoxyalkylene polymers and 10% potassium salt of alkyl substituted maleic acid.PoAP27
pHAcid100% blend of acidifying agents and a high molecular weight nonionic surfactant. NIS250
Tournament-Ready62% alkyl polyglycoside and siloxane solution, and 38% polyalkoxylate blend.APG62
Table 2. Soil hydrophobicity, determined by molarity of ethanol droplet (MED; mole) test, influenced by interactions of treatment and evaluation timing in 2015 and 2016. Data were collected at 0, 1, 2, 3, 4, and 5 months after the initial treatment (MAIT).
Treatments 0MAIT1MAIT2MAIT3MAIT4MAIT5MAIT
--------------------------------------2015-----------------------------------
UC3.0 a2 3.1 b123.3 a13.4 a13.1 a13.3 a1
AE2.9 a12.9 b12.9 cd12.9 cd12.3 d32.6 c2
PXL3.0 a13.1 b13.0 bcd13.1 bc12.6 c22.9 b1
ABP3.0 a13.1 b12.9 cd122.7 d232.4 d42.6 c34
PoAP3.0 a123.1 b12.8 d233.0 cd122.3 d42.7 bc3
NIS2.9 a33.4 a13.2 ab23.3 ab122.9 b33.1 ab23
APG3.0 a123.1 b13.1 abc13.1 bc12.3 d32.7 bc2
--------------------------------------2016-----------------------------------
UC2.6 a23.3 a13.2 a13.1 a13.0 a13.1 a1
AE2.5 ab122.6 b12.4 d1232.2 bc232.4 b1232.1 bc3
PXL2.4 ab122.5 b122.6 cd12.3 bc22.2 b232.0 c3
ABP2.5 ab122.7 b12.5 cd12.1 c32.5 b122.2 bc23
PoAP2.3 b22.6 b12.7 bc12.3 bc22.3 b22.1 bc2
NIS2.5 ab23.1 a13.0 ab12.9 a13.0 a13.0 a1
APG2.4 ab12.5 b12.6 cd12.4 b12.5 b12.4 b1
UC, untreated control; AE, alcohol ethoxylates; PXL, poloxanlene, 2-butoxyethanol; ABP, alkyl block polymer; PoAP, polyoxyalkylene polymers; NIS, nonionic surfactant + acidifiers; and APG, alkyl polyglycoside. Means in the same column and year followed by different letters were significantly different based on Fisher’s Protected LSD at p < 0.05; means in the same row followed by different numbers were significantly different based on Fisher’s Protected LSD at p < 0.05.
Table 3. Microbial groups, detected by the phospholipid fatty acid (PLFA) analysis, influenced by interactions of treatment and evaluation timing. Soil samples were collected in October 2015, May 2016, and October 2016.
Treatments October 2015May 2016October 2016
--------------------Aerobic bacteria (nmol·g−1)--------------------
UC15.3 a2 §17.2 a219.3 b1
AE15.3 a216.6 ab1219.0 b1
PXL14.6 a215.3 ab219.6 b1
ABP14.8 a214.3 b218.9 b1
PoAP14.1 a216.3 ab1218.6 b1
NIS15.5 a215.4 ab223.1 a1
APG13.8 a217.8 a117.3 b1
--------------------Anaerobic bacteria (nmol·g−1)--------------------
UC7.9 a28.0 a29.5 b1
AE8.0 a127.4 ab28.8 b1
PXL7.8 a27.2 ab29.0 b1
ABP7.4 a26.7 b28.8 b1
PoAP7.6 a27.6 ab28.7 b1
NIS8.1 a26.9 b310.5 a1
APG7.4 a28.0 a28.5 b1
--------------------Actinomycetes (nmol·g−1)--------------------
UC6.1 a25.5 a28.1 b1
AE6.3 a25.2 a37.7 b1
PXL6.0 a24.9 a37.6 b1
ABP5.9 a24.8 a37.5 b1
PoAP5.9 a25.4 a27.4 b1
NIS6.4 a24.8 a39.0 a1
APG5.8 a25.5 a27.3 b1
----------------Arbuscular mycorrhizae (nmol·g−1)----------------
UC4.7 a25.4 a27.0 bc1
AE4.6 a24.8 ab26.5 bc1
PXL4.4 a24.6 ab27.0 b1
ABP4.3 a24.3 b27.1 b1
PoAP4.3 a24.9 ab26.7 bc1
NIS4.9 a24.6 ab28.4 a1
APG4.2 a35.2 a26.2 c1
--------------------Mycorrhizae (nmol·g−1)--------------------
UC6.6 a27.1 a210.3 bc1
AE6.3 a26.4 ab29.7 bc1
PXL6.1 a26.2 ab210.6 b1
ABP6.0 a25.7 b210.8 b1
PoAP6.1 a26.6 ab210.2 bc1
NIS6.7 a26.1 ab212.6 a1
APG5.9 a26.8 ab29.2 c1
--------------------Bacteria (nmol·g−1)--------------------
UC34.0 a234.9 ab241.4 b1
AE34.0 a232.9 abc2139.7 b1
PXL32.6 a231.0 abc240.7 b1
ABP32.2 a228.9 c240.1 b1
PoAP31.8 a233.2 abc239.0 b1
NIS35.2 a230.6 bc248.0 a1
APG31.1 a235.3 a1237.1 b1
--------------------Total PLFA (nmol·g−1)--------------------
UC81.8 a287.6 a2111.4 b1
AE80.8 a282.9 ab21106.9 b1
PXL77.3 a278.8 ab2108.4 b1
ABP84.6 a273.4 b2108.2 b1
PoAP76.4 a284.5 ab2105.6 b1
NIS83.4 a277.6 ab2128.3 a1
APG74.2 a288.4 a199.6 b1
Phospholipid fatty acid (PLFA) contents were PLFA concentrations based on the mass of soil sample as nmol·g−1 soil. UC, untreated control; AE, alcohol ethoxylates; PXL, poloxanlene, 2-butoxyethanol; ABP, alkyl block polymer; PoAP, polyoxyalkylene polymers; NIS, nonionic surfactant + acidifiers; and APG, alkyl polyglycoside. § Means in the same column and microbial group followed by different letters were significantly different based on Fisher’s Protected LSD at p < 0.05; means in the same row followed by different numbers were significantly different based on Fisher’s Protected LSD at p < 0.05.

