Willingness to Pay for Home Energy Management Systems: A Survey in New York and Tokyo

1
Faculty of Social Sciences, Waseda University, 1-6-1, Nishiwaseda Shinjyuku, Tokyo 169-8050, Japan
2
The Japan Institute for Labour Policy and Training, 4-8-23, Kamishakujii, Nerimaku, Tokyo 177-8502, Japan
3
Advanced Collaborative Research Organization for Smart Society, Waseda University, 3-4-1, Okubo Shinjyuku, Tokyo 169-8555, Japan
4
Department of Electrical Engineering and Bioscience, Faculty of Science and Engineering, Waseda University, 3-4-1, Okubo Shinjyuku, Tokyo 169-8555, Japan
*
Author to whom correspondence should be addressed.
Sustainability 2019, 11(17), 4790; https://0-doi-org.brum.beds.ac.uk/10.3390/su11174790
Submission received: 24 July 2019
/
Revised: 17 August 2019
/
Accepted: 29 August 2019
/
Published: 2 September 2019
(This article belongs to the Special Issue Innovation by Linking through Life Cycle Thinking: Practices and Challenges from EcoBalance)
Abstract
:This study evaluates the acceptability of home energy management systems (HEMS) in New York and Tokyo using a questionnaire survey. We investigated three basic functions of HEMS: money saving, automatic control, and environmental impact, and then quantified people’s propensity to accept each of these three functions by measuring their willingness to pay. Using the willingness to pay results, we estimated the demand probability under a given usage price for each of the three functions of home energy management systems and analyzed how socio-economic and demographic factors influence the demand probability. The demand probability related to a home energy management system function decreases as the usage price of the function increases. However, depending on people’s socio-economic characteristics, the rate of decrease in demand probability relative to the rate of increase in usage price varies. Among the three functions of home energy management systems, we found that the automatic control function showed the highest demand probability in New York and Tokyo, emphasizing the significance of an automatic control function. In New York, when the home energy management system has an automatic control function, its demand probability increases, which is further enhanced if people trust their utility company. In Tokyo, when a home energy management system has an environmental impact function, its demand probability increases at a given price. People in Tokyo have anxieties related to new technologies such as home energy management systems. Therefore, it is necessary to enhance their comprehension of a home energy management systems to address this anxiety.
1. Introduction
With increasing awareness of global environmental issues, the efficient use of energy is becoming more important than ever before; especially in residential areas, where several factors influence people and their behavior. A number of social experiments in demand response—aimed at finding out the magnitude of responses to the increase in energy prices—were conducted in U.S. after the energy crisis of 2000–2001 [1]. The responses indicated that peak electricity demand was reduced by the higher tariffs, and that the reduction was doubled with the help of technologies, such as two-way programmable communicating thermostats, which automatically reduce electricity usage in response to price. After power shortages following the Fukushima disaster in 2011, some community pilots in Japan performed price responsive experiments and found similar results that were correlated with the magnitude of the price increase [2,3]. It was also found that persuasion to reduce electricity usage worked well in the initial stage, but lost its effect over time [2]. From these observations, the cost incentive, as well as assistance with an automated mechanism for electricity saving action, are considered to be primary factors to enable energy saving.
Along with these issues, home energy management is considered a viable way to improve energy efficiency, reduce the electricity bills of residents, and contribute to reducing the carbon footprint by facilitating the demand side management (DSM) of electricity [4,5] A home energy management system (HEMS) is a type of telecommunications media, whose basic functionalities are visualization and the automatic control of energy usage, without compromising a resident’s comfort and convenience. The key element is to connect and remotely control residential appliances and devices, such as air conditioners, water heaters, and electrical vehicles [5].
In order to promote the use of HEMSs, the Japanese government provides subsidies for the purchase of such systems. Furthermore, the government has implemented a large-scale demonstration project to identify reactions and acceptance of the systems. Besides basic energy monitoring, HEMS can provide additional services such as tele-medical information and community event updates, among others. A number of engineering studies have been conducted to develop HEMS to maximize the efficiency of residential energy usage, including heating efficiency (e.g., [5,6,7]).
Although the majority of households do not yet have access to HEMS, the acceptance of HEMS technology is being studied. For instance, Li et al. [8], Nakano and Washizu [9], and Stenner et al. [10] have investigated the characteristics of those who accept smart energy management systems (including HEMS) in the Netherlands, Japan, and Australia. The first two articles found that awareness of the technology was necessary for the acceptance and adoption of smart technologies, while the last found that the level of trust in the power companies was important. Bayram and Ustun [11] categorized prior studies related to energy management systems in the smart grid into three layers: technological, social, and economic. To facilitate the propagation of a smart energy management system, it is important to analyze all three aspects simultaneously. This study contributes to the knowledge base by identifying acceptance factors of HEMS in the United States (US) and Japan, taking into account the technological, social, and economic aspects of HEMS.
1.1. Objective
In this study, we conducted a questionnaire survey in New York and Tokyo, two large cities representing the US and Japan, respectively, and investigated the acceptability of HEMS in each city. Then we clarified, for each city, what factors contributed to the decision to use HEMS. A comparative analysis between the two cities which have different socio-economic and demographic backgrounds was used to understand the mechanism for HEMS penetration in order to effectively guide future HEMS penetration policies.
In the survey, we investigated willingness to pay (WTP) for planned HEMS functions, as well as the socio-economic and demographic factors that affect the intention to use such functions. From the individual WTP, we estimated the demand probability for specific HEMS functions at a given price and analyzed how socio-economic and demographic factors influence the demand probability.
We selected the following three HEMS functions: money saving (MS), automatic control (AC), and environmental impact (EI). The MS function allows for warning of excessive use of electricity and to manually control appliances in response. An AC function automatically enables power saving through the HEMS optimization program. The EI function relates to the environmental impact and social role of HEMS. These three functions were selected based on previous studies, as listed in Section 1.2, conducted from a purely technological standpoint.
Many previous studies that investigated the social impact of smart home technology have claimed that the acceptability of smart home technology, including HEMS, is not uniform due to demographic and socio-economic diversities among users. Therefore, we needed to define variables to quantitatively capture such socio-economic diversity; we surveyed previous social psychological research on energy conservation behavior and new technology use in Section 1.3. The survey items used in the social-psychological questionnaire surveys were useful for quantitatively capturing socio-economic diversity.
To investigate the propensity to accept new technologies for environmental reasons, the most commonly used method from an economic perspective is the measurement of WTP as described in Section 1.4. We measured the survey participants’ WTP for the three selected functions. From the calculated WTP, we estimated the demand probabilities for these HEMS functions. Demand probability provides an indication of the likelihood that a person will purchase a product at a given price. We also analyzed how the socio-economic background affects the demand probabilities for HEMS functions, which could provide useful implications for HEMS’ market penetration policy.
Recent research considered the planning of sustainable energy systems as a multi-criteria decision making (MCDM) problem and attempted to evaluate technology from multiple viewpoints. For example, Zhang et al. [12] evaluated household energy selection in Lithuania from two perspectives: public and private impacts (WTP). Our research focuses on the WTP for private impacts, given the public impacts of HEMS.
1.2. The Three Functions of HEMS: Considerations from A Technological Perspective
The function of HEMS is the visualization and automatic control of energy usage, without compromising a resident’s comfort and convenience. Residents conduct energy saving actions through visualization, and the automation function of HEMS assists in making the behavior more effective. Furthermore, extensive research has been conducted to formulate a control algorithm to govern the operation of multiple appliances and devices to achieve the desired optimization. These include controls based on the electricity bill [5,13,14,15] and the effective use of renewable energy [16], contributing to overall energy management. A feature of HEMS is that it regulates the general energy consumption of the home by controlling multiple home electric appliances in an integrated manner.
The MS function is used to monitor their use of electricity and to save on utility costs. When the HEMS with the MS function warns of excessive use of electricity, appliances can be controlled manually in order to save electricity. The AC function automatically controls photovoltaic generators and other home appliances, enabling reduced utility costs without little or no manual intervention. The AC function is considered to have a higher technical performance than that of the MS function. The EI function can contribute to energy conservation and environmental improvement for society as a whole through demand response (DR). DR is a mechanism whereby electric utility companies request consumers to save electricity in exchange for monetary compensation during periods of high demand. By doing so, utility companies can limit the number of power generation facilities in operation and reduce the electricity carbon footprint. The HEMS with the EI function will automatically react to a DR request signal from utility companies and automatically control household appliances, contributing to reduced energy usage. Both the AC and EI functions allow for automatic control of appliance and reduced energy usage, although the EI function has an impact at the community level, while the AC function has an impact at the individual scale.
1.3. Social Aspects of Smart Home Technologies
In this section, we review previous studies covering acceptability of smart home technology, including HEMS. Smart home technology is defined as a technology that increases the efficiency of residential energy use mainly through the use of information communication technology (ICT) and the internet of things (IoT) technology.
Many studies point to the diversity of demographic and socio-economic backgrounds as a factor in the uptake of new technology and point out that smart home technologies should be designed in line with individuals’ lifestyles [17,18,19]. They also note that consumers’ knowledge and experience facilitate the acceptance of smart home technologies [17,18,20,21,22]. Some believe that such technology should not be disseminated to the public, but should focus on narrowly defined target groups [20,23,24]. The previous studies suggest that new technologies should be designed to cater to the preferences of the target market and should be targeted at those individuals with conditions to use such technology effectively. Furthermore, increased awareness of the technology will improve penetration. For this reason, it is important to clearly and quantitatively determine the socio-economic background of the target market. The field of social psychology attempts to investigate factors, other than demographics, that promote environmentally conscious behavior and acceptance of new technology. The question items used in these surveys are effective at clearly and quantitatively capturing socio-economic diversity. Therefore, we reviewed the research in the field of social psychology on environmentally conscious behavior and acceptance of new technology.
Social psychologists assume that there are common behavior principles linked to socio-economic factors. The theory of planned behavior (TPB) is a theoretical model that explains individual choice behavior in terms of purchasing pro-environmental products [25]. The TPB emphasizes attitudes in terms of behavior, social norms, and perceived behavioral control [26]. Prior studies based on the TPB model point to socio-economic factors that influence energy-saving behavior [27,28] and renewable energy usage behavior [29].
Recently, the Technology Acceptance Model (TAM; [30]) has been applied in research. The TAM was originally developed to explain acceptance of information systems such as smartphones. TAM assumes that perceived usefulness, perceived ease of use, and attitude towards use are related to the intention to use and actual use of new technologies. Applying this model, Liu et al. [31] hypothesized a mechanism for acceptance of greenhouses and Chen et al. [32] analyzed the acceptance of smart meters.
1.4. Measurement of WTP: Considerations from an Economic Perspective
WTP measurement methods are roughly divided into two categories: conjoint analysis and contingent valuation method (CVM). Conjoint analysis is a sophisticated WTP measurement method and allows for the simultaneous measurement of a respondent’s WTP for multiple choices. For example, Ida et al. [33] measured the WTP for nine HEMS functions. However, with this method, it is difficult to analyze the demographic and socio-economic diversity of respondents in detail.
In contrast, the contingent valuation method (CVM) is used to evaluate the WTP for a single choice and is relatively simple and the most widely used WTP measurement method. Using the CVM, some studies measured the WTP for compost [34], renewable energy electricity [35], pollution-reduction programs in developing countries [36], and residential photovoltaic systems [37].
The probit model is often used to identify factors affecting the WTP for new technologies [38,39]. Several studies have measured the WTP using the CVM and clarified the factors affecting WTP using the probit model [40,41].
Based on these technological, social, and economic perspectives, in our research, we focus on three main HEMS functions and measure WTP for each function using the CVM. In addition to demographic factors, we also investigated demographic and socio-economic factors that influence each person’s WTP. In the next section, we describe the survey design to investigate the WTP for HEMS functions and the factors affecting the WTP for such functions.
2. Materials and Methods
2.1. Survey and Design
2.1.1. Data Collection
The survey was conducted online in March 2017 using monitors registered with an investigative company (QUALTRICS, LLC). The survey targeted men and women between the ages of 30 and 70 years residing in their own homes in the suburbs of New York in the US, and those living in their own homes in the Tokyo metropolitan area in Japan. Students are excluded from the target and the male-female ratio is 1:1. In this distribution, we believe we reached a gender balance and have been able to select survey targets who can responsible determine their home energy consumption of their own free will. New York and Tokyo are cities with a high population density, and the implementation of HEMS is expected to have a significant environmental impact. Both cities are the centers of economic activity in their countries, and the lifestyles of residents are considered to be similar in both cities. We received 1228 responses for New York and 1316 for Tokyo.
Participants answered questions after viewing a short explanatory slideshow on HEMS. The survey comprised two parts: questions on WTP for HEMS, and questions related to factors affecting WTP.
2.1.2. WTP for the three functions of HEMS
As mentioned in the introduction, we assumed the following three HEMS services: money saving (MS), automatic control (AC), and environmental impact (EI).
For each of the three functions, we asked participants how much they would pay as a fee per month to use the functions, assuming their houses were equipped with a HEMS. Participants answered the questions after viewing a short explanatory slideshow on HEMS, which explained the three functions.
The participants then selected the amount of money they would pay monthly for each HEMS function from among the following options (unit: USD for the US, 100JPY for Japan): 7.00 or more, 6.00–6.99, 5.00–5.99, 4.00–4.99, 3.00–3.99, 2.00–2.99, 1.00–1.99, 0.01–0.99, and “I’m not willing to pay for this service.” Throughout this research, an exchange rate of 100 JPY = 1 USD was used. Based on the actual exchange rate at the time of this survey (March 2017) (100 JPY = 0.893 USD), the estimated price in Japan was slightly higher than the actual cost. However, this does not affect the results because we focus on the rate of change in WTP, not on the absolute value of WTP.
2.1.3. Factors Affecting the WTP
The variables were measured using a 5-point Likert-scale response, showing the degree of fit in the questions related to the factors affecting their WTP. The factors were divided into three categories, as follows: factors related to awareness and intention to use HEMS services, and socio-economic as well as demographic factors.
(1) Factors related to awareness of and intention to use HEMS
Three items were used to measure respondents’ awareness of HEMS. Participants were asked if they understood the explanatory slideshow, were familiar with technologies such as HEMS, and whether they had prior knowledge of HEMS. We also asked three questions to measure future intention to use HEMS (see Appendix A Table A1 for details).
In addition to the basic functionalities, HEMS can be connected to the internet and used as an information gateway for service providers. Therefore, we also asked participants about their intention to use the following seven additional services: assisting senior citizens, emergency contacts for children, monitoring security, tele-medical services, mobility services, a job search service, and community event updates.
(2) Socio-economic factors affecting the use of HEMS
In order to quantitatively determine the socio-economic diversity, we used the concept of social psychology: variables used in the TPB model, the TAM model, and other social psychological variables. The TPB model explains environmental behavior, and the TAM model explains acceptance of new technology. Both are related to the acceptability of HEMS.
The factors included in the TPB model are attitudes toward HEMS, social norms, personal norms, and perceived behavioral control (PBC), which indicates perceptions of the results of their actions (e.g., acceptance of HEMS). If this perception is strong, the behavior (e.g., acceptance of HEMS) is more likely to be intended. Each factor is measured using three questions. See Appendix A Table A1 for details.
The factors used in the TAM model are the perceived usefulness of HEMS and the perceived ease of use of the system. Here, we asked about the perceived usefulness of the automatic adjustment function in HEMS and of the operability of HEMS by mobile phone. Each factor was measured using three questions. See Appendix A Table A1 for details.
With reference to the work of Balta-Ozkan et al. [18], we investigated other social psychological factors, such as cost concerns, dependency concerns, trust in utility companies, cybersecurity, and technology anxiety, as well as the respondents’ current energy-saving behavior. Each factor was measured using multiple questions.
(3) Demographic factors
We investigated the demographic factors including age, region, gender, weekday home time zone, power usage, number of family members, family structure, occupation, income level, type of housing, age of the house, size of the house, electricity bill, ethnicity (New York only), and political preference (New York only). See Appendix A Table A1 for details.
2.2. Method
2.2.1. Experimental Design
Using the results of WTP for the HEMS functions and socio-economic and demographic factors affecting WTP, we performed statistical analysis to clarify the following population characteristics: (i) what is the socioeconomic background and demographics of those with high WTP? (ii) how much will demand for each HEMS function increase if the usage price falls in the future? (iii) are there any factors that increase demand for HEMS functions regardless of the usage price?
Question (i) can be analyzed by conducting regression analysis using WTP as an explained variable and socio-economic and demographic factors affecting WTP as the explanatory variables [38,39]. From the results, we denoted factors that could improve acceptance of HEMS, and possible marketing target groups. By addressing question (i) we can make recommendations towards improving HEMS penetration measures. The method will be explained in Section 2.2.2.
As expected, for high WTP for each HEMS function, the proportion of those who assert it will be small, and as the WTP falls, the proportion of those who assert it will increase. This implies that the demand probability of each HEMS function is low when the usage price is high and that the demand probability increases as the usage price decreases. The question (ii) can be answered by measuring the rate of change in demand for each HEMS function relative to the rate of change in that price. Furthermore, several factors may enhance WTP for each HEMS function. We identified critical factors that affect WTP for HEMS and those that promote general acceptability of HEMS regardless of the usage price. Li et al. [8] and Nakano and Washizu [10] suggested that awareness of the HEMS technology is a critical factor, and Stenner et al. [9] suggested that the level of trust in utility companies was another key factor. Therefore, we examined whether these specific factors increase the demand probability of each HEMS function in New York and Tokyo. By answering questions (ii) and (iii), we will determine the impact of changes in the usage price of each HEMS function on the demand probability. We also compare the results among the three HEMS functions. The method will be explained in Section 2.2.3.
2.2.2. Ordered Probit Model
We conducted an ordered probit analysis [42] to identify the factors that affect respondents’ WTP. In our case, the explained variables are ordinal numbers from 0 to 8 associated with the WTP for the three functions of HEMS (where 8 indicates that the WTP is USD 7 or more; 7 indicates that the WTP is USD 6 to 6.99; …..; and 0 indicates that the respondent is not willing to pay). The values of the explanatory variables are the measures of factors affecting the WTP in Section 2.1.3. We conducted an ordered probit analysis for each of the three HEMS functions (MS, AC, and EI) for each city (i.e., New York and Tokyo).
2.2.3. Estimation of the HEMS Demand Probabilities Using the WTP
The method used to estimate the HEMS demand probability follows that of Aizaki [34]. We estimated the demand probability for each HEMS function and for each city, under the following two model settings (See Appendix C for detailed analytical procedures):
Model I: A model that estimates the demand probability at a given price level.
Model II: A model that estimates the demand probability at a given price level and a given shift factor.
In Model II, for a shift factor, we selected the factor indicating the degree of awareness of HEMS and the factor indicating the trust in the utility company. We examined the influence of awareness of HEMS and of the presence or absence of trust in the utility company on the demand probability of HEMS. These factors were selected based on the findings of previous studies [8,9,10].
3. Results and Discussion
3.1. WTP for HEMS Functions
Figure 1 shows the ratios of respondents who selected each price range for the HEMS functions of MS, AC, and EI. In both cities, more than 60% of the respondents indicated they would be willing to pay for HEMS functions. A relatively large number of people would pay for the AC function.
Table 1 shows the average WTP for HEMS functions, calculated using the median of each price range in each city. The average values are all higher in New York than those for Tokyo. As mentioned earlier, we assumed an exchange rate of 100 JPY = 1 USD. However, the average exchange rate in March 2017, when the survey was conducted, was 100 JPY = 0.82 USD. Taking this into account, the average WTP in Tokyo is 1.24 USD for the MS function, 1.43 USD for the AC function, and 1.28 USD for the EI function. Using the actual exchange rate, the difference between the two countries becomes even greater.
When comparing the average WTP by age in New York, the WTP is higher for younger people than for older people, whereas the WTP for older people is higher in Tokyo. The variation in the WTP by age in Tokyo is not as large as that in New York. When comparing the average WTP for each level of awareness of the explanatory slideshow, a greater awareness of HEMS is positively correlated with a higher WTP for HEMS functions. When comparing the average WTP with the age of the respondent’s home in Tokyo, the difference in the average WTP is relatively small; but in New York, the difference is large. In New York, the average WTP of people living in more modern homes is higher than for those in older homes as new technologies are likely to be applied in the construction of new homes.
3.2. Results of the Ordered Probit Analysis
We carried out an ordered probit analysis using the WTP for each HEMS function (MS, AC, and EI) as the explained variable, and the factors affecting the WTP as the explanatory variables. Prior to executing the multivariate probit analysis, we checked for correlation between the variables. Overall, although there is a correlation between a few explanatory variables, most of the correlation coefficients are low. (We have confirmed that Variance Inflation Factor (VIF) based on Ordinary Least Squares regression (OLS) estimates are less than 7 in all cases (in the cases of EI function in New York and all functions in Tokyo, the VIF statistics are less than 3). Thus, the problem of multiple collinearity is considered to be minor.)
The procedure is as follows: first, an ordered probit analysis is conducted on the explanatory variables (factors affecting WTP) that have a significant correlation with the explained variable (WTP for each HEMS function). Then, an analysis is conducted on those factors with significant coefficients only.
See Appendix B Table A2 for the detailed results of the second step (estimated coefficients and test statistics). From the signs of the coefficients estimated using the ordered probit analysis, we can determine the direction of the effect of each explanatory variable on the WTP. As a result, in New York, the following factors were found to have a positive effect on the WTP for all three HEMS functions: intention to use tele-medical services, the “attitude” TPB factor (recognition that HEMS is a beneficial product), energy-saving behavior related to air-conditioners, male dummy, and house size. Concern about the HEMS basic fee and energy-saving behavior related to lights have a negative influence. It is interesting that the energy-saving behavior related to air conditioners and lighting have opposite effects on the WTP. In order to increase acceptance of HEMS in New York, it seems preferable to provide tele-medical services via HEMS, to reduce the resistance related to the basic HEMS fee, emphasize the energy-saving effect related to air conditioners, and target people living in large houses.
In Tokyo, the “attitude” TPB factor (recognition that HEMS is a beneficial product) and the dependency concern positively affect the WTP for all three HEMS functions. Technology anxiety has a negative effect. Fewer factors have a significant effect on WTP in Tokyo than in New York. Improving the awareness of HEMS to inform individuals of its convenience and eliminate technology anxiety seems to be an effective way to increase acceptance of HEMS in Tokyo.
3.3. The Demand Probabilities for HEMS Functions
As described in Section 2.2.2, we estimated the demand probability of HEMS under two kinds of assumptions (Model I and Model II). Appendix C shows how the demand probabilities were calculated based on the parameters estimated by the binomial logit model; the estimation results of the models were good both statistically and theoretically.
Table 2 shows the calculated results of demand probabilities of the HEMS functions for prices of 2.5, 4.5, and 7 USD for Model I. When the HEMS function changes from MS to AC, the demand probability clearly increases in New York, but in Tokyo, the improvement in demand probability is not clear. When the HEMS function changes from AC to EI, the demand probability decreases in New York, but increases in Tokyo. A change from MS to EI improves the demand probability of HEMS in both cities. The absolute value of average price elasticity of HEMS demand (difference in demand probability (%) ÷ rate of change in price) when the price changes from 7 to 2.5 USD is lower in New York than in Tokyo. In economics, we interpret this to mean that the HEMS is a necessity for residents in New York more than those in Tokyo. For residents in both cities, the HEMS with an AC function is deemed most necessary. At any HEMS price, the demand probability of each HEMS function is higher in New York than it is in Tokyo. The difference between the two cities is particularly large with respect to the high HEMS price.
Table 3 and Table 4 show the demand probabilities of the HEMS functions for Model II. Here, we show the results in which we focused on the dummy variable indicating the trust in utility companies for New York data set and the dummy variable indicating the degree of awareness of HEMS for Tokyo dataset. If we swap the factors between New York and Tokyo, the estimation results are not significant.
Table 3 shows HEMS’s demand probabilities in New York. From the table, we can see that the absolute value of the average price elasticity of HEMS demand becomes smaller when a respondent trusts their power company than it does when he/she does not. The necessity for HEMS is considered high for those who trust their power company. Furthermore, when the price is very high, the demand probability of people who trust their power company is higher than that of people do not trust the company.
In Table 4, we show the HEMS demand probabilities for Tokyo. The table shows that the absolute value of the average price elasticity of HEMS demand becomes smaller when a respondent understands the explanatory slideshow than when he/she does not. That is, the necessity for HEMS is higher for those who understand HEMS well. Furthermore, when the price is high, the demand probability of people who understand HEMS is higher than that of people who do not. The price of the HEMS function currently provided in Japan (close to the MS function in this research) is about 5 USD per month. According to Table 4, if awareness of HEMS is improved, the demand probability may improve by 2–3% at the same usage fee for the HEMS function.
In this section, we derived the HEMS demand probabilities for New York and for Tokyo. The demand probability shifts upward as the HEMS function changes from MS to AC in New York, and from AC to EI in Tokyo. This means that, in New York, the acceptability of HEMS was improved by the automation function, and in Tokyo, it was improved by the environmental function. In both cities, the AC function is considered to be the most necessary one among the three functions. A comparison of the HEMS demand probabilities shows that demand probability and necessity are higher in New York than in Tokyo. In New York, if people trust their power company, the necessity of HEMS increases, and the demand probability increases when the price is very high. In Tokyo, when awareness of HEMS improves, its necessity of HEMS increases and the demand probability increases by 2–3% at the current price of HEMS services.
4. Conclusions
In this research, a questionnaire survey was conducted in New York and in Tokyo. We surveyed consumers in both cities on their WTP for functions offered by HEMS. Specifically, we asked how much they would pay for the following three HEMS functions: MS, AC, and EI.
In both cities, more than 60% of the respondents indicated they would be willing to pay for HEMS functions. The average WTP of HEMS functions is higher in New York than it is in Tokyo.
Using the survey results, we conducted statistical analyses to elucidate the HEMS penetration method and to understand the impact of changes in usage price of each HEMS function on the demand probability.
To elucidate the HEMS penetration method, we conducted an ordered probit analysis. Based on the results, it was found that, in order to increase acceptance of HEMS in New York, the system should provide tele-medical services, the basic cost of the HEMS needs to be reduced, the energy-saving effect related to air conditioners needs to be emphasized, and people living in large houses need to be targeted. Improving awareness of HEMS in terms of its convenience and in order to eliminate technology anxiety seems to be an effective means to increase HEMS acceptance in Tokyo. In summary, people with these characteristics in each city had high WTP for HEMS services.
To understand the impact of changes in usage price of each HEMS function on the demand probability, we estimated the HEMS demand probabilities for each city. The results show that demand probabilities for HEMS functions decrease as the usage fees per month increase, which is consistent with economic theory. The AC function increases the demand probability of HEMS in New York, and the EI function increases the demand probability in Tokyo. In both cities, among the three functions of HEMS, the AC function has the most necessity. Demand probability is influenced by the trust in the utility company in New York and by awareness of HEMS in Tokyo. In New York, if people trust their utility company, the necessity of HEMS increases, and the demand probability increases when the price is very high. In Tokyo, when awareness of HEMS improves, its necessity increases and the demand probability increases at the current price of HEMS services. These results have important implications for policies intended to promote HEMS in major cities in the US and Japan. The measured demand function can be interpreted as indicating the characteristics of the population in each city. Through it, the response of the population to future changes in price of HEMS service can be predicted. HEMS with an AC function was insensitive to price changes, hence a certain demand for HEMS with an AC function was assumed, even if the price did not drop significantly. This demonstrates that people place some importance on the HEMS function, which comprehensively and automatically controls various appliances in the home. Trust in electric power companies (in New York), and comprehension for HEMS (in Tokyo), pushed up demand for HEMS at any price level, therefore, these are important factors to focus on, in each city. Clarifying the demand structure of HEMS will contribute to further uptake of HEMS and increased energy efficiency.
The result of the ordered probit analysis showed that fewer factors affect the WTP in Tokyo than in New York. This means that differences between individuals in Tokyo do not cause a significant difference in their WTP for the services. Nichols and Kockelman [43] point out that higher population densities and smaller residential units offer the greatest energy savings. This situation applies to Japan, where, in urban areas, the potential for further energy saving is relatively limited. Thus, the potential advantage of using HEMS (especially the MS and AC functions) is not clear. Under such circumstances, improving the social function (i.e., the EI function) of HEMS and enhancing awareness of the EI function will help to improve acceptance of HEMS.
In this study, the acceptability of HEMS service was analyzed by the WTP indicator. Based on the observed WTP, the demand function of the HEMS service was measured, and it was possible to consider how acceptability would change depending on future HEMS service price fluctuations. However, the limitation of this research is that only WTP is used as an evaluation index for HEMS services. Recent research [12] evaluates technology in the MCDM framework, and such a perspective may be indispensable for achieving the Sustainable Development Goals set by the United Nations. The evaluation of HEMS services including other evaluation indicators (e.g., public impact) is the goal of our future research.
Currently, engineering research institutes in both countries are involved in collaborative research to maximize the introduction of renewable energy into the power grid by optimizing energy management on the supply side and demand side. While HEMS plays an important technical role in the coordination between the supply side and demand side, consumers’ preferences must be considered. In order to increase overall energy efficiency of the society, it is important to incorporate consumer preferences into the design and marketing of HEMS. We hope that this research assists in the practical implementation of HEMS.
5. Human Subjects’ Approval Statement
This study was approved by the Ethics Review Committee on Research with Human Subjects of Waseda University (Application No.: 2016-292).
Author Contributions
Conceptualization, A.W.; Data curation, A.W., S.N. and H.I.; Formal analysis, A.W. and S.N.; Funding acquisition, Y.H.; Methodology, A.W.; Project administration, H.I. and Y.H.; Supervision, A.W.; Visualization, A.W.; Writing–original draft, A.W.
Funding
Japan Science and Technology Agency: JPMJCR15K5.
Acknowledgments
We greatly appreciate the cooperation of Chen-fei Chen with regard to advice on social psychology and in the US survey. The research in Japan was supported by the JST CREST Grant Number JPMJCR15K5. In addition, the research in the US was supported in part by the US National Science Foundation (NSF) Award Number CNS 1541117, the Engineering Research Center Program of the NSF and the Department of Energy under NSF Award NumberEEC-1041877, and the CURENT Industry Partnership Program.
Conflicts of Interest
The authors declare no conflicts of interest.
Abbreviations
| AC | Automatic control |
| CVM | Contingent valuation method |
| DR | Demand response |
| DSM | Demand side management |
| EI | Environmental impact |
| HEMS | Home energy management system |
| ICT | Information communication technology |
| IoT | Internet of things |
| MS | Money saving |
| MCDM | Multi-criteria decision making |
| PBC | Perceived behavioral control |
| TAM | Technology acceptance model |
| TPB | Theory of planned behavior |
| WTP | Willingness to pay |
Appendix A

Table A1.
Factors affecting WTPs.
| Question Item | Question Text | |
|---|---|---|
| Awareness of and intention to use HEMS | Awareness of HEMS and related technologies | How well did you understand the explanation of HEMS in the previous pages? |
| In general, how would you describe your familiarity of home energy technology like HEMS? | ||
| Before this survey, have you heard about technology similar to HEMS? | ||
| Intention to use HEMS | Using HEMS service is worthwhile. | |
| It is likely that I will use HEMS services in the future. | ||
| For sure, I would use HEMS services in the future. | ||
| Willingness to use additional services of HEMS | Service of assisting Senior Citizens | |
| Service of emergency contacts for children | ||
| Service of monitoring security | ||
| Tele-medical service | ||
| Mobility service | ||
| Service of job search | ||
| Community event updates | ||
| Socio-economic factorsbased on social psychology | (Factors of TPB) Attitudes for HEMS | HEMS is Beneficial to me. |
| HEMS is Helpful to me. | ||
| HEMS is Important to me. | ||
| Social norms | My family would think I should use HEMS to save money or electricity. | |
| My close friends would think I should use HEMS to save money or electricity. | ||
| My close neighbors who are important to me, would think I should use HEMS to save money or electricity. | ||
| Personal norms | I feel morally obligated to save energy. | |
| I would feel guilty if I would not reduce my energy use. | ||
| I would feel good if I would save energy. | ||
| Perceived behavioral control | I will be able to adopt HEMS services. | |
| Adopting HEMS services is entirely within my control. | ||
| I have the resources and ability to adopt HEMS services | ||
| (Factors of TAM) Perceived usefulness (Automation) | HEMS helps the residents proactively without human intervention. | |
| HEMS provides auto-adjusted control. | ||
| With HEMS, I can control home appliances through a simple operation. | ||
| Perceived usefulness (Mobility) | To assess HEMS services while moving from place to place or doing anything else at the same time. | |
| To use HEMS anywhere at any time through smart phones or computers. | ||
| Overall, mobility is an outstanding advantage of HEMS. | ||
| Perceived ease of use | Learning to live with HEMS will be easy for me. | |
| Interacting with HEMS will not require a lot of mental effort. | ||
| I will find HEMS easy to use. | ||
| (Other social psychological factors) Cost concern | I am concerned about HEMS basic fee. | |
| I am concerned about additional HEMS service fee. | ||
| I am concerned about HEMS maintenance fee. | ||
| Dependency concern | I would be too dependent on HEMS. | |
| I would have less control over my daily life with the use of HEMS. | ||
| I would have less freedom to live with the use of HEMS | ||
| Trust in utility companies | My utility company is reliable. | |
| My utility company always keeps promises and commitments. | ||
| My utility company always keeps customers’ best interests in mind. | ||
| I feel confidence in the brand of my utility company. | ||
| Cyber security | Some cyber hackers would break into HEMS network to access and misuse my personal information. | |
| Some cyber hackers will break into HEMS network to manipulate my usage information. | ||
| Some cyber hackers will bring down HEMS to cause the system unusable. | ||
| Technology Anxiety | Working with HEMS will make me nervous. | |
| A new technology like HEMS will make me feel uncomfortable | ||
| I hesitate to use a new technology like HEMS, for the fear of making major mistakes. | ||
| Conventional energy saving behavior | In general, avoiding using air-conditioners as much as you can. | |
| During summer, turning off AC or using a timer before going to sleep to save electricity. | ||
| During summer, setting the thermostat to about 28ºF or higher when someone is at home. | ||
| Turn off household appliances when not in use as much as possible. | ||
| Turn off lights when not in use. | ||
| Buy energy efficient light bulbs. | ||
| Buy energy efficient household appliances. | ||
| Demographic factors | age | What is your age? |
| region | Which region do you live in? | |
| gender | What is your gender? | |
| Weekday home time zone | In a typical weekday (not holidays or weekends), when are your family members usually at home? | |
| Power usage | Please tell us how you would rank your electricity use, in general, by choosing one of the following categories. | |
| Number of family members | How many people are currently living in your house/apartment? | |
| Family structure | Do any of the following people live with you? | |
| Occupation | Which of the following options best describes your job? | |
| Income level | What is your annual household income before taxes?" | |
| Type of housing | detached house/attached house/Wooden co-residence/Reinforced concrete apartment (4 stories or less/5 stories or more) | |
| Age of the house | How long ago was your house or apartment built? | |
| Size of the house | How large is your house/condo/apartment (indoor area, in square feet)? | |
| Electricity bill | How much was your last month’s utility bill? | |
| Ethnicity (New York only)) | What is your ethnic background? | |
| political preference (New York only) | Politically speaking, I consider myself as a Democrat/Independent/Republican/Apolitical/Others. |
Appendix B
Table A2.
Parameter estimates of ordered probit model.
| Explained Variable | ||||||
|---|---|---|---|---|---|---|
| Explanatory | USA | JPN | ||||
| Variable | WTP_MS | WTP_AC | WTP_EI | WTP_MS | WTP_AC | WTP_EI |
| Awareness 1 | 0.1316 (0.0464) *** | |||||
| Awareness 2 | 0.1200 (0.0399) *** | |||||
| Awareness 3 | −0.0843 (0.0396) ** | |||||
| Usage intention 1 | 0.1850 (0.0616) *** | |||||
| Usage intention 2 | −0.1118 (0.0551) ** | −0.0882 (0.0412) ** | ||||
| Add. Function 1 | 0.1015 (0.0365) *** | |||||
| Add. Function 2 | 0.1555 (0.0353) *** | 0.1576 (0.0374) *** | 0.1189 (0.0379) *** | |||
| Add. Function 3 | 0.0993 (0.0364) *** | 0.1736 (0.0354) *** | ||||
| Add. Function 4 | 0.1903 (0.0314) *** | 0.1271 (0.0362) *** | ||||
| Add. Function 5 | 0.1215 (0.0377) *** | |||||
| TPB Attitude 1 | 0.3475 (0.0816) *** | 0.2969 (0.0853) *** | 0.5072 (0.0564) *** | 0.3247 (0.0605) *** | 0.4589 (0.0459) *** | 0.3265 (0.0621) *** |
| TPB Attitude 2 | 0.2285 (0.0781) *** | 0.2539 (0.0796) *** | ||||
| TPB Social norms | 0.1527 (0.0448) *** | |||||
| TPB Personal norms 1 | 0.0864 (0.0423) ** | 0.1511 (0.0532) *** | ||||
| TPB Personal norms 2 | −0.1222 (0.0590) ** | |||||
| TPB PBC | 0.1079 (0.0417) ** | |||||
| TAM Usefulness 1 | 0.1574 (0.0519) *** | |||||
| TAM Usefulness 2 | 0.1183 (0.0524) ** | 0.1230 (0.0620) ** | 0.1885 (0.0639) *** | |||
| TAM Ease of use 1 | −0.0713 (0.0426) * | |||||
| TAM Ease of use 2 | −0.1380 (0.0472) *** | |||||
| Add Cost concern 1 | −0.2109 (0.0364) *** | −0.1320 (0.0517) ** | −0.2123 (0.0361) *** | |||
| Add Cost concern 2 | −0.1151 (0.0552) ** | |||||
| Add Dependency 1 | 0.1875 (0.0414) *** | 0.2040 (0.0396) *** | 0.1705 (0.0434) *** | |||
| Add Trust in utility | 0.0653 (0.0342) * | |||||
| Add Tech. anxiety | −0.1059 (0.0440) ** | −0.1481 (0.0403) *** | −0.1514 (0.0463) *** | |||
| Add Energy saving 1 | 0.0558 (0.0270) ** | 0.0721 (0.0284) ** | 0.0764 (0.0288) *** | |||
| Add Energy saving 2 | −0.0751 (0.0252) *** | |||||
| Add Energy saving 3 | −0.2054 (0.0425) *** | −0.1388 (0.0426) *** | −0.1815 (0.0417) *** | |||
| Age | −0.0586 (0.0158) *** | 0.0278 (0.0154) * | ||||
| Gender | −0.1419 (0.0645) ** | −0.1249 (0.0676) * | −0.1145 (0.0675) * | −0.1553 (0.0629) ** | −0.1552 (0.0653) ** | |
| House age | 0.0462 (0.0246) * | 0.0553 (0.0236) ** | ||||
| House size | 0.1160 (0.0256) *** | 0.0950 (0.0303) *** | 0.1081 (0.0287) *** | |||
| Number of obs | 1226 | 1137 | 1137 | 1316 | 1316 | 1316 |
| Log likelihood | −2003.094 | −1846.3771 | −1835.6021 | −2146.3187 | −2249.7782 | −2144.1351 |
| Wald chi2 | 571.43*** | 581.52*** | 485.66*** | 255.3*** | 322.85*** | 275.9*** |
| Pseudo R2 | 0.1495 | 0.1560 | 0.1493 | 0.0654 | 0.0664 | 0.0732 |
Standard errors are indicated in parentheses. *, **, and *** imply statistical significance at the 0.1, 0.05, and 0.01 probability levels, respectively.
Table A3.
Description of variable names.
| Abbreviation | Text of the Questionnaire |
|---|---|
| Awareness 1 | How well did you understand the explanation of HEMS in the previous pages? |
| Awareness 2 | In general, how would you describe your familiarity of home energy technology like HEMS? |
| Awareness 3 | Before this survey, have you heard about technology similar to HEMS? |
| Usage intention 1 | Using HEMS service is worthwhile. |
| Usage intention 2 | For sure, I would use HEMS services in the future. |
| Add. Function 1 | Service of assisting Senior Citizens |
| Add. Function 2 | Tele-medical service |
| Add. Function 3 | Mobility service |
| Add. Function 4 | Service of job search |
| Add. Function 5 | Community event updates |
| TPB Attitude 1 | Beneficial to me. |
| TPB Attitude 2 | Helpful to me. |
| TPB Social norms | My family would think I should use HEMS to save money or electricity. |
| TPB Personal norms 1 | I feel morally obligated to save energy. |
| TPB Personal norms 2 | I would feel good if I would save energy. |
| TPB PBC | I have the resources and ability to adopt HEMS services |
| TAM Usefulness 1 | HEMS helps the residents proactively without human intervention. |
| TAM Usefulness 2 | With HEMS, I can control home appliances through a simple operation. |
| TAM Ease of use 1 | Interacting with HEMS will not require a lot of mental effort. |
| TAM Ease of use 2 | I will find HEMS easy to use. |
| Other Cost concern 1 | I am concerned about HEMS basic fee. |
| Other Cost concern 2 | I am concerned about HEMS maintenance fee |
| Other Dependency 1 | I would be too dependent on HEMS. |
| Other Trust in utility | My utility company always keeps customers’ best interests in mind. |
| Other Tech. anxiety | A new technology like HEMS will make me feel uncomfortable |
| Other Energy saving 1 | In general, avoiding using air-conditioners as much as you can. |
| Other Energy saving 2 | Turn off household appliances when not in use as much as possible. |
| Other Energy saving 3 | Turn off lights when not in use. |
| Age | Age |
| Gender | Gender (Female=1) |
| House age | How long ago was your house or apartment built? |
| House size | How large is your house/condo/apartment (indoor area, in square feet)? |
Appendix C. Estimation of Demand Probabilities for HEMS Functions
In Section 2.2.3, we estimate the demand probability for each HEMS function and for each city, under the two following model settings.
Model I: The utility Vju when respondent j uses HEMS, and the utility Vjn when j does not use HEMS, are defined as follows:
respectively.
Here, price is the usage price of HEMS presented to participants. Using a binary logit model, the probability Pju that respondent j uses HEMS can be expressed as follows:
Using parameters estimated for this logit model, we calculate the probability of using HEMS and derive the HEMS demand function.
Model II: The demand function is estimated for the utility functions defined as follows:
Here, dummy is a variable (other than price) that affects demand behavior related to HEMS. Then, we derive the demand functions for the three HEMS functions (MS, AC, and EI) described in Section 1.2.
Table A4.
The usage price of the HEMS function for each price zone.
| USD | 7.00 or More | 6.00–6.99 | 5.00–5.99 | 4.00–4.99 | 3.00–3.99 | 2.00–2.99 | 1.00–1.99 | 0.01–0.99 | I’m Not Willing to Pay |
|---|---|---|---|---|---|---|---|---|---|
| Usage price | 7 | 6.495 | 5.495 | 4.495 | 3.495 | 2.495 | 1.495 | 0.5 | 0 |
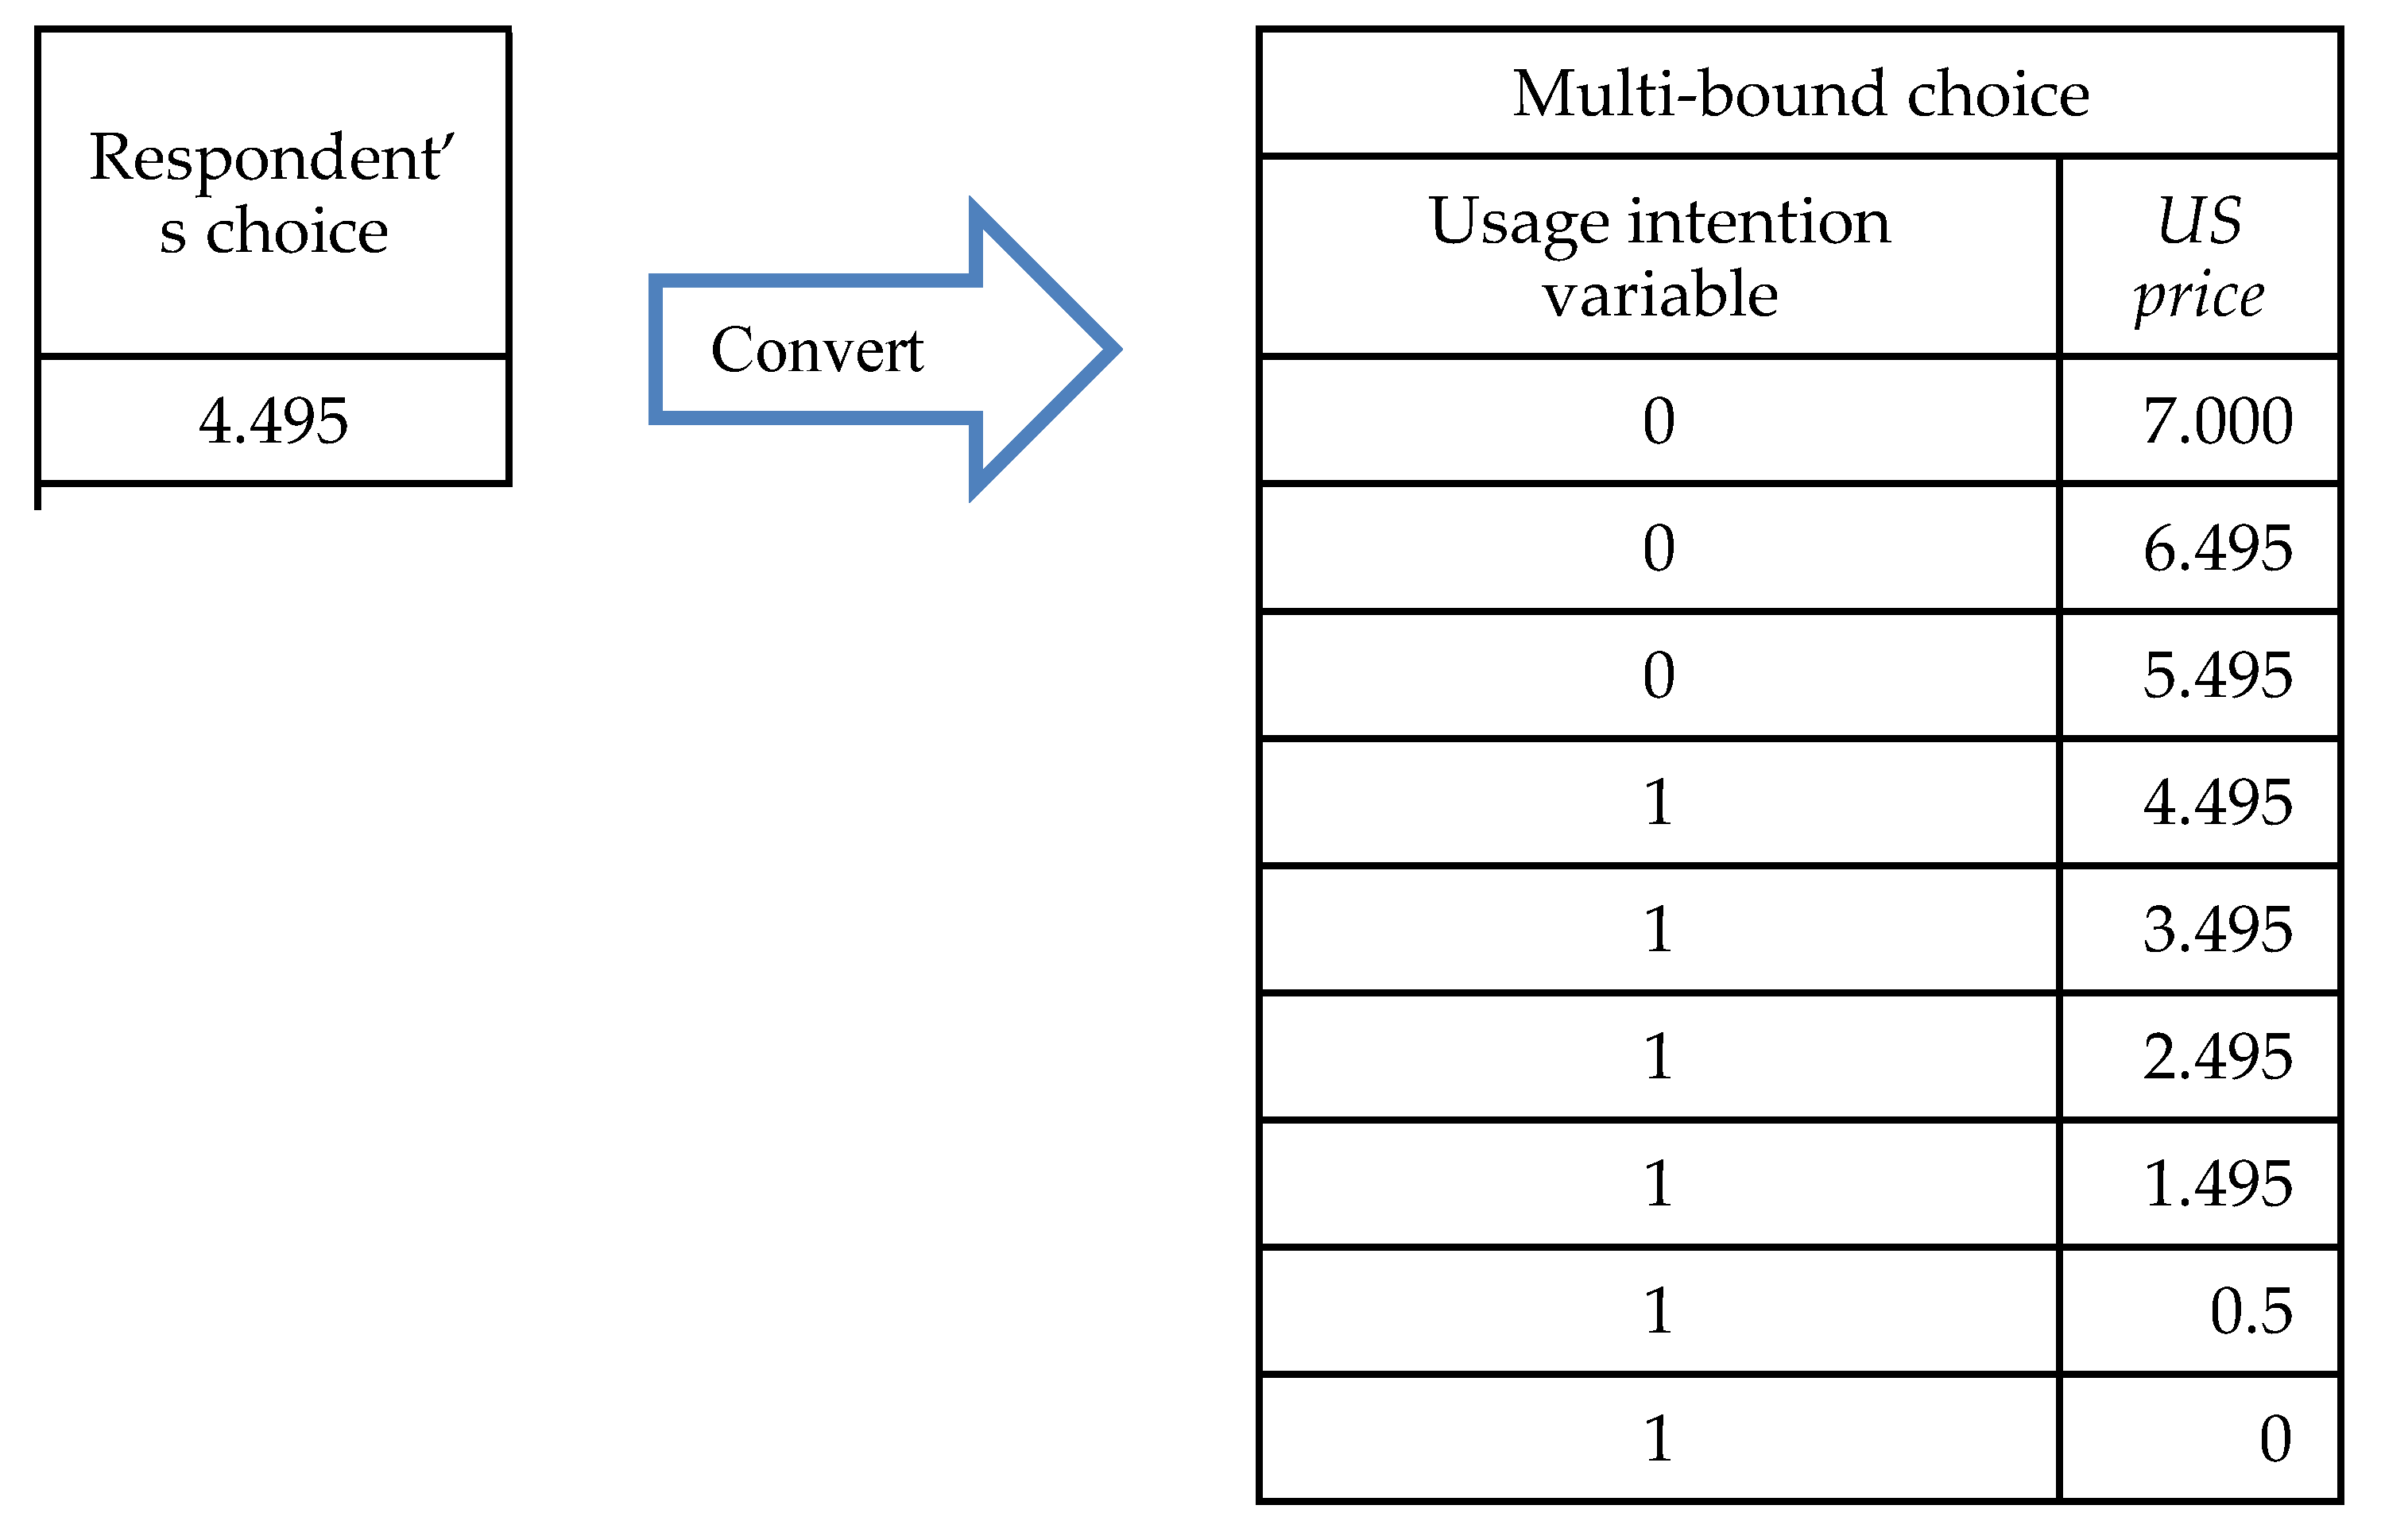
Figure A1.
Conversion to multi-bound choice format when respondent j chooses HEMS usage price of 4.495 USD.
Figure A1.
Conversion to multi-bound choice format when respondent j chooses HEMS usage price of 4.495 USD.

We presented respondents with nine choices of eight price zones and the option of "I’m not willing to pay." In this model, each choice is converted to the usage price shown in Table A4. Furthermore, to analyze the results by the binary logit model, each of the respondents’ answers is converted into the format for multi-bound choice, as follows. For example, if a respondent chooses HEMS usage price of 4.495, we assume that he/she would not use HEMS (usage intention variable = 0) for prices of 7.000, 6.495, and 5.495, but that he/she would use it (usage intention variable = 1) for prices of 3.495, 2.495, 1.495, 0.5, and 0 (See Figure A1). Therefore, there are nine data items for each response.
In formulae (C4) and (C5), for dummy, we selected the dummy variable indicating the degree of comprehension of HEMS and the dummy variable indicating the trust in utility companies. The former takes the value zero when if a respondent chooses “Not understood at all” or “Not Understand” for the explanatory slide on HEMS, and takes the value one when a respondent chooses “Understood very well” or “Understand.” The latter takes the value zero when a respondent rates trust in utility companies as “Extremely unlikely” or “Unlikely,” and takes the value one when a respondent rates it as “Extremely likely” or “Likely.”
The estimation results for Model I are shown in Table A5 for New York and in Table A6 for Tokyo. Table A7 and Table A8 show the estimation results for Model II. For Model II, we show the results in which we selected the dummy variable indicating the trust in utility companies for New York data set and the dummy variable indicating the degree of comprehension of HEMS for Tokyo dataset. If we swap the factors between New York and Tokyo, the estimation results are not significant.
Table A5.
The results of binary logit model (Model I: New York).
| MS | AC | EI | |
|---|---|---|---|
| price (USD) | −0.1981 (0.0178) *** | −0.1535 (0.0180) *** | −0.1724 (0.0182) *** |
| Constant | −1.7435 (0.0673) *** | −1.9090 (0.0713) *** | −1.8625 (0.0708) *** |
| Number of obs. | 9824 | 9112 | 9112 |
| Log likelihood | −2669.8780 | −2466.4788 | −2432.9748 |
| Wald chi2(1) | 123.7 *** | 72.82 *** | 89.95 *** |
| Pseudo R2 | 0.0243 | 0.0148 | 0.0185 |
Standard errors are indicated in parentheses. *, **, and *** imply statistical significance at the 0.1, 0.05, and 0.01 probability levels, respectively.
Table A6.
The results of binary logit model (Model I: Tokyo).
| MS | AC | EI | |
|---|---|---|---|
| price (JPY) | −0.0031 (0.0002) *** | −0.0028 (0.0002) *** | −0.0029 (0.0002) *** |
| Constant | −1.5097 (0.0610) *** | −1.5281 (0.0591) *** | −1.5968 (0.0610) *** |
| Number of obs. | 10528 | 10528 | 10528 |
| Log likelihood | −2585.7179 | −2769.2167 | −2598.3504 |
| Wald chi2(1) | 330.32 *** | 298.91 *** | 293.56 *** |
| Pseudo R2 | 0.0562 | 0.0451 | 0.0472 |
Standard errors are indicated in parentheses. *, **, and *** imply statistical significance at the 0.1, 0.05, and 0.01 probability levels, respectively.
Table A7.
The results of binary logit model (Model II: New York).
| MS | AC | EI | |
|---|---|---|---|
| price (USD) | −0.2760 (0.0424) *** | −0.1776 (0.0403) *** | −0.2449 (0.0423) *** |
| price x trust dummy | 0.2036 (0.0503) *** | 0.1378 (0.0488) *** | 0.1897 (0.0505) *** |
| trust dummy | −0.3955 (0.1856) *** | −0.1718 (0.1971) | −0.3090 (0.1941) |
| Constant | −1.6141 (0.1464) *** | −1.9500 (0.1562) *** | −1.7588 (0.1528) *** |
| Number of obs. | 5680 | 5216 | 5216 |
| Log likelihood | −1620.3431 | −1493.7519 | −1477.3351 |
| Wald chi2(3) | 50.87 *** | 26.92 *** | 41.22 *** |
| Pseudo R2 | 0.0193 | 0.0100 | 0.0162 |
Standard errors are indicated in parentheses. *, **, and *** imply statistical significance at the 0.1, 0.05, and 0.01 probability levels, respectively.
Table A8.
The results of binary logit model (Model II: Tokyo).
| MS | AC | EI | |
|---|---|---|---|
| price (JPY) | −0.0056 (0.0013) *** | −0.0061 (0.0013) *** | −0.0067 (0.0014) *** |
| price x comprehension dummy | 0.0027 (0.0013) *** | 0.0036 (0.0013) *** | 0.0041 (0.0014) *** |
| comprehension dummy | −0.0981 (0.3041) | −0.1030 (0.3002) | −0.3620 (0.3021) |
| Constant | −1.3874 (0.2959) *** | −1.4018 (0.2925) *** | −1.2281 (0.2938) *** |
| Number of obs. | 8264 | 8264 | 8264 |
| Log likelihood | 2076.2658 | 2237.3031 | 2086.3383 |
| Wald chi2(3) | 255.8 *** | 228.22 *** | 219.8 *** |
| Pseudo R2 | 0.0581 | 0.0478 | 0.0503 |
Standard errors are indicated in parentheses. *, **, and *** imply statistical significance at the 0.1, 0.05, and 0.01 probability levels, respectively.
References
- Faruqui, A.; Sergici, S. Household response to dynamic pricing of electricity: A survey of 15 experiments. J. Regul. Econ. 2010, 38, 193–225. [Google Scholar] [CrossRef]
- Ito, K.; Ida, T.; Tanaka, M. Moral Suasion and Economic Incentives: Field Experimental Evidence from Energy Demand. Am. Econ. J. Econ. Policy 2018, 10, 240–267. [Google Scholar] [CrossRef] [Green Version]
- Kato, T.; Tokuhara, A.; Ushifusa, Y.; Sakurai, A.; Aramaki, K.; Maruyama, F. Consumer responses to critical peak pricing: Impacts of maximum electricity-saving behavior. Electr. J. 2016, 29, 12–19. [Google Scholar] [CrossRef]
- Zipperer, A.; Aloise-Young, P.A.; Suryanarayanan, S.; Roche, R.; Earle, L.; Christensen, D.; Bauleo, P.; Zimmerle, D. Electric Energy Management in the Smart Home: Perspectives on Enabling Technologies and Consumer Behavior. Proc. IEEE 2013, 101, 2397–2408. [Google Scholar] [CrossRef]
- Ishii, H.; Hirohashi, W.; Mitsuoka, M.; Hayashi, Y. Demand-side response/Home energy management. In Smart Grid Handbook; John Wiley and Sons, Ltd.: Hoboken, NJ, USA, 2016; Volume 3. [Google Scholar] [CrossRef]
- Son, Y.S.; Pulkkinen, T.; Moon, K.D.; Kim, C. Home energy management system based on power line communication. IEEE Trans. Consum. Electron. 2010, 56, 1380–1386. [Google Scholar] [CrossRef]
- Han, D.M.; Lim, J.H. Smart home energy management system using IEEE 802.15.4 and zigbee. IEEE Trans. Consum. Electron. 2010, 56, 1403–1410. [Google Scholar] [CrossRef]
- Li, R.; Dane, G.; Finck, C.; Zeiler, W. Are building users prepared for energy flexible buildings?—A large-scale survey in the Netherlands. Appl. Energy 2017, 203, 623–634. [Google Scholar] [CrossRef]
- Nakano, S.; Washizu, A. Acceptance of energy efficient homes in large Japanese cities: Understanding the inner process of home choice and residence satisfaction. J. Environ. Manag. 2018, 225, 84–92. [Google Scholar] [CrossRef]
- Stenner, K.; Frederiks, E.R.; Hobman, E.V.; Cook, S. Willingness to participate in direct load control: The role of consumer distrust. Appl. Energy 2017, 189, 76–88. [Google Scholar] [CrossRef]
- Bayram, I.S.; Ustun, T.S. A survey on behind the meter energy management systems in smart grid. Renew. Sustain. Energy Rev. 2017, 72, 1208–1232. [Google Scholar] [CrossRef]
- Zhang, C.; Wang, Q.; Zeng, S.; Baležentis, T.; Štreimikienė, D.; Ališauskaitė-Šeškienė, I.; Chen, X. Probabilistic multi-criteria assessment of renewable micro-generation technologies in households. J. Clean. Prod. 2019, 212, 582–592. [Google Scholar] [CrossRef]
- Hu, Q.; Li, F. Hardware Design of Smart Home Energy Management System with Dynamic Price Response. IEEE Trans. Smart Grid 2013, 4, 1878–1887. [Google Scholar] [CrossRef]
- Basit, A.; Sidhu, G.A.S.; Mahmood, A.; Gao, F. Efficient and Autonomous Energy Management Techniques for the Future Smart Homes. IEEE Trans. Smart Grid 2017, 8, 917–926. [Google Scholar] [CrossRef]
- Ozturk, Y.; Senthilkumar, D.; Kumar, S.; Lee, G. An Intelligent Home Energy Management System to Improve Demand Response. IEEE Trans. Smart Grid 2013, 4, 694–701. [Google Scholar] [CrossRef]
- Javaid, N.; Ullah, I.; Akbar, M.; Iqbal, Z.; Khan, F.A.; Alrajeh, N.; Alabed, M.S. An Intelligent Load Management System with Renewable Energy Integration for Smart Homes. IEEE Access 2017, 5, 13587–13600. [Google Scholar] [CrossRef]
- Gangale, F.; Mengolini, F.; Onyeji, I. Consumer engagement: An insight from smart grid projects in Europe. Energy Policy 2013, 60, 621–628. [Google Scholar] [CrossRef]
- Balta-Ozkan, N.; Davidson, R.; Bicket, M.; Whitmarsh, L. Social barriers to the adoption of smart homes. Energy Policy 2013, 63, 363–374. [Google Scholar] [CrossRef]
- Berry, S.; Whaley, D.; Davidson, K.; Saman, W. Near zero energy homes–What do users think? Energy Policy 2014, 73, 127–137. [Google Scholar] [CrossRef]
- Dütschke, E.; Paetz, A. Dynamic electricity pricing—Which programs do consumers prefer? Energy Policy 2013, 59, 226–234. [Google Scholar] [CrossRef]
- Oltra, C.; Boso, A.; Espluga, J.; Prades, A. A qualitative study of users’ engagement with real-time feedback from in-house energy consumption displays. Energy Policy 2013, 61, 788–792. [Google Scholar] [CrossRef]
- Reeves, B.; Cummings, J.J.; Scarborough, J.K.; Yeykelis, L. Increasing energy efficiency with entertainment media: An experimental and field test of the influence of a social game on performance of energy behaviors. Environ. Behav. 2015, 47, 102–115. [Google Scholar] [CrossRef]
- Van Dam, S.S.; Bakker, C.A.; Buiter, J.C. Do home energy management systems make sense? Assessing their overall lifecycle impact. Energy Policy 2013, 63, 398–407. [Google Scholar] [CrossRef]
- Dyson, M.E.H.; Borgeson, S.D.; Tabone, M.D.; Callaway, D.S. Using smart meter data to estimate demand response potential, with application to solar energy integration. Energy Policy 2014, 73, 607–619. [Google Scholar] [CrossRef]
- Bamberg, S.; Möser, G. Twenty years after Hines, Hungerford, and Tomera: A new meta-analysis of psycho-social determinants of pro-environmental behavior. J. Environ. Psychol. 2007, 27, 14–25. [Google Scholar] [CrossRef]
- Ajzen, I. The theory of planned behavior. Organ. Behav. Hum. Decis. Process. 1991, 50, 179–211. [Google Scholar] [CrossRef]
- Xu, X.; Arpan, L.M.; Chen, C. The moderating role of individual differences in responses to benefit and temporal framing of messages promoting residential energy saving. J. Environ. Psychol. 2015, 44, 95–108. [Google Scholar] [CrossRef] [Green Version]
- Scott, F.L.; Jones, C.R.; Webb, T.L. What do people living in deprived communities in the UK think about household energy efficiency interventions? Energy Policy 2014, 66, 335–349. [Google Scholar] [CrossRef] [Green Version]
- Chen, C.; Xu, X.; Frey, S. Who wants solar water heaters and alternative fuel vehicles? Assessing social–psychological predictors of adoption intention and policy support in China. Energy Res. Soc. Sci. 2016, 15, 1–11. [Google Scholar] [CrossRef]
- Davis, F.D. Perceived Usefulness, Perceived Ease of Use, and User Acceptance of Information Technology. MIS Q. 1989, 13, 319–340. [Google Scholar] [CrossRef]
- Liu, Y.; Hong, Z.; Zhu, J.; Yan, J.; Liu, P. Promoting green residential buildings: Residents’ environmental attitude, subjective knowledge, and social trust matter. Energy Policy 2018, 112, 152–161. [Google Scholar] [CrossRef]
- Chen, C.; Xu, X.; Arpan, L. Between the technology acceptance model and sustainable energy technology acceptance model: Investigating smart meter acceptance in the United States. Energy Res. Soc. Sci. 2017, 25, 93–104. [Google Scholar] [CrossRef]
- Ida, T.; Murakami, K.; Tanaka, M. A stated preference analysis of smart meters, photovoltaic generation, and electric vehicles in Japan: Implications for penetration and GHG reduction. Energy Res. Soc. Sci. 2014, 2, 75–89. [Google Scholar] [CrossRef]
- Aizaki, H. Developing the Farmer’s Compost Demand Forecasting Methods for Planning Compost Production Facilities: Based on Contingent Valuation Method, Irrigation. Rural. Eng. J. 2003, 2003, 469–477. (In Japanese) [Google Scholar] [CrossRef]
- Stigka, E.K.; Paravantis, J.A.; Mihalakakou, G.K. Social acceptance of renewable energy sources: A review of contingent valuation applications. Renew. Sustain. Energy Rev. 2014, 32, 100–106. [Google Scholar] [CrossRef]
- Gómez, W.; Salgado, H.; Vásquez, F.; Chávez, C. Using stated preference methods to design cost-effective subsidy programs to induce technology adoption: An application to a stove program in southern Chile. J. Environ. Manag. 2014, 132, 346–357. [Google Scholar] [CrossRef] [PubMed] [Green Version]
- Yamamoto, Y. Opinion leadership and willingness to pay for residential photovoltaic systems. Energy Policy 2015, 83, 185–192. [Google Scholar] [CrossRef]
- Vidogbéna, F.; Dégbidi, A.; Tossou, R.; Assogba-Komlan, F.; Martin, T.; Ngouajio, M.; Simon, S.; Parrot, L.; Garnett, S.T.; Zander, K.K. Exploring factors that shape small-scale farmers’ opinions on the adoption of eco-friendly nets for vegetable production. Environ. Dev. Sustain. 2016, 18, 1749–1770. [Google Scholar] [CrossRef]
- Schlomann, B.; Schleich, J. Adoption of low-cost energy efficiency measures in the tertiary sector—An empirical analysis based on energy survey data. Renew. Sustain. Energy Rev. 2015, 43, 1127–1133. [Google Scholar] [CrossRef]
- Bogale, A. Valuing Natural Forest Resources: An Application of Contingent Valuation Method on Adaba-Dodola Forest Priority Area, Bale Mountains, Ethiopia. J. Sustain. For. 2011, 30, 518–542. [Google Scholar] [CrossRef]
- Lin, B.; Tan, R. Estimation of the environmental values of electric vehicles in Chinese cities. Energy Policy 2017, 104, 221–229. [Google Scholar] [CrossRef]
- Winkelman, R.; Boes, S. Analysis of Microdata; Springer: New York, NY, USA, 2006; Available online: https://0-www-springer-com.brum.beds.ac.uk/jp/book/9783540296072 (accessed on 1 December 2018).
- Nichols, B.G.; Kockelman, K.M. Life-cycle energy implications of different residential settings: Recognizing buildings, travel, and public infrastructure. Energy Policy 2014, 68, 232–242. [Google Scholar] [CrossRef] [Green Version]
Figure 1.
Ratio of participants’ WTP.

Table 1.
WTP for HEMS functions (USD).
| New York | Tokyo | |||||
|---|---|---|---|---|---|---|
| Obs | Mean | Std.Dev. | Obs | Mean | Std.Dev. | |
| MS | 1228 | 1.96 | 2.27 | 1316 | 1.51 | 1.88 |
| AC | 1139 | 2.04 | 2.32 | 1316 | 1.74 | 1.96 |
| EI | 1139 | 1.96 | 2.28 | 1316 | 1.56 | 1.91 |
Table 2.
Demand probability for each HEMS function at given price (comparison between Japan and the US, 1 USD = 100 JPY).
Table 2.
Demand probability for each HEMS function at given price (comparison between Japan and the US, 1 USD = 100 JPY).
| New York | Tokyo | |||||||
|---|---|---|---|---|---|---|---|---|
| Price (USD) | Average price elasticity | Price (USD) | Average price elasticity | |||||
| 2.5 | 4.5 | 7.0 | 2.5 | 4.5 | 7.0 | |||
| MS | 25.6% | 18.8% | 12.4% | −0.21 | 24.8% | 14.9% | 7.4% | −0.27 |
| AC | 28.9% | 23.0% | 16.9% | −0.19 | 22.8% | 14.6% | 7.9% | −0.23 |
| EI | 28.7% | 22.2% | 15.6% | −0.20 | 26.5% | 16.9% | 9.0% | −0.27 |
| Difference between MS and AC | 3.3% | 4.2% | 4.5% | −1.9% | −0.4% | 0.5% | ||
| AC and EI | −0.2% | −0.8% | −1.3% | 3.6% | 2.3% | 1.2% | ||
| MS and EI | 3.1% | 3.4% | 3.2% | 1.7% | 2.0% | 1.6% | ||
Table 3.
Demand probability for each HEMS function at a given price: comparison based on the presence or absence of trust in utility companies (NY).
Table 3.
Demand probability for each HEMS function at a given price: comparison based on the presence or absence of trust in utility companies (NY).
| Trust in Utility Companies | MS | AC | EI | |||||||
|---|---|---|---|---|---|---|---|---|---|---|
| USD | 2.5 | 4.5 | 7.0 | 2.5 | 4.5 | 7.0 | 2.5 | 4.5 | 7.0 | |
| A. Yes | 22.7% | 20.3% | 17.5% | 21.4% | 20.1% | 18.5% | 20.9% | 19.2% | 17.1% | |
| B. No | 26.5% | 17.2% | 9.4% | 30.9% | 23.9% | 16.7% | 28.0% | 19.3% | 11.5% | |
| Difference between A and B | −3.8% | 3.1% | 8.1% | −9.5% | −3.8% | 1.8% | −7.1% | −0.1% | 5.7% | |
| Average price elasticity | A | −0.08 | −0.04 | −0.06 | ||||||
| B | −0.27 | −0.22 | −0.26 | |||||||
Table 4.
Demand probability for each HEMS function at a given price: comparison based on awareness of HEMS (Tokyo, 1 USD = 100 JPY).
Table 4.
Demand probability for each HEMS function at a given price: comparison based on awareness of HEMS (Tokyo, 1 USD = 100 JPY).
| Comprehension of HEMS | MS | AC | EI | |||||||
|---|---|---|---|---|---|---|---|---|---|---|
| USD | 2.5 | 4.5 | 7.0 | 2.5 | 4.5 | 7.0 | 2.5 | 4.5 | 7.0 | |
| A. Yes | 22.6% | 13.9% | 7.1% | 19.6% | 12.9% | 7.1% | 24.3% | 16.0% | 9.0% | |
| B. No | 27.8% | 11.1% | 3.0% | 28.4% | 10.5% | 3.0% | 23.6% | 7.5% | 1.5% | |
| Difference between A and B | −5.3% | 2.8% | 4.2% | −8.8% | 2.4% | 4.2% | 0.7% | 8.5% | 7.5% | |
| Average price elasticity | A | −0.24 | −0.19 | −0.24 | ||||||
| B | −0.39 | −0.40 | −0.34 | |||||||
© 2019 by the authors. Licensee MDPI, Basel, Switzerland. This article is an open access article distributed under the terms and conditions of the Creative Commons Attribution (CC BY) license (http://creativecommons.org/licenses/by/4.0/).
Share and Cite
MDPI and ACS Style
Washizu, A.; Nakano, S.; Ishii, H.; Hayashi, Y. Willingness to Pay for Home Energy Management Systems: A Survey in New York and Tokyo. Sustainability 2019, 11, 4790. https://0-doi-org.brum.beds.ac.uk/10.3390/su11174790
AMA Style
Washizu A, Nakano S, Ishii H, Hayashi Y. Willingness to Pay for Home Energy Management Systems: A Survey in New York and Tokyo. Sustainability. 2019; 11(17):4790. https://0-doi-org.brum.beds.ac.uk/10.3390/su11174790
Chicago/Turabian StyleWashizu, Ayu, Satoshi Nakano, Hideo Ishii, and Yasuhiro Hayashi. 2019. "Willingness to Pay for Home Energy Management Systems: A Survey in New York and Tokyo" Sustainability 11, no. 17: 4790. https://0-doi-org.brum.beds.ac.uk/10.3390/su11174790
Note that from the first issue of 2016, this journal uses article numbers instead of page numbers. See further details here.