Article

The Carbon Footprint of Energy Consumption in Pastoral and Barn Dairy Farming Systems: A Case Study from Canterbury, New Zealand

1
Department of Land Management and Systems, Lincoln University, Lincoln 7647, New Zealand
2
Alderbrook Farm Ltd., Rakaia 7783, New Zealand
*
Author to whom correspondence should be addressed.
Sustainability 2019, 11(17), 4809; https://doi.org/10.3390/su11174809
Submission received: 12 July 2019 / Revised: 27 August 2019 / Accepted: 28 August 2019 / Published: 3 September 2019
(This article belongs to the Section Sustainable Agriculture)

Abstract

:
Dairy farming is constantly evolving to more intensive systems of management, which involve more consumption of energy inputs. The consumption of these energy inputs in dairy farming contributes to climate change both with on-farm emissions from the combustion of fossil fuels, and by off-farm emissions due to production of farm inputs (such as fertilizer, feed supplements). The main purpose of this research study was to evaluate energy-related carbon dioxide emissions, the carbon footprint, of pastoral and barn dairy systems located in Canterbury, New Zealand. The carbon footprints were estimated based on direct and indirect energy sources. The study results showed that, on average, the carbon footprints of pastoral and barn dairy systems were 2857 kgCO2 ha−1 and 3379 kgCO2 ha−1, respectively. For the production of one tonne of milk solids, the carbon footprint was 1920 kgCO2 tMS−1 and 2129 kgCO2 tMS−1, respectively. The carbon emission difference between the two systems indicates that the barn system has 18% and 11% higher carbon footprint than the pastoral system, both per hectare of farm area and per tonne of milk solids, respectively. The greater carbon footprint of the barn system was due to more use of imported feed supplements, machinery usage and fossil fuel (diesel and petrol) consumption for on-farm activities.

1. Introduction

Dairy farming represents one of the most important agricultural systems in New Zealand, with about 11,748 dairy herds with 4.8 million dairy cows which annually produce more than 21 billion liters of milk. It is also a major contributor to the New Zealand economy (export value $NZ13.4 billion) [1,2].
New Zealand is renowned for its traditional pasture-based dairy farming system (PDF), where farmers aim to increase their profits by minimizing production costs through maximizing the proportion of grazed grass in the diet of lactating cows [3,4]. Over recent decades, NZ pasture-based dairy systems (PDF) have intensified due to higher financial benefits in the dairy sector, resulting in increased use of farm inputs (fertilizer, water, electricity, fuel etc.) in dairy systems to produce more milk per hectare of grassland [3,5]. In contrast to NZ’s pastoral system, barn dairy systems (BDF) have been a relatively recent introduction in NZ as a solution to animal welfare, soil structure damage and wider environmental challenges [6]. The use of barn facilities, however, requires further intensification of the system, in terms of the use of energy inputs to make the system profitable, making it difficult to achieve both financial and environmental benefits simultaneously [7].
The contribution that the dairy sector makes to the economy alongside ongoing intensification of its systems has meant that the sector also contributes a significant proportion to NZ total greenhouse gas (GHG) emissions [1]. Consequently, reducing GHG emissions from NZ dairy systems is a critical challenge for the industry.
The purpose of this research study was therefore to estimate carbon footprints (CO2) of NZ pastoral and barn dairy systems based on their energy consumption.

2. Literature Review

Energy consumption, water use and environmental emissions are becoming major challenges in an agro-food sector that is considered a significant contributor to climate change problems [8]. Agricultural and livestock activities are responsible for primary GHG emissions such as methane (CH4), nitrous oxide (N2O) and carbon dioxide (CO2), and contributed around 10–12% to global anthropogenic GHG emissions [8,9]. The Food and Agriculture Organization [10] stated that the entire livestock sector accounted for 18% of global GHG emissions, when considering the whole production chain-from land use and feed production to waste management. However, recent studies attribute lower quotas from 2 to 4 percent of total GHG emissions to the livestock sector, while crediting 20% of that livestock emission to milk production [11,12].
In NZ, the agriculture sector accounts for 48% of NZ gross emissions [13] with a 36% share coming from pasture-based farming systems [14,15]. The energy sector is the next greatest contributor to NZ gross emissions at 41%, followed by industrial processes and product use (IPPU) at 6% [13]. Among dairy farming systems, the primary GHG emissions are CH4, N2O and CO2 emitted from livestock ruminant, agricultural soils and energy consumption respectively. The majority of the emissions in terms of CO2 equivalent come from enteric fermentation (71%), followed by N2O from soils (22%) [13]. The remaining contribution comes from manure management (4.1%), urea application (1.5%), liming (1.2%) and field burning of agricultural residues (0.1%). What is also of note is the increase of emissions (N2O and CO2 combined) from synthetic urea from 0.9% to 5.8% between 1990 and 2017 [13]. Energy use in terms of agricultural fuel combustion is reported under energy, rather than agriculture, in NZ’s Greenhouse Gas inventory. Fuel combustion for agriculture is reported in a combined category alongside commercial and residential. This category contributes 10% of the overall emissions from the energy sector, the majority of the remaining contribution falling equally to manufacturing and transport [13]. The final sector of interest is that reported under IPPU, where reference is made to the production of lime generating 21% of CO2 equivalent emissions in the minerals category which contributes 13.5% to the emissions of the IPPU sector, and the production of fertilizer which makes a “significant contribution” to the chemicals category which contributes 6% to the emissions of IPPU sector. What is not accounted for is overseas production and import of these inputs to the agricultural sector. Furthermore, during 1990–2014, NZ agricultural emissions increased by 15% due to the intensification and growth in dairy production systems [16]. What can be suggested from this data is that energy use in dairy systems is a relatively small contributor to GHG emissions when compared to methane emissions from enteric fermentation but with intensification of system will be increasing in terms of its relative proportion.
New Zealand dairy farming is constantly developing more intensive systems of management, which involve higher utilization of durable and non-durable inputs [5]. These inputs are responsible for significant direct and indirect fossil energy consumption, which produce notable emissions of CO2. On farm, direct emission of CO2 occurs due to consumption of fossil fuels in machinery involved in different dairy farming operations. Off-farm, indirect emissions occur in other industrial sectors, which supply the farm inputs (fertilizers, feed supplements, machinery etc.) consumed in the farming operations or processes [17]. In other words, the consumption of fossil energy in farming activities contributes to climate change both with on-farm emissions from the combustion of fuels, and by off-farm emissions due to production and transportation of agricultural inputs to the farm [18]. Consequently, the more efficient use of fossil energy resources together with an increased use of renewable energies can play a key role in the development of more sustainable dairy production systems.
This intensification of pastoral dairy systems has put NZ agriculture under huge pressure from both the general public and regulatory bodies due to the perceived detrimental environmental impacts. Initially, the focus has been on concerns over nitrate leaching and phosphorous run-off to waterways [5]. More recently, the significant contribution that pastoral systems, and in particular, the dairy sector, make to GHG emissions has raised concerns regarding the ability of NZ to reduce its emissions below 1990s level under the Paris Accord (Under the Paris Agreement, New Zealand has a target to reduce its GHG emissions by 30% below 2005 levels by 2030. This target is equivalent to 11% below 1990 levels by 2030 [19]. To achieve this the Government has proposed a “Zero Carbon Bill” which sets new emissions reduction targets for all NZ industries including the dairy sector; CO2 and N2O emissions have to reduce to net zero by 2050, while CH4 has a reduction target of up to 10% by 2030 [20]) Agreement [3,14,19].
Under the Paris Accord agreement, New Zealand has commitments to reduce its GHG emissions to 30% below 2005 levels by 2030 [19]. To achieve this reduction, the New Zealand government is proposing a “Zero Carbon Bill” which sets new emission reduction targets for all NZ industries including the dairy sector. It requires CO2 and N2O emissions to reduce to net zero by 2050 [20].
There are number of research studies in New Zealand which evaluate the environmental impacts of NZ dairy systems, based on the major CH4 and N2O emissions [14,15]. Several studies have also estimated the carbon footprints (CO2) of agricultural systems based on energy consumption. In the dairy sector, Wells [21] evaluated for the first time the energy-related carbon footprints of NZ pastoral systems from eight different regions and found that Canterbury dairy systems are more energy intensive and have higher carbon footprints compared to other dairy systems in other regions, mainly due to the higher use of irrigation. Later, Saunders and Barber [22] compared NZ and UK dairy industries based on energy use and GHG emissions in response to a “Food Miles” debate (Food Miles was an issue which arose in UK, Germany and other countries due to environmental concerns over food transportation. The main argument was that the longer transport distance (food miles) involved more energy consumption, which released higher greenhouse gas emissions, hence caused global warming [23]). They considered “cradle to gate” farm energy inputs used for milk production along with transportation energy to compare GHG emissions of both systems and acknowledged the NZ dairy system as more emission efficient than the UK system.
In the international literature, there are a number of research studies that have compared and evaluated organic and conventional pastoral dairy systems based on energy use and associated GHG emissions. They found lower GHG emissions in organic systems compared to conventional systems [24,25,26]. Some other studies have evaluated carbon footprints of dairy systems through considering only direct energy inputs (fossil fuel, electricity) and have found that fossil fuel especially diesel is the leading source of CO2 emissions within the total carbon footprint compared to electricity consumption [27,28]. From a system comparative perspective, Flysjö, et al. [29] compared NZ’s pastoral dairy system with a barn system from Sweden and found lower carbon footprints in the NZ pastoral system over the Swedish barn system. Similarly, in another study, O’Brien, et al. [30] compared energy-related environmental impacts of Irish pastoral and barn dairy systems based on a life cycle assessment (LCA) approach and found greater environmental impacts in the barn system than the pastoral one, based both on milk production and farm area. However, this study was conducted on just two research dairy farms and may not be truly representative of commercial systems.
NZ literature is limited regarding energy consumption and carbon footprint evaluation between contrasting dairy systems and, although of use, it is difficult to directly compare dairy systems between different countries due to huge variation between systems’ boundaries, methodological approach and representative data issues. There is also no study in New Zealand which has evaluated energy-related carbon footprints of PDF and BDF systems. In this context, and given the need to reduce GHG emissions from the sector, there is need for research to assess energy-related carbon footprints of NZ PDF and BDF systems to identify more energy efficient and potentially more sustainable dairy systems for the future of the NZ dairy industry.

3. Materials and Methods

This study was carried out on 50 conventional dairy farms in Canterbury, New Zealand. Canterbury is one of the important dairy regions of NZ, comprising 10% of the dairy herd and 16% of NZ dairying land [31]. The study collected data from 43 PDF and seven BDF systems.
Pastoral Dairy Farming Systems (PDF) are the typical NZ dairy system, where animals are kept on pasture year-around through rotationally grazed paddocks. In the Canterbury region, the majority of farms require and use irrigation. Barn Dairy Farming Systems (BDF) are where, in addition to pasture grazing, animals are housed in barn buildings such as Freestall, Herdhomes etc. for different time durations throughout the season. In Canterbury, the total number of dairy farms is around 1100. Of these it is estimated that there are 35 farms which operate with a barn system. Seven of these businesses (20%) participated in the study. For the pastoral systems, a 20% sample (>200 farms) would be unrealistic to achieve given the nature of the data required. A sample of 43 (4%), being five times that of the number of barn system cases, was deemed representative for the purposes of this study.
The data were derived using two different sources: literature review and a structured questionnaire. For this purpose, data for the season 2016–2017 were collected through face-to-face interviews using the structured questionnaire in the Supplementary Materials. The study only measured carbon footprints in the form of CO2 emissions associated with energy consumption, without considering CO2 emissions from agricultural soils. The carbon footprints of both the PDF and BDF systems were then analyzed based on CO2 emission from direct and indirect energy sources including fuel, electricity, fertilizers, imported feed supplements and machinery using coefficients drawn from the literature. In this study, the system boundary was set at farm level “from cradle-to-farm gate” excluding the post-processing components of milk when it leaves the farm gate, i.e., transport and waste disposal components of the product’s life cycle were not considered beyond the farm gate (as shown in Figure 1). Thus, carbon footprints (CF) of PDF and BDF systems were estimated as the sum of the input factors (Ai) multiplied with their appropriate CO2 emission coefficients (Ci), (Equation (1)):
CF = ∑ (AiCi)
For converting each farm input into CO2 emissions, different conversion factors or coefficients were selected after investigation and evaluation of different studies. In this study, farm inputs were first converted into energy equivalents and then into CO2 emissions.

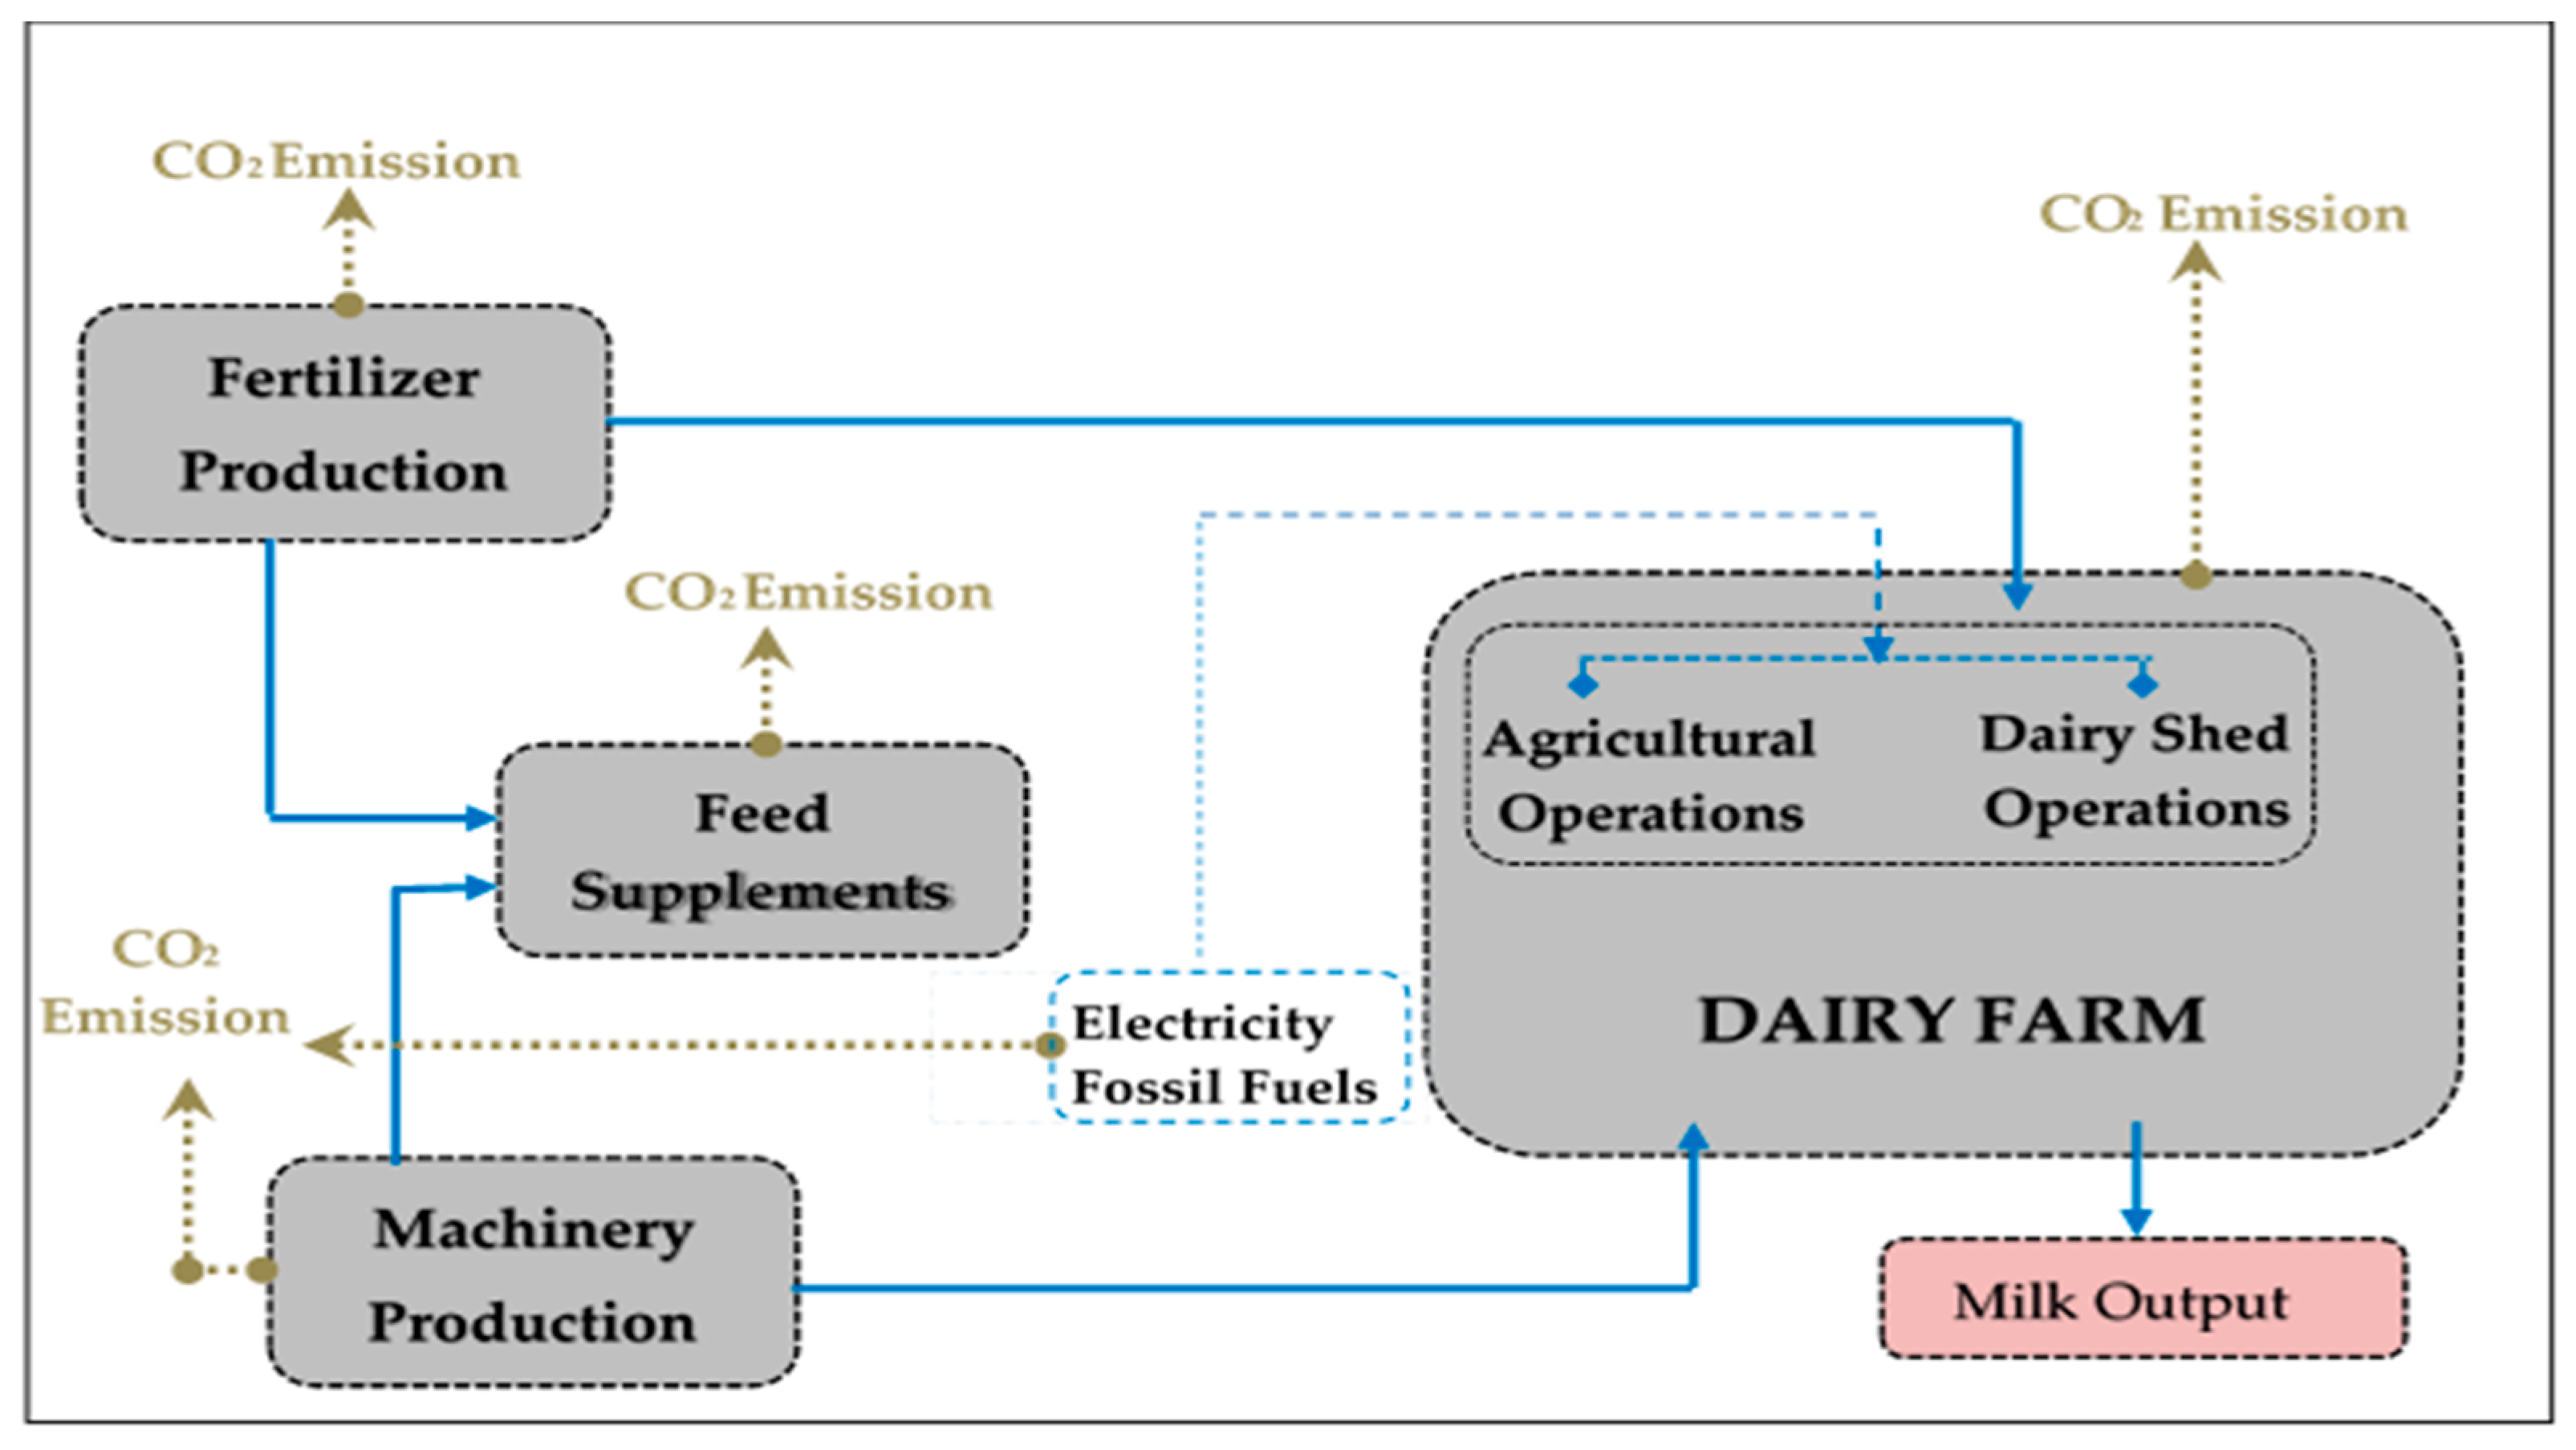
3.1. Farm Energy Inputs

3.1.1. Fossil Fuel

Diesel and petrol are the leading fuel inputs used in NZ dairy farming systems. The combustion of fossil fuels occurs during different farming operations such as tillage, harvesting, fertilizer application, irrigation and spraying etc. emitting CO2 gas into the atmosphere [32,33]. Diesel is mainly used in tractors, trucks and heavy machinery, while petrol is only used in motorbikes and light trucks, etc. Comparatively, the usage of diesel was higher for farm machinery; because most of the farm machinery is based on diesel engines due to their benefits such as being durable, strong and having higher efficiency than the petrol engine [34]. For measuring the fuel consumption in tractors, there are several ways available based on the power of the tractors; but the influence of numerous factors such as soil conditions, air pressure, height above sea level, humidity and temperature, fuel consumption, etc. restricted those methods to specific areas [33,35,36]. Further, these methods are only effective in the study of fuel consumption for diesel engines under a full-load, but under fractional loads and variable speed conditions, again these methods are not applicable [37].
In this study, total fuel consumption for each dairy system was determined from data collected during the interviews. For the energy coefficients and emission factors for diesel and petrol, different studies and reports were investigated. Hence, the most recent dairy farming related energy coefficients for diesel and petrol were taken as 45 and 42 MJ/liter [38,39], and the base CO2 emissions factors associated with diesel and petrol were considered as 0.07 and 0.06, respectively [40].

3.1.2. Electricity

In Canterbury, dairy farming systems, electricity is mostly consumed in irrigation and dairy shed operations. For irrigation, electricity is mainly used for pumping water from rivers and wells, and its consumption fluctuates according to type of irrigation system, water table depth and crop water requirements [33,41,42]. For dairy sheds, electricity is mainly used to operate milking parlours for the milk extraction process along with water heating, ventilation and lighting purposes. According to Carran, et al. [43], in the average NZ pastoral system, 59% of direct energy inputs are associated with electricity consumption, and the major portion of this total electricity is consumed in the dairy shed with the rest used for irrigation pumping and dairy effluent treatment. Based upon a pastoral system, Hartman and Sims [44] distributed electricity consumption into different dairy shed operations on a per cow basis encompassing water heating (51 kWh cow−1), milk cooling (34 kWh cow−1), milk machinery (29 kWh cow−1), water pumping (29 kWh cow−1) and lighting (20 kWh cow−1), etc. On-farm, there are no direct emissions from electricity consumption, but off-farm electricity generation releases a significant amount of CO2 emissions into the atmosphere due to the burning of fossil fuels. In New Zealand, around two-thirds of electricity is generated through renewable energy sources [33], leading to lower carbon emissions from electricity generation when compared to non-renewable resources.
In a desired situation, the conversion factor for electricity is 3.6 MJ/kWh. This conversion factor does not consider any electricity generation and conversion inefficiencies. Given the potential for inefficiencies in the system, the primary energy content of electricity was considered as 8.14 MJ/kWh [23] and based on the grid-mix of non-renewable and renewable resources used in generation, the average electricity emission factor was taken as 0.03 kgCO2/MJ [40]. In this study, annual electricity consumption for each system was determined from data collected during the interviews, and through multiplying the electricity amount with the carbon emission factor, the total CO2 emissions for electricity was calculated.

3.1.3. Fertilizer

The increase in farm area and herd size have not only contributed to more production but have also led to the intensification of pastoral land use. Over the last two decades, the intensification of the New Zealand dairy industry has noticeably increased the farm energy consumption; especially fertilizers and electricity as leading energy inputs into Canterbury dairy farming systems [39,45]. The use of synthetic fertilizers in NZ dairy systems has not only increased the energy usage, but also the environmental impacts such as GHG emissions and contamination of waterways [46,47].
Among energy consumption, fertilizer is one of the major energy inputs contributing significantly to GHG emissions of dairy farming systems after animal related emissions (such as methane from enteric fermentation and nitrous oxide from excreta). The Ledgard, et al. [48] study suggests that fertilizers and lime contributed about 15% to on-farm GHG emissions or more than 50% of off-farm emissions (CO2), in part because off-farm the production and manufacturing of synthetic fertilizers based on fossil fuels resources, emit massive carbon emissions into the atmosphere [34]. Among the fertilizers, nitrogen fertilizer is mostly applied to dairy land and its use increased seven-fold between 1991 and 2009, with an average use of 120kg N/ha in 2009 on New Zealand dairy systems [49].
In Canterbury, dairy systems, farmers use ammonia-urea and superphosphate more than other fertilizers. In this study, fertilizer amount was recorded by fertilizer type used in the two systems. Subsequently the emissions associated with each fertilizer type were estimated by breaking down each fertilizer into their essential components (N, P, K, S), and then multiplied with their relevant carbon emission factors. The embodied energy involved in manufacturing each fertilizer component N, P, K, S were taken as 64.1, 28.4, 17.8 and 3.24 MJ kg−1 respectively [21], while corresponding emission factors were considered as 0.04, 0.08, 0.06, 0.71 kgCO2/MJ respectively [50].

3.1.4. Imported Feed Supplements

The New Zealand traditional PDF system is particularly built on low production costs with a high proportion of grazed grass in the diet of lactating cows [3,4]. In fact, there is evidence that increasing the proportion of pasture in a cow’s diet reduces production costs at an increasing rate [51,52]. However, due to the intensification of the NZ dairy industry over the last few decades [52], the NZ traditional dairy system has moved away from the purely pasture-based to one that relies more on imported feed supplements. Consequently, the use of imported feed supplements has increased in PDF systems, in part, to cover feed deficit conditions and reduce the production variability across the season [52,53]. Consequently, the NZ dairy industry has categorized dairy farming into five production systems based on the percentage of imported feed supplements usage (IFS) from System 1 with 0% IFS to System 5 with more than 31% IFS [54]. The use of imported feed supplements is higher in the BDF system due to the higher stocking rate and more intensive nature of the system. The most common types of imported feed supplements used in NZ dairy systems are grass silage, maize silage, hay, straw, palm kernel, and concentrate. As production of imported feed supplements involves fossil energy consumption and releases CO2 emissions into the atmosphere, it is considered as an indirect source of carbon emissions in this study.
In this study, the amounts of imported feed supplements were estimated for each dairy system from the data collected during the interviews. The values for energy coefficients and carbon emissions factors for each feed supplement were considered after careful investigation and evaluation of different studies, as shown in Table 1.

3.1.5. Machinery and Equipment

Dairy farming is constantly developing more intensive mechanization systems of management, in which utilization of agricultural machinery is increased to accomplish large farming operations with minimum human power. This can result in increased depletion of natural resources as well as the emission of greenhouse gases into the atmosphere [27]. During the last century, the usage of agricultural machinery especially tractors has increased in agriculture, with the number of tractors worldwide climbing from 11 to 28 million between 1961 and 2006 [33].
In agriculture, most commercial energy is consumed for manufacturing and operation of agricultural machinery [33,41]. According to Kitani [34], four different steps are involved in the estimation of energy requirements for producing and repairing agricultural machinery: first, the energy needed for producing the raw materials; second, the energy involved in the manufacturing process; third, the energy used for transporting the machines to the consumer; and last, the energy consumed in repairs and maintenance. In New Zealand dairy systems, tractors and self-propelled machines (utes, motorbikes) are used for different farming activities. To compute the annual energy input from tractors and other farming equipment, it is essential to know the mass (kg), energy equivalent, working life duration and average surface where the machine is used annually [55]. In this study, the estimated life of machinery was taken from the ASAE Standard D497.7 [56], the annual use of different machinery was assessed through data collected during the interviews, and the average weight of the different machinery was taken from Wells [21]. Based on the energy consumption involved in the production and repair of farm machinery, Wells [21] estimated energy coefficients and emission factor values for different machinery used in NZ dairy systems. Hence, in this study, the energy coefficients and CO2 emission values for machinery are considered as 160 MJ/kg and 0.08 kgCO2/MJ respectively [21].
In dairy sheds, rotary and herringbone were the most common types of milking parlors used in both type of dairy systems. Similarly to Wells [21], in this study, to determine the carbon emissions related to milking parlor energy the emission factor used was 0.1 kgCO2/MJ of shed energy (Shed energy based on number of milking cups calculated as per following equation. Shed energy (MJ) = (24.2*x + 293) *1000 (Where x = number of cups of the milking parlor)).

4. Results

Carbon Footprints of PDF and BDF Dairy Systems

Table 2 shows energy-related carbon footprints of NZ PDF and BDF farming systems on a per hectare basis. In this study, carbon footprints were measured as a sum of direct and indirect CO2 emissions released from energy consumption. On average, total carbon footprints of PDF and BDF systems were 2857 kgCO2 ha−1 and 3379 kgCO2 ha−1 respectively. When evaluating the contribution of individual energy inputs to total carbon footprints, fertilizer (25%) and machinery and equipment (27%) were the dominant sources of CO2 emissions in PDF systems. This is due to the high consumption of fertilizers, especially nitrogen, to grow more pasture in order to meet feed demand, and the use of milking equipment for milk extraction. In BDF systems, imported feed supplements (30%) and machinery and equipment (24%) were the leading energy inputs contributing to the total carbon footprints, because of the high usage of imported feed supplements and milking shed energy. The difference in total carbon footprints between the two dairy systems is 522 kgCO2 ha−1, a 15% lower CO2 emission in the PDF system compared to the BDF system. In other words, compared to the barn system, the pastoral system is 15% more emission efficient in terms of energy-related CO2 emissions.
In comparison to previous NZ studies, Wells [21] estimated the carbon footprints of NZ PDF systems across different regions of New Zealand. On a per hectare basis, Wells [21] found the carbon footprint as 2100 kgCO2 ha−1 for Canterbury PDF systems. Compared to the Wells study, the carbon footprints observed in this current study for PDF systems are 26% higher than those studies respectively, suggesting that the carbon footprints of pastoral systems have increased over the time, in part due to dairy intensification and probably higher consumption of electrical, fertilizer and feed supplement energy inputs.
Based on direct energy inputs, the carbon footprints for PDF and BDF systems were found as 763 kgCO2 ha−1 and 1064 kgCO2 ha−1 respectively. Among direct energy inputs, electricity emission ranks first in both dairy systems with 597 kgCO2 ha−1 and 647 kgCO2 ha−1 respectively. The reason behind this higher electricity emission in both systems was due to more electricity consumption for irrigation and milk extraction operations, also observed by Carran, et al. [43] and Wells [21]. From a system comparative perspective, electricity emission is slightly higher in the BDF system, which is probably due to more use of electricity in the barn facilities because of lighting, cleaning and effluent management activities. The main CO2 emission difference between the direct energy inputs of both dairy systems was due to diesel consumption, which is higher in the BDF system, probably due to more fuel requirements for feed management activities such as crop production, harvesting and feeding the cows inside the barn facilities. Compared to petrol, the diesel emission was higher in both dairy systems, due to more consumption of diesel for farm machinery such as tractors involved in on-farm operations (soil preparation, crop production, harvesting etc.), while petrol was only used in motorbikes and light vehicles used as transport both on-farm and for travelling to market.
The on-farm consumption of indirect energy inputs released CO2 emissions were 2094 kgCO2 ha−1 and 2315 kgCO2 ha−1, respectively, for PDF and BDF systems. Among indirect energy inputs, fertilizer (708 kgCO2 ha−1) and machinery and equipment (784 kgCO2 ha−1) were the leading emission sources in PDF systems, while in BDF systems, imported feed supplements (1015 kgCO2 ha−1) and machinery and equipment (801 kgCO2 ha−1) were the main indirect emission sources. Apart from machinery and equipment, higher feed demand was the key factor which makes fertilizer and imported feed supplements prominent sources of indirect emissions in both PDF and BDF dairy systems respectively. Overall, the carbon footprints due to indirect energy inputs are higher than the carbon footprints of direct inputs in both systems.
For an alternative, potentially better, evaluation of the environmental impacts of contrasting dairy farming systems, it is useful to evaluate their energy use and related carbon footprints on a milk production basis [24]. Thus, in this study, carbon footprints of both dairy systems were also assessed based on their milk solids productions (Table 3). On average, the carbon footprints of PDF and BDF systems per tonne of milk solids (t MS), were 1920 kgCO2 tMS−1 and 2129 kgCO2 tMS−1 respectively. The difference indicates that the PDF system displays a 10% (209 kgCO2 tMS−1) lower carbon footprint than the BDF system in the production of one tonne of milk solids. Based upon the percentage input distribution of carbon, a similar pattern was observed in the carbon footprint results of both systems (per tMS), as with the per hectare basis results.
In earlier literature, based on milk production, Saunders and Barber [22] determined the carbon footprint for the NZ PDF system as 1371 kgCO2 tMS−1. When compared with the current study results, this indicates a 28% growth in carbon footprints of NZ PDF systems during the last decades, again suggesting an intensification trend for NZ PDF systems primarily as a consequence of rising herd size and increasing energy use in the dairy farming systems. All previous NZ studies, including this current research study, found that fertilizer (indirect input) and electricity (direct input) were the major energy inputs contributing significantly to carbon footprints of PDF systems. From a system comparative perspective, Flysjö, et al. [29] compared the NZ pastoral dairy system with the barn system from Sweden and found similar results to this study i.e., lower carbon footprints for NZ PDF systems over the Sweden BDF system. In international literature, similar findings to this current research work were observed by O’Brien, et al. [30], where he found lower carbon footprints for Irish PDF systems over the BDF system, both per hectare and on a per milk solids basis. Like this study, he found feed supplements and fertilizer among the leading energy inputs and the main reasons for emission differences between the two systems.

5. Discussion

In this study, carbon footprints related to energy consumption of NZ PDF and BDF systems were evaluated based on emissions from direct and indirect energy inputs. The sample of farms included seven BDF systems compared to 43 PDF systems which is representative of the number of BDF and PDF systems in the Canterbury regions. The results indicated that NZ PDF systems have 15% lower carbon footprints on a per hectare basis compared to BDF systems. This indicates the intensive nature of the BDF system over the PDF system, meaning more energy inputs or resources are consumed in the BDF system releasing more CO2 emissions per hectare compared to the PDF system. Similarly, in terms of per unit of milk solids, the carbon footprint due to energy consumption are smaller in the PDF system than the BDF system.
The main difference between the carbon footprints of both systems is due to the type and amount of imported feed supplements, which are higher in the BDF system due to higher stocking rate and longer lactation periods. With respect to the type of feed supplements, the BDF system used more concentrated feed than the PDF system. The other key difference between the carbon footprints of both systems is due to fertilizer consumption. This is comparatively low in the BDF system due to better control of effluent collected under barn facilities. Off-farm, the production of imported feed supplements, along with emissions from the manufacturing process of other inputs including fertilizer and machinery manufacture, released additional CO2 into the atmosphere.
The reduced fertilizer consumption is probably one of the main benefits of using the BDF system. However, the high installation and operating cost along with dependence on a volatile milk price to make the system profitable may off-set the potential benefits [7]. In addition to that, the use of barn facilities makes the dairy system more intensive, increasing stocking rate and input consumption to produce more milk per cow. This in turn has increased the cow size (weight), increasing methane emissions per cow, as bigger cows produce more enteric methane due to their higher feed intake [57,58]. Based on these other greenhouse gases (CH4, N2O etc.) and their environmental impacts, a number of worldwide studies have recommended the PDF system as the ultimate solution to environmental challenges such as climate change rather than the BDF system [4,59,60]. Moreover, according to a Newman and Journeaux [7] study, it is difficult to achieve simultaneous environmental and financial benefits in the BDF system. Under these situations, using BDF facilities is probably not a good solution for NZ dairy systems both from an environmental and financial perspective since the volatile and unpredictable nature of NZ milk prices might put any investment in the BDF system under risk.
Usually, the environmental loads of dairy farming systems are measured in the form of pollutants released during the product life cycle through considering on-farm direct emissions. Indirect emissions released off-farm during the production of materials used for manufacturing of indirect energy inputs (fertilizer, machinery and equipment) are rarely included. Murgia, et al. [27] and Todde, et al. [28] estimated the carbon footprint of Italian dairy systems through considering only direct energy inputs. A limited number of other researchers [21,61], however, have determined carbon footprints of dairy systems based on both direct and indirect energy inputs. In this context, the current research work, similar to other NZ research studies, measured carbon footprints based on both direct and indirect energy inputs [21,23]. Likewise this current study, along with Saunders and Barber [22], and Todde, et al. [61] found the proportion of carbon footprint due to indirect energy inputs greater than the carbon footprint of direct energy inputs in the PDF system. The Wells [21] findings, however, contradict this finding that a higher proportion of the carbon footprint belonged to direct energy inputs instead of indirect inputs.
From a comparative perspective, the energy-related carbon footprints of PDF and BDF systems are under-studied in New Zealand. However, several researchers have assessed the carbon footprint from energy consumption in NZ PDF systems [21,23,62]. As in this research work, they found electricity and fertilizer as major sources of CO2 emissions among direct and indirect energy inputs in the PDF system and, that over the time, the use of electricity and fertilizer inputs has intensified in NZ PDF systems. This is due to more use of irrigation and electrical equipment in milking sheds as well as high usage of fertilizer for growing more pasture to meet required feed demand, resulting in more energy consumption and related carbon emissions. Moreover, when compared energy-related carbon footprints of larger and smaller size farms of each type of dairy system, this study results indicated that larger farms held higher carbon footprints than the smaller size farms. Which means as farm size or land use area increased in each type of dairy system, energy consumption and related CO2 emission also increased.
At present, energy management and environmental sustainability of farming systems are the topics whose importance has been increasing in recent times. In New Zealand currently reducing environmental emissions from farming systems is a critical issue for the NZ dairy industry. Although, CH4 emissions from enteric fermentation and N2O emissions from soils make up the majority of GHG emissions from agriculture, energy use within the agricultural sector directly in terms of fuel combustion and indirectly through the increasing use of synthetic fertilizers and other inputs is also of concern. It is also an area that is perhaps more easily addressed and managed than that of enteric fermentation and emissions from soils.
In this regard, minimizing carbon footprints associated with energy consumption will be helpful to achieve New Zealand’s emission reduction targets and will also help to reduce overall GHG emissions from NZ dairy systems and move towards more climate friendly or sustainable farming systems. Thus, a reduction in carbon footprints through better energy management or through energy efficiency improvement would be recommended for both dairy farming systems. In this regard, the following are some potential mitigation options for reducing energy-related carbon footprints from dairy systems.
  • Fossil Fuels: Fuel is mainly used in farm vehicles and tractors for farming operations. The use of new and efficient machinery accompanied by reduced operations, such as minimum tillage depth, could reduce the fuel consumption and associated carbon footprints in NZ dairy systems.
  • Electricity: Electricity consumption was mainly involved in irrigation and dairy shed activities such as milk extraction, milk refrigeration and water heating, etc. in both dairy systems. Improved irrigation systems and the use of the latest and most efficient electrical equipment along with renewable energy resources (solar) could provide environmental and financial benefits to farmers through cutting energy consumption and related costs.
  • Imported Feed Supplements: Off-farm the production of imported feed supplements involves energy consumption through inputs such as fossil fuel, fertilizer, machinery and equipment etc., which release CO2 into the atmosphere. Thus, using feed types which require less energy consumption both on- and off-farm, primarily nitrogen fertilizer, would lower carbon footprints as well as nutrients losses to waterways.
  • Fertilizer: Fertilizers, particularly nitrogen, are one of the leading sources of CO2 emissions in the NZ pastoral system and indirectly responsible for nutrient losses to waterways. Thus, a reduction in fertilizer consumption can provide environmental benefits as well as financial savings for farmers. In this regard, efficiency improvement and better fertilizer management through application of the latest technology, e.g., precision application, can play a significant role in reducing carbon footprints without affecting crop yield. Thus, fertilizer management particularly the type of fertilizer products, method of fertilizer application and the amount of fertilizer usage must be taken into consideration to save energy consumption and related carbon footprints within NZ dairy systems.
  • Strategic use of off-pasture structures: In the present study, on-average the BDF farmers used barn facilities for the duration of 4–6 months with a varying range of 8–14 h per day, depending upon pasture growth, weather conditions and availability of feed. The main advantage of using barn structures is less fertilizer consumption in the BDF system, which is due to more effluent collection because of the barn operation. However, there is a high installation cost which may off-set the barn benefits. In addition to that, the use of barn facilities intensifies the system, both stocking rate and input-wise, to cover the barn costs, which leads to increased energy consumption through importing feed supplements. Contrary to that, fertilizer consumption is higher in the PDF system because of the need for high pasture production. Under these scenarios, the pastoral system potentially can achieve some of these barn benefits through the strategic use of off-pasture structures within the farm system such as a stand-off or feed pad together with a good effluent management facility. Removing cattle from the pasture for defined periods can provide better control on effluent under severe weather and deliver additional benefits such as reduced soil structure damage and reduction in fertilizer consumption due to improved effluent collection.

6. Conclusions

Energy management in agricultural systems as one aspect of environmental sustainability is a topic whose importance has been increasing in recent times. Moreover, the studies that directly compare the energy-related carbon footprint between NZ PDF and BDF systems are under studied in New Zealand. In this context, the study described here provides a unique opportunity to researchers, stakeholders and policy makers to better understand carbon footprints of contrasting dairy systems of New Zealand. The findings of this study indicate that NZ PDF systems have lower carbon footprints both per hectare of farm land and per tonne of milk solids, compared to BDF systems. On average, the carbon footprints of PDF and BDF systems were 2857 kgCO2 ha−1 and 3379 kgCO2 ha−1, and 1920 kgCO2 tMS−1 and 2129 kgCO2 tMS−1 respectively. The difference between the two systems indicates that the BDF system has 18% and 11% higher carbon footprints than the PDF system, both per hectare of farm area and per tonne of milk solids. The greater carbon footprints in the BDF system was explained by higher use of energy inputs such as imported feed supplements, machinery and fossil fuels which released more CO2 compared to the PDF system. Future research work should focus on a wider evaluation of the two dairy systems. First, given the comparatively small number of BDF systems analysed (7) when compared to PDF systems (43), although representative of systems in Canterbury, it would be useful to assess additional BDF and hybrid systems. Second, it would be useful to consider additional environmental parameters, alongside both social and economic parameters, to provide additional information of relevance to the sustainability of such systems.

Supplementary Materials

The following are available online at https://0-www-mdpi-com.brum.beds.ac.uk/2071-1050/11/17/4809/s1, S1 File: Survey form.

Author Contributions

H.M.A.I. performed the majority of the work including conceptualization of the data collection and analysis, along with writing the initial draft of the manuscript. M.S. and A.B. supervised the work providing methodological guidance throughout the study. They also contributed to the writing of the manuscript. S.R. and M.P. helped in data collection and in the writing of the manuscript.

Funding

This research received no external funding and the APC was funded by Lincoln University, New Zealand.

Acknowledgments

The authors gratefully acknowledge the support provided by Helen Thoday (DairyNZ) for data collection of this project and appreciate the farmer’s participation.

Conflicts of Interest

The authors declare no conflict of interest.

References

  1. Dairy, N.Z.; Livestock Improvement Corporation Limited (LIC). New Zealand Dairy Statistics 2016-17; Livestock Improvement Corporation Limited: Waikato, New Zealand, 2017; Available online: https://www.dairynz.co.nz/media/5788611/quickstats_new_zealand_web_2017.pdf (accessed on 4 June 2019).
  2. Dairy, N.Z.; Livestock Improvement Corporation Limited (LIC). New Zealand Dairy Statistics 2016-17; Livestock Improvement Corporation Limited: Waikato, New Zealand, 2017; Available online: https://www.dairynz.co.nz/media/5788533/nz-dairy-statistics- web-2016-17.pdf (accessed on 25 May 2019).
  3. Basset-Mens, C.; Ledgard, S.; Boyes, M. Eco-efficiency of intensification scenarios for milk production in New Zealand. Ecol. Econ. 2009, 68, 1615–1625. [Google Scholar] [CrossRef]
  4. O’Brien, D.; Capper, J.; Garnsworthy, P.; Grainger, C.; Shalloo, L. A case study of the carbon footprint of milk from high-performing confinement and grass-based dairy farms. J. Dairy Sci. 2014, 97, 1835–1851. [Google Scholar] [CrossRef] [PubMed] [Green Version]
  5. Parliamentary Commissioner for the Environment. Growing for Good, Intensive Farming, Sustainability and New Zealand’s Environment; Parliamentary Commissioner for the Environment: Wellington, New Zealand, 2004. [Google Scholar]
  6. Pow, T.; Longhurst, B.; Pow, Z. The future of NZ dairy farming systems: Self managing cows with access to partial housing. In Fertilizer and Lime Research Centre (FLRC) Workshop 2014; Massey University: Wellington, New Zealand, 2014. [Google Scholar]
  7. Newman, M.; Journeaux, P. Wintering Barns No Quick Fix for Profit; DairyNZ: Hamilton, New Zealand, 2015. [Google Scholar]
  8. Smith, P.; Martino, D.; Cai, Z.; Gwary, D.; Janzen, H.; Kumar, P.; McCarl, B.; Ogle, S.; O’Mara, F.; Rice, C. Greenhouse gas mitigation in agriculture. Philos. Trans. R. Soc. B Biol. Sci. 2007, 363, 789–813. [Google Scholar] [CrossRef] [PubMed] [Green Version]
  9. Crosson, P.; Shalloo, L.; O’Brien, D.; Lanigan, G.; Foley, P.; Boland, T.; Kenny, D.A. A review of whole farm systems models of greenhouse gas emissions from beef and dairy cattle production systems. Anim. Feed Sci. Technol. 2011, 166, 29–45. [Google Scholar] [CrossRef]
  10. Food and Agriculture Organization. Livestock’s Long Shadow; Environmental Issues and Options; Animal Production and Health Division: Rome, Italy, 2006. [Google Scholar]
  11. Food and Agriculture Organization. Environmental Performance of Large Ruminant Supply Chains: Guidelines for Assessment; Livestock Environmental Assessment and Performance Partnership; FAO: Rome, Italy, 2016. [Google Scholar]
  12. Gerber, P.J.; Steinfeld, H.; Henderson, B.; Mottet, A.; Opio, C.; Dijkman, J.; Falcucci, A.; Tempio, G. Tackling Climate Change through Livestock: A Global Assessment of Emissions and Mitigation Opportunities; Food and Agriculture Organization of the United Nations (FAO): Rome, Italy, 2013. [Google Scholar]
  13. Ministry for the Environment. New Zealand’s Greenhouse Gas Inventory 1990–2017; Ministry for the Environment: Wellington, New Zealand, 2019.
  14. Beukes, P.; Gregorini, P.; Romera, A. Estimating greenhouse gas emissions from New Zealand dairy systems using a mechanistic whole farm model and inventory methodology. Anim. Feed Sci. Technol. 2011, 166, 708–720. [Google Scholar] [CrossRef]
  15. Beukes, P.; Gregorini, P.; Romera, A.; Levy, G.; Waghorn, G. Improving production efficiency as a strategy to mitigate greenhouse gas emissions on pastoral dairy farms in New Zealand. Agric. Ecosyst. Environ. 2010, 136, 358–365. [Google Scholar] [CrossRef]
  16. Ministry for the Environment (MfE). New Zealand’s Greenhouse Gas Inventory 1990–2014; Ministry for the Environment: Wellington, New Zealand, 2016.
  17. Intergovernmental Panel on Climate Change (IPCC). Guidelines for National Greenhouse Gas Inventories; Institute for Global Environmental Strategies (IGES) for the International Panel on Climate Change: Kanagawa, Japan, 2006. [Google Scholar]
  18. West, T.O.; Marland, G. A synthesis of carbon sequestration, carbon emissions, and net carbon flux in agriculture: comparing tillage practices in the United States. Agric. Ecosyst. Environ. 2002, 91, 217–232. [Google Scholar] [CrossRef]
  19. Ministry for the Environment (MfE). About New Zealand’s Emissions Reduction Targets; Ministry for the Environment: Wellington, New Zealand, 2019. Available online: http://www.mfe.govt.nz/climate-change/climate-change-and-government/emissions-reduction-targets/about-our-emissions (accessed on 24 April 2019).
  20. DairyNZ. Zero Carbon Bill. 2019. Available online: https://www.dairynz.co.nz/environment/climate-change/zero-carbon-bill/ (accessed on 1 June 2019).
  21. Wells, C. Total Energy Indicators of Agricultural Sustainability: Dairy Farming Case Study; MAF: Wellington, New Zealand, 2001. [Google Scholar]
  22. Saunders, C.M.; Barber, A. Comparative Energy and Greenhouse Gas Emissions of New Zealand’s and the UK’s Dairy Industry; The Agribusiness and Economics Research Unit (AERU), Lincoln University: Christchurch, New Zealand, 2007. [Google Scholar]
  23. Saunders, C.M.; Barber, A.; Taylor, G.J. Food Miles-Comparative Energy/Emissions Performance of New Zealand’s Agriculture Industry; The Agribusiness and Economics Research Unit (AERU), Lincoln University: Christchurch, New Zealand, 2006. [Google Scholar]
  24. Bos, J.F.; de Haan, J.; Sukkel, W.; Schils, R.L. Energy use and greenhouse gas emissions in organic and conventional farming systems in the Netherlands. NJAS Wagening. J. Life Sci. 2014, 68, 61–70. [Google Scholar] [CrossRef] [Green Version]
  25. Cederberg, C.; Mattsson, B. Life cycle assessment of milk production—a comparison of conventional and organic farming. J. Clean. Prod. 2000, 8, 49–60. [Google Scholar] [CrossRef]
  26. Thomassen, M.A.; van Calker, K.J.; Smits, M.C.; Iepema, G.L.; de Boer, I.J. Life cycle assessment of conventional and organic milk production in the Netherlands. Agric. Syst. 2008, 96, 95–107. [Google Scholar] [CrossRef]
  27. Murgia, L.; Todde, G.; Caria, M.; Pazzona, A. A partial life cycle assessment approach to evaluate the energy intensity and related greenhouse gas emission in dairy farms. J. Agric. Eng. 2013, 44, 186. [Google Scholar] [CrossRef]
  28. Todde, G.; Murgia, L.; Caria, M.; Pazzona, A. A Comprehensive Energy Analysis and Related Carbon Footprint of Dairy Farms, Part 1: Direct Energy Requirements. Energies 2018, 11, 463. [Google Scholar] [CrossRef]
  29. Flysjö, A.; Henriksson, M.; Cederberg, C.; Ledgard, S.; Englund, J.E. The impact of various parameters on the carbon footprint of milk production in New Zealand and Sweden. Agric. Syst. 2011, 104, 459–469. [Google Scholar] [CrossRef]
  30. O’Brien, D.; Shalloo, L.; Patton, J.; Buckley, F.; Grainger, C.; Wallace, M. A life cycle assessment of seasonal grass-based and confinement dairy farms. Agric. Syst. 2012, 107, 33–46. [Google Scholar] [CrossRef]
  31. Dairy, N.Z. QuickStats about Dairying-Canterbury Region; DairyNZ: Hammerton, New Zealand, 2017. [Google Scholar]
  32. Lal, R. Carbon emission from farm operations. Environ. Int. 2004, 30, 981–990. [Google Scholar] [CrossRef] [PubMed]
  33. Safa, M.; Samarasinghe, S. CO2 emissions from farm inputs “Case study of wheat production in Canterbury, New Zealand”. Environ. Pollut. 2012, 171, 126–132. [Google Scholar] [CrossRef] [PubMed]
  34. Kitani, O. CIGR Handbook of agricultural engineering. Energy Biomass Eng. 1999, 5, 330. [Google Scholar]
  35. Bertocco, M.; Basso, B.; Sartori, L.; Martin, E.C. Evaluating energy efficiency of site-specific tillage in maize in NE Italy. Bioresour. Technol. 2008, 99, 6957–6965. [Google Scholar] [CrossRef]
  36. Serrano, J.M.; Peça, J.O.; da Silva, J.M.; Pinheiro, A.; Carvalho, M. Tractor energy requirements in disc harrow systems. Biosyst. Eng. 2007, 98, 286–296. [Google Scholar] [CrossRef]
  37. Siemens, J.C.; Bowers, W.; Holmes, R.G. Machinery Management: How to Select Machinery to Fit the Real Needs of Farm Managers; Deere & Company, John Deere Pub.: Morin, IL, USA, 1999. [Google Scholar]
  38. Ministry of Economic Development (MED). Energy Data File 2011; Ministry of Economic Development: Wellington, New Zealand, 2012.
  39. Podstolski, M. The Evolution of Total Energy Inputs in the New Zealand Dairy Industry. Master’s Thesis, Lincoln University, Lincoln, New Zealand, 2015. [Google Scholar]
  40. Nebel, B. Electricity and Transport Data for MAF GHG Projects; MAF. Scion: Rotorua, New Zealand, 2008. [Google Scholar]
  41. Stout, B.A. Handbook of Energy for World Agriculture; Elsevier: Amsterdam, The Netherlands, 1990. [Google Scholar]
  42. Vlek, P.L.; Rodríguez-Kuhl, G.; Sommer, R. Energy use and CO2 production in tropical agriculture and means and strategies for reduction or mitigation. Environ. Dev. Sustain. 2004, 6, 213–233. [Google Scholar] [CrossRef]
  43. Carran, R.; Ledgard, S.; Wedderburn, M.; Jollands, N. A Life Cycle Assessment of Milk Production on a New Zealand Dairy Farm. Client Report. 2004. Available online: https://www.researchgate.net/publication/228348136_First_life_cycle_assessment_of_milk_production_from_New_Zealand_dairy_farm_systems (accessed on 3 September 2019).
  44. Hartman, K.; Sims, R. Saving energy on the dairy farm makes good sense. In Proceedings of the 4th Dairy3 Conference held at Hamilton New Zealand. Centre for Professional Development and Conferences; Massey University: Palmerston North, New Zealand, 2006; pp. 11–22. [Google Scholar]
  45. Ilyas, H.M.A.; Safa, M.; Bailey, A.; Rauf, S.; Cullen, M. Evaluation of Energy Footprint of Pastoral and Barn Dairy Farming Systems in New Zealand. In Proceedings of the 22nd International Farm Management Association (IFMA) Congress, Tasmania, Australia, 3–8 March 2019. [Google Scholar]
  46. Fertilizer Association. Fertilizer Use in New Zealand; Fertilizer Association: Paris, France, 2019; Available online: http://www.fertiliser.org.nz/Site/about/fertiliser_use_in_nz.aspx (accessed on 25 June 2019).
  47. Snyder, C.; Bruulsema, T.; Jensen, T.; Fixen, P. Review of greenhouse gas emissions from crop production systems and fertilizer management effects. Agric. Ecosyst. Environ. 2009, 133, 247–266. [Google Scholar] [CrossRef]
  48. Ledgard, S.F.; Boyes, M.; Brentrup, F. Life Cycle Assessment of Local and Imported Fertilisers Used on New Zealand Farms; Ministry of Agriculture and Forestry: Tokyo, Japan, 2011.
  49. Ministry for Primary Industries. Pastoral Input Trends in New Zealand: A Snapshot; Ministry for Primary Industries: Wellington, New Zealand, 2012.
  50. Wheeler (Ed.) OVERSEER Technical Manual: Carbon Dioxide, Emboided and Other Gaseous Emissions; AgResearch Ltd.: Hammerton, New Zealand, 2018. [Google Scholar]
  51. Dillon, P.; Hennessy, T.; Shalloo, L.; Thorne, F.; Horan, B. Future outlook for the Irish dairy industry: A study of international competitiveness, influence of international trade reform and requirement for change. Int. J. Dairy Technol. 2008, 61, 16–29. [Google Scholar] [CrossRef]
  52. Doole, G. Economic feasibility of supplementary feeding on dairy farms in the Waikato region of New Zealand. N. Z. J. Agric. Res. 2014, 57, 90–99. [Google Scholar] [CrossRef]
  53. Jensen, R.; Clark, D.; Macdonald, K. Resource Efficient Dairying trial: measurement criteria for farm systems over a range of resource use. Proc. N. Z. Grassl. Assoc. 2005, 67, 47–52. [Google Scholar]
  54. Dairy, N.Z. Facts and Figures for New Zealand Dairy Farmers, 2nd ed.; DairyNZ: Hamilton, New Zealand, 2017. [Google Scholar]
  55. Safa, M.; Samarasinghe, S. Determination and modelling of energy consumption in wheat production using neural networks:“A case study in Canterbury province, New Zealand”. Energy 2011, 36, 5140–5147. [Google Scholar] [CrossRef]
  56. American Society of Agricultural and Biological Engineers (ASAE). Agricultural Machinery Management Data; D497.7 March 2011; ASAE: St. Joseph, MI, USA, 2011. [Google Scholar]
  57. Knapp, J.; Laur, G.; Vadas, P.; Weiss, W.; Tricarico, J. Invited review: Enteric methane in dairy cattle production: Quantifying the opportunities and impact of reducing emissions. J. Dairy Sci. 2014, 97, 3231–3261. [Google Scholar] [CrossRef] [PubMed] [Green Version]
  58. Morais, T.; Teixeira, R.; Rodrigues, N.; Domingos, T. Carbon footprint of milk from pasture-based dairy farms in Azores, Portugal. Sustainability 2018, 10, 3658. [Google Scholar] [CrossRef]
  59. A Greener World. A Breath of Fresh Air: The truth about pasture-based livestock production and environmental sustainability. Virginia: Animal Welfare Approved. 2013. Available online: https://www.agricology.co.uk/resources/breath-fresh-air (accessed on 3 September 2019).
  60. Alan Rotz, C.; Soder, K.J.; Howard Skinner, R.; Dell, C.J.; Kleinman, P.J.; Schmidt, J.P.; Bryant, R.B. Grazing can reduce the environmental impact of dairy production systems. In Forage and Grazinglands; 2009. Available online: https://pubag.nal.usda.gov/pubag/downloadPDF.xhtml?id=44272&content=PDF (accessed on 3 September 2019).
  61. Todde, G.; Murgia, L.; Caria, M.; Pazzona, A. A Comprehensive Energy Analysis and Related Carbon Footprint of Dairy Farms, Part 2: Investigation and Modeling of Indirect Energy Requirements. Energies 2018, 11, 463. [Google Scholar] [CrossRef]
  62. Latham, N.L. Carbon Footprints in the New Zealand Dairy Industry: A Comparison of Farming Systems; Lincoln University: Canterbury, New Zealand, 2010. [Google Scholar]
Figure 1. Dairy Systems’ Boundaries, Respective Inputs and Associated CO2 Emissions.
Sustainability 11 04809 g001
Table 1. Emission Factors for Feed Supplements used in Pastoral and Barn Dairy Farming Systems.
Grass SilageMaize SilageHayGrainsConcentratesStrawReferences
Energy Coefficients (MJ/Kg DM)1.7811.5641.3293.9051.8000.187Wheeler [50]
Emission Factors (KgCO2/MJ)0.080.10.090.120.080.13
Table 2. Energy-related Carbon Footprint of Pastoral and Barn Dairy Farming System (kgCO2 ha−1).
PastoralBarn
InputsAvgSDMinMaxAvgSDMinMax
Direct Inputs Emission
Diesel12152292743393171041046
Petrol45257116783059145
Electricity59748711026296473733361133
Indirect Inputs Emission
Fertilizer708243151130649939001276
Feed Supplements6024280178510152046561306
Machinery7842539615618012193571042
Total Emission285778111905052337970522364348
Table 3. Energy Carbon Footprint of PDF and BDF Systems Based on Milk Production (KgCO2 tMS−1).
PastoralBarn
InputsAvgSDMinMaxAvgSDMinMax
Direct Inputs Emission
Diesel81412419322926175813
Petrol2916679492528104
Electricity403338581918392219175754
Indirect Inputs Emission
Fertilizer4882261009833382880914
Feed Supplements39828301000623149487911
Machinery521211811261495178302747
Total Emission19206947823867213071814163116

