Article

Water Resource Utilization and Livelihood Adaptations under the Background of Climate Change: A Case Study of Rural Households in the Koshi River Basin

1
Department of Urban and Rural Planning, Sichuan Agricultural University, Chengdu 610041, China
2
School of Management, Chengdu University of Information Technology, Chengdu 610225, China
3
Rural Development Research Institute, Sichuan Academy of Social Science, Chengdu 610041, China
4
Institute of Mountain Hazard and Environment, Chinese Academy of Sciences, Chengdu 610041, China
*
Author to whom correspondence should be addressed.
Sustainability 2019, 11(18), 5064; https://0-doi-org.brum.beds.ac.uk/10.3390/su11185064
Submission received: 30 July 2019 / Revised: 30 August 2019 / Accepted: 6 September 2019 / Published: 16 September 2019

Abstract

:
In the Koshi River Basin, the effects of climate change have become clear. Agricultural countries, such as Nepal, depend on farmers’ adaptations to climate change for local sustainable development. Limited livelihood options, unequal access to resources and information, and climate change-related floods and droughts have reduced farmer welfare. Few studies have investigated the effects of altitude in rural areas or examined livelihood adaptation strategies in Nepal. Using a survey of farmers in rural areas at high, middle, and low altitudes in Nepal, this article explores the impacts of climate change-related floods and droughts, as well as the water resource utilization, disaster resilience, and livelihood improvement ability of farmers and the influencing factors. This article adopted participatory rural appraisal to obtain survey data from farmers at three altitudes. Through one-way ANOVA and F-tests, farmers’ perceptions of floods and droughts were analyzed, and through field investigations, their production and water consumption patterns were established. Logistic regressions show that college education, farming income, and domestic water consumption have the strongest impacts on households’ disaster resilience, while non-farm income, male laborer rates, and college education have the strongest impacts on households’ abilities to improve livelihoods. Based on our results, we offer countermeasures and suggestions on education, gender equality, and rural infrastructure construction.

1. Introduction

Presently, climate change is affecting the entire world. Temperatures and seal levels are rising, precipitation levels are changing, the frequency of meteorological disasters such as floods and droughts is increasing, and the impacts of climate on human society have intensified [1,2]. Compared with urban areas, the impacts of climate change in mountainous areas are relatively obvious, and the impacts on farmers’ livelihoods are more direct and stronger [3,4]. Many mountainous rural areas lack continuous surface water and groundwater supplies; most of them rely primarily on seasonally changing natural spring water to meet household and irrigation water demands [5]. In particular, some mountainous areas where households rely on rain-fed agriculture are highly sensitive to climate change. Regardless of the type of climate change impact (whether from floods, droughts, rising temperatures, greenhouse effects, or others), mountain farmers are one of the most vulnerable groups. Both their livelihood adaptability and resilience to such disasters are low [6]. Therefore, paying attention to the development of sustainable livelihoods for mountain farmers and understanding both their livelihood adaptability to climate change and their resilience when faced with disasters are important considerations.
The Koshi River Basin (KRB), located in South Asia, namely, Nepal, is an ecologically and topographically diverse basin with significant biodiversity. In a recent report, the Intergovernmental Panel on Climate Change (IPCC) highlighted that South Asia is particularly vulnerable to climate change [7]. Water resources are one of the factors most affected by climate change. Climate change has also caused serious challenges to the hydrological cycle, resulting in the depletion of water resources in the KRB [8]. These changes may manifest as extreme weather events such as floods caused by increased seasonal rainfall (80% of the precipitation in the KRB occurs between July and September) or droughts due to the fact of monsoon instability (the primary dry months are February–March), both of which have obvious ramifications in vulnerable areas in the mountains of Nepal. These extreme events ultimately threaten the livelihoods and water resource options of residents in the KRB. For farmers living in the basin, agriculture and animal husbandry are the main livelihood activities, and both are directly related to water; therefore, water is a central element of livelihoods in the KRB [9]. The Climate Change Risk Atlas (2010) ranked Nepal as the fourth most vulnerable country in terms of the impacts of climate change. The KRB is the largest river basin in Nepal, covering 17 regions and nearly 30,000 square kilometers from the Himalayas to the agricultural lowlands of Terai [10]. The lands and livelihoods of this basin are highly vulnerable to extreme weather and hydrological events due to the fact of their natural characteristics [11].
Both domestic and international scholars have conducted a large number of studies on the adaptability of household livelihoods. First, we need a definition of adaptive capacity. The IPCC proposed a broad definition as early as 2007: “Adaptive Capacity is the ability of a system to adjust to climate change, to moderate potential damage, to take advantage of opportunities, and to cope with the consequences” [12]. An important aspect of livelihoods is the livelihood response, which is a dynamic process that either enhances existing security and wealth or attempts to reduce vulnerability and poverty [13]. Livelihood adaptation is the ability of farmers to cope with all types of stress and to take advantage of clear, albeit very limited, opportunities to increase income or to diversify income sources [14]. Different motivations and barriers affect livelihood responses, including behavioral intent and contextual aspects, such as family assets, social norms and networks, gender, class, and ethnic group or individual perceptions [15]. Studies have also shown that the main problems faced by farmers in the current livelihood adaptation strategy are land shortages, lack of irrigation water, acquiring climate change-related information, geographic location, population characteristics, regional policies, socioeconomic and cultural conditions, and individual livelihood strategies [16,17,18]. Among these, the livelihood strategy plays an important role in households’ reactions to climate change, and it is a vital aspect of the adaptability of farmers. Understanding this point will help researchers better understand the possible changes and the mechanisms people have used in response to climate change [19].
The dictionary definition of resilience is the ability to recover from (or resist) some kind of shock, insult or interference, and the Latin root of resilience means “to jump back” [20]. Resilience can be regarded as the intrinsic ability of a system, community or society that is vulnerable to shocks or pressures to adapt and survive by changing its non-essential attributes and reconstructing itself [20]. Resilience also has a definition more amenable to scholars: resilience is the ability to reorganize after absorbing or resisting interference and stress in the face of changes in experience. At the same time, the entity must maintain its original functions and structures, as well as its identity within the same system, and provide appropriate feedback [21,22]. The determinants of resilience include the ability of households to meet basic needs (i.e., food, water, shelter, and sanitation) and their ability to amass assets (i.e., material, natural, financial, social, political, and human), because assets are considered key resources that can help people withstand shocks and stress [23].
It has been confirmed in many works in ecology and sociology that resilience allows for multiple equilibriums and processes of adapting to changing environments to achieve new equilibriums [24]. Resilience includes two concepts in climate change research: social adaptive capacity (organizational or community capacity to respond to external stressors and disturbances due to the social, political, and environmental changes) and ecological resilience (interference with ecosystem characteristics). The important manifestation of social resilience comes from farmers’ reactions to disaster [25]. Studies have also noted that the factors that determine resilience include local infrastructure, technological development, livelihood development, and technical management [26]. To design and formulate more reasonable and targeted adaptation strategies to promote the ability of households to improve their livelihoods and their resilience, it is necessary to understand more about households’ perceptions of climate change, their existing livelihood coping strategies and water use patterns, and the important factors that affect farmers‘ livelihood abilities and resilience.
At present, macroscopic research results in related fields are relatively rich, but typical survey analyses based on households are relatively rare, and micro-positive research based on comparisons of farmers in different regions is even more rare. This paper explores the discrepancy between water-induced disasters and water resources utilized in different areas of the KRB with the goal of detecting the impacts on rural household livelihoods in terms of both livelihood improvement ability and disaster resilience. The main objectives of this paper include (i) analyzing household perceptions of climate change and water-induced disasters in different areas; (ii) analyzing the water resource burden, which affects households due to the fact of climate change; (iii) analyzing the modes of water resource usage in different areas; and (iv) analyzing the impact factors of households’ disaster resilience and livelihood improvement abilities. Some implications of climate change for the improvement of livelihoods for KRB households are also discussed.

2. Study Area and Data Sources
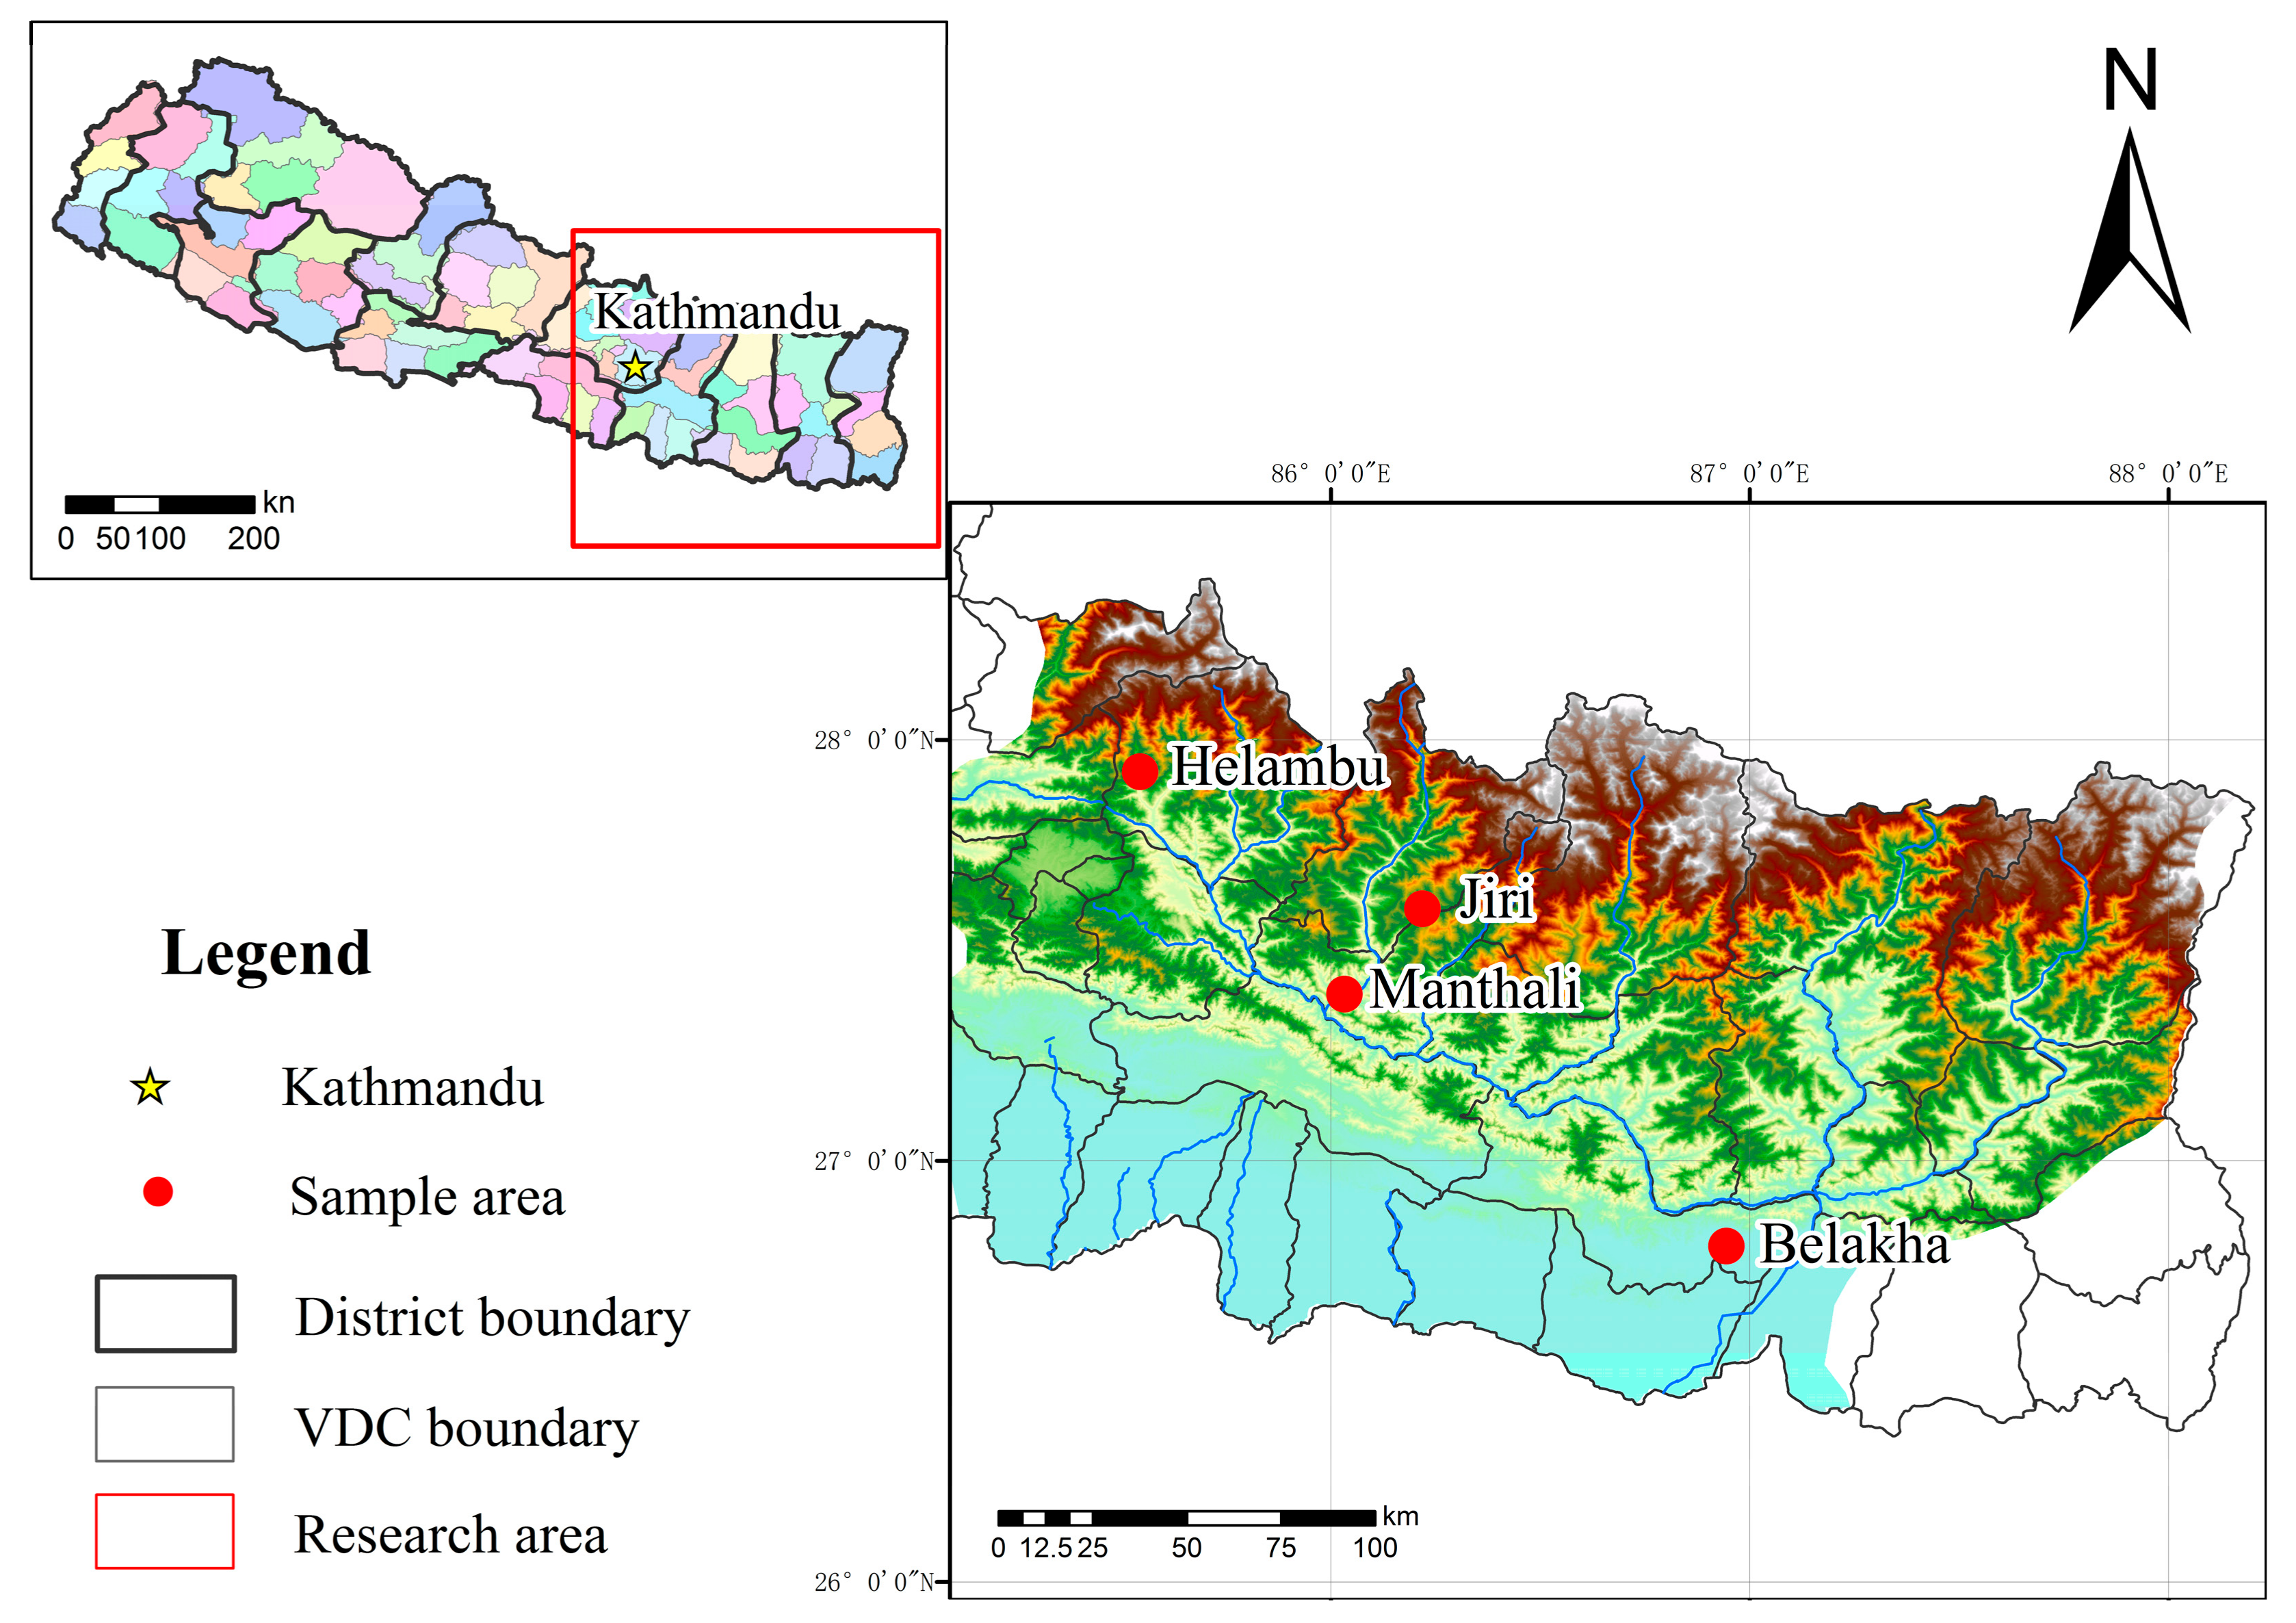
2.1. Study Area

Located in the central part of the Himalayas, the Koshi River is a tributary of the Ganges River, and the KRB is an extremely important cross-border watershed in South Asia. The watershed includes large altitude variations, complex habitats, distinct ecosystem types, diverse land cover types, and obvious regional differences. It is considered as one of the world’s most sensitive areas to global climate change. The study area was centered on a portion of the KRB in Nepal, ranging from 26°30′ to 27°80′ north latitude to 85°10′ to 88°20′ east longitude (Figure 1). The terrain varies in elevation from 8844 m to 57 m. The area includes complex features such as sheer cliffs and a variety of land cover types. Precipitation and temperature in the KRB are mainly affected by topography and Indian Ocean monsoons. Agriculture is the primary industry in this region, but cultivated land resources are limited and their distribution is uneven. Moreover, the farming methods are primitive, and the agricultural harvest depends to a large extent on natural conditions. The livelihoods of farmers in the region generally depend entirely on agriculture and the incidence of poverty is high.

2.2. Data Sources

This study relied on questionnaire surveys and in-depth interview data acquired primarily from household surveys. The farmers’ surveys consisted of participatory rural appraisal (PRA) supplemented by semi-structured, in-depth interviews. Before conducting the interviews and fielding the questionnaires, the investigators were professionally trained, and the questionnaires were improved by means of a preliminary investigation. We adopted stratified random sampling. Due to the large differences in altitude among the areas in the KRB, we selected three representative areas in the high mountainous area, the middle mountainous area, and the plains area for sample village selection, and we selected typical villages in these three areas for investigation (Table 1). We recognized that we might not be fully aware of the disaster situations in these areas; thus, after selecting the areas at each altitude, we contacted local guides and village cadres to help in the selection of representative villages for each area. Notably, in the middle mountainous area, we selected only two villages for this study because of obvious internal climatic differences in this area. For example, Manthali of Ramechhap is located in an arid valley area with little vegetation cover, as well as obvious water shortages and droughts, while Helambu of Sindhupalchok is located in a water source area with dense vegetation and relatively abundant water.
The questionnaire consisted of four parts: (1) the impact of climate change on farmers and their perceptions and coping strategies; (2) a household domestic water use survey; (3) a survey of farmers’ use of irrigation water for production; (4) a household livelihood survey; and (5) a survey of farmers’ basic surroundings, including cultivated land, forestland, population, labor, and income, and sociodemographic characteristics such as gender, age, and education level of the head of the household. We conducted the surveys in the KRB of Nepal over a 21-day period between November 2017 and April 2018, finally obtaining a total 329 questionnaires. In addition, we conducted 30 interviews with individual key farmers and village cadres. We also found, based on the interviews conducted with the village cadres, that the farmers’ cultivated land, family size, labor force, education level of the head of household, income, and other attributes conformed to the overall characteristics of their villages; thus, we are confident in the representativeness of the sample.

3. Variable Design and Model Method

3.1. Design and Selection of Variables and Hypotheses

In this study, livelihood adaptation was divided into two aspects: livelihood improvement ability and disaster resilience. Livelihood improvement ability assessed the abilities of farmers to adapt daily living standards, while disaster resilience assessed the measures that farmers take when droughts and floods occur. Based on previous studies of livelihood diversity and the pre-study of field interviews and surveys of local village cadres, we found that local livelihood diversity and post-disaster response measures were limited. Therefore, the assessment of disaster resilience (mainly droughts and floods) provided eight choices; each was assigned a score of 1 and multiple choices were allowed. To facilitate post-processing, the final option was open-ended. The choices were “improving the irrigation conditions”, “selecting appropriate varieties of crops”, “increasing labor input”, “changing the plant type”, “finding or opening up new land to cultivation”, “changing livelihood methods, such as finding a new job”, “moving to the city to make a living”, and “other (fill in)”. In fact, the survey results showed that local villagers take very limited measures when they encounter floods and droughts. Households that are able to take three measures to cope with disasters score relatively high on family strength; therefore, we used three measures as the cut-off point. We defined families with scores below three as weak and those with scores of three or more as strong. Similarly, for the evaluation of livelihood improvement ability, we offered six options based on the reality of the local situation, one of which was open-ended; each option was assigned a score of 1. The options offered were “large-scale land management”, “improving the planting structure”, “going out as migrant workers”, “engaging in individual businesses”, “finding or opening up new land to cultivation”, and ‘other (fill in)”. In this assessment, we found that farmers actually employ very few of these strategies. Farmers with scores below 2 were defined as weak, and those with scores of 2 or more were defined as strong.
Based on the purposes of this study, we included two models; therefore, there were two dependent variables. Dependent variable 1 was the strength of farmers’ disaster resilience, where 0 was weak, and 1 was strong. Dependent variable 2 was the strength of farmers’ livelihood improvement ability; again, 0 was weak and 1 was strong (Table 2). To select independent variables, we reviewed and analyzed the literature. Then, combined with the actual survey situation, we selected 15 indicators, including family demographic characteristics, family location characteristics, water use behaviors, livelihood choices, and climate change perceptions. We excluded the traditional indicator of livelihood capital and instead included livelihood selection in the analysis.
During the investigation, we found that the abilities of households to cope with disasters and improve livelihoods were largely influenced by the quality and structure of the individual family. We assume that households include many male laborers (e.g., farmers’ households) or a large number of people with higher education. Especially for the latter, more effective measures can be taken to prepare for droughts or flooding, and the ability to cope with disasters will be stronger. At the same time, such households are more conducive to diversified livelihood strategies, and their livelihood improvement abilities are also stronger. Regarding the location indicators for the household, because this study considered the use of water resources, indicators of the distance between the household residence and the water source used domestically and for production were selected. We assumed that farther distances to water sources weaken the ability of farmers to cope with disasters to some extent. Household domestic water use behaviors and livelihood options reflect the degree to which farmers are bound by agriculture. The perceptions of households can reflect the impact of climate change on farmers. If the household perceives that the effect of climate change will be strong, farmers may exhibit a greater degree of disaster preparedness or seek diversified livelihoods that rely less on agriculture. Thus, we selected the 15 indicators listed in Table 2 for the analysis; descriptive statistics of the independent and dependent variables are provided in Table 3.

3.2. Research Methodology

This study relied on data obtained by means of PRA, an effective method of quickly collecting rural information and understanding the desires of villagers. This method is widely used in the development and utilization of rural resources and environments, surveys of households’ living conditions, and ecosystem assessment [27]. Common PRA tools include key information interviews, semi-structured interviews, community village meetings, and participatory mapping [28]. In this study, analytical data were mainly acquired through structured and semi-structured questionnaire interviews. The basic situation of the village, information about disasters, and other background information was obtained, mainly through interviews with village leaders. The water pattern map was based on semi-structured interviews and village participation guidance. The data analyses consisted primarily of F-tests, which verified the internal characteristics of the statistical data. For other data operations, such as combining the dependent variable’s characteristics and binary classification, we chose to use a dependent variable that was a two-category variable capturing strong and weak households and an independent variable that was a discrete-type variable. Combining various model characteristics, we adopted a classical binary logistic qualitative regression model. The expression of the model is as follows:
Logit   P = β 0 + β 1 X 1 + β 2 X 2 + + β m X m
where P represents the strong or weak probability of DR or LAI, while X represents the factors influencing the strength or weakness of the DR or LIA of households. The analysis was conducted using SPSS v19.0.

4. Results

4.1. Analysis of Climate Change and the Water-Induced Disaster Situation

4.1.1. Spatial Differences in the Occurrences of Droughts and Floods in the KRB

The data obtained from all the sampled households in the KRB are listed in Table 4. The figures in the table represent the number of perceived floods over the past decade (p = 0.001). We found that, in the past ten years, households perceived 3.7 floods and 3.8 droughts. The average duration of each drought was 34 days and the average duration of each flood was 95 days.
Furthermore, the results of a one-way ANOVA showed significant differences (F = 7.06; p = 0.001) in the frequencies of flood occurrences among the four villages. For example, because the Belakha village in Udayapur is located in the lower KRB, the frequency of floods is significantly higher than that in the other three regions, occurring 4.5 times in the past decade. The second-greatest frequency was in the village of Helambu in Sindhupalchok (3.8 floods), and the village of Manthali in Ramechhap ranked third (3.7 times). The Jiri village in Dolakha flooded significantly less frequently than villages in the other three regions because it is located in the high mountain area of the KRB; consequently, it has flooded only 2.8 times in the past 10 years.
One-way ANOVA results also showed significant differences in drought frequencies (F = 24.047; p = 0.001) in the four villages. The Manthali village in Ramechhap had the highest frequency of drought in the past decade due to the fact of its location in an arid region; it experienced drought 4.4 times in the past ten years. The drought frequency was lower and similar in the upper and lower catchments (Jiri village in Dolakha and Belakha village in Udayapur). A very interesting phenomenon was observed. The village of Manthali in Sindhupalchok is located in a water source area, but it had the second-highest drought frequency over the past decade (a statistical value of 4.2). This shows that local droughts and water shortages can occur even in water source regions.

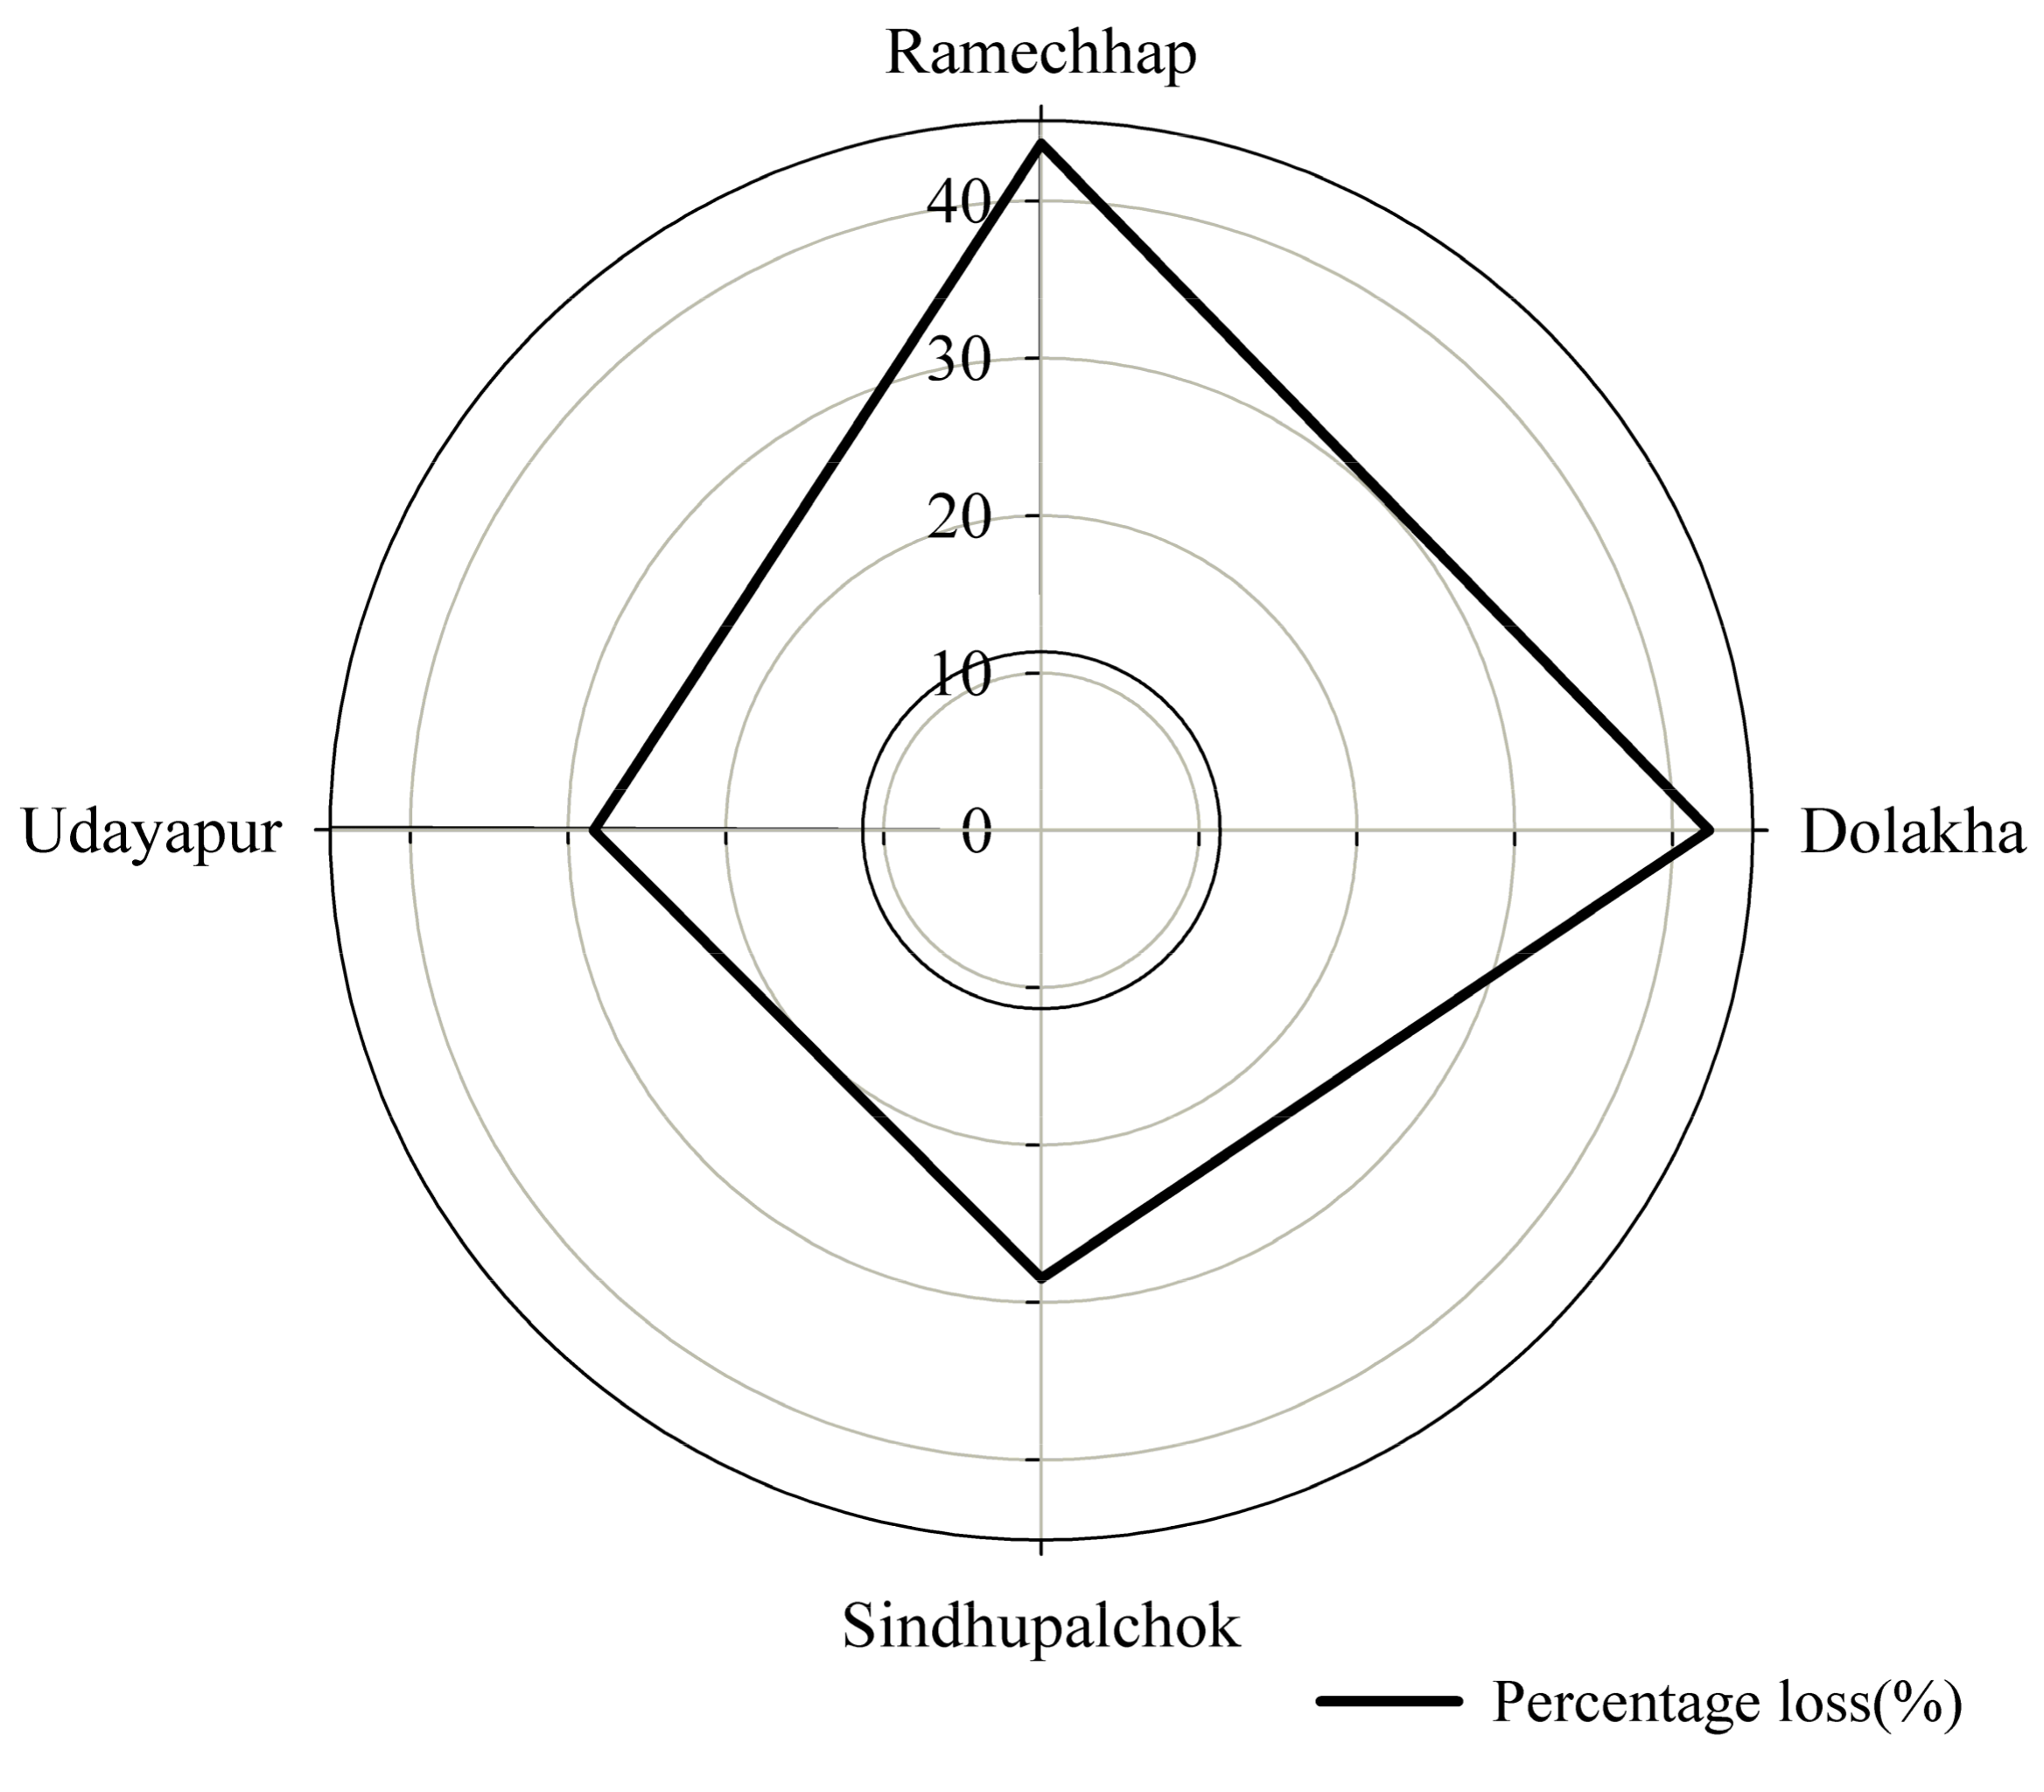
4.1.2. Analysis of the Damage Caused by Drought and Flooding to Households’ Crops

In analyzing the extent of households’ crop damage, most households’ crops are affected by floods or droughts at different levels, and the loss proportions mainly range between 20% and 60%. Overall, the results indicate that the agricultural production of households in the region is highly vulnerable to damage from floods and droughts. Further analysis of the proportion of household crop loss in different regions (Figure 2) revealed that Manthali village in Ramechhap suffered the highest crop losses, which is closely related to the geographical location of the region. The area is in the arid valleys of the mid-mountain district, which is highly sensitive to climate change. The lowest proportion of crop losses occurred in Helambu village in Sindhupalchok and Belakha village in Udayapur. Our fieldwork showed that the former village is located in a water source area, and the latter is located in the plains area, where the frequencies of droughts and floods are generally relatively low, and such disasters also cause relatively little damage.

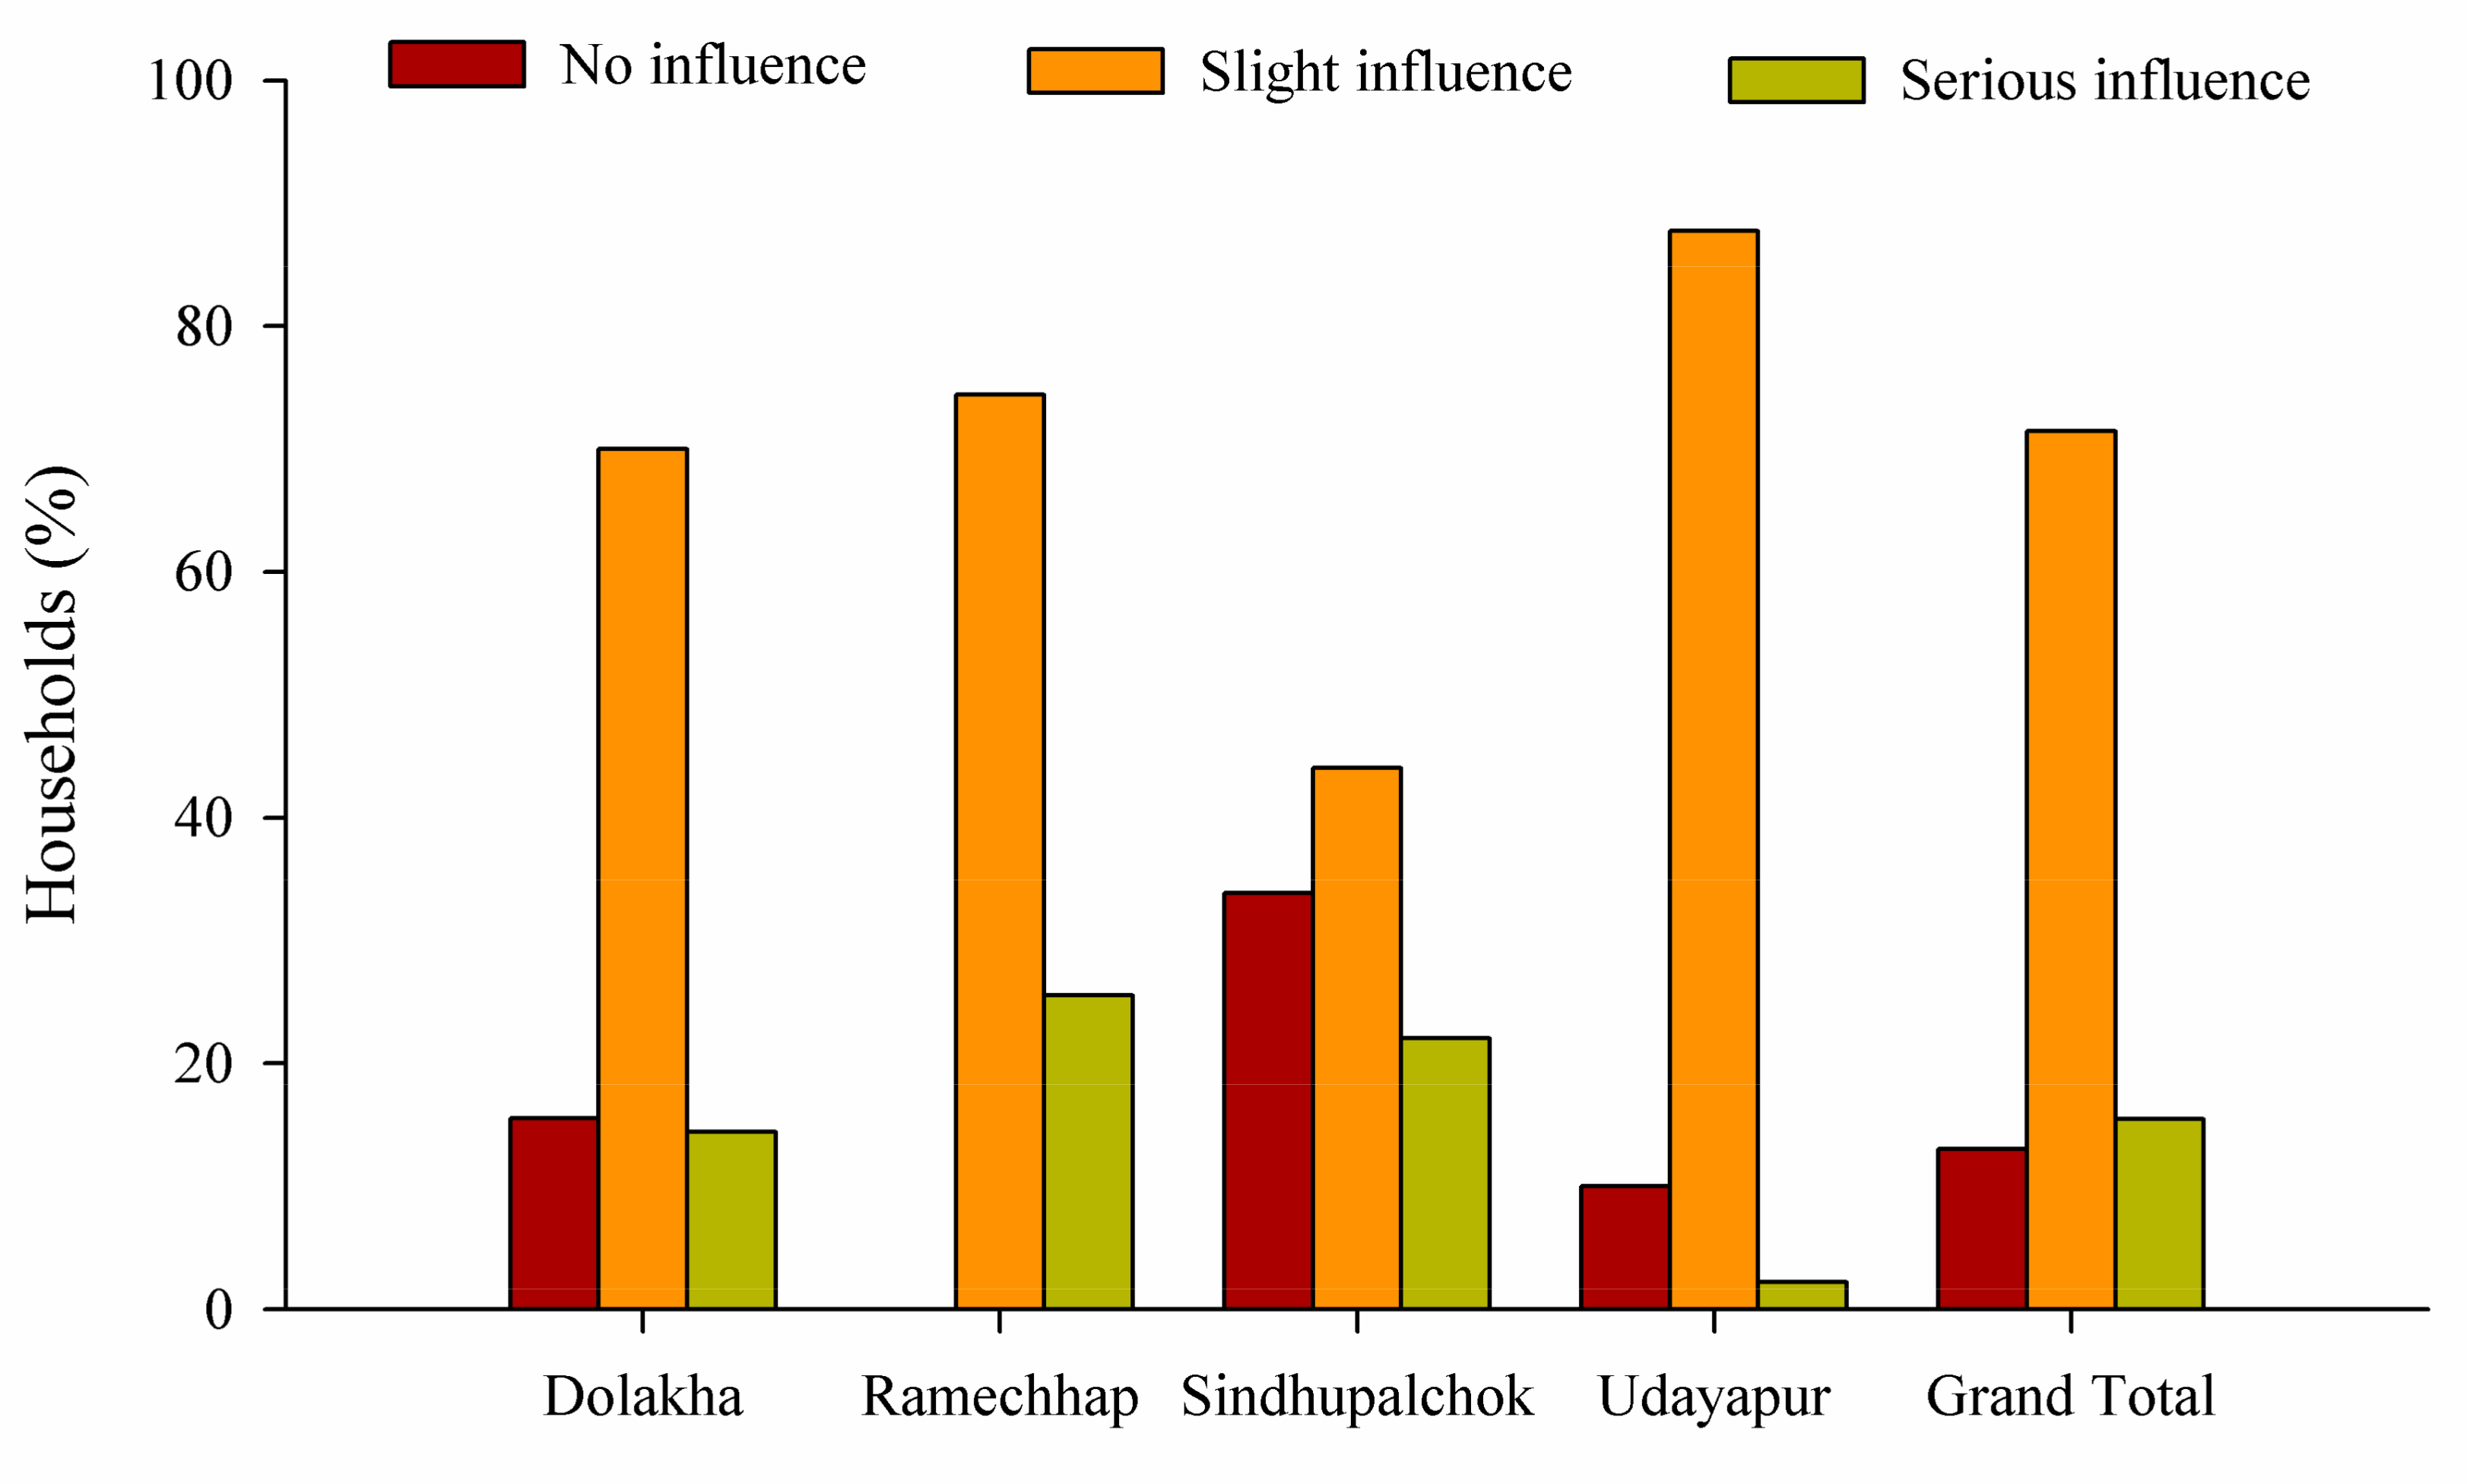
4.1.3. Analysis of the Effects of Droughts and Floods on Household Water Use

Floods and droughts affect both domestic and agricultural water consumption of households in the KRB to varying degrees. The impacts of floods and droughts on domestic and agricultural water use by households are shown in Figure 3. Only 15% of households experienced no water use impact from floods and droughts, while approximately 70% of households experienced a slight impact, and more than 15% of households were seriously affected. However, due to the differences in regions, family characteristics, resource endowments, and livelihood patterns, households had different perceptions of the impacts of floods and droughts. For example, more than one-quarter of sample households in the Manthali village in Ramechhap reported that floods and droughts had a serious impact on their water use, followed by 22% of households in the village of Helambu in Sindhupalchok district. Farmers in Manthali village reported that climate change had increased the temperature, decreased precipitation, and decreased the groundwater level. Coupled with the impact of an earthquake, many of the springs that survived have since gone dry; therefore, current levels of agricultural and domestic water use have become priorities for these villagers.

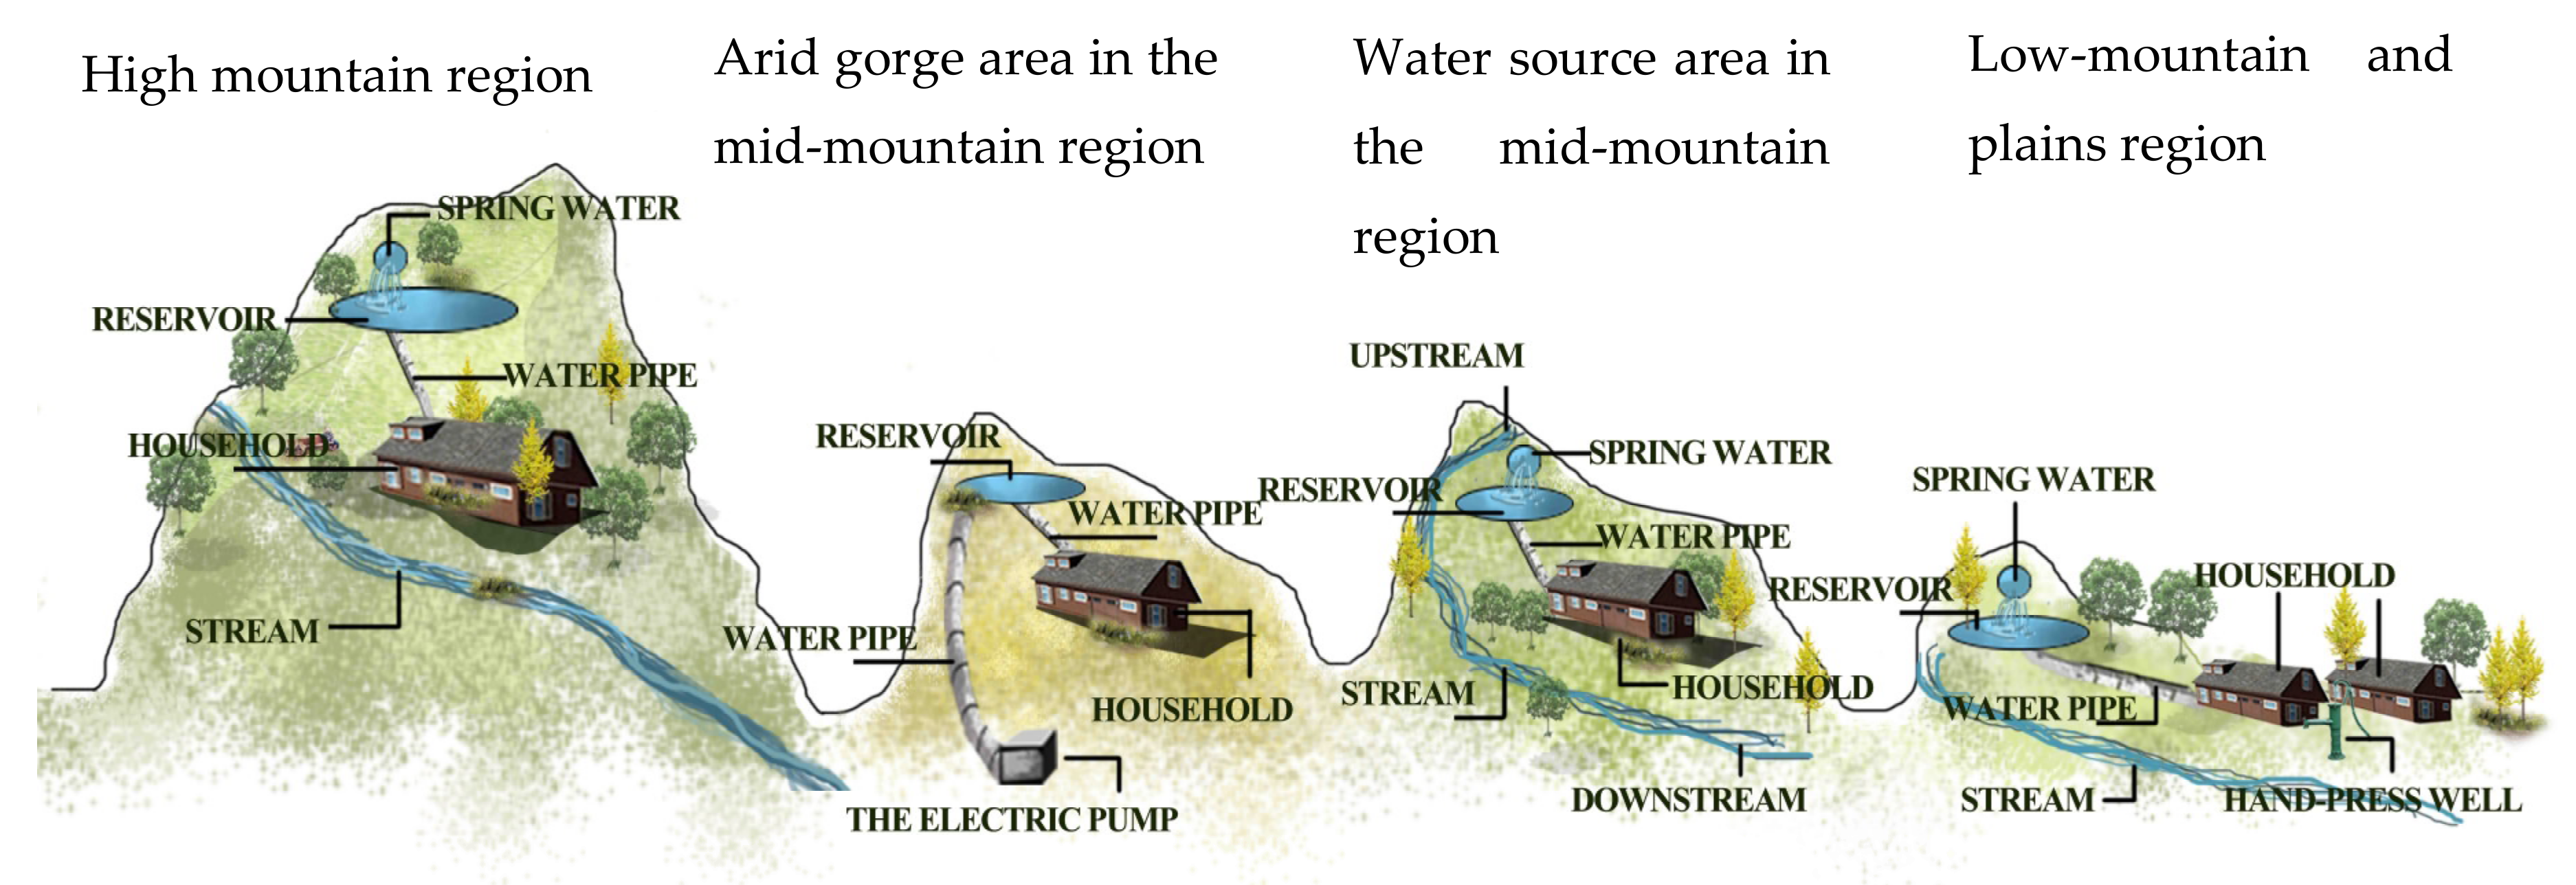
4.2. Analysis of Water Resource Modes Utilized in Different Areas

Due to the fact of its wide coverage and varied terrain, the KRB includes diverse local climatic and vegetation characteristics. Due to the climatic influences, water utilization patterns within the study area showed significant differences (Figure 4).

4.2.1. High Mountain Region

This area is rich in vegetation and mountain spring water is abundant. Household domestic water comes mainly from springs. A villager organization raises funds to build reservoirs for mountain spring water, and households use water pipes to obtain water for domestic use. Irrigation water in this area is sourced primarily from alpine streams. The major grain crop in this area is millet, which is a drought-resistant crop; consequently, farmers rely on rainwater for irrigation.

4.2.2. Arid Gorge Area in the Mid-Mountain Regions

This area has a dry climate, low rainfall, and extremely low vegetation coverage; the soil’s water storage capacity is poor, and mountain spring water is scarce. The water use mode of households in this region mainly involves pumping groundwater. However, no groundwater exists within the survey area itself; instead, electric pumps are used to pump groundwater from lower altitudes to a reservoir at a higher altitude. The reservoir was constructed by non-governmental organizations (NGOs). Water diversion pipelines provide water to the households. In this area, water for both agricultural and domestic uses is primarily pumped groundwater, and water resources are scarce. During the investigation, we found that the original water use pattern in this area was based on mountain spring water, but approximately 5 or 6 years ago, the local mountain spring water sources dried up; daily agricultural and domestic water demands can now be met only via groundwater extracted at lower altitudes.

4.2.3. Water Source Area in the Mid-Mountain Region

This area belongs to the the Miramzi Basin of the KRB and is the source of the water supply in Kathmandu. This area has rich water resources. Water for domestic use is derived mainly from mountain spring water that feeds a reservoir and is transported to each household by water diversion pipes. Household agricultural water is mainly sourced from streams or rivers. However, the village cadres report that local people are worried about the Kathmandu water diversion project currently under construction, which will transfer most of the water to the capital city, seriously affecting their future agricultural and domestic water supplies. Many locals even warned that they may interfere with the water diversion project’s construction.

4.2.4. Low-Mountain and Plains Regions

This area in the lower reaches of the KRB is rich in river water and groundwater resources. Domestic household water is derived from two main sources: groundwater and mountain spring water. Spring water is supplied for household domestic needs through a constructed reservoir and water diversion pipes, while groundwater is primarily pumped using hand or electric pumps. Agricultural irrigation water mainly comes from streams or rivers. However, during our fieldwork, we found that due to the low terrain, the probability of flooding in this area is much greater than that in other areas.

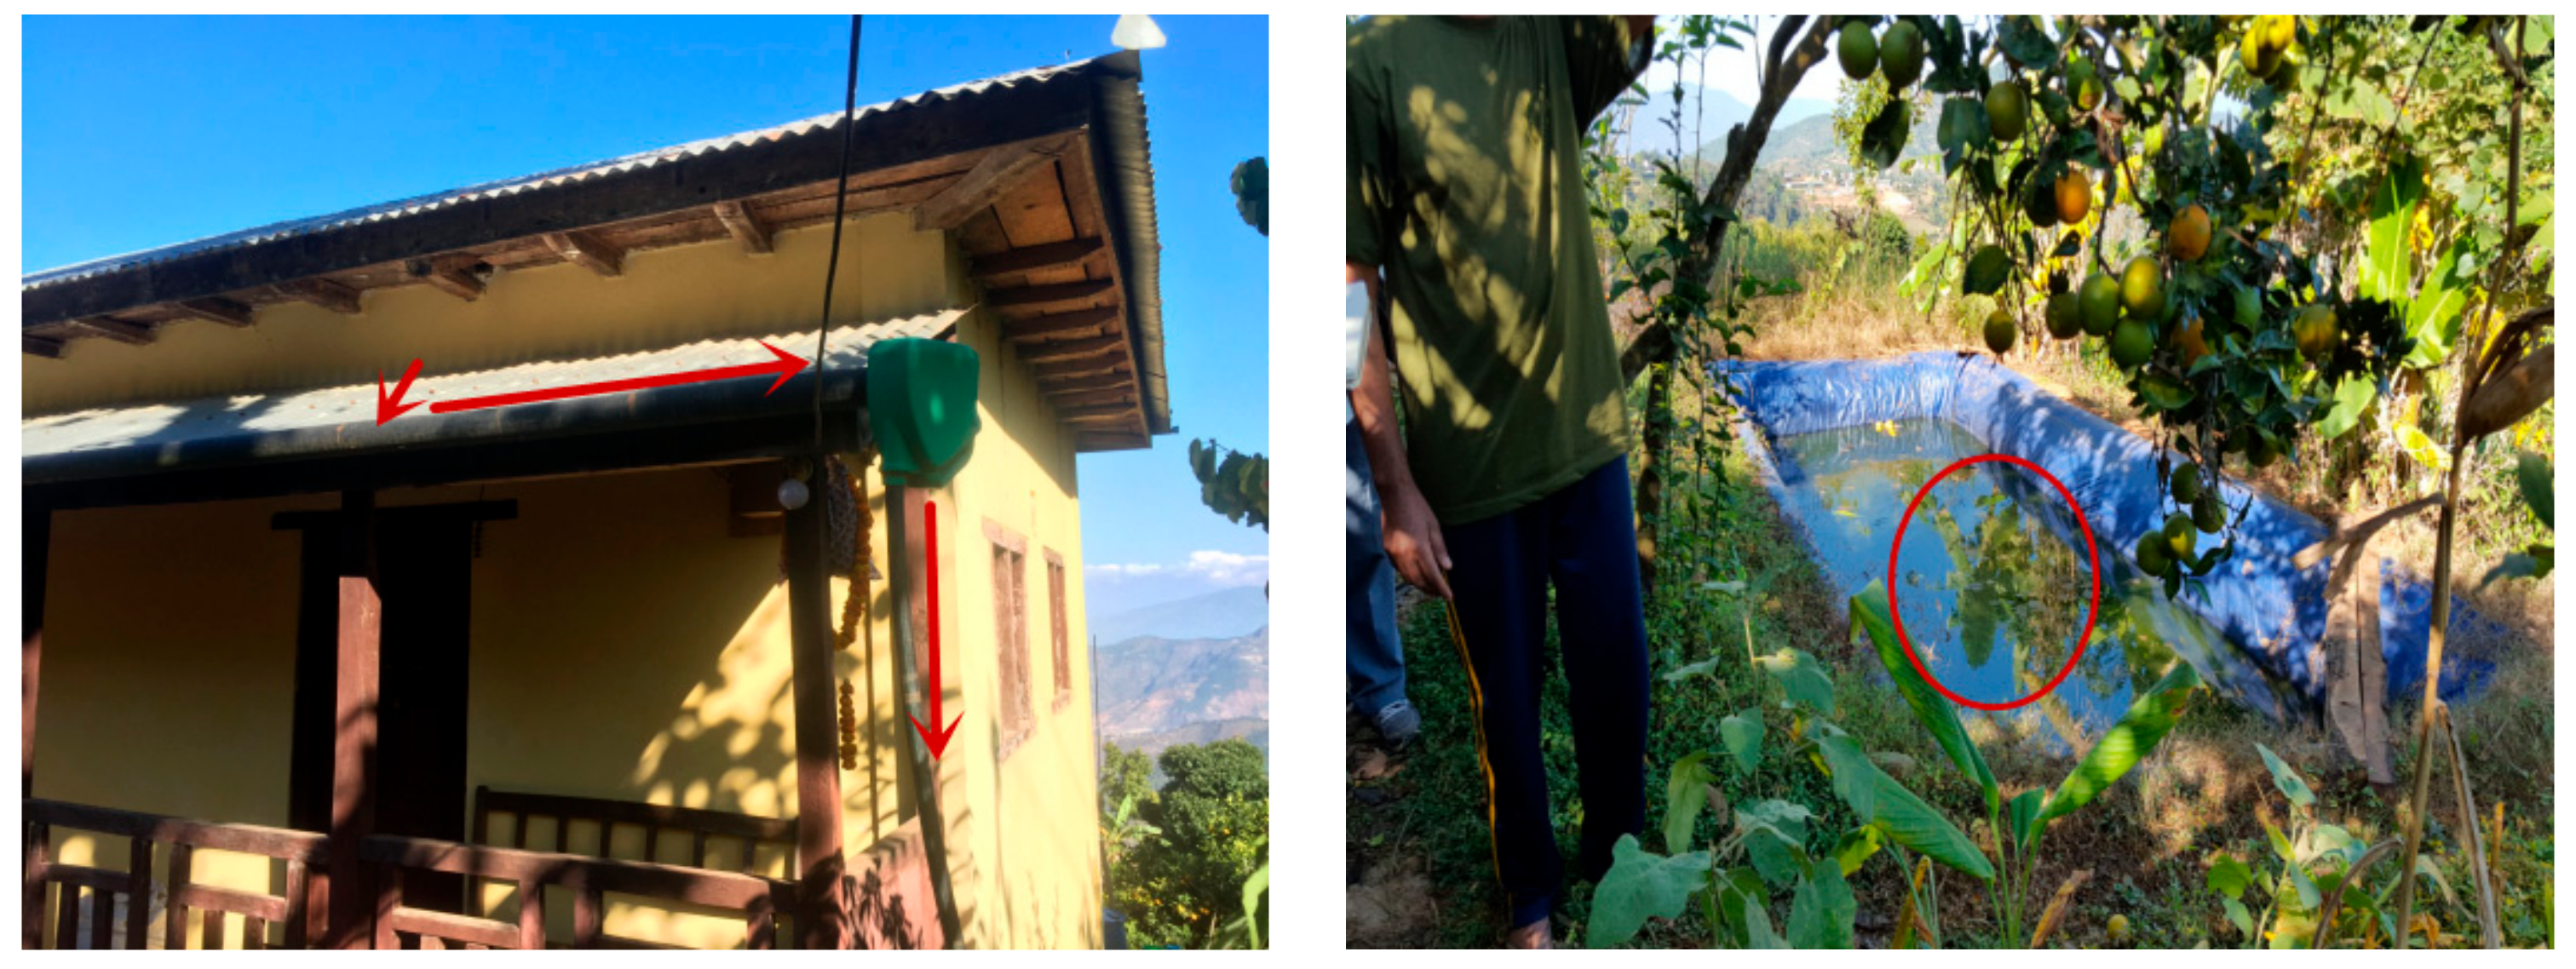
4.2.5. Analysis of Auxiliary Water Utilization Patterns

Some households have adopted roof collection systems to collect rainwater and store it for livestock or agricultural irrigation (Figure 5). However, we found that this method is relatively unpopular. Moreover, it is limited by the constraints of building materials and farmers’ awareness of the need to save and collect water.

4.3. Livelihood Difference Analysis and the Impact Factors

Considering that there might be multiple collinearities between variables, we conducted a multicollinearity test on all the variables using 0.2 as the reference standard; however, the final test results showed no collinearity between the variables. Table 5 shows the results of the econometric model of KRB households’ disaster resilience and livelihood improvement abilities. Model 1 shows the regression analysis results for the strength and weakness of households’ disaster resilience, while model 2 shows the regression analysis results for the strength and weakness of the households’ livelihood improvement abilities. Both results were statistically significant (p < 0.01), indicating that at least one of the independent variables had a significant effect on the dependent variable.

4.3.1. Analysis of the Factors Influencing Disaster Resilience

In terms of family demographic characteristics, laborer scale (LS) and college education (CE) significantly affected the ability of households to adapt to disasters, and the direction of the effect of both factors was positive. The influence of family size (FS) on the disaster resilience of households was negative. The effect of the male laborer rate (MLR) on households’ disaster resilience was not significant. When the family has more available labor, farmers will be more resilient to disasters, and when many people in the family have received some college education, the preparation and skills of farmers to address disaster risks are promoted to a certain extent. However, the larger the family, the lower its resilience to disasters. This is a very interesting phenomenon. In terms of family geographic indicators, domestic water distance (DWD) had a strong negative impact on the resilience of farmers to disasters. The farther away a household is from its domestic water source, the weaker the resilience of farmers to disasters. In contrast, the production water distance (PWD) had no significant impact on households’ disaster resilience.
In terms of water use behavior indicators, domestic water consumption (DWC) had a significant negative impact on the household’s disaster resilience. When daily household consumption of domestic water is high, the greater its dependence on water and the weaker its disaster resilience. In terms of livelihood selection behavior, the non-farm income rate (NIR) had a positive impact on households’ disaster resilience. The higher a household’s proportion of non-farm income, the stronger its disaster resilience. The farm income rate (FIR) and breeding livestock (BL) both had significant negative impacts on households’ disaster resilience, indicating that the higher the proportion of non-farm income in the households, the weaker its resilience to disasters. If the family breeds much livestock, the farmers are more dependent on agriculture, and their resilience to disasters will be weaker. In terms of climate change perceptions, drought perception (DP), flood perception (FP), and rainfall change perception (RCP) had significant positive impacts on households’ disaster resilience, indicating that the more households feel climate change and its effects, the stronger their resilience to disasters.
In the overall analysis of the model results, we found that family demographic characteristics, family location characteristics, water use behaviors, livelihood choices, and climate change perceptions had significant impacts on households’ disaster resilience. Further, the largest regression coefficients were found for CE, FIR, and DWC, indicating that changes in these three indicators can significantly affect households’ disaster resilience. Similarly, Miller [29] showed that households with better education had more livelihood options to diversify their income sources. Our results also showed that a key aspect of improving the resilience of mountain households to disasters is to start with cultural quality and to strengthen education, both higher education and professional skills, because these play fundamental roles in augmenting households’ disaster resilience. High FIR and DWC values indicated farmers who are more dependent on agriculture and have limited resilience to disasters. The survey also found that when a household is mainly engaged in agriculture or animal husbandry, its dependence on local water resources is greater. Consequently, when flood or drought events occur, farmers suffer greater damage. In addition, their ability to recover from such disasters is greatly inhibited.

4.3.2. Analysis of the Factors Affecting Livelihood Improvement Ability

In terms of family characteristics, LS, MLR, and CE had significant positive impacts on household livelihood improvement ability; however, the effect of FS on households’ livelihood improvement abilities was not significant. This shows that when more labor exists in households, farmers have stronger livelihood improvement abilities. In particular, when the proportion of male labor in the family rises, household livelihood improvement ability also improves significantly. Similarly, an increase in the number of family members who received a college education has a larger positive impact on households’ livelihood improvement abilities. In terms of the effect of family geographic factors, PWD had a significant negative impact on households’ livelihood improvement ability. However, DWD had no significant effect. In terms of water utilization behavior, the indicators had no significant impact.
In terms of livelihood choices, BL and FIR had significant negative impacts on households’ livelihood improvement abilities. This means that the more livestock that is raised by the household or the greater the percentage of household agricultural income, the weaker the livelihood improvement ability of the household. This effect largely reflects the vulnerability aspects of households’ livelihoods. The non-farm income rate (NIR) had a significant negative impact on household livelihood improvement ability, indicating that the higher the non-farm income, the greater the livelihood improvement ability. In terms of climate change perceptions, DP and RCP had significant negative impacts on the ability of households to improve their livelihoods, indicating that when households’ perceptions of rainfall patterns and drought changes are more obvious, their preparations for alternative livelihood strategies will be more complete, and the intensity of climate change impacts on their own livelihoods will be more significant. DI, FP and CD have no significant effects on the ability of households to improve their livelihoods.
The overall analysis of the model results showed that family demographic characteristics, family location characteristics, water utilization behaviors, livelihood choices, and climate change perceptions had significant impacts on the ability of households to improve their livelihoods. A comparison of the regression coefficients for these variables showed that NIR, MLR, and CE have the largest regression coefficients, indicating that these three aspects have the most obvious impacts on the ability of households to improve their livelihoods. Studies have confirmed that non-farm employment is a very important factor in the livelihood improvement ability of farmers [30,31]. In fact, increasing household non-farm employment, whether it affects disaster resilience or livelihood improvement ability, will play a direct and important role. Inconsistent with the findings of previous studies, women often play important roles in improving livelihoods, and their lives are often harder and more painful than those of men [32]. Our research found that among farmers in the KRB, the male labor force plays an important role in livelihood improvement ability relative to that of women. Therefore, we propose that households’ livelihoods in the KRB should be improved in terms of gender equality.

5. Conclusion and Implications

Through field research and feedback from respondents, we found that climate change has important impacts on water use and households’ livelihoods in the mountains of the KRB. Our study emphasizes that significant differences exist in the water use patterns of households across elevations in the KRB. The irrigation water supplies in the high mountainous areas and the agricultural and domestic water supplies in the arid regions of the mid-mountain regions are most affected by climate change. Moreover, at different elevations, the impacts of climate change on households are also different. Households’ perceptions of climate change also differ significantly, and the degree of crop damage from disasters varies by region. This study also explored the key factors that affect the resilience of farmers and their livelihood improvement abilities through a classic binary logistic regression model and found that CE, NIR, MLR, FIR, and DWC have key impacts on households’ resilience and livelihood improvement abilities. Simultaneously, we observed an interesting phenomenon in the study—the local public water infrastructure is mostly supported by NGOs, and a governmental role in local water facilities is lacking in some areas.
Based on our research findings, we propose several strategies that can help farmers improve their livelihoods. First, improving household education levels through higher or vocational education is an efficient way to achieve livelihood improvements and disaster response resilience. It is also necessary to encourage non-farm professional training for households, which can raise households’ non-farm income levels, thereby reducing dependence on agriculture. Second, promoting the equality of men and women may improve the disaster response resilience and livelihood improvement ability of the female labor force. Finally, NGOs should be supported and encouraged to play a role in rural infrastructure construction. Compared with previous studies, this study mainly analyzes the different water use modes of farmers at different altitudes. It also more fully explores the factors affecting farmer livelihood improvement abilities and the strength of household post-disaster resilience. More explicit education and non-farm livelihood activities are important to achieving the sustainable development of farmers’ livelihoods. However, because the depth of this research was affected by both research funding and labor power, the sample size of the survey is limited and may not be representative of farmers in all regions. In future research, the sample will be expanded. In addition, in this study, cultural and environmental factors were not included in the model; cultural factors in particular are not easy to quantify. We only considered cultural factors in the analysis and discussion. Future research may be needed to strengthen the analysis and application of these two types of factors. Thus, new discoveries are expected in the next study.

Author Contributions

Conceptualization, J.W., X.S., and W.D.; Data curation, J.W., Y.S., and S.P.K.; formal analysis, J.W.; Investigation, J.W., X.S., L.P., and W.D.; Supervision, W.D.; Visualization, Y.S. and Y.Z.; Writing—original draft, J.W.; Writing—review and editing, J.W., X.S., L.P., S.P.K., and W.D. All authors have read and approved the final manuscript.

Funding

We would like to acknowledge support from the NSFC-ICIMOD Cooperation Project (NO. 41661144038), the Sichuan Provincial Research Center for Philosophy and Social Sciences—Sichuan Rural Development Research Center (NO. CR1908), the National Social Science Fund (NO. 18CJL018), and the Chengdu Science and Technology Bureau Soft Science Project (NO. 2019-RK00-00319-ZF).

Acknowledgments

We wish to thank the instructors and students of Tribhuvan University who participated in the survey and the kind local villagers who were willing to be interviewed. We would like to thank two anonymous reviewers for constructive comments that significantly improved this article.

Conflicts of Interest

The authors declare no conflict of interest.

References

  1. IPCC. Climate Change 2014: Impacts, Adaptation, and Vulnerability; Cambridge University Press: Cambridge, UK, 2014. [Google Scholar]
  2. Adger, W.N.; Huq, S.; Brown, K.; Conway, D.; Hulme, M. Adaptation to climate change in the developing world. Prog. Dev. Stud. 2003, 3, 179–195. [Google Scholar] [CrossRef]
  3. Thornton, P.K.; van de Steeg, J.; Notenbaert, A.; Herrero, M. The impacts of climate change on livestock and livestock systems in developing countries: A review of what we know and what we need to know. Agric. Syst. 2009, 101, 113–127. [Google Scholar] [CrossRef]
  4. Mani, D. Climate Change Adaptation: Strategic Vision in Agriculture. J. Agric. Environ. 2013, 12, 104–112. [Google Scholar]
  5. Price, J.I.; Janmaat, J.; Sugden, F.; Bharati, L. Water storage systems and preference heterogeneity in water-scarce environments: A choice experiment in Nepal’s Koshi River Basin. Water Resour. Econ. 2015, 13, 6–18. [Google Scholar] [CrossRef]
  6. Meena, H.E.; Lugenja, M.; Stephenson, M. Climate change impacts on livelihoods in Tanzania and adaptation options: Experience of floods and drought in Rufiji. Czechoslov. J. Phys. 2006, 44, 865–870. [Google Scholar]
  7. Knox, J.; Hess, T.; Daccache, A.; Wheeler, T. Climate change impacts on crop productivity in Africa and South Asia. Environ. Res. Lett. 2012, 7, 034032. [Google Scholar] [CrossRef]
  8. Wahid, S.M.; Mukherji, A.; Shrestha, A. Climate Change Adaptation, Water Infrastructure Development, and Responsive Governance in the Himalayas: The Case Study of Nepal’s Koshi River Basin. In Increasing Resilience to Climate Variability and Change; Springer: Singapore, 2016; pp. 61–80. [Google Scholar]
  9. Neupane, N.; Nibanupudi, H.K.; Gurung, M.B. Interlacing of Regional Water Policies, Institutions and Agreements with Livelihoods and Disaster Vulnerabilities in the HKH Region: A Case Study of Kosi River Basin. In Mountain Hazards and Disaster Risk Reduction; Springer: Tokyo, Japan, 2015; pp. 251–270. [Google Scholar]
  10. Bartlett, R.; Bharati, L.; Pant, D.; Hosterman, H.; McCornick, P.G. Climate Change Impacts and Adaptation in Nepal; IWMI: Fort Collins, Sri Lanka, 2010; Volume 12, pp. 109–116. [Google Scholar]
  11. Thornton, P.K.; Ericksen, P.J.; Herrero, M.; Challinor, A. Climate variability and vulnerability to climate change: A review. Glob. Chang. Biol. 2014, 20, 3313–3328. [Google Scholar] [CrossRef] [PubMed]
  12. IPCC. Climate Change 2007: The Scientific Basis. WG I Contribution to IPCC 4th Assessment Report; Cambridge University Press: Cambridge, UK, 2007. [Google Scholar]
  13. Eriksen, S.H.; O’brien, K. Vulnerability, poverty and the need for sustainable adaptation measures. Clim. Policy 2007, 7, 337–352. [Google Scholar] [CrossRef]
  14. Agrawal, A. Local institutions and adaptation to climate change. Soc. Dimens. Clim. Chang. 2010, 2, 173–178. [Google Scholar]
  15. Mertz, O.; Mbow, C.; Reenberg, A.; Diouf, A. Farmers’ perceptions of climate change and agricultural adaptation strategies in rural Sahel. Environ. Manag. 2009, 43, 804–816. [Google Scholar] [CrossRef]
  16. Pasquini, L.; Cowling, R.M.; Ziervogel, G. Facing the heat: Barriers to mainstreaming climate change adaptation in local government in the Western Cape Province, South Africa. Habitat Int. 2013, 40, 225–232. [Google Scholar] [CrossRef]
  17. Raymond, C.M.; Robinson, G.M. Factors affecting rural landholders’ adaptation to climate change: Insights from formal institutions and communities of practice. Glob. Environ. Chang. 2013, 23, 103–114. [Google Scholar] [CrossRef]
  18. Vignola, R.; Harvey, C.A.; Bautista-Solis, P.; Avelino, J.; Rapidel, B.; Donatti, C.; Martinez, R. Ecosystem-based adaptation for smallholder farmers: Definitions, opportunities and constraints. Agric. Ecosyst. Environ. 2015, 211, 126–132. [Google Scholar] [CrossRef] [Green Version]
  19. Park, S.E.; Marshall, N.A.; Jakku, E.; Dowd, A.M.; Howden, S.M.; Mendham, E.; Fleming, A. Informing adaptation responses to climate change through theories of transformation. Glob. Environ. Chang. 2012, 22, 115–126. [Google Scholar] [CrossRef]
  20. Manyena, S.B. The concept of resilience revisited. Disasters 2006, 30, 434–450. [Google Scholar] [CrossRef]
  21. Holling, S.C. Resilience and Stability of Ecological Systems. Annu. Rev. Ecol. Syst. 1973, 4, 1–23. [Google Scholar] [CrossRef] [Green Version]
  22. Marshall, N.A.; Park, S.; Howden, S.M.; Dowd, A.B.; Jakku, E.S. Climate change awareness is associated with enhanced adaptive capacity. Agric. Syst. 2013, 117, 30–34. [Google Scholar] [CrossRef]
  23. Maina, I.; Miruka, M.; Rono, B.; Njeru, P.N.M.; Amboga, S.; Gitari, J.; Mahasi, M.; Murithi, F. Adaptive strategies and local innovations of smallholder farmers in selected agri-food systems of central Kenya. Afr. Crop Sci. J. 2011, 20, 77–84. [Google Scholar]
  24. Malone, E.; Brenkert, A. Vulnerability, Sensitivity and Coping/Adapting Capacity Worldwide. Available online: https://www.researchgate.net/publication/255215448_Vulnerability_Sensitivity_and_CopingAdaptive_Capacity_Worldwide (accessed on 29 August 2019).
  25. Speranza, C.I.; Wiesmann, U.; Rist, S. An indicator framework for assessing livelihood resilience in the context of social-ecological dynamics. Glob. Environ. Chang. 2014, 28, 109–119. [Google Scholar] [CrossRef]
  26. Nelson, D.R.; Adger, W.N.; Brown, K. Adaptation to Environmental Change: Contributions of a Resilience Framework. Soc. Sci. Electron. Publ. 2007, 32, 395–419. [Google Scholar] [CrossRef] [Green Version]
  27. Reggers, A.; Grabowski, S.; Wearing, S.L.; Chatterton, P.; Schweinsberg, S. Exploring outcomes of community-based tourism on the Kokoda Track, Papua New Guinea: A longitudinal study of Participatory Rural Appraisal techniques. J. Sustain. Tour. 2016, 24, 1139–1155. [Google Scholar] [CrossRef]
  28. Reddy, K.S.; Pankaj, P.K.; Reddy, N.N.; Raju, N.S. Participatory Rural Appraisal in Drylands: A Holistic Approach for Getting Insight into an Agro-Ecosystem Analysis. J. Rural Dev. 2016, 35, 555–580. [Google Scholar]
  29. Miller, L.C.; Joshi, N.; Lohani, M.; Rogers, B.; Mahato, S.; Ghosh, S.; Webb, P. Women’s education level amplifies the effects of a livelihoods-based intervention on household wealth, child diet, and child growth in rural Nepal. Int. J. Equity Health 2017, 16, 183. [Google Scholar] [CrossRef] [PubMed]
  30. Stifel, D. The rural non-farm economy, livelihood strategies and household welfare. Afr. J. Agric. Resour. Econ. 2010, 4, 82–109. [Google Scholar]
  31. Das, V.K.; Ganesh-Kumar, A. Farm size, livelihood diversification and farmer’s income in India. Decision 2018, 45, 185–201. [Google Scholar] [CrossRef]
  32. Ahmed, M.K.; Halim, S.; Sultana, S. Participation of women in aquaculture in three coastal districts of Bangladesh: Approaches toward sustainable livelihood. World J. Agric. Sci. 2012, 8, 253–268. [Google Scholar]
Figure 1. Study area (VDC is Village Development Committee).
Sustainability 11 05064 g001
Figure 2. Different loss characteristics caused by disasters in different regions.
Sustainability 11 05064 g002
Figure 3. Effects of floods and droughts on household water use.
Sustainability 11 05064 g003
Figure 4. Water use model in the KRB (Koshi River Basin).
Sustainability 11 05064 g004
Figure 5. Roof collection system for rainwater: (a) The arrow shows the flow direction of rainwater runoff; (b) the red circle marks the rainwater reservoir.
Sustainability 11 05064 g005
Table 1. Sample village characteristics.
Zone NameSample DistrictAltitudeNumber of Questionnaires
DolakhaJiri2000–2400 m90
RamechhapManthali1200–1500 m90
SindhupalchokHelambu1600–1800 m59
UdayapurBelakha200–300 m90
Table 2. Names, symbols, and definitions of all variables.
Variable NameSymbolDefinition
Disaster ResilienceDRThe measure to deal with disasters (0 = weak, 1 = strong)
Livelihood Improvement AbilityLIAA measure of the ability to improve family conditions (0 = weak, 1 = strong)
Family SizeFSThe number of family members living at home for more than 6 months (persons)
Laborer ScaleLSThe proportion of 18–60 year-olds in the household population (%)
Male Laborer RateMLRThe proportion of male laborers in the household population (%)
College EducationCEThe number of people in the family who have received college education (persons)
Domestic Water ConsumptionDWCHousehold daily domestic water consumption (L)
Domestic Water DistanceDWDThe distance from the house to the nearest domestic water source (km)
Production Water DistancePWDThe distance from the house to the nearest production water source (km)
Breeding LivestockBLWhether the household breeds livestock (number)
Farming Income RateFIRProportion of household income accounted for by farming (%)
Non-Farm Income RateNIRProportion of household nonfarm income (%)
Drought ImpactDIWhether droughts impact water use (0 = no; 1 = yes)
Drought PerceptionDPWhether droughts impact their lives (0 = no; 1 = yes)
Flood PerceptionFPWhether floods impact their lives (0 = no; 1 = yes)
Rainfall Change PerceptionRCPWhether they feel that rainfall patterns have changed (0 = no; 1 = yes)
Crops DamagedCDThe proportion of crop losses from floods and droughts (%)
Table 3. Descriptive statistics for all variables.
VariableMeanSDVariableMeanSD
DR0.710.46PWD0.521.45
LIA0.400.49FIR57.5537.11
FS5.562.26NIR43.5123.21
LS3.281.68DI0.630.47
MLR0.321.02DP0.860.34
CE0.410.95FP0.500.22
DWD2.392.09RCP0.320.47
DWC354.66310.16CD36.3526.90
BL19.2511.63---
Table 4. Average flood and drought frequencies over the past 10 years.
DisastersDolakhaRamechhapSindhupalchokUdayapurTotalF value
Flood (times)2.83.73.84.53.77.06 ***
Flood duration/time462547233424.047 ***
Drought(times)3.24.44.23.23.824.047 ***
Drought duration/time98107100779513.931 ***
Note: *** indicate statistical significance at the 10%, 5%, and 1% level, respectively.
Table 5. Results of the econometric models.
VariablesDisaster Resilience Livelihood Improvement Ability
Model 1Model 2
FS−1.206 **-
(0.851)-
LS2.547 ***1.031 *
(0.997)(0.562)
MLR-4.973 **
-(2.749)
CE6.733 **3.890 ***
(2.131)(1.462)
DWD−0.400 ***-
(0.142)-
DWC−3.930 **-
(1.747)-
BL−0.102 *1.334 **
(0.673)(0.122)
PWD-−1.548 **
-(0.429)
FIR−4.660 ***−2.504 *
(2.004)(0.488)
NIR1.3245 **6.600 *
(0.402)(2.947)
DI--
--
DP1.237 **0.808 *
(0.782)(0.331)
FP2.002 **-
(1.120)-
RCP2.904 ***3.063 ***
(1.097)(2.180)
CD−0.864 *-
(0.079)-
Constant−0.843−7.993 ***
(1.302)(2.488)
Wald Chi2 (χ)26.38 ***45.97 ***
Nagelkerke R20.080.19
Note: *, **, *** indicate statistical significance at the 10%, 5%, and 1% level, respectively.

