Photovoltaic Expansion-Limit through a Net Energy Metering Scheme for Selected Malaysian Public Hospitals


 ,
,  ,
,
Abstract
:1. Introduction
- Highlighted the discrepancies in effectiveness between NEM requirement for maximum PV-DG capacity (i.e., 75% from MD) and the simulated PV-DG expansion-limit using an actual distribution network from three selected public hospitals.
- Highlighted the U-shape trajectory loss curve theory which bounded the simulation outcome for confirming the PV-DG expansion-limit as well as the optimal value.
- Established two conditions in measuring the NEM scheme compatibleness for selected Malaysian public hospitals, i.e., whether [expansion-limit ≤ 75% MD] or [expansion-limit ≥ 75% MD].
- In contrast, this research revealed confirmation of the incompatibility of the maximum PV-DG capacity requirement in the NEM scheme for selected Malaysian public hospitals and introduced the actual figure for maximum PV-DG capacity for these three-level hospitals.
2. Related Standards for PV-DG Integration
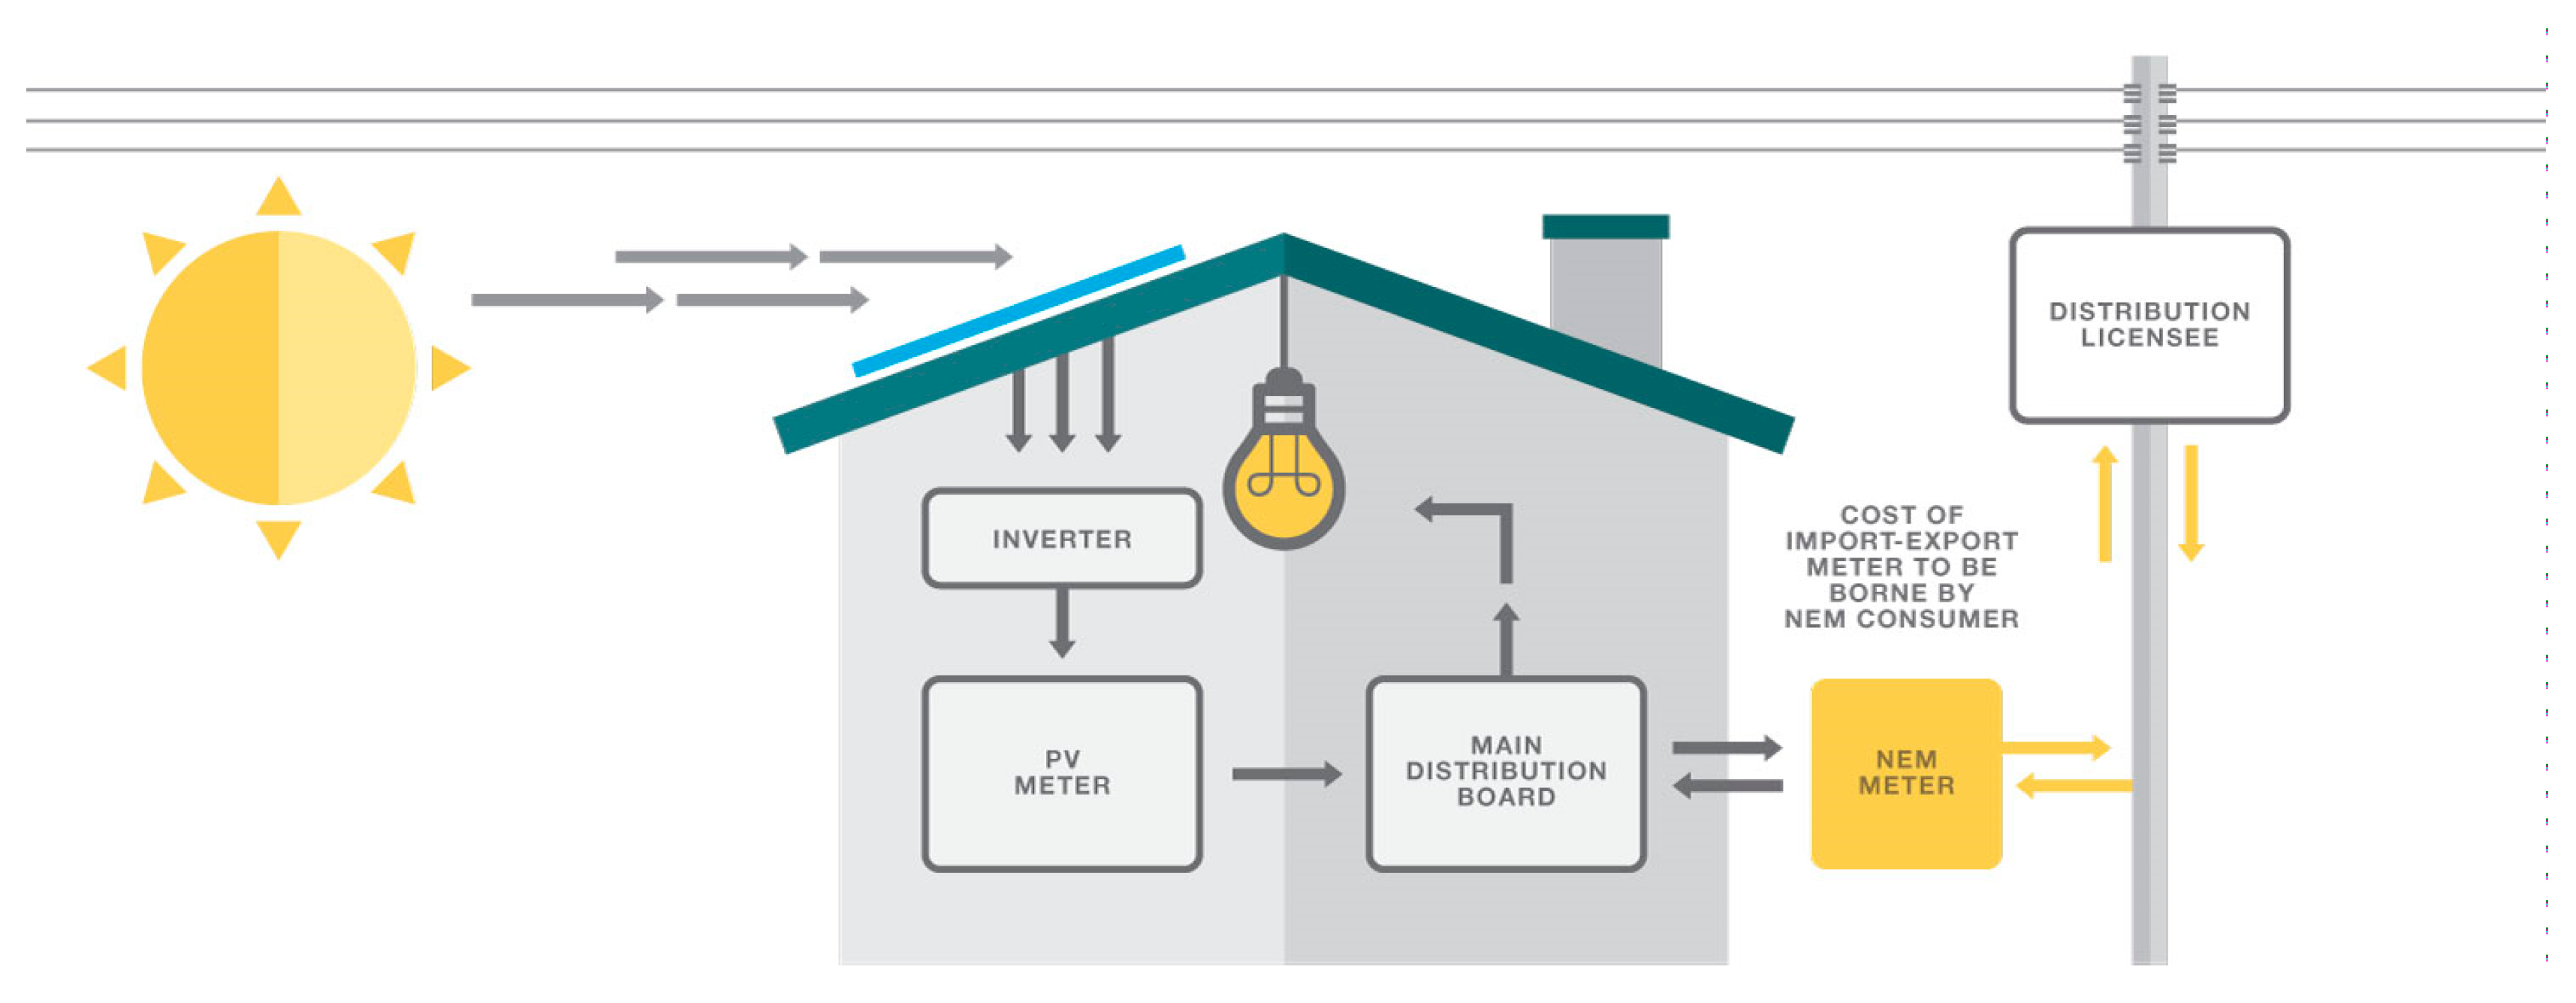
3. An Adoption of NEM Scheme for PV-DG Integration
4. Issues Related to PV-DG Integration and Expansion through NEM
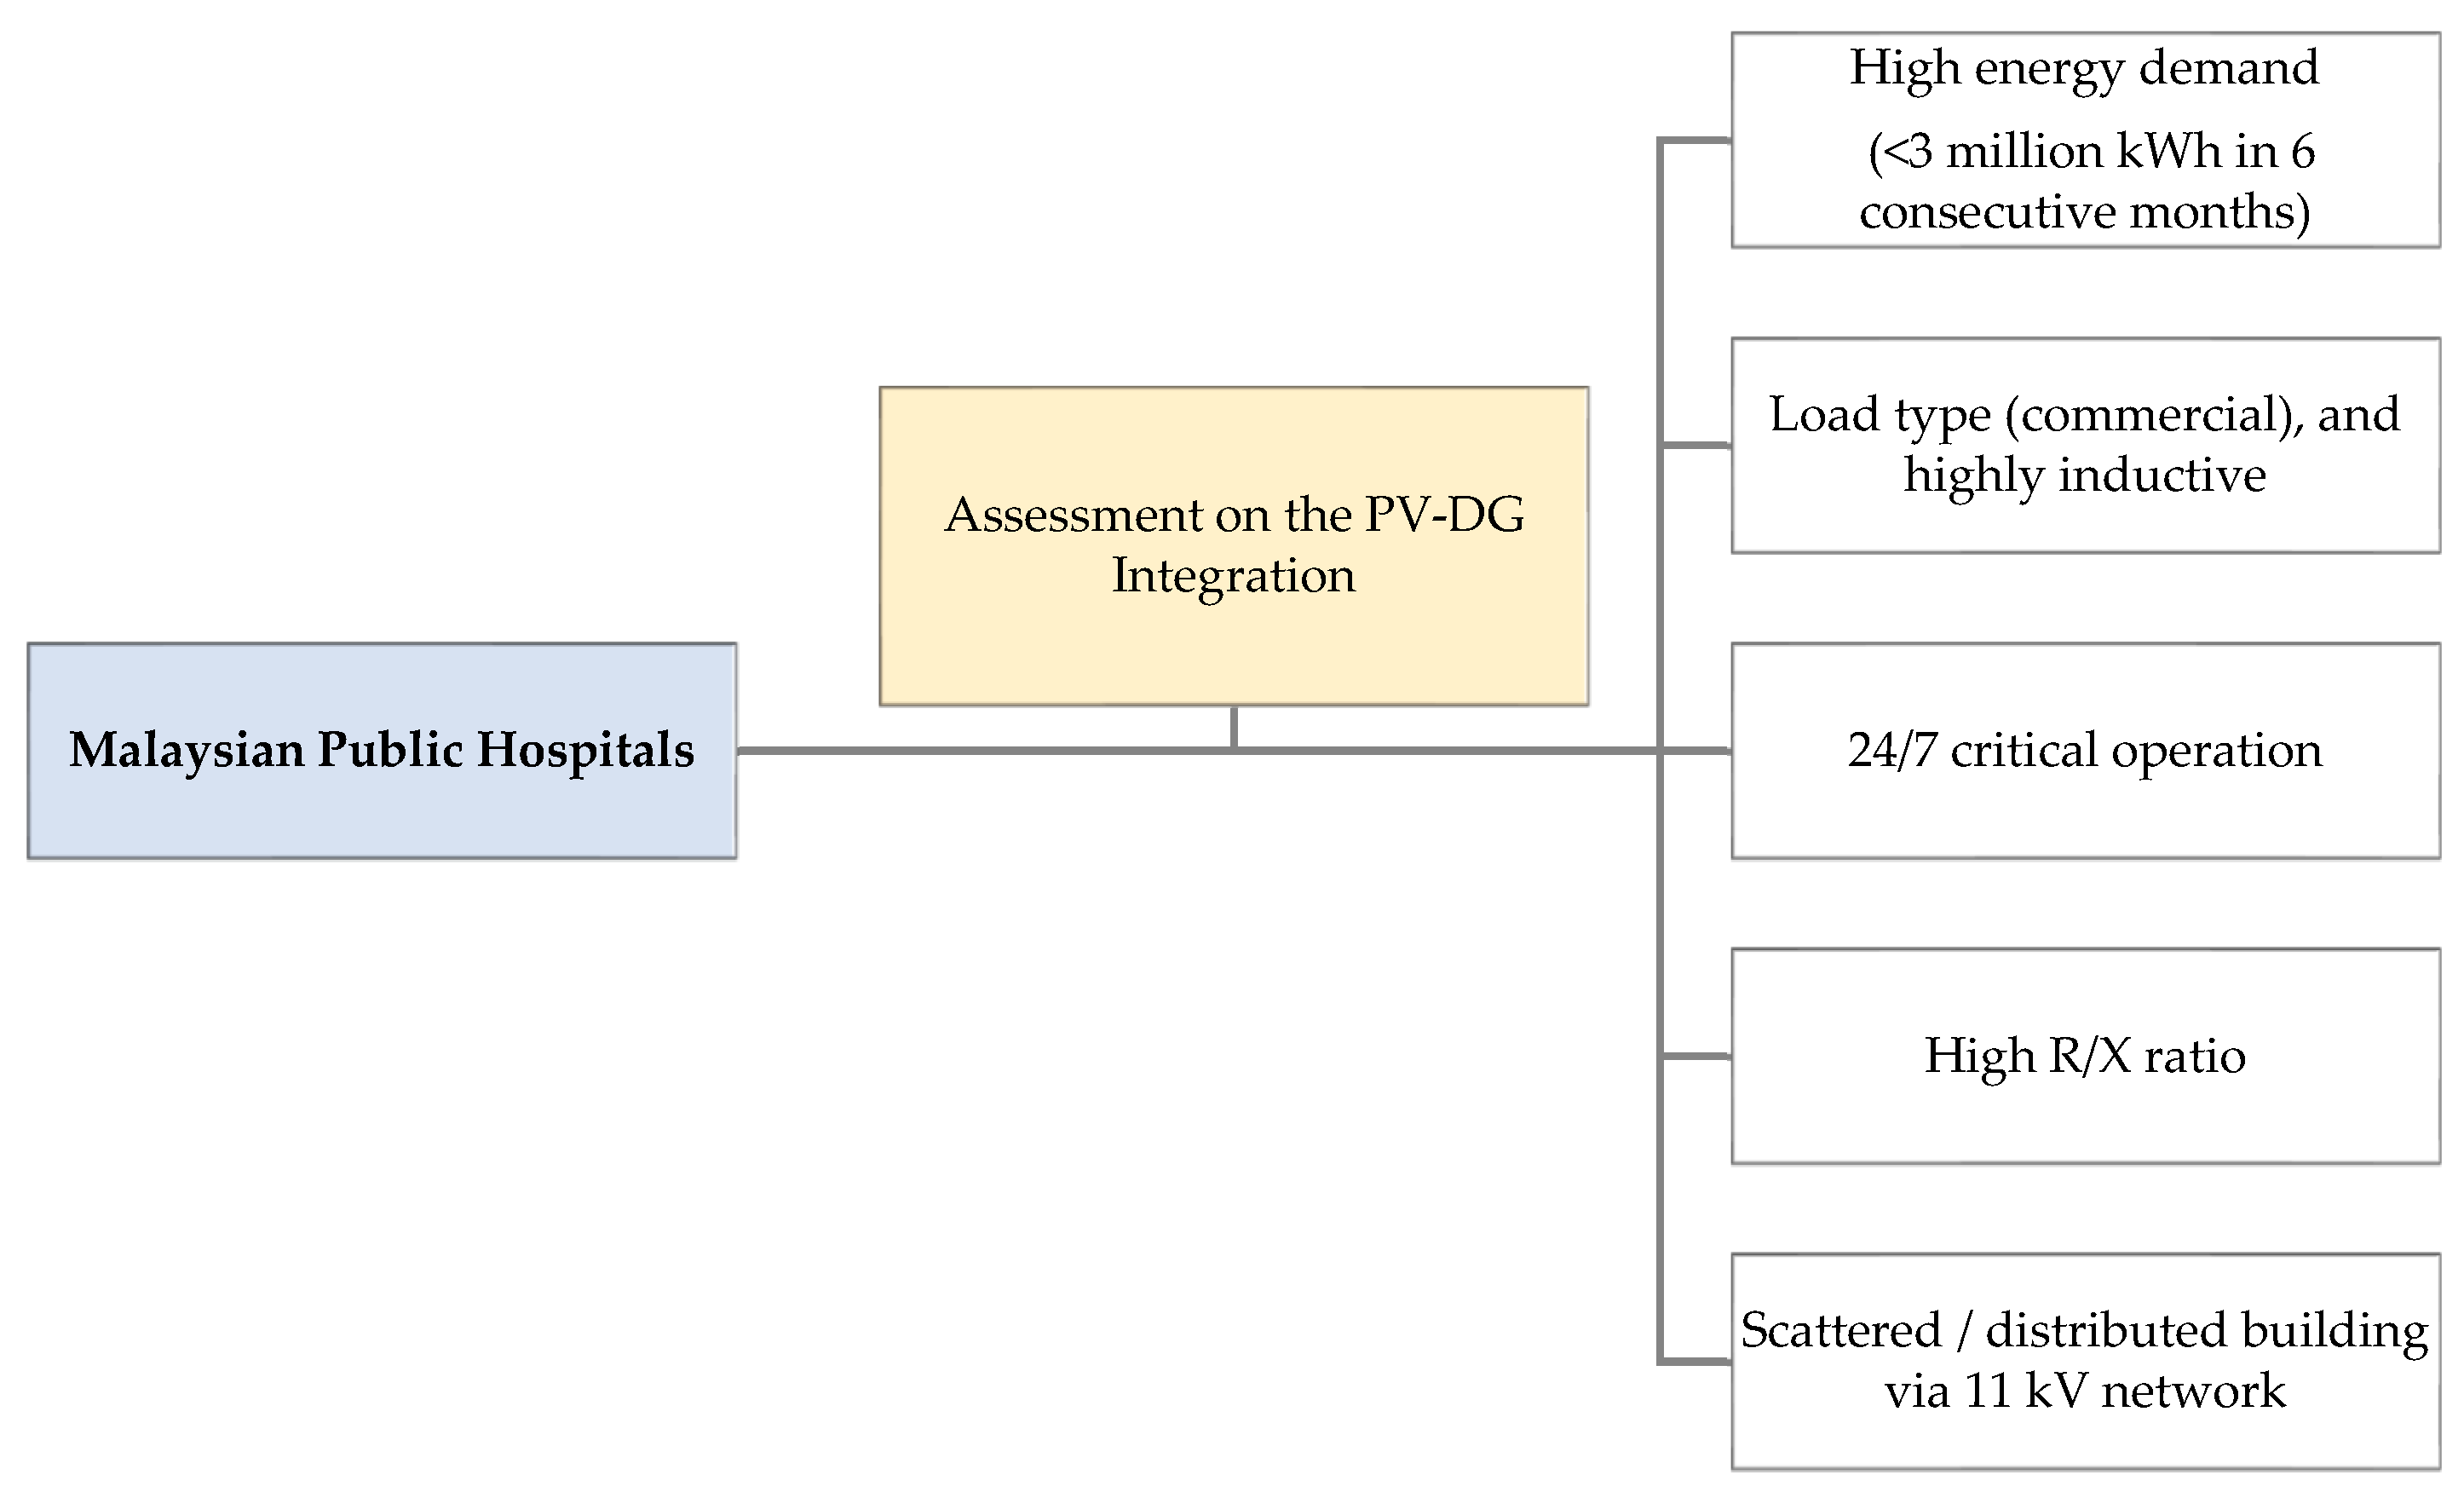
5. The Focus of Related Issues in PV-DG via NEM Application Within Malaysian Public Hospitals
6. Optimization Approach for Loss Reduction Element
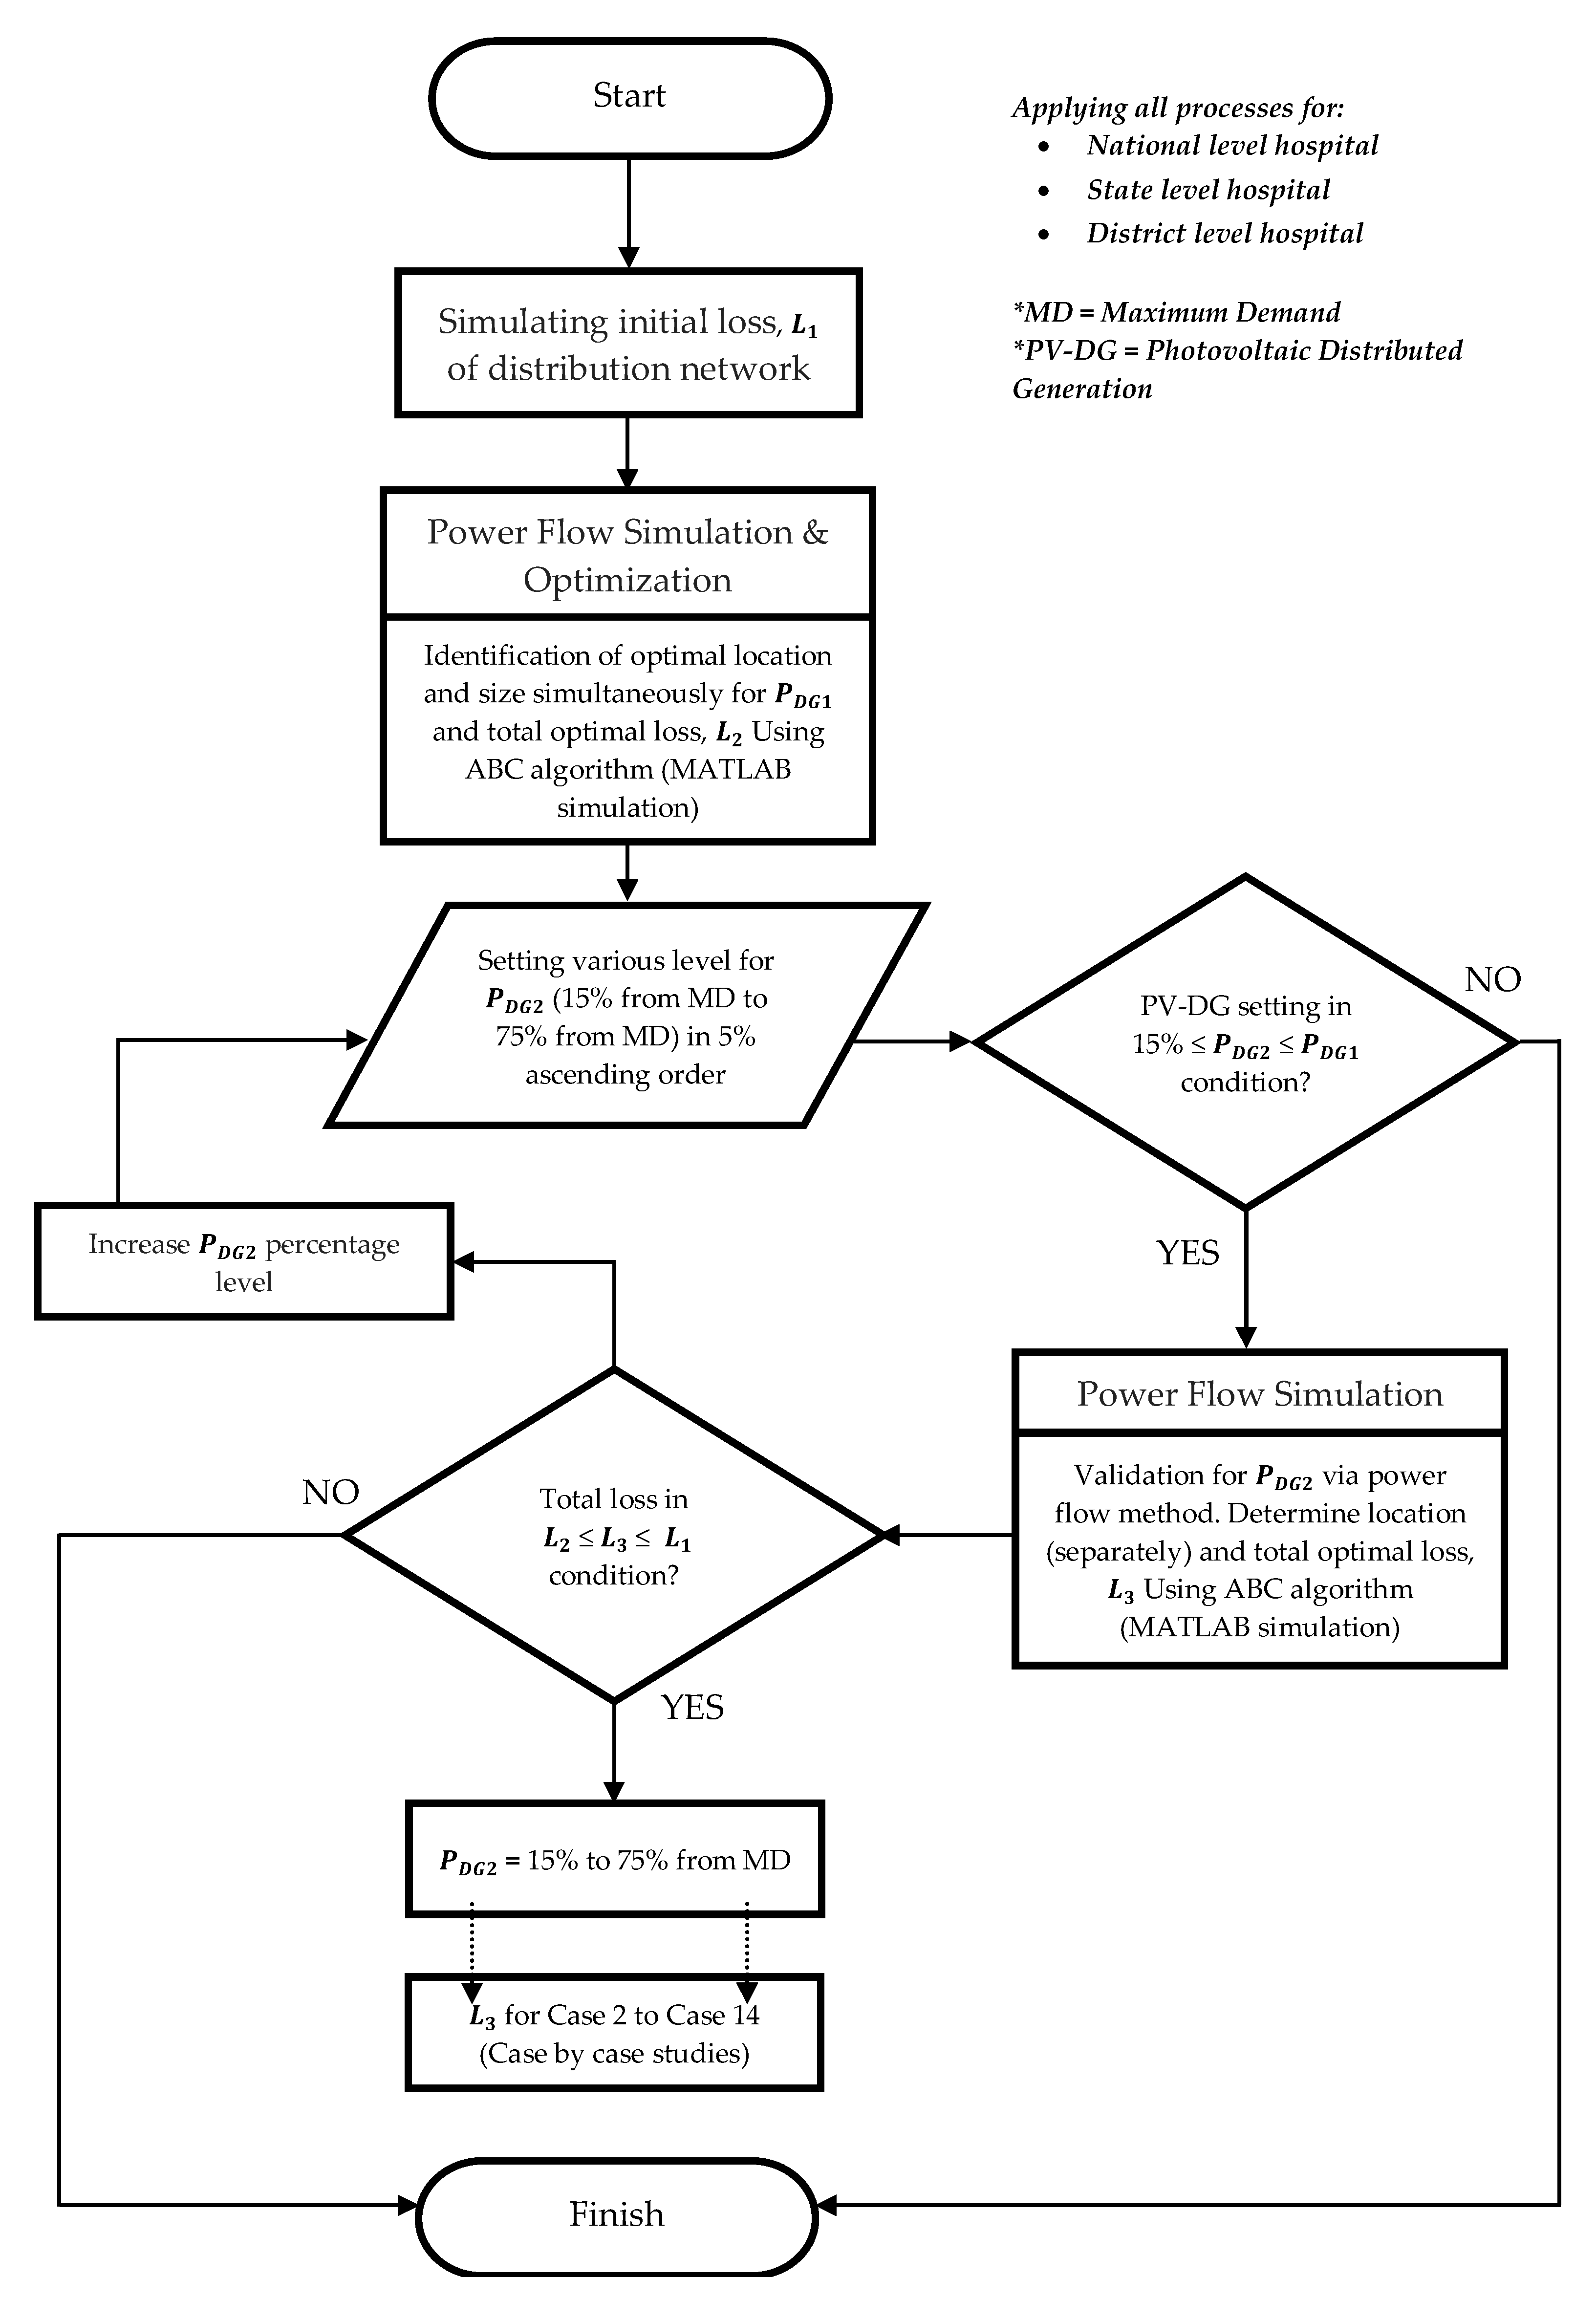
7. Research Method
- Step 1
- Initialization of the food source positions.
- Step 2
- Calculate the nectar amount of the population by means of their fitness values using Equation (6)
- Step 3
- Produce neighbor solutions by using Equation (8) for the employed bees and next, evaluate them as in Step 2.
- Step 4
- Apply the selection process.
- Step 5
- If all onlooker bees are distributed, skip to Step 9. Otherwise, go to the next step.
- Step 6
- Calculate the probability values using Equation (7) for the solutions
- Step 7
- Produce neighbor solutions for the selected onlooker bee, depending on the value, using Equation (8) and evaluate them as indicated in Step 2.
- Step 8
- Proceed with Step 4.
- Step 9
- Identify the scout bees abandoned solution, if it exists, replace it with a completely new solution via Equation (9) and the evaluation as indicated in Step 2.
- Step 10
- Memorize the best-attained solution.
- Step 11
- Stop if cycle = maximum cycle number (MCN) and display the result, else, proceed Step 3.
7.1. Size of DG Constraint
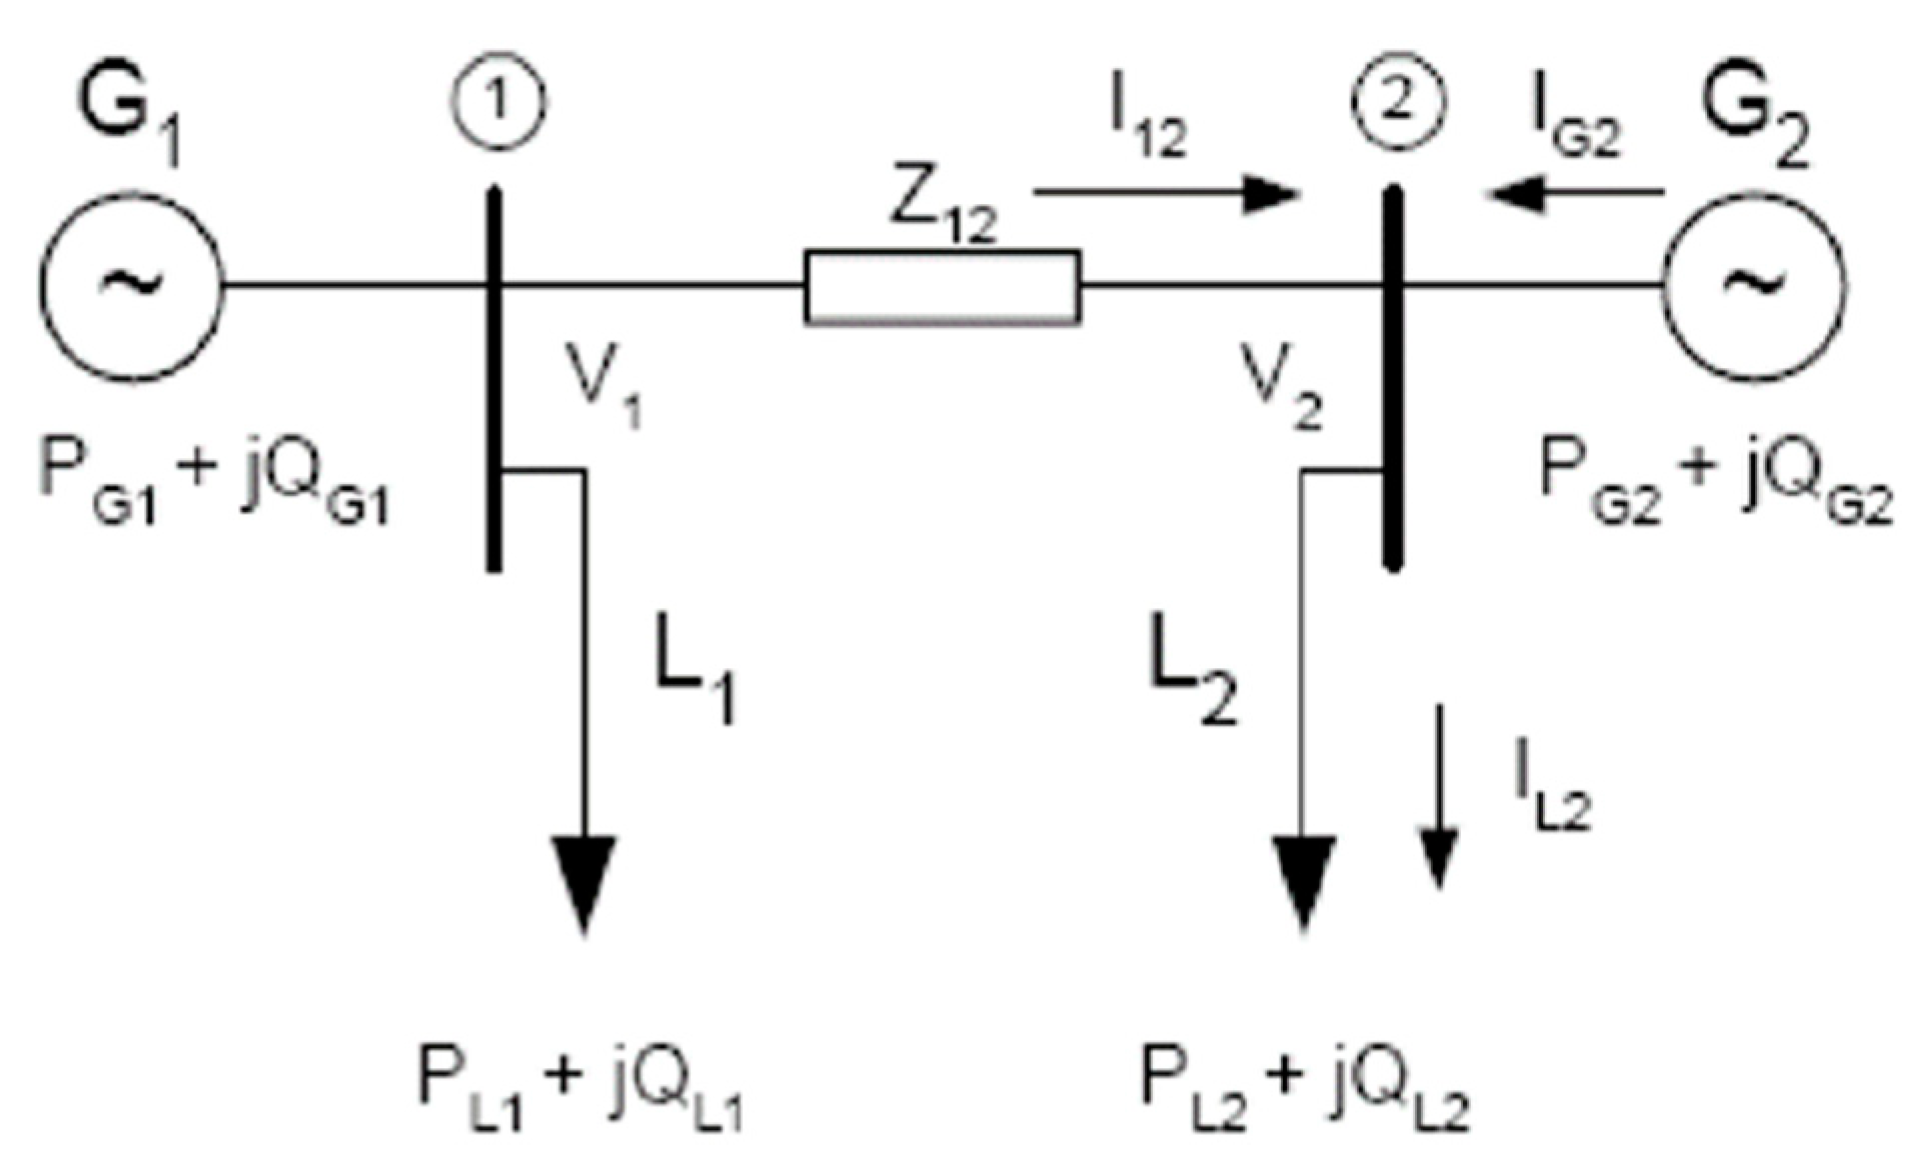
7.2. Power Balance Constraint
7.3. Voltage Bus Constraint
7.4. Radial Circuit Constraint
8. Results and Discussion
8.1. Result for National Level Hospital
8.2. Result for State Level Hospital
8.3. Result for District Level Hospital
8.4. Discussion on Simulated U-Trajectory Losses Curve Result
9. Conclusions
Author Contributions
Funding
Conflicts of Interest
Appendix A

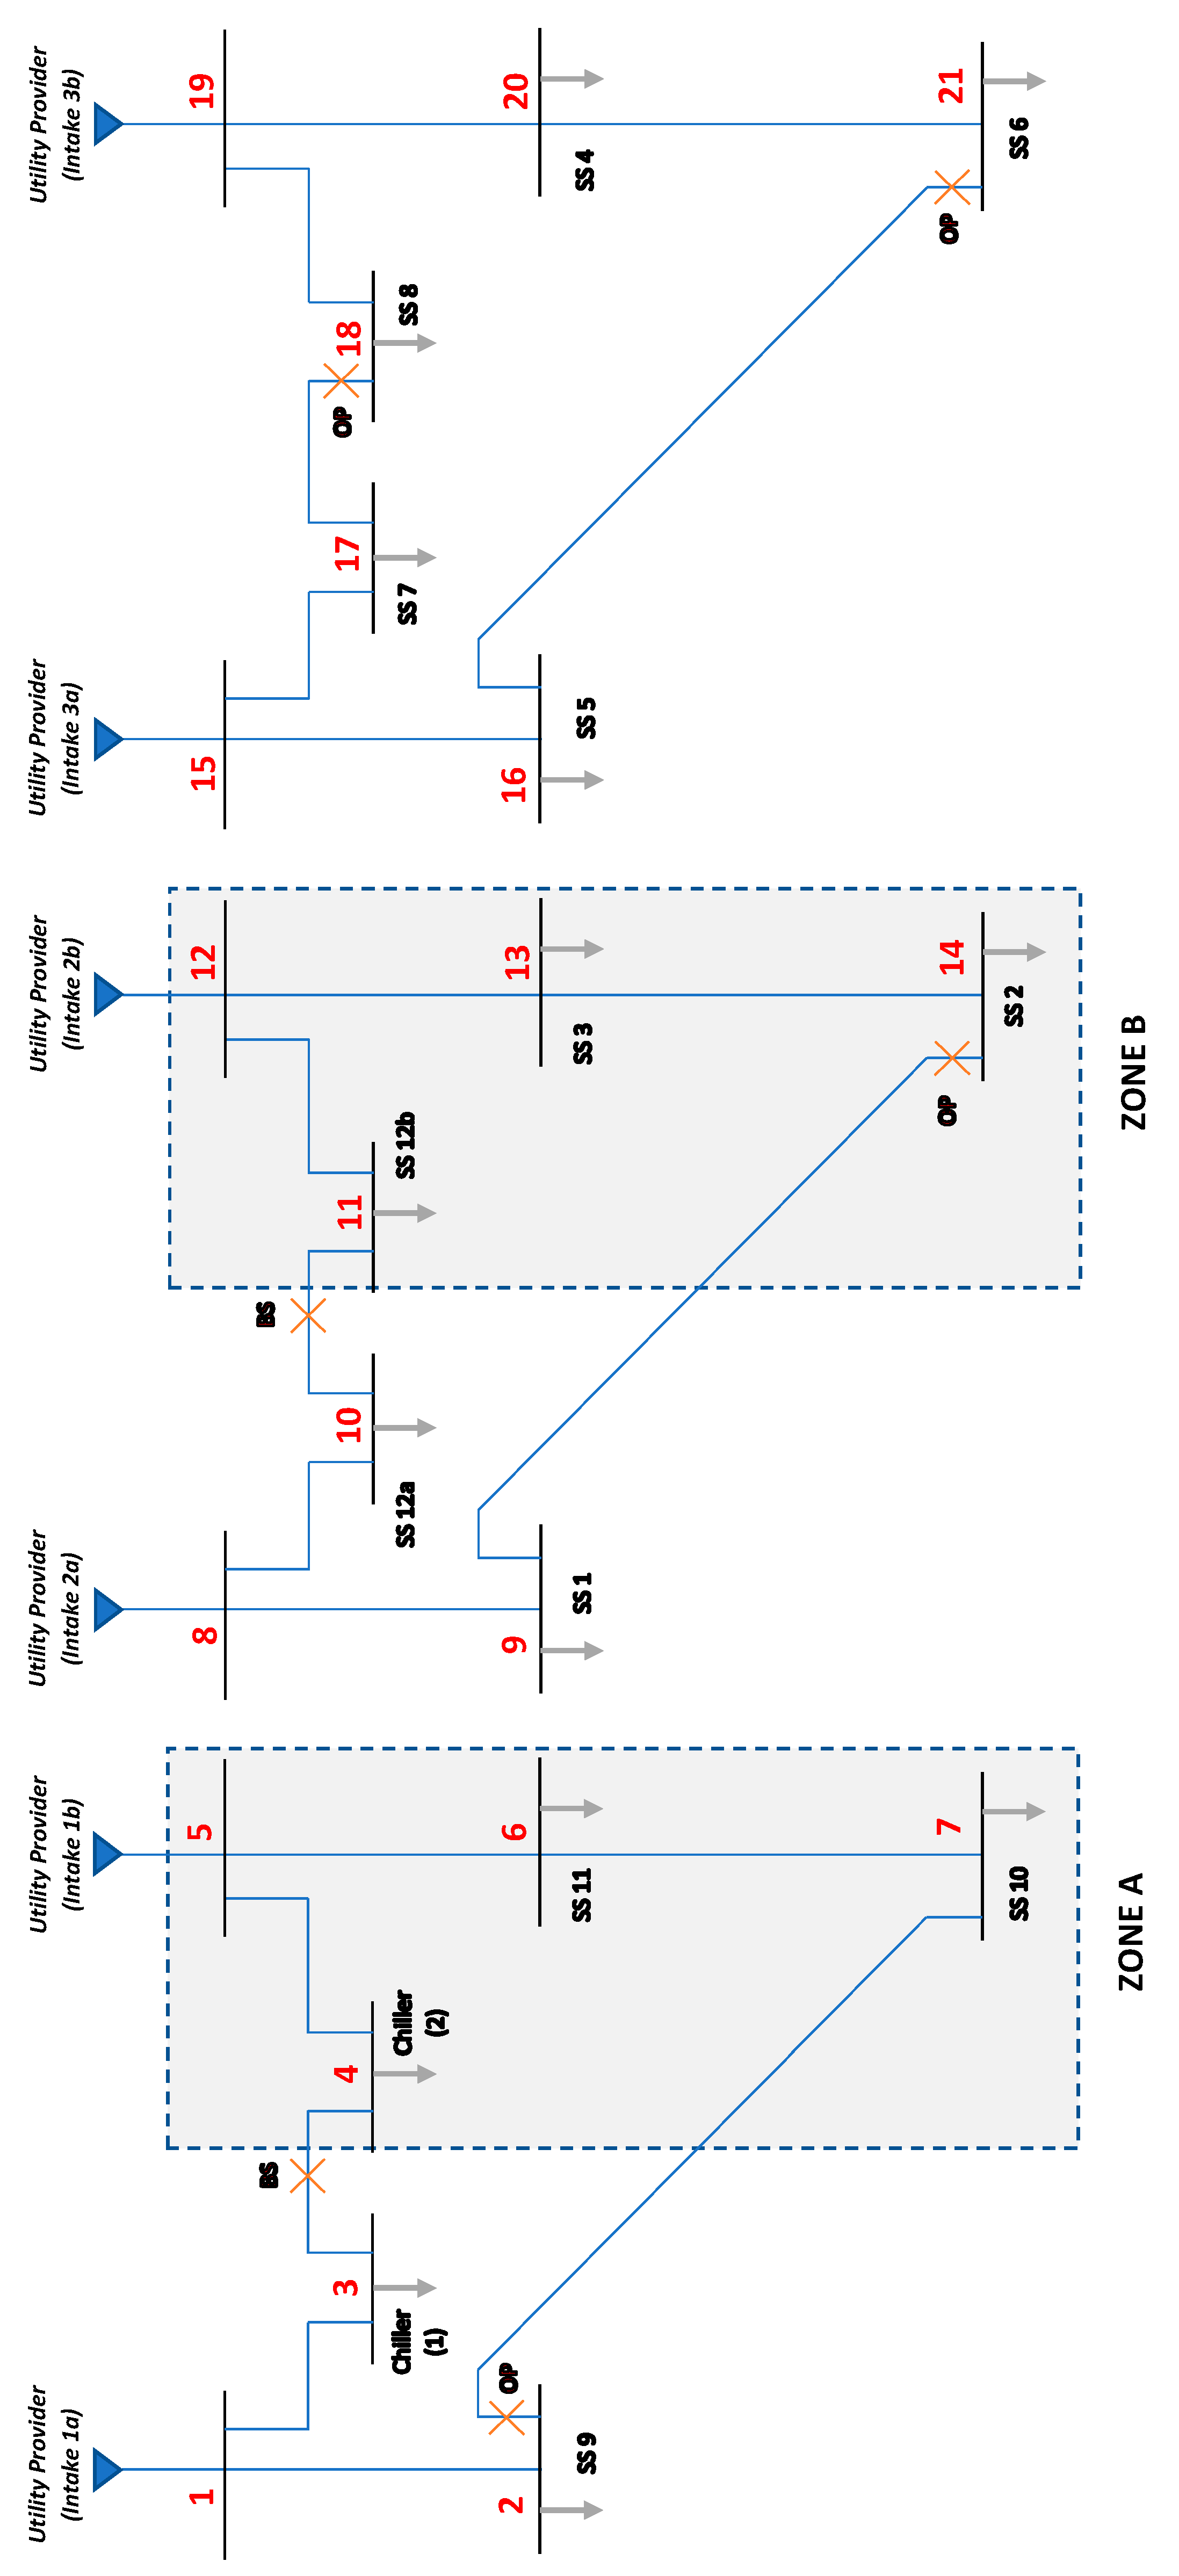
| Zone | Zone A | Zone B | ||||||
|---|---|---|---|---|---|---|---|---|
| Input Data | Bus 4 | Bus 5 | Bus 6 | Bus 7 | Bus 11 | Bus 12 | Bus 13 | Bus 14 |
| Voltage (kV) | 11.2 | 11.2 | 11.2 | 11.2 | 11.2 | 11.3 | 11.2 | 11.2 |
| P Load (kW) | 100 | 472 | 105 | 420 | 499 | 465 | 539 | 87 |
| Q Load (kVAR) | 52 | 170 | −46 | 240 | −68 | 157 | 111 | 52 |
| Resistance, R (Ω/km) | Bus 4–5 = 0.049, Bus 5–6 = 0.098, Bus 6–7 = 0.0686 | Bus 11–12 = 0.049, Bus 12–13 = 0.0686, Bus 13–14 = 0.049 | ||||||
| Reactance, X (Ω/km) | Bus 4–5 = 0.0377, Bus 5–6 = 0.0754, Bus 6–7 = 0.0528 | Bus 11–12 = 0.0377, Bus 12–13 =0.0528, Bus 13–14 = 0.0377 | ||||||
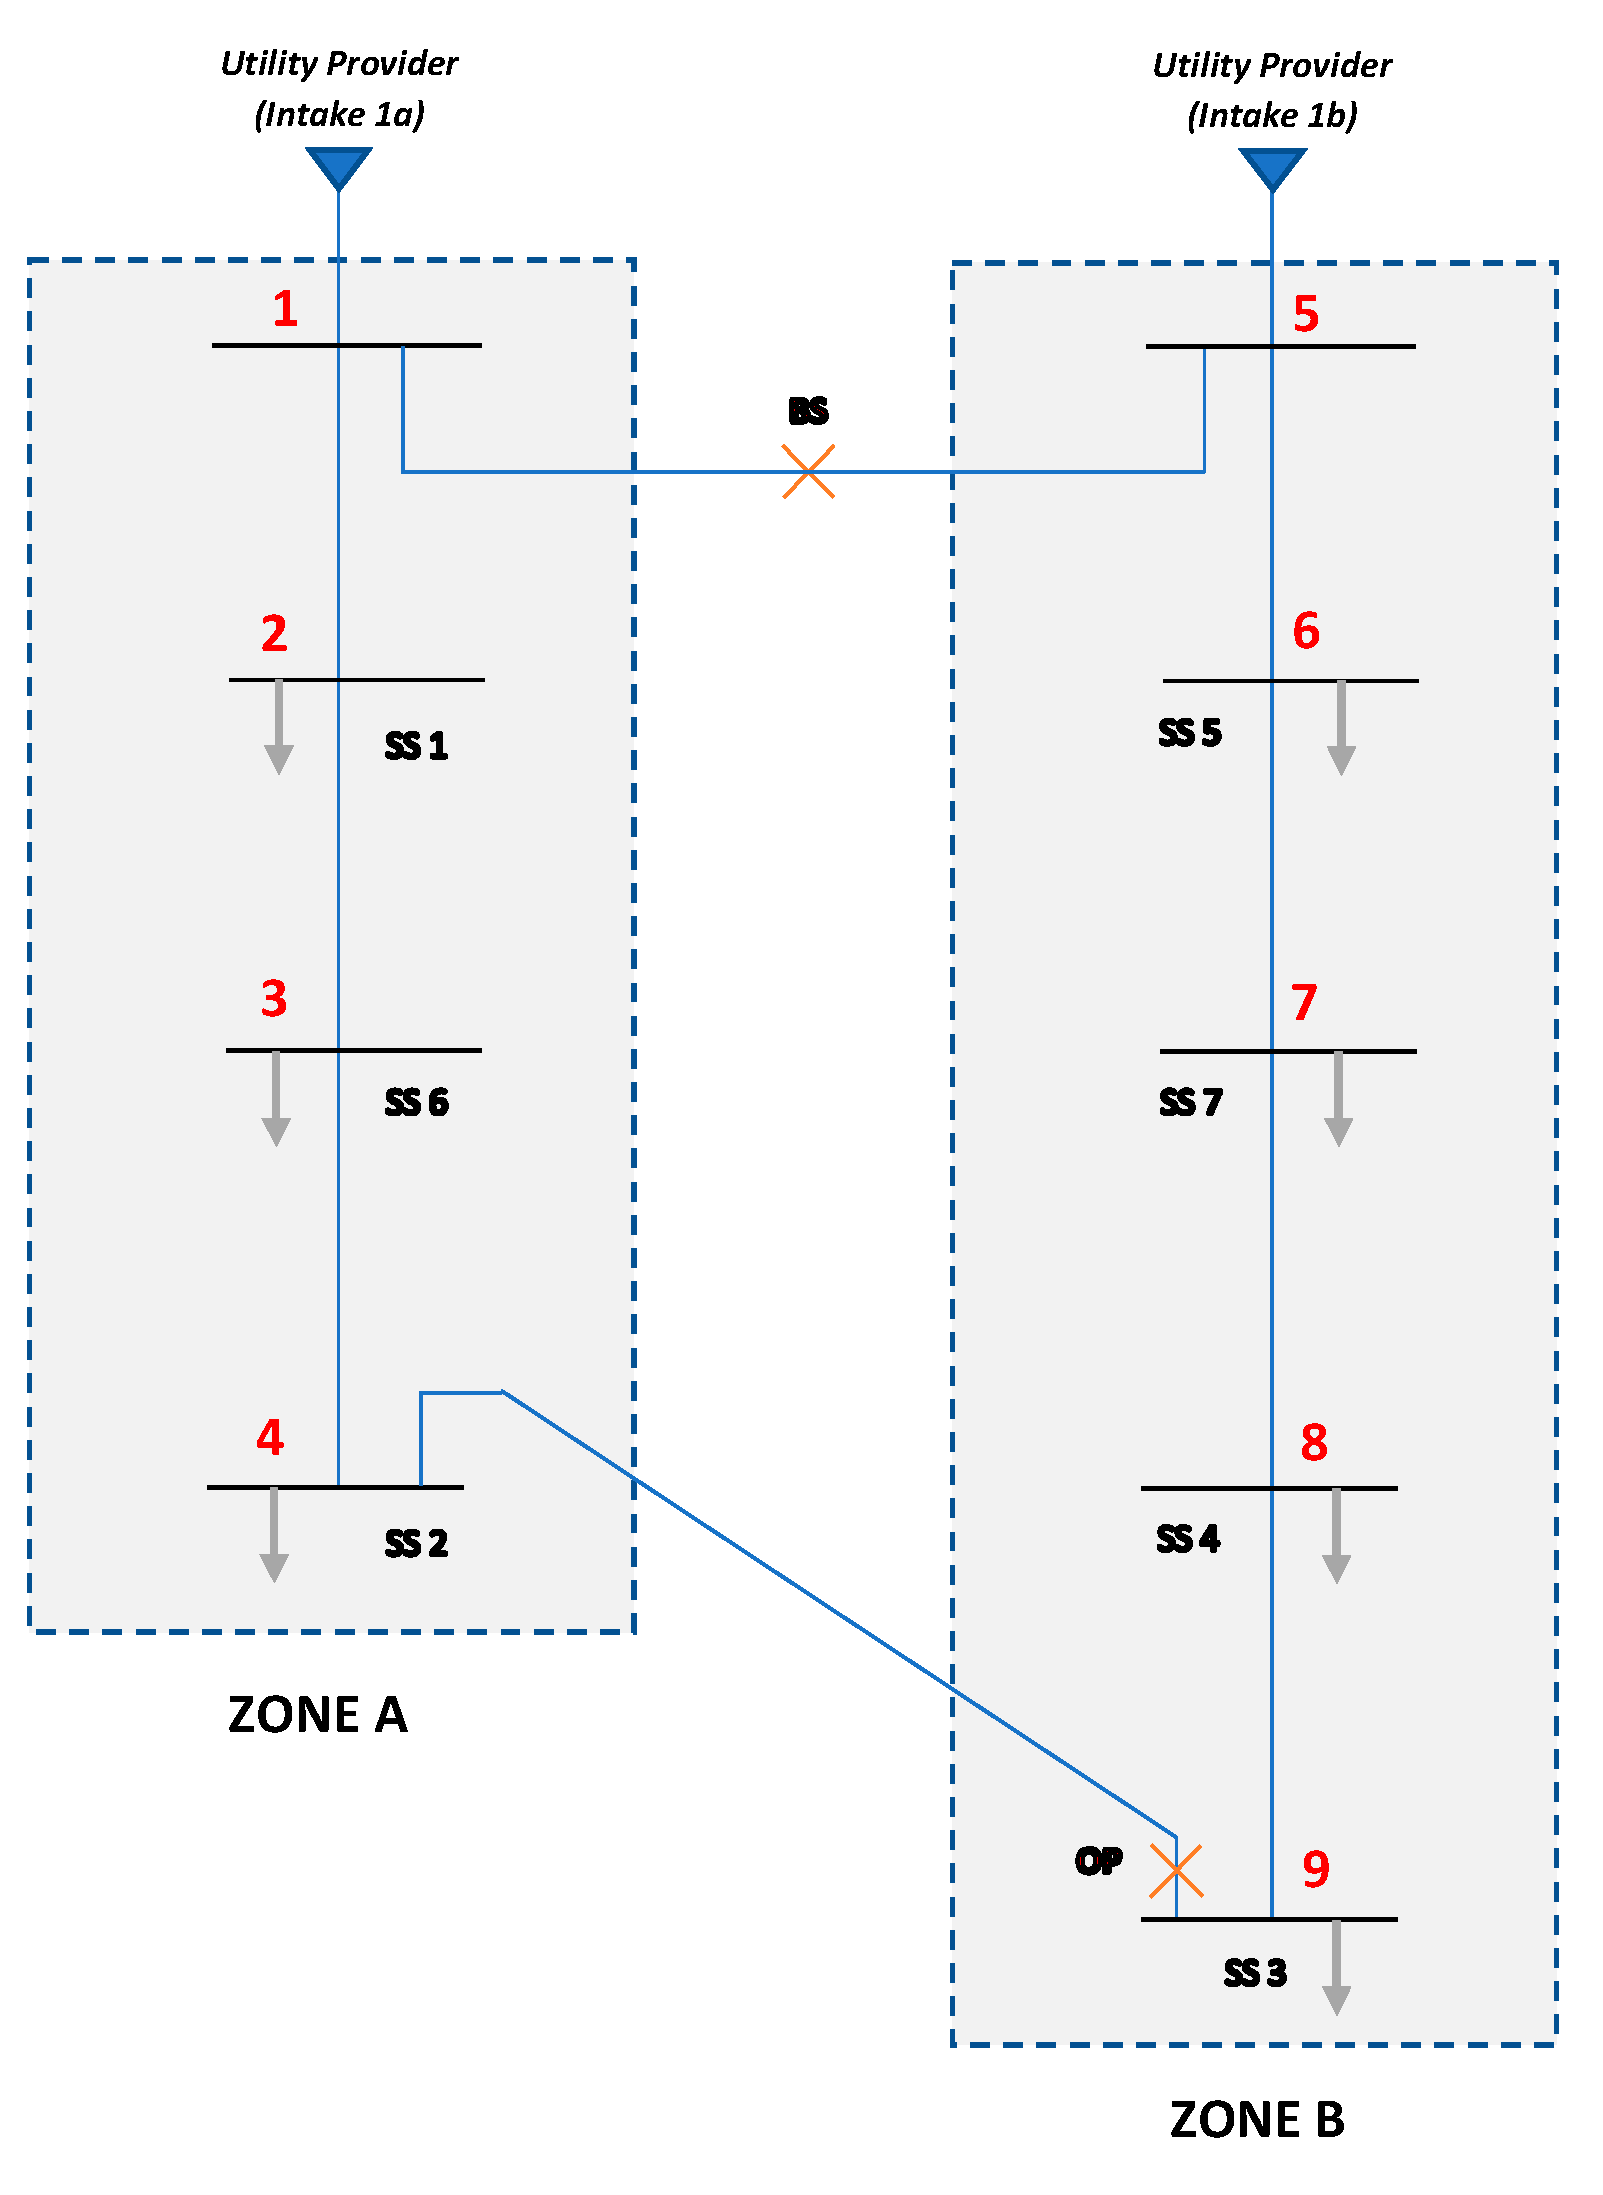
| Zone | Zone A | Zone B | |||||||
|---|---|---|---|---|---|---|---|---|---|
| Input Data | Bus 1 | Bus 2 | Bus 3 | Bus 4 | Bus 5 | Bus 6 | Bus 7 | Bus 8 | Bus 9 |
| Voltage (kV) | 10.9 | 10.9 | 10.9 | 10.9 | 10.9 | 10.9 | 10.9 | 10.9 | 10.9 |
| P Load (kW) | 710 | 187 | 151.5 | 199 | 1190 | 465 | 457 | 283 | 189 |
| Q Load (kVAR) | 22.5 | 98 | 77 | 125 | 20.9 | 130 | 175 | 137 | 63 |
| Resistance, R (Ω/km) | Bus 1–2 = 0.049, Bus 2–3 = 0.0196, Bus 3–4 = 0.0294 | Bus 5–6 = 0.0294, Bus 6–7 = 0.0196, Bus 7–8 = 0.049, Bus 8–9 = 0.0294 | |||||||
| Reactance, X (Ω/km) | Bus 1–2 = 0.0377, Bus 2–3 = 0.0151, Bus 3–4 = 0.0226 | Bus 11–12 = 0.0377, Bus 12–13 = 0.0528, Bus 13–14 = 0.0377 | |||||||
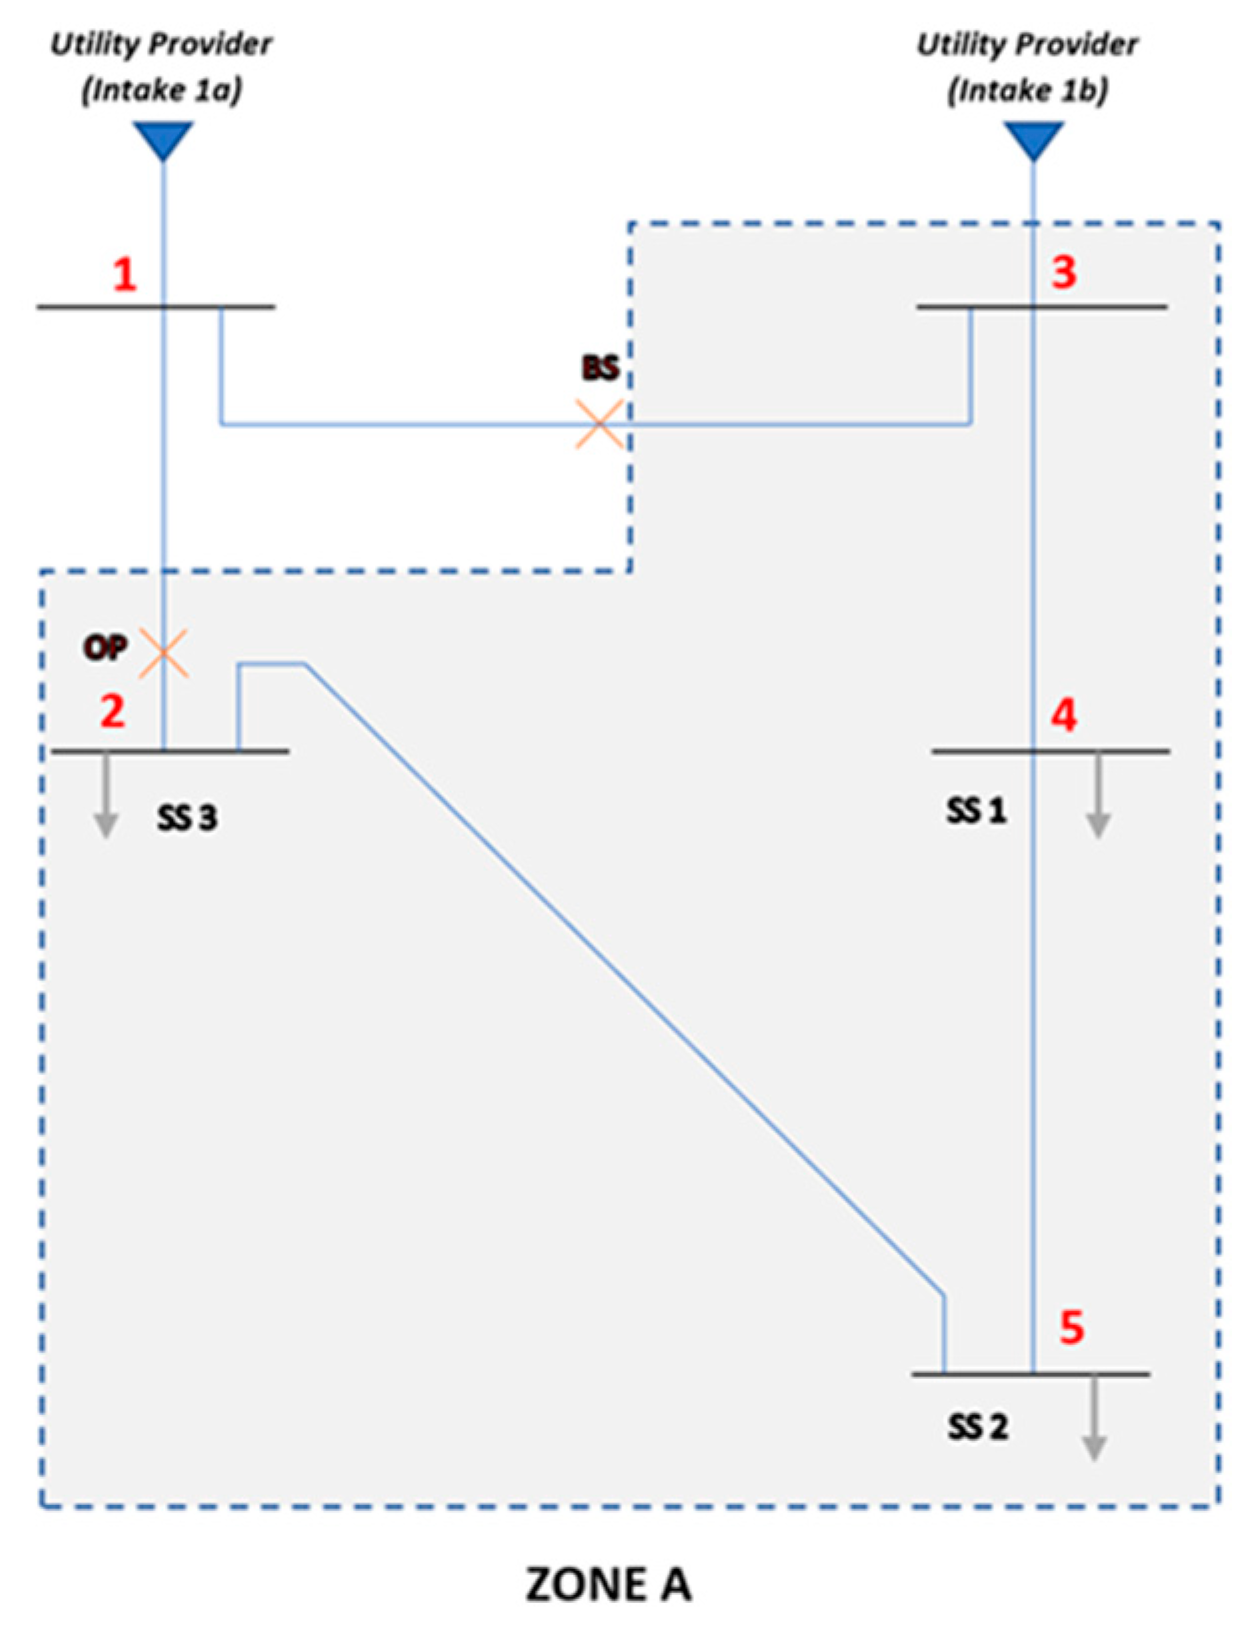
| Zone | Zone A | |||
|---|---|---|---|---|
| Input Data | Bus 2 | Bus 3 | Bus 4 | Bus 5 |
| Voltage (kV) | 10.9 | 10.9 | 10.9 | 10.9 |
| P Load (kW) | 217 | 50 | 479 | 485 |
| Q Load (kVAR) | 33.42 | 10 | 181 | 198 |
| Resistance, R (Ω/km) | Bus 3–4 = 0.0196, Bus 4–5 = 0.0686, Bus 5–2 = 0.049 | |||
| Reactance, X (Ω/km) | Bus 3–4 = 0.0151, Bus 4–5 = 0.0528, Bus 5–2 = 0.0377 | |||
References
- Manaf, N.H.A. Quality management in Malaysian public health care. Int. J. Health Care Qual. Assur. Inc. Leadsher. Health Serv. 2005, 18, 204–216. [Google Scholar] [CrossRef]
- Aripin, S. Healing architecture: A study on the physical aspects of healing environment in hospital design. In Proceedings of the 40th Annual Conference of the Architectural Science Association (ANZAScA), Adelaide, South Australia, 22–25 November 2006; Australia Shannon, S., Soebarto, V., Williamson, T., Eds.; Architectural Science Association (ASA): Adelaide, Australia, 2006; pp. 342–349. [Google Scholar]
- Amran, M.E.; Muhtazaruddin, M.N. Assessment of renewable distributed generation in green building rating system for public hospital. Int. J. Eng. Technol. 2018, 7, 40–45. [Google Scholar] [CrossRef]
- Wu, Z. Evaluation of A Sustainable Hospital Design Based on its Social and Environmental Outcomes; Cornell University: Ithaca, NY, USA, 2011. [Google Scholar]
- Tenaga Nasional Berhad (TNB). Electricity Supply Application Handbook, 3rd ed.; Nur-Johan Sdn Bhd: Kuala Lumpur, Malaysia, 2011. [Google Scholar]
- Energy Commission. Electricity Supply Act 1990—Efficient Management of Electrical Energy Regulation 2008; Government of Malaysia: Kuala Lumpur, Malaysia, 2008; pp. 1–28.
- Sahamir, S.R.; Zakaria, R. Green Assessment Criteria for Public Hospital Building Development in Malaysia. Procedia Environ. Sci. 2014, 20, 106–115. [Google Scholar] [CrossRef] [Green Version]
- Economic Planning Unit (EPU). Eleventh Malaysia Plan 2016–2020: Anchoring Growth on People; Prime Minister’s Department: Putrajaya, Malaysia, 2015. [Google Scholar]
- Petinrin, J.O.; Shaaban, M. Renewable energy for continuous energy sustainability in Malaysia. Renew. Sustain. Energy Rev. 2015, 50, 967–981. [Google Scholar] [CrossRef]
- Hashim, H.; Ho, W.S. Renewable energy policies and initiatives for a sustainable energy future in Malaysia. Renew. Sustain. Energy Rev. 2011, 15, 4780–4787. [Google Scholar] [CrossRef]
- Muhammad-Sukki, F.; Abu-Bakar, S.H.; Munir, A.B.; Mohd Yasin, S.H.; Ramirez-Iniguez, R.; McMeekin, S.G.; Stewart, B.G.; Abdul Rahim, R. Progress of feed-in tariff in Malaysia: A year after. Energy Policy 2014, 67, 618–625. [Google Scholar] [CrossRef]
- Ministry of Energy, Science, Technology, Environment & Climate Change (MESTECC). Initiatif MESTECC 2019; MESTECC: Kuala Lumpur, Malaysia, 2019.
- Sustainable Energy Development Authority (SEDA) Malaysia. National Renewable Energy Policy. Available online: http://www.seda.gov.my/policies/national-renewable-energy-policy-and-action-plan-2009/ (accessed on 3 June 2019).
- Shi, L.; Chew, M.Y.L. A review on sustainable design of renewable energy systems. Renew. Sustain. Energy Rev. 2012, 16, 192–207. [Google Scholar] [CrossRef]
- GhaffarianHoseini, A.; Dahlan, N.D.; Berardi, U.; GhaffarianHoseini, A.; Makaremi, N.; GhaffarianHoseini, M. Sustainable energy performances of green buildings: A review of current theories, implementations and challenges. Renew. Sustain. Energy Rev. 2013, 25, 1–17. [Google Scholar] [CrossRef]
- Muhtazaruddin, M.N.B.; Tuyen, N.D.; Fujita, G.; Jamian, J.J. Bin Optimal Distributed Generation and capacitor coordination for power loss minimization. In Proceedings of the 2014 IEEE PES T&D Conference and Exposition, Chicago, IL, USA, 14–17 April 2014; pp. 1–5. [Google Scholar]
- Quezada, V.H.M.; Abbad, J.R.; Roman, T.G.S. Assessment of energy distribution losses for increasing penetration of distributed generation. IEEE Trans. Power Syst. 2006, 21, 533–540. [Google Scholar]
- Ho, W.S.; Hashim, H.; Hassim, M.H.; Muis, Z.A.; Shamsuddin, N.L.M. Design of distributed energy system through Electric System Cascade Analysis (ESCA). Appl. Energy 2012, 99, 309–315. [Google Scholar] [CrossRef]
- Savić, A.; Đurišić, Ž. Optimal sizing and location of SVC devices for improvement of voltage profile in distribution network with dispersed photovoltaic and wind power plants. Appl. Energy 2014, 134, 114–124. [Google Scholar] [CrossRef]
- Hossain, M.J.; Saha, T.K.; Mithulananthan, N.; Pota, H.R. Robust control strategy for PV system integration in distribution systems. Appl. Energy 2012, 99, 355–362. [Google Scholar] [CrossRef] [Green Version]
- Van Thong, V.; Driesen, J.; Belmans, R. Interconnection of distributed generators and their influences on power system. Int. Energy J. 2005, 6, 3127–3138. [Google Scholar]
- Mahdad, B.; Srairi, K. Adaptive differential search algorithm for optimal location of distributed generation in the presence of SVC for power loss reduction in distribution system. Eng. Sci. Technol. Int. J. 2016, 19, 1266–1282. [Google Scholar] [CrossRef] [Green Version]
- Wu, Y.-K.; Lin, J.-H.; Lin, H.-J. Standards and guidelines for grid-connected photovoltaic generation systems: A review and comparison. IEEE Trans. Ind. Appl. 2017, 53, 3205–3216. [Google Scholar] [CrossRef]
- Zaini, N.H.; Ab. Kadir, M.Z.A.; Mohd Radzi, M.A.; Izadi, M.; Azis, N.; Ahmad, N.I.; Mohd Nasir, M.S. Lightning surge analysis on a large scale grid-connected solar photovoltaic system. Energies 2017, 10, 2149. [Google Scholar] [CrossRef]
- Tan, R.H.G.; Chow, T.L. A Comparative Study of Feed in Tariff and Net Metering for UCSI University North Wing Campus with 100 kW Solar Photovoltaic System. Energy Procedia 2016, 100, 86–91. [Google Scholar] [CrossRef] [Green Version]
- Oh, T.H.; Hasanuzzaman, M.; Selvaraj, J.; Teo, S.C.; Chua, S.C. Energy policy and alternative energy in Malaysia: Issues and challenges for sustainable growth—An update. Renew. Sustain. Energy Rev. 2018, 81, 3021–3031. [Google Scholar] [CrossRef]
- Christoforidis, G.C.; Chrysochos, A.; Papagiannis, G.; Hatzipanayi, M.; Georghiou, G.E. Promoting PV energy through net metering optimization: The PV-NET project. In Proceedings of the IEEE 2013 International Conference on Renewable Energy Research and Applications (ICRERA), Madrid, Spain, 20–23 October 2013; pp. 1117–1122. [Google Scholar]
- Poullikkas, A.; Kourtis, G.; Hadjipaschalis, I. A review of net metering mechanism for electricity renewable energy sources. Int. J. Energy Environ. 2013, 4, 975–1002. [Google Scholar]
- Prasad, M.; Munch, S. State-level renewable electricity policies and reductions in carbon emissions. Energy Policy 2012, 45, 237–242. [Google Scholar] [CrossRef]
- Van der Veen, R.A.C.; De Vries, L.J. The impact of microgeneration upon the Dutch balancing market. Energy Policy 2009, 37, 2788–2797. [Google Scholar] [CrossRef] [Green Version]
- Poullikkas, A.; Kourtis, G.; Hadjipaschalis, I. An overview of the EU Member States support schemes for the promotion of renewable energy sources. Int. J. Energy Environ. 2012, 3, 553–566. [Google Scholar]
- Huijben, J.C.C.M.; Verbong, G.P.J. Breakthrough without subsidies? PV business model experiments in the Netherlands. Energy Policy 2013, 56, 362–370. [Google Scholar] [CrossRef]
- Elkinton, M.R.; McGowan, J.G.; Manwell, J.F. Wind power systems for zero net energy housing in the United States. Renew. Energy 2009, 34, 1270–1278. [Google Scholar] [CrossRef]
- Vachon, S.; Menz, F.C. The role of social, political, and economic interests in promoting state green electricity policies. Environ. Sci. Policy 2006, 9, 652–662. [Google Scholar] [CrossRef]
- Zahedi, A. A review on feed-in tariff in Australia, what it is now and what it should be. Renew. Sustain. Energy Rev. 2010, 14, 3252–3255. [Google Scholar] [CrossRef]
- Zhao, J.; Mazhari, E.; Celik, N.; Son, Y.-J. Hybrid agent-based simulation for policy evaluation of solar power generation systems. Simul. Model. Pract. Theory 2011, 19, 2189–2205. [Google Scholar] [CrossRef]
- Prindle, W.; Koszalka, M. Succeeding in the Smart Grid Space by Listening to Customers and Stakeholders. In Smart Grid: Integrating Renewable, Distributed & Efficient Energy; Sioshansi, F.P., Ed.; Academic Press: Oxford, UK, 2012; pp. 343–369. [Google Scholar]
- Greacen, C.; Plevin, R.; Greacen, C.S. Thai power: Net metering comes to Thailand. Refocus 2003, 4, 34–37. [Google Scholar] [CrossRef]
- EC Electricity Supply Act 1990 [Act 447]. Guidelines for Solar Photovoltaic Installation on Net Energy Metering Scheme; GP/ST/ No. 4/2016 (Pin. 2019); Government of Malaysia: Putrajaya, Malaysia, 2019; pp. 1–231.
- Tenaga Nasional Berhad (TNB). Technical Guideline for Connection of Indirect Solar PV Power Generation for Net Energy Metering Chapter; TNB: Kuala Lumpur, Malaysia, 2019. [Google Scholar]
- Bawan, E.K. Distributed Generation Impact on Power System Case Study: Losses and Voltage Profile. In Proceedings of the IEEE 2012 22nd Australasian Universities Power Engineering Conference (AUPEC), Bali, Indonesia, 26–29 September 2012; pp. 1–6. [Google Scholar]
- Griffin, T.; Tomsovic, K.; Secrest, D.; Law, A. Placement of dispersed generation systems for reduced losses. In Proceedings of the 33rd Annual Hawaii International Conference on System Sciences, IEEE Computer Society, Maui, HI, USA, 7 January 2000; Volume 1, p. 9. [Google Scholar]
- Hung, D.Q.; Mithulananthan, N. Multiple distributed generator placement in primary distribution networks for loss reduction. IEEE Trans. Ind. Electron. 2013, 60, 1700–1708. [Google Scholar] [CrossRef]
- Parizad, A.; Khazali, A.; Kalantar, M. Optimal placement of distributed generation with sensitivity factors considering voltage stability and losses indices. In Proceedings of the IEEE 2010 18th Iranian Conference on Electrical Engineering, Isfahan, Iran, 11–13 May 2010; pp. 848–855. [Google Scholar]
- Acharya, N.; Mahat, P.; Mithulananthan, N. An analytical approach for DG allocation in primary distribution network. Int. J. Electr. Power Energy Syst. 2006, 28, 669–678. [Google Scholar] [CrossRef]
- Ramesh, L.; Chowdhury, S.P.; Chowdhury, S.; Natarajan, A.A.; Gaunt, C.T. Minimization of power loss in distribution networks by different techniques. Int. J. Electr. Comput. Eng. 2009, 3, 661–667. [Google Scholar]
- González-Longatt, F.M. Impact of Distributed Generation over Power Losses on Distribution System. In Proceedings of the 9th International Conference on Electrical Power Quality and Utilization, Barcelona, Spain, 2007; pp. 1–6. [Google Scholar]
- Singh, D.; Singh, D.; Verma, K.S. Multiobjective optimization for DG planning with load models. IEEE Trans. Power Syst. 2009, 24, 427–436. [Google Scholar] [CrossRef]
- Abdi, S.; Afshar, K. Application of IPSO-Monte Carlo for optimal distributed generation allocation and sizing. Int. J. Electr. Power Energy Syst. 2013, 44, 786–797. [Google Scholar] [CrossRef]
- Rama Prabha, D.; Jayabarathi, T. Optimal placement and sizing of multiple distributed generating units in distribution networks by invasive weed optimization algorithm. Ain Shams Eng. J. 2016, 7, 683–694. [Google Scholar] [CrossRef] [Green Version]
- Krueasuk, W.; Ongsakul, W. Optimal Placement of Distributed Generation Using Particle Swarm Optimization. In Proceedings of the Australasian Universities Power Engineering Conference (AUPEC 2006, Melbourne, Australia, 10–13 December 2006; pp. 1–6. [Google Scholar]
- Sa’ed, J.A.; Jubran, M.K.; Favuzza, S.; Massaro, F. Reassessment of Voltage Stability for Distribution Networks in Presence of DG. In Proceedings of the 2016 IEEE 16th International Conference on Environment and Electrical Engineering (EEEIC), Florence, Italy, 7–10 June 2016; pp. 1–5. [Google Scholar]
- Hien, N.C.; Mithulananthan, N.; Bansal, R.C. Location and sizing of distributed generation units for loadabilty enhancement in primary feeder. IEEE Syst. J. 2013, 7, 797–806. [Google Scholar] [CrossRef]
- Syahputra, R.; Robandi, I.; Ashari, M. Performance improvement of radial distribution network with distributed generation integration using extended particle swarm optimization algorithm. Int. Rev. Electr. Eng. 2015, 10, 293–304. [Google Scholar] [CrossRef]
- Wu, Y.-K.; Ye, G.-T.; Shaaban, M. Analysis of impact of integration of large PV generation capacity and optimization of PV capacity: Case studies in Taiwan. IEEE Trans. Ind. Appl. 2016, 52, 4535–4548. [Google Scholar] [CrossRef]
- Katiraei, F.; Aguero, J. Solar PV integration challenges. IEEE Power Energy Mag. 2011, 9, 62–71. [Google Scholar] [CrossRef]
- Demirok, E.; Sera, D.; Teodorescu, R.; Rodriguez, P.; Borup, U. Clustered PV inverters in LV networks: An overview of impacts and comparison of voltage control strategies. In Proceedings of the 2009 IEEE Electrical Power & Energy Conference (EPEC), Montreal, QC, Canada, 22–23 October 2009; pp. 1–6. [Google Scholar]
- Liew, S.N.; Strbac, G. Maximising penetration of wind generation in existing distribution networks. IEE Proc.-Gener. Transm. Distrib. 2002, 149, 256. [Google Scholar] [CrossRef]
- Bonfiglio, A.; Brignone, M.; Delfino, F.; Procopio, R. Optimal control and operation of grid-connected photovoltaic production units for voltage support in medium-voltage networks. IEEE Trans. Sustain. Energy 2014, 5, 254–263. [Google Scholar] [CrossRef]
- Agalgaonkar, Y.P.; Pal, B.C.; Jabr, R.A. Distribution voltage control considering the impact of PV generation on tap changers and autonomous regulators. IEEE Trans. Power Syst. 2014, 29, 182–192. [Google Scholar] [CrossRef]
- Farivar, M.; Neal, R.; Clarke, C.; Low, S. Optimal Inverter VAR Control in Distribution Systems with High PV Penetration. In Proceedings of the 2012 IEEE Power and Energy Society General Meeting, San Diego, CA, USA, 22–26 July 2012; pp. 1–7. [Google Scholar]
- Yeh, H.-G.; Gayme, D.F.; Low, S.H. Adaptive VAR control for distribution circuits with photovoltaic generators. IEEE Trans. Power Syst. 2012, 27, 1656–1663. [Google Scholar] [CrossRef]
- Nguyen, T.T.; Truong, A.V.; Phung, T.A. A novel method based on adaptive cuckoo search for optimal network reconfiguration and distributed generation allocation in distribution network. Int. J. Electr. Power Energy Syst. 2016, 78, 801–815. [Google Scholar] [CrossRef]
- Rao, R.S.; Ravindra, K.; Satish, K.; Narasimham, S.V.L. Power loss minimization in distribution system using network reconfiguration in the presence of distributed generation. IEEE Trans. Power Syst. 2013, 28, 317–325. [Google Scholar] [CrossRef]
- Sultana, U.; Khairuddin, A.B.; Aman, M.M.; Mokhtar, A.S.; Zareen, N. A review of optimum DG placement based on minimization of power losses and voltage stability enhancement of distribution system. Renew. Sustain. Energy Rev. 2016, 63, 363–378. [Google Scholar] [CrossRef]
- Usman, M.; Coppo, M.; Bignucolo, F.; Turri, R. Losses management strategies in active distribution networks: A review. Electr. Power Syst. Res. 2018, 163, 116–132. [Google Scholar] [CrossRef]
- Moghimi, S.; Mat, S.; Lim, C.H.; Zaharim, A.; Sopian, K. Building Energy Index (BEI) in Large Scale Hospital: Case Study of Malaysia. In Proceedings of the 4th WSEAS International Conference on Engineering Mechanics, Structures, Engineering Geology (EMESEG’11) and 2nd International Conference on Geography and Geology 2011, Corfu Island, Greece, 14–17 July 2011; pp. 167–170. [Google Scholar]
- Iqbal, F.; Khan, M.T.; Siddiqui, A.S. Optimal placement of DG and DSTATCOM for loss reduction and voltage profile improvement. Alex. Eng. J. 2018, 57, 755–765. [Google Scholar] [CrossRef]
- Popovich, B.; Hjemvick, J.A.; Faylo, S.E.; Lathrop, T.M. Transfer switch controller employing active inductive load control and transfer switch including the same. U.S. Patent No. 7,948,117, 24 May 2011. [Google Scholar]
- Moradi, M.H.; Abedini, M. A combination of genetic algorithm and particle swarm optimization for optimal DG location and sizing in distribution systems. Int. J. Electr. Power Energy Syst. 2012, 34, 66–74. [Google Scholar] [CrossRef]
- Dixit, M.; Kundu, P.; Jariwala, H.R. Optimal Placement of PV array in Distribution System for Power Loss Minimization Considering Feeder Reconfiguration. In Proceedings of the 2016 IEEE 16th International Conference on Environment and Electrical Engineering (EEEIC), Florence, Italy, 7–10 June 2016; pp. 1–6. [Google Scholar]
- Baños, R.; Manzano-Agugliaro, F.; Montoya, F.G.; Gil, C.; Alcayde, A.; Gómez, J. Optimization methods applied to renewable and sustainable energy: A review. Renew. Sustain. Energy Rev. 2011, 15, 1753–1766. [Google Scholar] [CrossRef]
- Bhowmik, C.; Bhowmik, S.; Ray, A.; Pandey, K.M. Optimal green energy planning for sustainable development: A review. Renew. Sustain. Energy Rev. 2017, 71, 796–813. [Google Scholar] [CrossRef]
- Yasin, Z.M.; Rahman, T.K.A.; Musirin, I.; Rahim, S.R.A. Optimal Sizing of Distributed Generation by Using Quantum-Inspired Evolutionary Programming. In Proceedings of the 2010 4th International Power Engineering and Optimization Conference (PEOCO), Shah Alam, Malaysia, 23–24 June 2010; pp. 468–473. [Google Scholar]
- Muhtazaruddin, M.N.B.; Jamian, J.J.B.; Fujita, G. Determination of optimal output power and location for multiple distributed generation sources simultaneously by using artificial bee colony. IEEJ Trans. Electr. Electron. Eng. 2014, 9, 351–359. [Google Scholar] [CrossRef]
- Muttaqi, K.M.; Le, A.D.T.; Aghaei, J.; Mahboubi-Moghaddam, E.; Negnevitsky, M.; Ledwich, G. Optimizing distributed generation parameters through economic feasibility assessment. Appl. Energy 2016, 165, 893–903. [Google Scholar] [CrossRef]
- Kansal, S.; Sai, B.B.R.; Tyagi, B.; Kumar, V. Optimal placement of distributed generation in distribution networks. Int. J. Eng. Sci. Technol. 2011, 3, 47–55. [Google Scholar] [CrossRef]
- Zareiegovar, G.; Fesaghandis, R.R.; Azad, M.J. Optimal DG Location and Sizing in Distribution System to Minimize Losses, Improve Voltage Stability, and Voltage Profile. In Proceedings of the IEEE 17th Conference on Electrical Power Distribution, Tehran, Iran, 2–3 May 2012; pp. 1–6. [Google Scholar]
- El-Zonkoly, A.M. Optimal placement of multi-distributed generation units including different load models using particle swarm optimisation. IET Gener. Transm. Distrib. 2011, 5, 760. [Google Scholar] [CrossRef]
- Kansal, S.; Kumar, V.; Tyagi, B. Optimal placement of different type of DG sources in distribution networks. Int. J. Electr. Power Energy Syst. 2013, 53, 752–760. [Google Scholar] [CrossRef]
- Merei, G.; Berger, C.; Sauer, D.U. Optimization of an off-grid hybrid PV–Wind–Diesel system with different battery technologies using genetic algorithm. Sol. Energy 2013, 97, 460–473. [Google Scholar] [CrossRef]
- Yang, H.; Wei, Z.; Chengzhi, L. Optimal design and techno-economic analysis of a hybrid solar–wind power generation system. Appl. Energy 2009, 86, 163–169. [Google Scholar] [CrossRef]
- Yang, H.; Zhou, W.; Lu, L.; Fang, Z. Optimal sizing method for stand-alone hybrid solar–wind system with LPSP technology by using genetic algorithm. Sol. Energy 2008, 82, 354–367. [Google Scholar] [CrossRef]
- Koutroulis, E.; Kolokotsa, D.; Potirakis, A.; Kalaitzakis, K. Methodology for optimal sizing of stand-alone photovoltaic/wind-generator systems using genetic algorithms. Sol. Energy 2006, 80, 1072–1088. [Google Scholar] [CrossRef]
- Koutroulis, E.; Kolokotsa, D. Design optimization of desalination systems power-supplied by PV and W/G energy sources. Desalination 2010, 258, 171–181. [Google Scholar] [CrossRef]
- Ould Bilal, B.; Sambou, V.; Ndiaye, P.A.; Kébé, C.M.F.; Ndongo, M. Optimal design of a hybrid solar–wind-battery system using the minimization of the annualized cost system and the minimization of the loss of power supply probability (LPSP). Renew. Energy 2010, 35, 2388–2390. [Google Scholar] [CrossRef]
- Biswas, S.; Goswami, S.K.; Chatterjee, A. Optimum distributed generation placement with voltage sag effect minimization. Energy Convers. Manag. 2012, 53, 163–174. [Google Scholar] [CrossRef]
- Hussain, I.; Roy, A.K. Optimal Distributed Generation Allocation in Distribution Systems Employing Modified Artificial Bee Colony Algorithm to Reduce Losses and Improve Voltage Profile. In Proceedings of the IEEE-International Conferences on Advances in Engineering, Science and Management (ICAESM), 2012, Nagapattinam, Tamil Nadu, India, 30–31 March 2012; pp. 565–570. [Google Scholar]
- Karaboga, D.; Basturk, B. Artificial Bee Colony (ABC) Optimization Algorithm for Solving Constrained Optimization Problems. In Foundations of Fuzzy Logic and Soft Computing; Melin, P., Castillo, O., Aguilar, L.T., Kacprzyk, J., Pedrycz, W., Eds.; Springer: Berlin/Heidelberg, Germany, 2007; pp. 789–798. [Google Scholar]
- Lalitha, M.P.; Reddy, N.S.; Reddy, V.C.V. Optimal DG placement for maximum loss reduction in radial distribution system using ABC algorithm. Int. J. Rev. Comput. 2009, 3, 44–52. [Google Scholar]
- Sohi, M.F.; Shirdel, M.; Javidaneh, A. Applying BCO Algorithm to Solve the Optimal DG Placement and Sizing Problem. In Proceedings of the IEEE 2011 5th International Power Engineering and Optimization Conference, Shah Alam, Selangor, Malaysia, 6–7 June 2011; pp. 71–76. [Google Scholar]
- Abu-Mouti, F.S.; El-Hawary, M.E. Optimal distributed generation allocation and sizing in distribution systems via artificial bee colony algorithm. IEEE Trans. Power Deliv. 2011, 26, 2090–2101. [Google Scholar] [CrossRef]
- Nabil Muhtazaruddin, M.; Jamian, J.J.; Nguyen, D.; Jalalludin, N.A.; Fujita, G. Optimal capacitor placement and sizing via artificial bee colony. Int. J. Smart Grid Clean Energy 2014, 3, 200–206. [Google Scholar] [CrossRef]
- Muhtazaruddin, M.N.; Bani, N.A.; Mohd Aris, S.A.; Abd. Jalil, S.Z.; Mad Kaidi, H.; Abd Fatah, A.Y.; Jamian, J.J.; Muhammad-Sukki, F.; Abu-Bakar, S.H. Distribution power loss minimization via distributed generation, capacitor and network reconfiguration. Indones. J. Electr. Eng. Comput. Sci. 2017, 5, 488–495. [Google Scholar] [CrossRef]
- Rama Prabha, D.; Jayabarathi, T.; Umamageswari, R.; Saranya, S. Optimal location and sizing of distributed generation unit using intelligent water drop algorithm. Sustain. Energy Technol. Assess. 2015, 11, 106–113. [Google Scholar] [CrossRef]
- Box, H.C. Set Lighting Technician’s Handbook: Film Lighting Equipment, Practice, and Electrical Distribution; Routledge: London, UK, 2013; ISBN 9780240810751. [Google Scholar]
- Aman, M.M.; Jasmon, G.B.; Bakar, A.H.A.; Mokhlis, H. A new approach for optimum DG placement and sizing based on voltage stability maximization and minimization of power losses. Energy Convers. Manag. 2013, 70, 202–210. [Google Scholar] [CrossRef]


| Standards | Title |
|---|---|
| MS 1837–2010 | Installation of grid-connected photovoltaic (PV) system |
| MS IEC 62305 1-4:2007 | Protection against lightning Part 1: General principles Part 2: Risk management Part 3: Physical damage to structures and life hazard Part 4: Electrical and electronic systems within structures |
| MS IEC 60364-7-712:2007 | Electrical installations of building—Part 7-712: requirements for special installations or locations—solar photovoltaic (PV) power supply systems |
| MS IEC 61836:2010 | Solar photovoltaic energy system—terms, definitions, and symbols |
| MS IEC 62446:12 | Grid-connected photovoltaic systems—minimum requirements for system documentation, commissioning tests and inspection |
| MS IEC 61727:2010 | Photovoltaic (PV) systems—characteristics of the utility interface |
| MS IEC 61730 1-2:2010 | Photovoltaic (PV) module safety qualification Part 1: Requirements for construction Part 2: Requirements for testing |
| MS IEC 60904 1-3:2013 | Photovoltaic devices Part 1: Measurement of photovoltaic current-voltage characteristics Part 2: Requirements for reference solar devices Part 3: Measurement principles for terrestrial photovoltaic (PV) solar devices with reference spectral irradiance data |
| MS IEC 61215:2006 | Crystalline silicon terrestrial photovoltaic (PV) modules—design qualification and type approval |
| MS IEC 61646:2010 | Thin-film terrestrial photovoltaic (PV) modules—design qualification and type approval |
| MS IEC 62109-1:2011 | Safety of power converters for use in photovoltaic power systems—Part 1: General requirements |
| Load Type | α | β |
|---|---|---|
| Constant Impedance (CI) | 2 | 2 |
| Constant Current (CC) | 1 | 1 |
| Constant Power (CP) | 0 | 0 |
| Commercial (C) | 1.51 | 3.4 |
| Residential (R) | 0.92 | 4.04 |
| Industrial (I) | 0.18 | 6 |
| DG Type | Type Description | Example |
|---|---|---|
| 1st Type | DG is capable of injecting both real and reactive power | Synchronous generators |
| 2nd Type | DG is capable of injecting real power but consuming reactive power | Induction generators such as wind generation farms |
| 3rd Type | DG is capable of injecting real power only | PV, micro turbines, and fuel cells integrated to the main grid with converters/inverters |
| 4th Type | DG is capable of injecting reactive power only | Synchronous compensators |
| Fixed | Optimal | Description |
|---|---|---|
| Case | ||
| 1 | Determine variation of PV-DG optimal location and size simultaneously (between Case 1 to 14 based on simulation result) | Original test system without PV-DG (initial loss/base case) |
| 2 | Determine PV-DG size (15% from MD), optimal location, and loss reduction | |
| 3 | Determine PV-DG size (20% from MD), optimal location, and loss reduction | |
| 4 | Determine PV-DG size (25% from MD), optimal location, and loss reduction | |
| 5 | Determine PV-DG size (30% from MD), optimal location, and loss reduction | |
| 6 | Determine PV-DG size (35% from MD), optimal location, and loss reduction | |
| 7 | Determine PV-DG size (40% from MD), optimal location, and loss reduction | |
| 8 | Determine PV-DG size (45% from MD), optimal location, and loss reduction | |
| 9 | Determine PV-DG size (50% from MD), optimal location, and loss reduction | |
| 10 | Determine PV-DG size (55% from MD), optimal location, and loss reduction | |
| 11 | Determine PV-DG size (60% from MD), optimal location, and loss reduction | |
| 12 | Determine PV-DG size (65% from MD), optimal location, and loss reduction | |
| 13 | Determine PV-DG size (70% from MD), optimal location, and loss reduction | |
| 14 | Determine PV-DG size (75% from MD), optimal location, and loss reduction | |
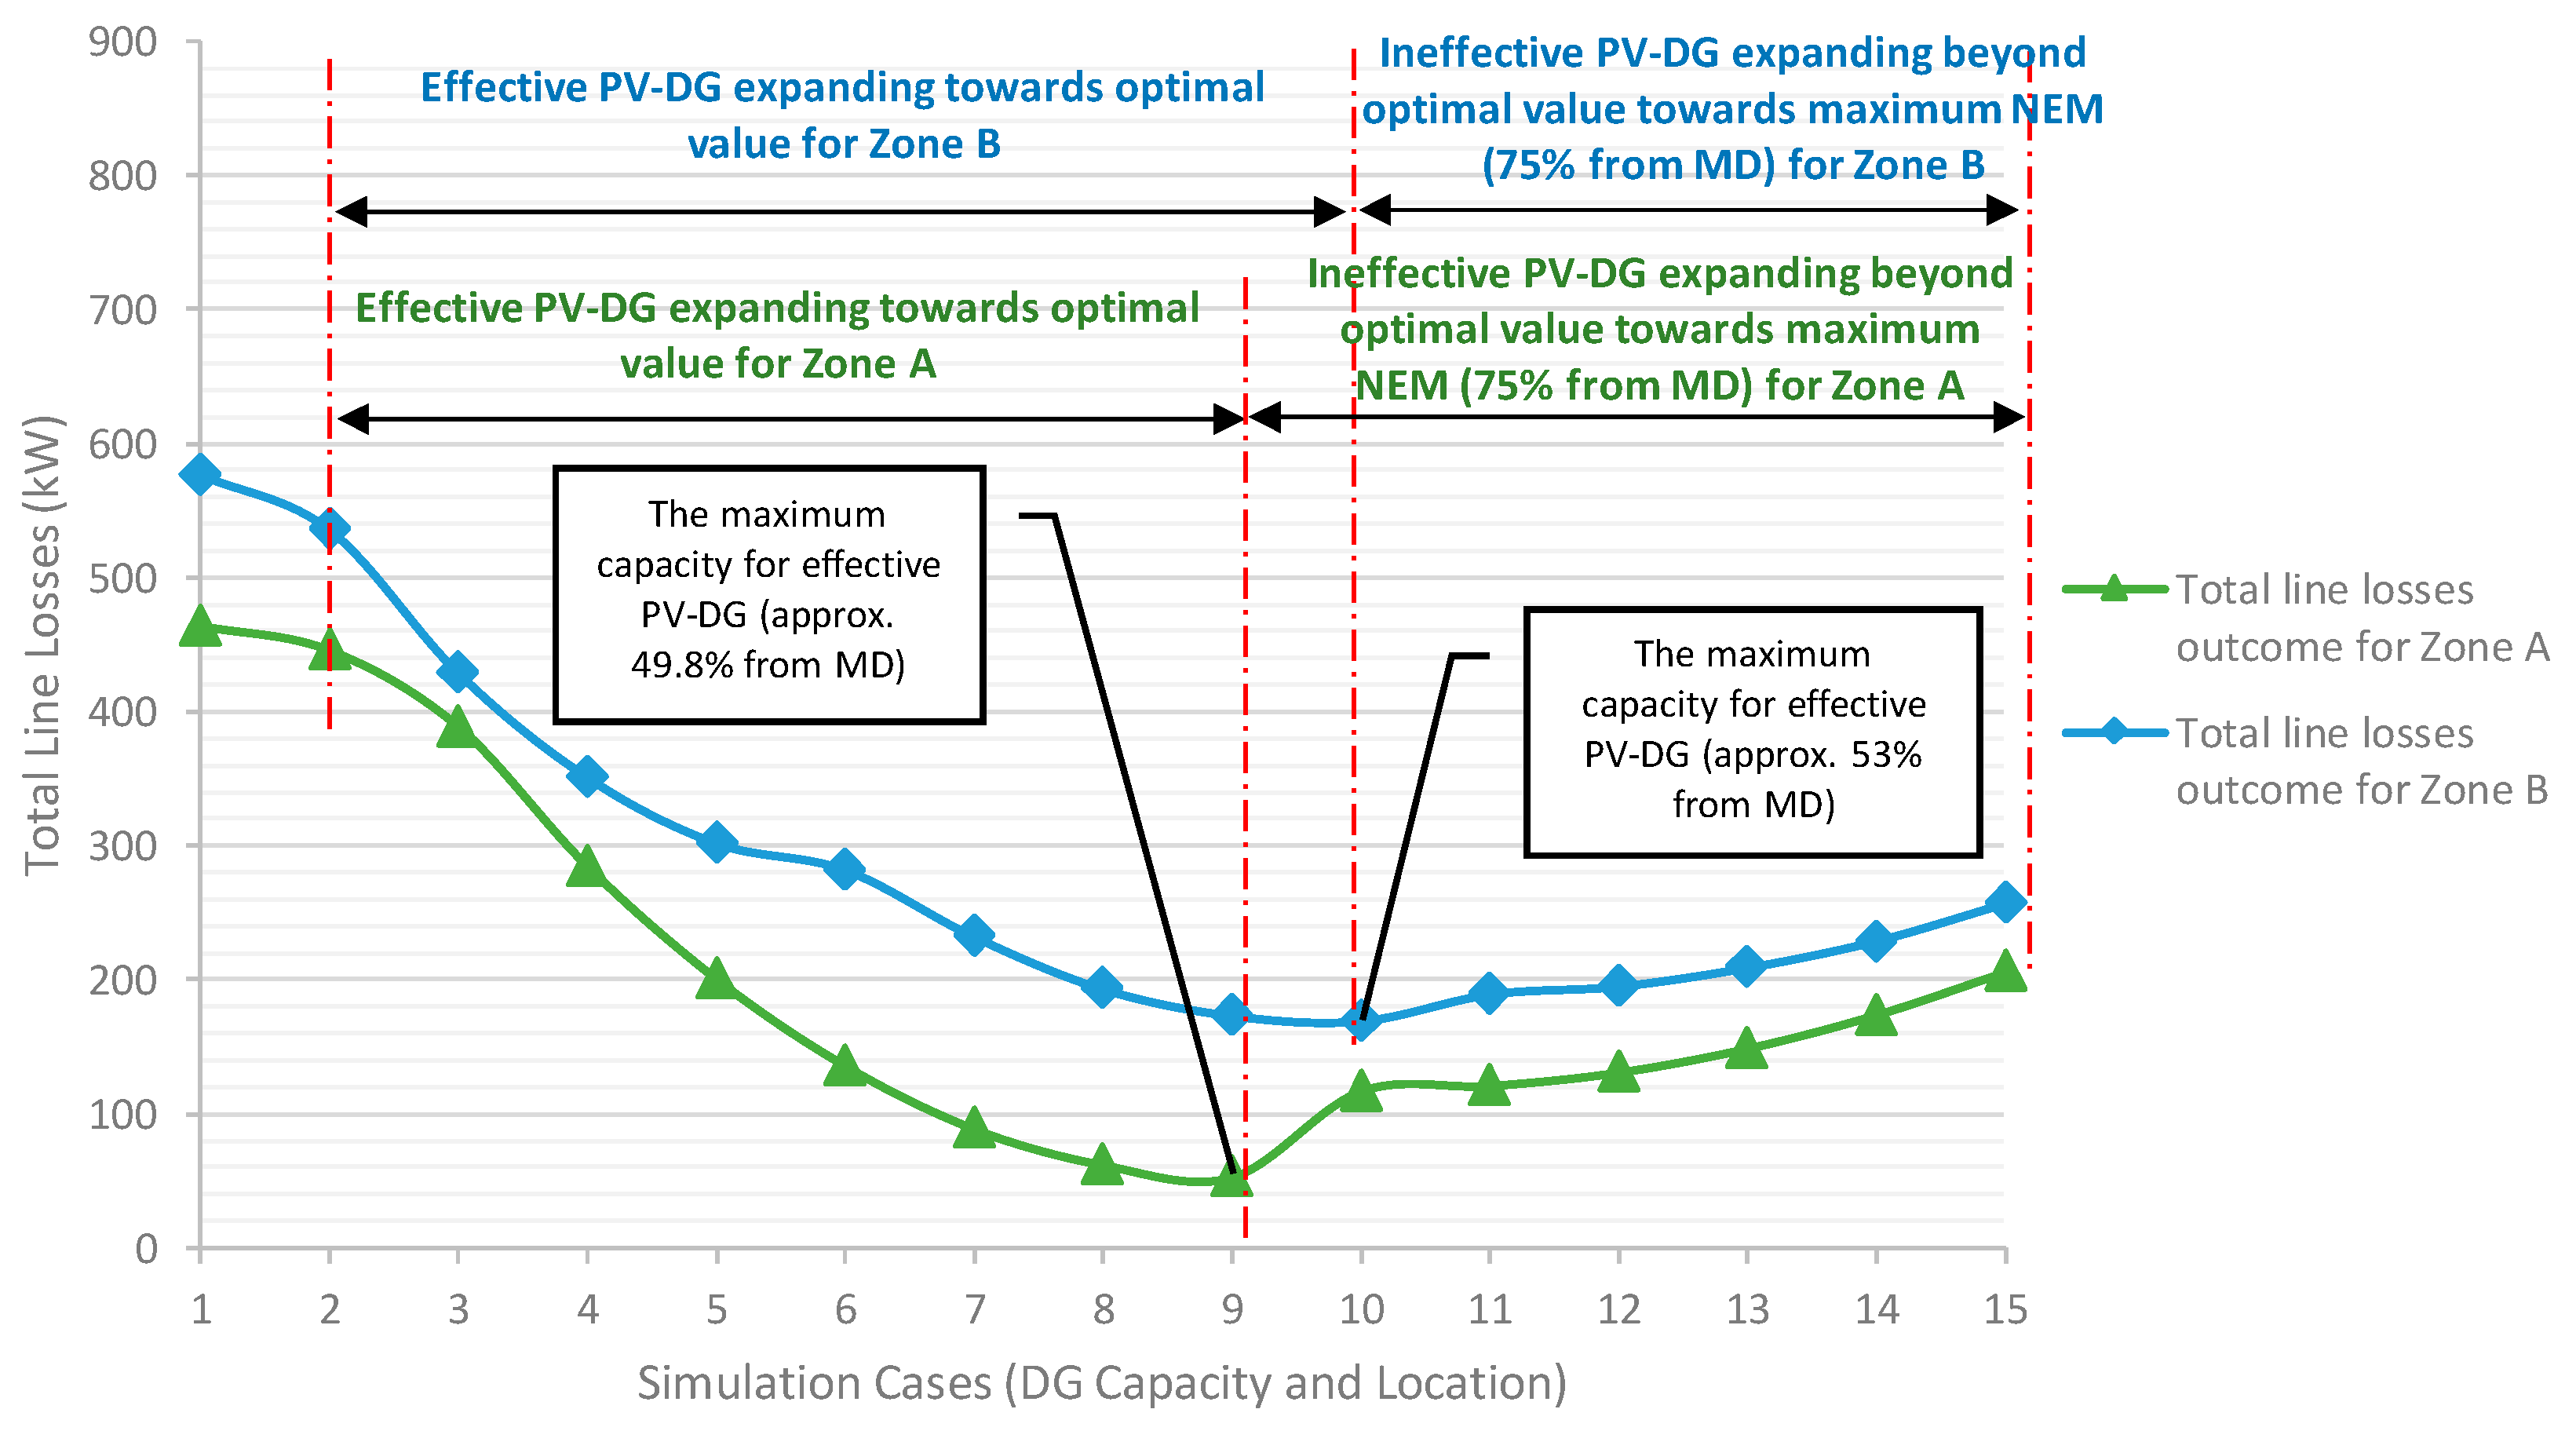
| National Level Hospital. | Case | 1 | 2 | 3 | 4 | 5 | 6 | 7 | 8 | Optimal | 9 | 10 | 11 | 12 | 13 | 14 | |
| ZONE A (MD = 1097 kW) | Optimal PV-DG in kWp (Bus) | - | 165 (bus 5) | 219 (bus 7) | 274 (bus 4) | 329 (bus 7) | 384 (bus 4) | 439 (bus 7) | 494 (bus 4) | 546 (bus 7) | 549 (bus 7) | 603 (bus 7) | 658 (bus 7) | 713 (bus 7) | 768 (bus 7) | 823 (bus 7) | |
| Total Line Losses (kW) | ABC | 464 | 446 | 389 | 285 | 201 | 136 | 89 | 62 | 53 | 117 | 121 | 131 | 149 | 174 | 206 | |
| PSO | 465 | - | - | - | - | - | - | - | 53 | - | - | - | - | - | - | ||
| Voltage (P.U) | V min | 0.9992 | 0.9992 | 0.9999 | 0.9992 | 0.9992 | 0.9992 | 0.9992 | 0.9999 | - | - | - | - | - | - | ||
| V max | 1 | 1 | 1 | 1 | 1 | 1 | 1 | 1 | - | - | - | - | - | - | |||
| ∑ kW Losses | 0.00000 | 0.00000 | 0.00000 | 0.00000 | 0.00000 | 0.00000 | 0.00000 | 0.00000 | - | - | - | - | - | - | |||
| Total loss reduction (%) | - | 4% | 16% | 39% | 57% | 71% | 81% | 87% | 89% | 75% | 74% | 72% | 68% | 63% | 56% | ||
| Case | 1 | 2 | 3 | 4 | 5 | 6 | 7 | 8 | 9 | Optimal | 10 | 11 | 12 | 13 | 14 | ||
| ZONE B (MD = 1590 kW) | Optimal PV-DG in kWp (Bus) | - | 239 (bus 14) | 318 (bus 14) | 398 (bus 14) | 477 (bus 14) | 557 (bus 14) | 636 (bus 13) | 716 (bus 13) | 795 (bus 13) | 840 (bus 13) | 875 (bus 13) | 954 (bus 13) | 1034 (bus 13) | 1113 (bus 13) | 1193 (bus 13) | |
| Total Power Losses (kW) | ABC | 577 | 536 | 429 | 351 | 302 | 282 | 232 | 193 | 173 | 169 | 189 | 195 | 209 | 229 | 257 | |
| PSO | 577 | - | - | - | - | - | - | - | - | 170 | - | - | - | - | - | ||
| Voltage (P.U) | V min | 0.9995 | 0.9995 | 0.9995 | 0.9992 | 0.9995 | 0.9995 | 0.9995 | 0.9995 | 0.9995 | - | - | - | - | - | ||
| V max | 1 | 1 | 1 | 1 | 1 | 1 | 1 | 1 | 1 | - | - | - | - | - | |||
| ∑ kW Losses | 0.00000 | 0.00000 | 0.00000 | 0.00000 | 0.00000 | 0.00000 | 0.00000 | 0.00000 | 0.00000 | - | - | - | - | - | |||
| Total loss reduction (%) | - | 7% | 26% | 39% | 48% | 51% | 60% | 67% | 70% | 71% | 67% | 66% | 64% | 60% | 55% | ||
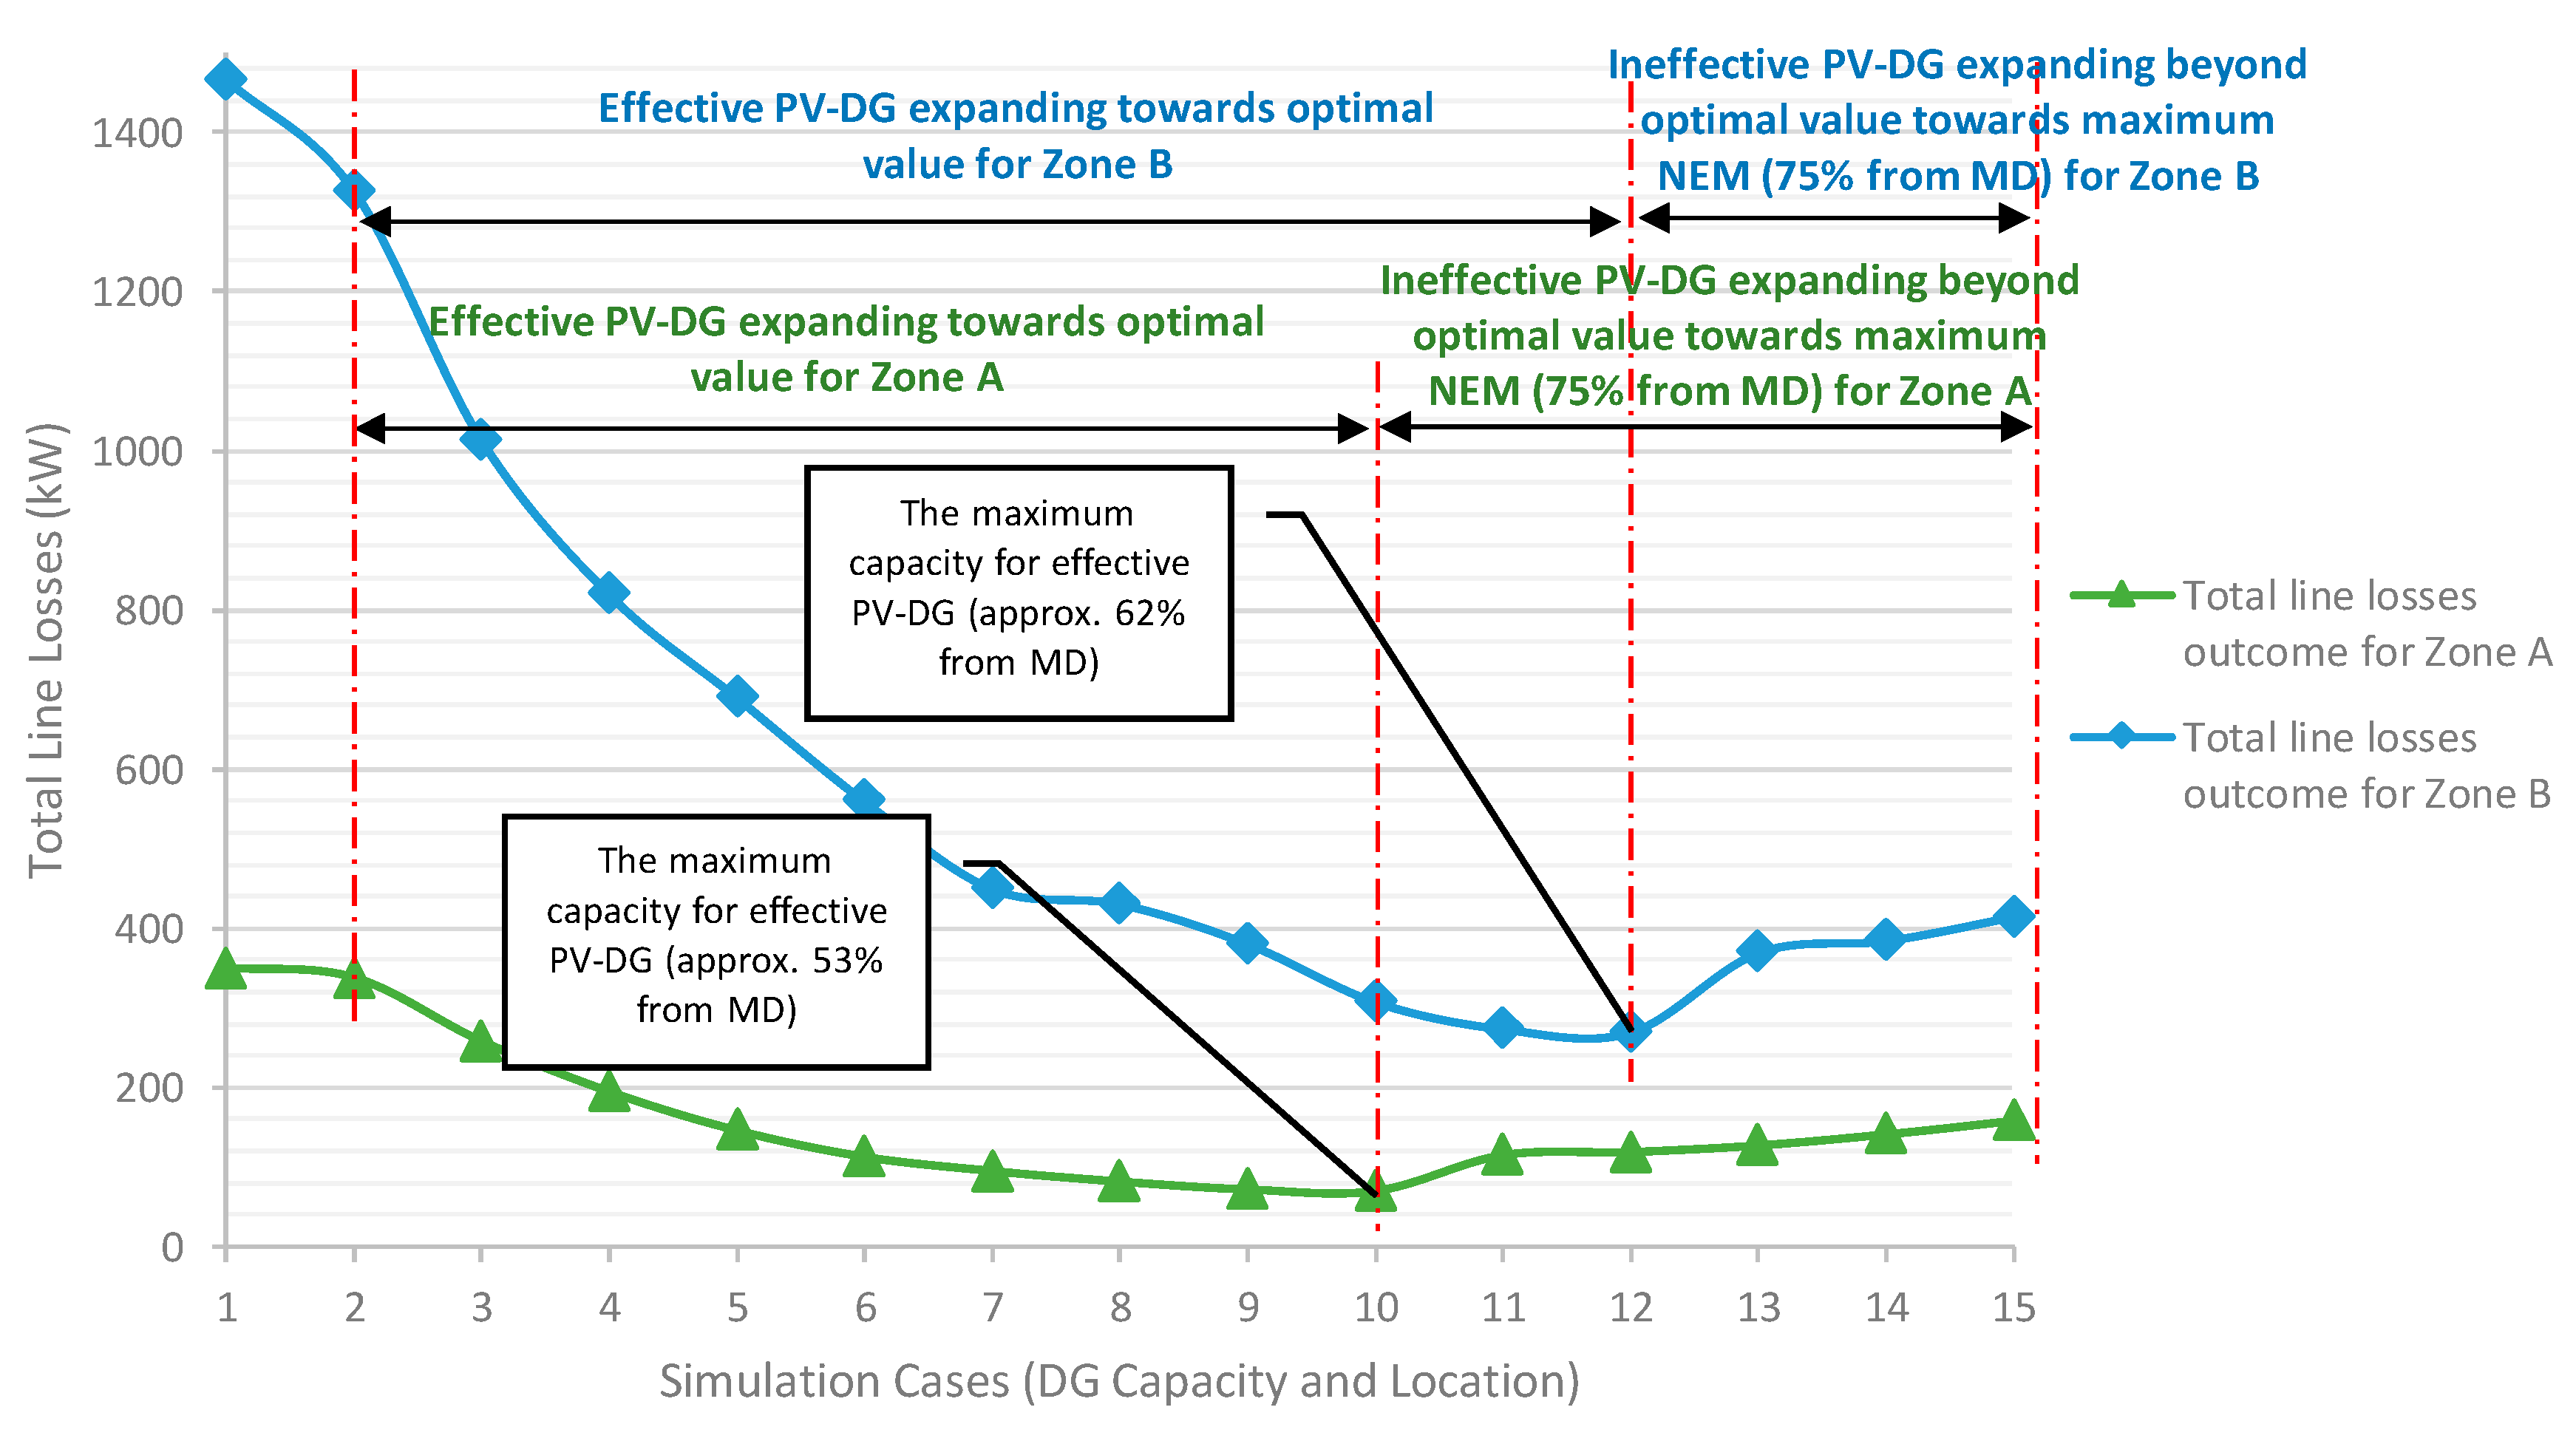
| State Level Hospital. | Case | 1 | 2 | 3 | 4 | 5 | 6 | 7 | 8 | 9 | Optimal | 10 | 11 | 12 | 13 | 14 | |
| ZONE A (MD = 1248 kW) | Optimal PV-DG in kWp (Bus) | - | 187 (bus 4) | 250 (bus 4) | 312 (bus 4) | 374 (bus 4) | 437 (bus 4) | 499 (bus 4) | 562 (bus 4) | 624 (bus 3) | 654 (bus 3) | 686 (bus 3) | 749 (bus 3) | 811 (bus 3) | 874 (bus 3) | 936 (bus 3) | |
| Total Power Losses (kW) | ABC | 350 | 338 | 258 | 195 | 146 | 113 | 95 | 82 | 72 | 70 | 115 | 119 | 127 | 141 | 158 | |
| PSO | 350 | - | - | - | - | - | - | - | - | 70 | - | - | - | - | - | ||
| Voltage (P.U) | V min | 0.9999 | 0.9992 | 0.9999 | 0.9992 | 0.9992 | 0.9992 | 0.9992 | 0.9999 | 0.9999 | - | - | - | - | - | ||
| V max | 1 | 1 | 1 | 1 | 1 | 1 | 1 | 1 | 1 | - | - | - | - | - | |||
| ∑ kW Losses | 0.00000 | 0.00000 | 0.00000 | 0.00000 | 0.00000 | 0.00000 | 0.00000 | 0.00000 | 0.00000 | - | - | - | - | - | |||
| Percentage reduction (%) | - | 3% | 26% | 44% | 58% | 68% | 73% | 77% | 79% | 80% | 67% | 66% | 64% | 60% | 55% | ||
| Case | 1 | 2 | 3 | 4 | 5 | 6 | 7 | 8 | 9 | 10 | 11 | Optimal | 12 | 13 | 14 | ||
| ZONE B (2584 kW) | Optimal PV-DG in kWp (Bus) | - | 388 (bus 9) | 517 (bus 9) | 646 (bus 9) | 775 (bus 9) | 904 (bus 8) | 1034 (bus 8) | 1163 (bus 8) | 1292 (bus 7) | 1421 (bus 7) | 1550 (bus 7) | 1600 (bus 7) | 1680 (bus 7) | 1809 (bus 7) | 1938 (bus 7) | |
| Total Power Losses (kW) | ABC | 1466 | 1327 | 1014 | 820 | 690 | 560 | 450 | 431 | 381 | 308 | 274 | 270 | 370 | 385 | 415 | |
| PSO | 1466 | - | - | - | - | - | - | - | - | - | - | 271 | - | - | - | ||
| Voltage (P.U) | V min | 0.9997 | 0.9995 | 0.9995 | 0.9992 | 0.9995 | 0.9995 | 0.9995 | 0.9995 | 0.9995 | 0.9995 | 0.9997 | - | - | - | ||
| V max | 1 | 1 | 1 | 1 | 1 | 1 | 1 | 1 | 1 | 1 | 1 | - | - | - | |||
| ∑ kW Losses | 0.00000 | 0.00000 | 0.00000 | 0.00000 | 0.00000 | 0.00000 | 0.00000 | 0.00000 | 0.00000 | 0.00000 | 0.00000 | - | - | - | |||
| Percentage reduction (%) | - | 9% | 31% | 44% | 53% | 62% | 69% | 71% | 74% | 79% | 81% | 82% | 75% | 74% | 72% | ||
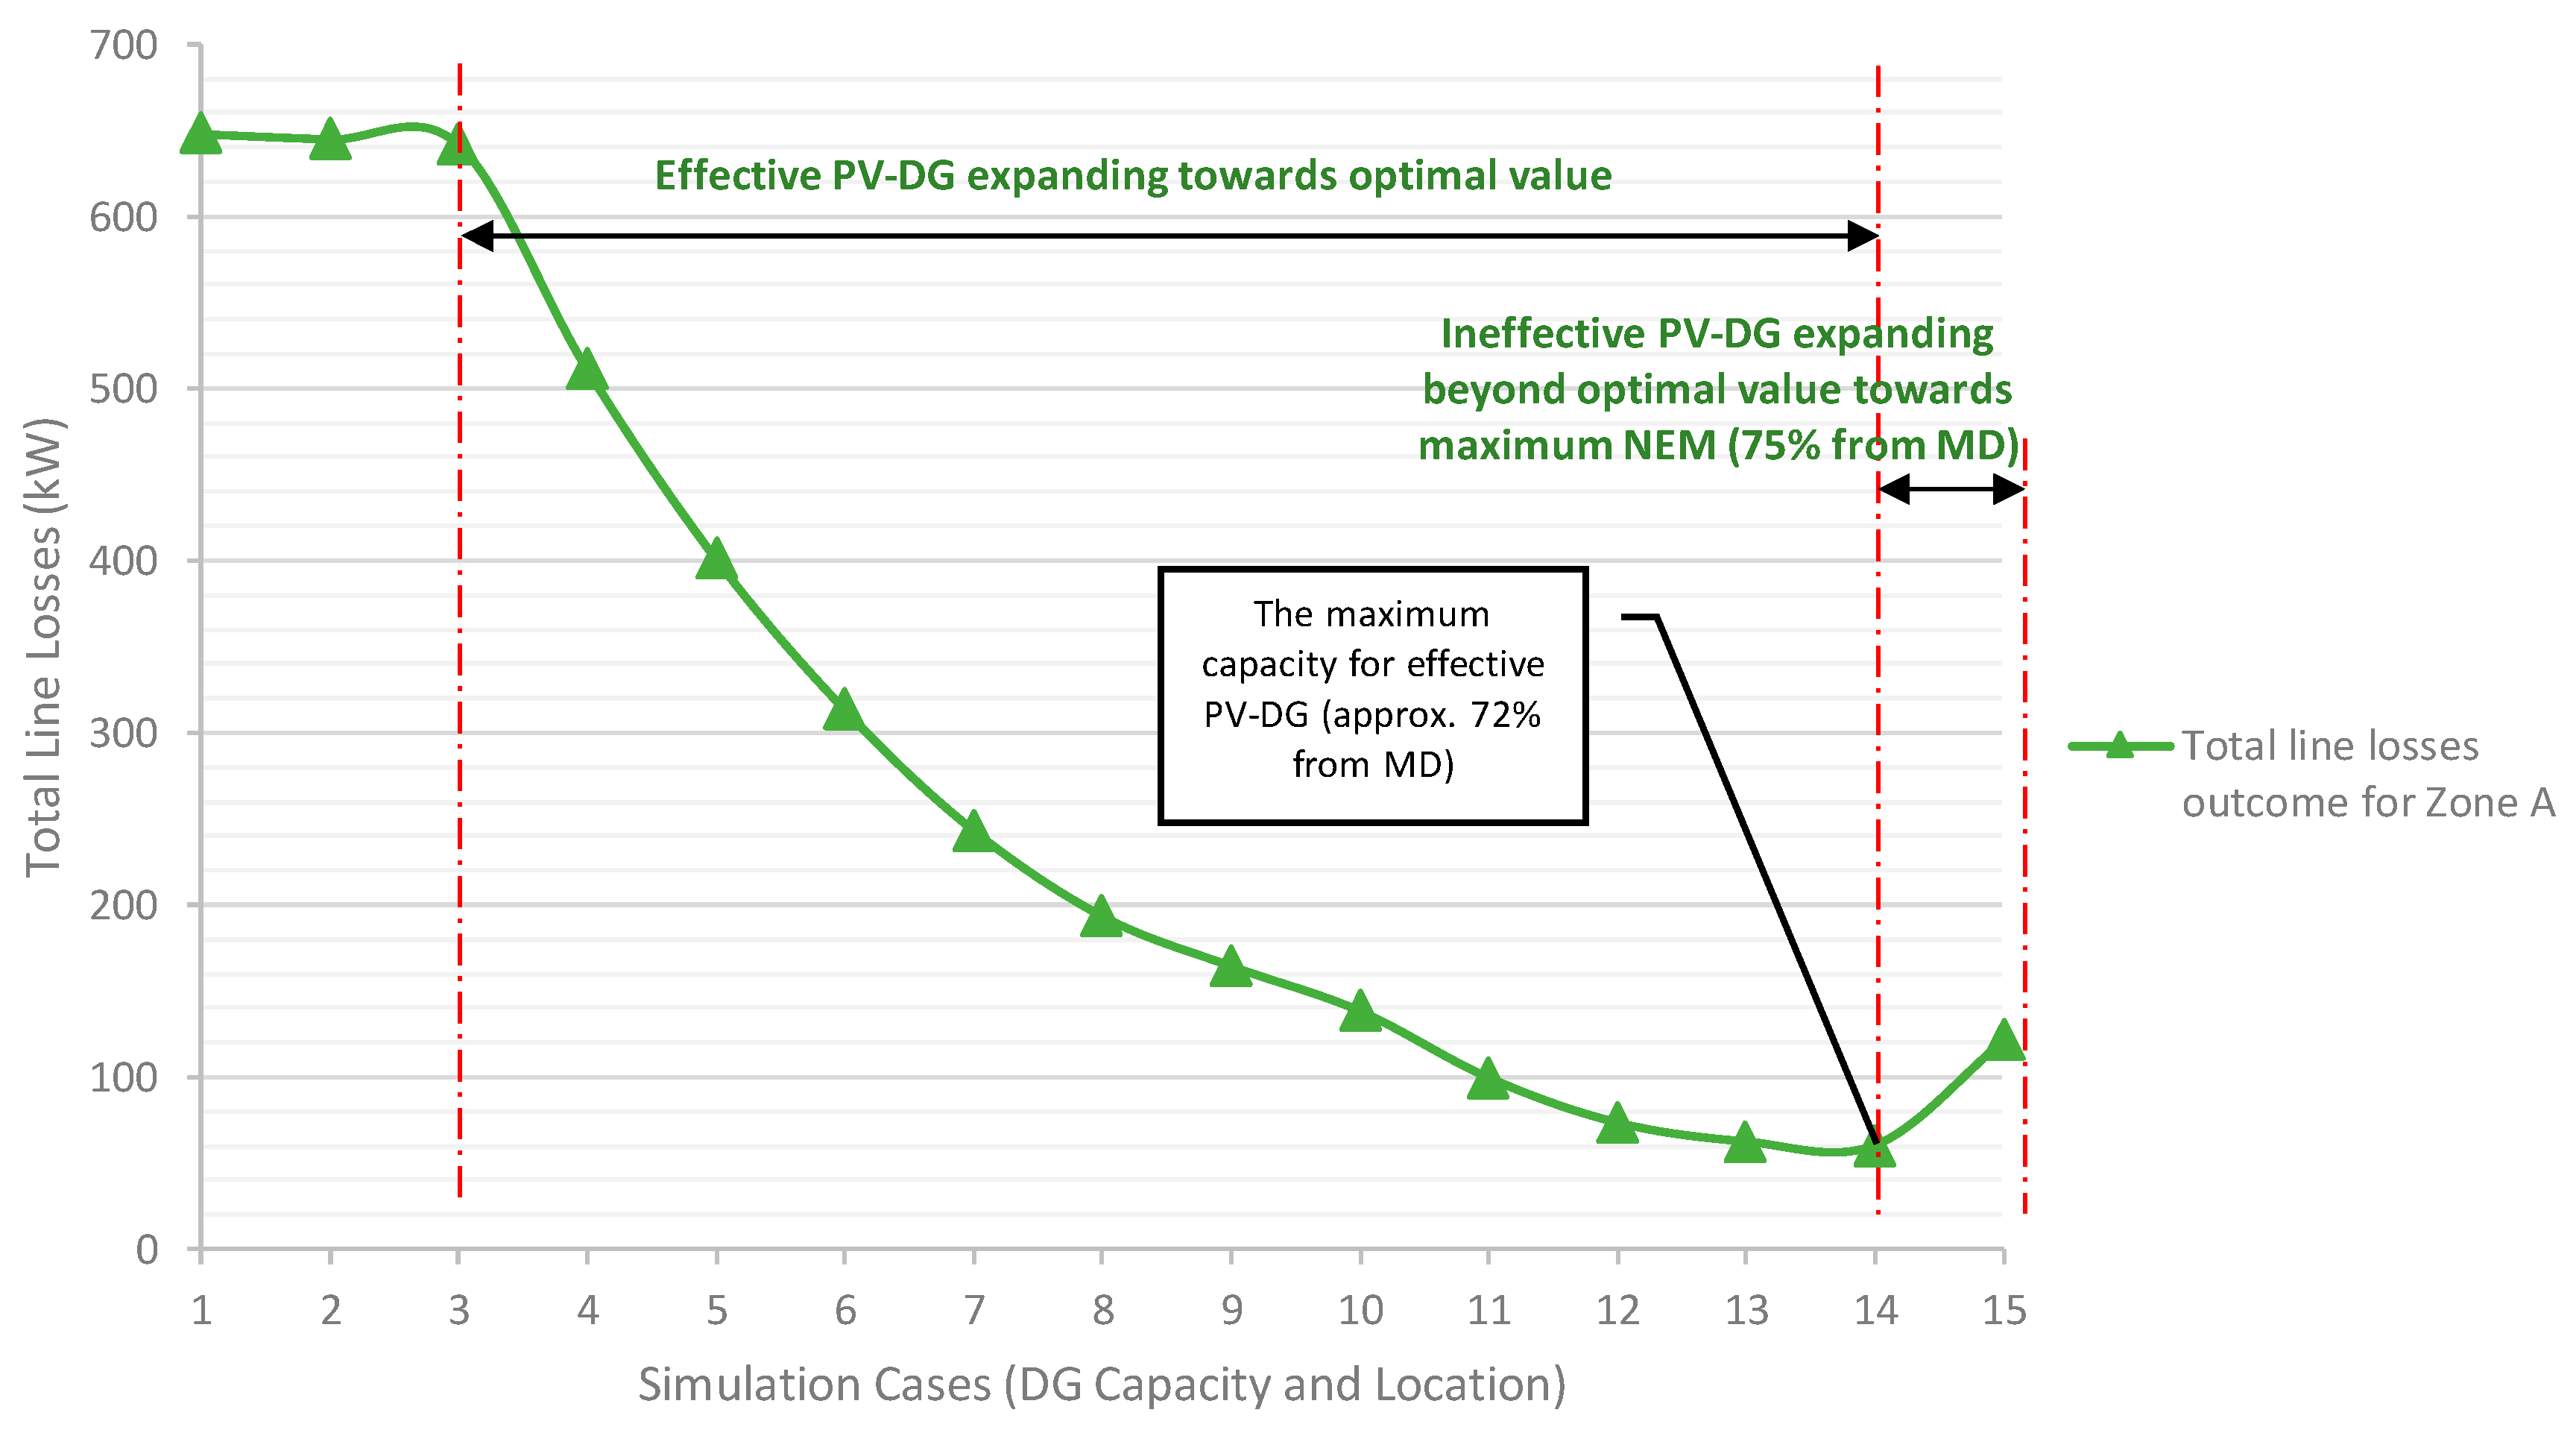
| District Level Hospital. | Case | 1 | 2 | 3 | 4 | 5 | 6 | 7 | 8 | 9 | 10 | 11 | 12 | 13 | Optimal | 14 | |
| ZONE A (1232 kW) | Optimal PV-DG in kWp (Bus) | - | 185 (bus 2) | 246 (bus 2) | 308 (bus 2) | 370 (bus 2) | 431 (bus 2) | 493 (bus 2) | 554 (bus 2) | 616 (bus 2) | 678 (bus 5) | 739 (bus 5) | 801 (bus 5) | 862 (bus 5) | 885 (bus 5) | 924 (bus 5) | |
| Total Power Losses (kW) | ABC | 648 | 645 | 642 | 511 | 401 | 313 | 243 | 193 | 164 | 138 | 99 | 73 | 62 | 60 | 121 | |
| PSO | 648 | - | - | - | - | - | - | - | - | - | - | - | - | 60 | - | ||
| Voltage (P.U) | V min | 0.9995 | 0.9998 | 0.9995 | 0.9992 | 0.9995 | 0.9995 | 0.9995 | 0.9995 | 0.9995 | 0.9995 | 0.9995 | 0.9995 | 0.9995 | - | ||
| V max | 1 | 1 | 1 | 1 | 1 | 1 | 1 | 1 | 1 | 1 | 1 | 1 | 1 | - | |||
| ∑ kW Losses | 0.00000 | 0.00000 | 0.00000 | 0.00000 | 0.00000 | 0.00000 | 0.00000 | 0.00000 | 0.00000 | 0.00000 | 0.00000 | 0.00000 | 0.00000 | - | |||
| Percentage reduction (%) | - | 0.5% | 1% | 21% | 38% | 52% | 63% | 70% | 75% | 79% | 85% | 89% | 90% | 91% | 81% | ||
| National Level Hospital (Zone A) | ||||||||||||||
| Original Case by Case Setup | ||||||||||||||
| 1 | 2 | 3 | 4 | 5 | 6 | 7 | 8 | 9 | 10 | 11 | 12 | 13 | 14 | |
 | ||||||||||||||
| New forward shifted arrangement (Optimal Value at Case 9) | ||||||||||||||
| 1 | 2 | 3 | 4 | 5 | 6 | 7 | 8 | 9 | 10 | 11 | 12 | 13 | 14 | 15 |
| National Level Hospital (Zone B) | ||||||||||||||
| Original Case by Case Setup | ||||||||||||||
| 1 | 2 | 3 | 4 | 5 | 6 | 7 | 8 | 9 | 10 | 11 | 12 | 13 | 14 | |
 | ||||||||||||||
| New forward shifted arrangement (Optimal Value at Case 10) | ||||||||||||||
| 1 | 2 | 3 | 4 | 5 | 6 | 7 | 8 | 9 | 10 | 11 | 12 | 13 | 14 | 15 |
| Hospital Level | NEM Scheme (Max. Capacity) | Expansion-Limit (Effective Capacity) |
|---|---|---|
| National Hospital Level | Zone A | |
| 75% from MD (823 kWp) | 49.8% from MD (546 kWp) | |
| Zone B | ||
| 75% from MD (1193 kWp) | 53% from MD (840 kWp) | |
| State Hospital Level | Zone A | |
| 75% from MD (936 kWp) | 53% from MD (654 kWp) | |
| Zone B | ||
| 75% from MD (1938 kWp) | 62% from MD (1600 kWp) | |
| District Hospital Level | Zone A | |
| 75% from MD (924 kWp) | 72% from MD (885 kWp) | |
© 2019 by the authors. Licensee MDPI, Basel, Switzerland. This article is an open access article distributed under the terms and conditions of the Creative Commons Attribution (CC BY) license (http://creativecommons.org/licenses/by/4.0/).
Share and Cite
Amran, M.E.; Muhtazaruddin, M.N.; Muhammad-Sukki, F.; Bani, N.A.; Ahmad Zaidi, T.Z.; Kamaluddin, K.A.; Ardila-Rey, J.A. Photovoltaic Expansion-Limit through a Net Energy Metering Scheme for Selected Malaysian Public Hospitals. Sustainability 2019, 11, 5131. https://0-doi-org.brum.beds.ac.uk/10.3390/su11185131
Amran ME, Muhtazaruddin MN, Muhammad-Sukki F, Bani NA, Ahmad Zaidi TZ, Kamaluddin KA, Ardila-Rey JA. Photovoltaic Expansion-Limit through a Net Energy Metering Scheme for Selected Malaysian Public Hospitals. Sustainability. 2019; 11(18):5131. https://0-doi-org.brum.beds.ac.uk/10.3390/su11185131
Chicago/Turabian StyleAmran, Mohd Effendi, Mohd Nabil Muhtazaruddin, Firdaus Muhammad-Sukki, Nurul Aini Bani, Tauran Zaidi Ahmad Zaidi, Khairul Azmy Kamaluddin, and Jorge Alfredo Ardila-Rey. 2019. "Photovoltaic Expansion-Limit through a Net Energy Metering Scheme for Selected Malaysian Public Hospitals" Sustainability 11, no. 18: 5131. https://0-doi-org.brum.beds.ac.uk/10.3390/su11185131