The Concept of Financial Sustainability Measurement: A Case of Food Companies from Northern Europe

Faculty of Economic Sciences, Warsaw University of Life Sciences—SGGW, 02-787 Warsaw, Poland
*
Author to whom correspondence should be addressed.
Sustainability 2019, 11(18), 5139; https://0-doi-org.brum.beds.ac.uk/10.3390/su11185139
Submission received: 20 August 2019
/
Revised: 4 September 2019
/
Accepted: 18 September 2019
/
Published: 19 September 2019
(This article belongs to the Section Economic and Business Aspects of Sustainability)
Abstract
:A managerial approach to the financial sustainability of a company derives from the principle of value maximization for shareholders at an acceptable level of risk, using the best combination of investments and available sources of financing. The research presents the concept of financial sustainability measurement in the example of food companies from Northern Europe. We applied fuzzy logic to quantify complex interrelations among various financial factors and classify companies according to the level of their financial sustainability. A unique combination of factors formed a single complex indicator, which measured a relative level of financial sustainability of food companies. Considering the duality of financial sustainability in terms of risk and return, the relationship framework for synthetic evaluation included the vector of value and the vector of continuity that consisted of such variables as profitability, market capitalization, productivity, operating efficiency, debt, liquidity, interest coverage, and retained earnings. We received evidence that the level of financial sustainability of entities changed in 2005–2015 and was statistically different among sample companies. The proposed method can be applied as a practical tool in a decision-making process to evaluate financial sustainability or other aspects of business performance in larger groups of entities on the basis of various financial criteria.
Keywords:
financial sustainability; value; risk; profitability; solvency; fuzzy logic; food companies1. Introduction
The increasing spillover effects of the rapid development of industrial societies draw particular attention to the issue of sustainability [1,2,3,4,5,6,7,8,9,10]. By applying the principles of sustainability, policy-makers and researchers try to face modern challenges of economic development and resource management in the long-term. In this context, first attempts to introduce the concept of sustainability in financial science have been made recently [11]. The reason for putting effort into this area of research was a substantial financial turmoil in the first decade of the XXI century that undermined the mainstream financial theories and gave an impetus to alternative approaches to principles of institutional and corporate financial management [12,13]. Particularly, inadequate policies of risk management and value maximization could not protect managers, bankers, and investors from losses, while the concept of financial sustainability appeared to balance the benefits and risks in financial decision-making [14]. We define the financial sustainability of a firm as the ability to generate value for owners and provide continuity (the concept of continuity refers to the going concern principle of accounting) of operations in the long-term, using an optimal combination of investments and sources of financing. Therefore, the scope of financial sustainability simultaneously covers several financial variables that form the relationship framework linking value and continuity of business. The most beneficial combination of these variables in certain business conditions ensures the highest level of financial sustainability. However, the deterioration of the relationship between value and continuity results in ambiguous effects. The exaggerated orientation on value may lead to the financial distress and bankruptcy of an entity [15]. Conversely, striving for continuity, managers often maximize solvency and liquidity that can reduce the profitability of business [16]. In this context, the concept of financial sustainability of an entity is sometimes compared to the risk-return model that originates from the theory of investment [17]. The model implies that taking additional risk, expressed by the volatility of the price of a financial instrument, increases the probability of receiving higher profit. Therefore, on a firm-level, a manager should decide whether to maximize the return from investments and increase financial leverage, or avoid risk and maintain solvency, and liquidity. However, the theory and practice of corporate finance often contradict the principles of investing in financial markets, which often rely on historical data only. We believe that the relationship between risk and return in the company is not straightforward and depends on different exogenous and endogenous attributes. Firstly, various non-financial factors, such as a type of a business sector, a geographical region, and a phase of a business cycle can influence the level of risk and return and the financial sustainability of a business [18,19]. For example, in 2017, Polish manufacturing companies tended to demonstrate higher ratios of liquidity and profitability in comparison to trading entities that contradicted the risk-return principle. However, in the same period, Polish servicing companies had a higher level of liquidity and lower profitability than trading firms that proved the principle held [20]. Hence, financial performance demonstrates relativity in heterogeneous groups of entities and largely depends on the method of measurement. Secondly, the risk attitude of particular groups of owners, such as farmers, has a direct impact on financial sustainability: Through accumulating surplus cash and forgoing investment opportunities, these actors usually increase the creditworthiness for financial institutions but restrict the return and value of their businesses for inheritors [21]. Thus, the behavioral factor is essential when investigating financial sustainability [22,23]. Thirdly, there is vast empirical evidence that shows that interrelations between financial variables of companies violate the risk-return principle: For example, a profitability ratio (in this context, the profitability ratio refers to return) is often inversely correlated to a debt ratio (in this context, the debt ratio refers to risk), and entities with a higher retention ratio and a liquidity ratio are more profitable in the long-term [16,24]. This phenomenon finds its origin in the accounting rules of profit recognition and supports the pecking order theory of capital structure. According to this theory, a manager first uses an internal source of financing, such as retained earnings, and then debt, and then equity [25]. In other words, additional profit is regularly transferred into retained earnings that positively influences the solvency and liquidity of the company. Hence, it is highly probable that, in certain circumstances, companies with higher profit increase solvency, and, in fact, financial sustainability at the same time. Therefore, a manager should set up an appropriate financial strategy to provide an adequate level of financial sustainability, with the consideration of a current business environment.
An extensive scientific discussion on finance and sustainability was started in the last decade of the 20th century. The previous macro-level research on the relationship between finance and sustainability concentrated on issues of shaping financial policies and designing financial measures supporting sustainable development [26,27]. In this context, an economic debate concerned national financing frameworks that would integrate resources and actions to fulfill the priorities of national sustainability strategies [28]. A set of financial measures to achieve national goals in the sphere of sustainable development should consider the level of economic development of a region and include such instruments as taxes on natural resources, public and private investments, insuring schemes or debt [29]. The prominent role of financial institutions for sustainable development was also underlined: Increasing access to banking services and improving financial literacy had a positive effect on the level of financial sustainability of poorest groups of the population [30]. On the institutional level, researchers extensively examined the problems of financial sustainability in homogeneous groups of entities classified according to different socio-economic characteristics [31]. For example, the role of the institution in shaping financial sustainability is visible in nonprofit organizations that have to compromise the high reliance on external sources of financing with a range of economic, cultural, and social demands that go beyond the social mission of the organization [32]. In dairy cooperatives, the duality of the function of members, usually being the owners and suppliers of raw material at the same time, may result in conflicts and deteriorate the financial strategy and sustainability of an institution [33]. On a firm level, financial sustainability may refer to viability, stability, or security of a business. Myśková and Hájek give a definition of financial stability as the ability of a firm to generate profit, increase the value of invested capital and repay its short- and long-term liabilities at the same time [34]. Financial security is associated with a state of the long-term financial equilibrium of a firm that reflects its resistance to the negative impact of internal and external threats [35]. These definitions, rarely used in the context of a firm’s business performance, attribute to a well-known concept of financial viability that applies a broad spectrum of instruments to assess the financial strength of business [36]. According to Koleda and Oganisjana, financial viability refers to the state of distribution of financial resources of the company that ensures sustainable development of a company in the long-term [37]. This understanding fits in with the meaning of the financial sustainability of a firm presented in this research.
In spite of a variety of interpretations, numerous attempts to identify the measures of financial sustainability or viability on a firm level have been made [38,39,40]. Many findings point at the risk of bankruptcy, expressed by the ability to pay debt and finance operations, as a core proxy for financial sustainability of a business [41,42]. On the basis of an assessment of this parameter, financial intermediaries judge on the creditworthiness of a company, shareholders decide on new investments, and managers conduct acquisitions [43]. Hence, measuring the risk of bankruptcy is crucial to determine the level of financial sustainability of a firm. In this context, researchers mostly focus on analyzing partial factors of financial risk and identifying the links among these factors, using instruments of traditional financial analysis [44,45]. Henock applied the ratio of financial revenue to operating expenses to explain the financial sustainability of cooperatives and finds its high dependency is on such factors as the return on asset, operational efficiency, debt-equity relation, donation, and deposit mobilization [46]. Schwab et al. stated that as the main challenge for financial sustainability of growing SMEs in Switzerland was the risk of bankruptcy, managers had to consider such key performance indicators as customer accounts’ receivable flow time and credit limit allowed by financial partners when setting up a financial strategy [47]. Generally, many findings reported that financially sustainable companies demonstrated higher liquidity and solvency, as these measures were directly related to the capital structure, and indebtedness of an entity [48,49]. However, the impact of some other financial variables, such as operating efficiency and market value on financial sustainability, remained unclear [50].
The majority of researchers agree on the complexity and multifaceted nature of financial sustainability, as it is linked to the profitability, solvency, and efficiency of a firm. However, despite numerous attempts to indirectly approach financial sustainability, there is a lack of research devoted to the methodology of evaluation of financial sustainability on a firm level. Considering the empirical gap, we decide to elaborate on the concept and methods of financial sustainability measurements that would contribute to the research on corporate financial management. The primary goal of our study is to construct a synthetic measure of financial sustainability that can be used in the evaluation of the efficiency of financial management of food companies. The proposed measure will be applied in further steps of the research for the investigation and quantification of relationships among factors within a financial sustainability framework. Our research differs from previous studies, as we apply a fuzzy membership function and aggregation technique to approach the complexity of financial sustainability on a firm level. We propose a theoretical framework for measuring financial sustainability and analyze factors influencing financial sustainability, using a sample of food companies from Northern Europe. The uniformity of our approach to financial sustainability enables using it in large homogeneous groups of entities to compare firms, industries, and economies for the evaluation of their financial situation. Hence, the proposed method would be a valuable practical tool for managers and other business stakeholders through supporting the financial decision-making process.
2. Materials and Methods
The estimation of financial sustainability requires the inclusion of several financial factors that might have an ambiguous impact on business performance. Moreover, the inference on the financial sustainability of a firm is highly dependent on comparisons with other homogeneous objects in a data set. Therefore, we apply the synthetic evaluation method to address vagueness in measuring the financial sustainability of an entity [51]. This method uses fuzzy logic, which helps to interpret uncertain or multivariate information in a decision-making process [2]. A fuzzy membership function orders values of the parameter respective to the degree of their membership in a defined set: The full non-membership equals zero while full-membership corresponds to one [52]. Hence, all values between zero and one characterize different degrees of membership according to the defined evaluation criterion. By applying the fuzzy method, we elaborate a complex indicator of financial sustainability based on vectors of value and continuity that reflect the duality and heterogeneity of the model. The vector of value includes financial factors associated with market value, profitability, productivity, and operating efficiency of a business entity. In further text we use the terms ‘factors’ and ‘variables’ interchangeably. The vector of continuity comprises factors characterizing debt, liquidity, interest coverage, and retained earnings of a company (Table 1).
First, we define the indicator set X: X = (x1, x2, x3, x4, x5, x6, x7, x8), where X is a level of financial sustainability. Then, using a fuzzy membership function, we transform factors with a negative impact on financial sustainability through the application of a normalization formula:
where xmax is the maximum value for each factor in the set of sample entities during 2005–2015, and xmin is the corresponding minimum value.
Variables with negative impact on financial sustainability are as follows: Total Liabilities/Total Assets, Interest Expense/EBIT).
Factors with a positive impact on financial sustainability are transformed according to a normalization formula
Variables with positive impact on financial sustainability are as follows: Revenue/Total Assets, Total Assets/Current Assets, Price/Book Value, Net Profit/Equity, Current Assets/Current Liabilities, Retained Earnings/Revenue.
In the next step, we put transformed values for each company into the evaluation matrix:
where rij = µ (X), i = 1, 2, …, 8 factors and j = 1, 2, …, n – companies.
We assign equal weights to values, as the impact of particular factors on financial sustainability in the study period can be vague. Thus, the factor weight is:
and
where n is number of factors in the complex indicator, wi is the weight of i variable.
To construct the complex indicator of financial sustainability based on the evaluation matrix, we apply the following formula:
where: Ai is the complex indicator, an is weight of i factor, b1, b2, …, bn are components of the vector of financial sustainability.
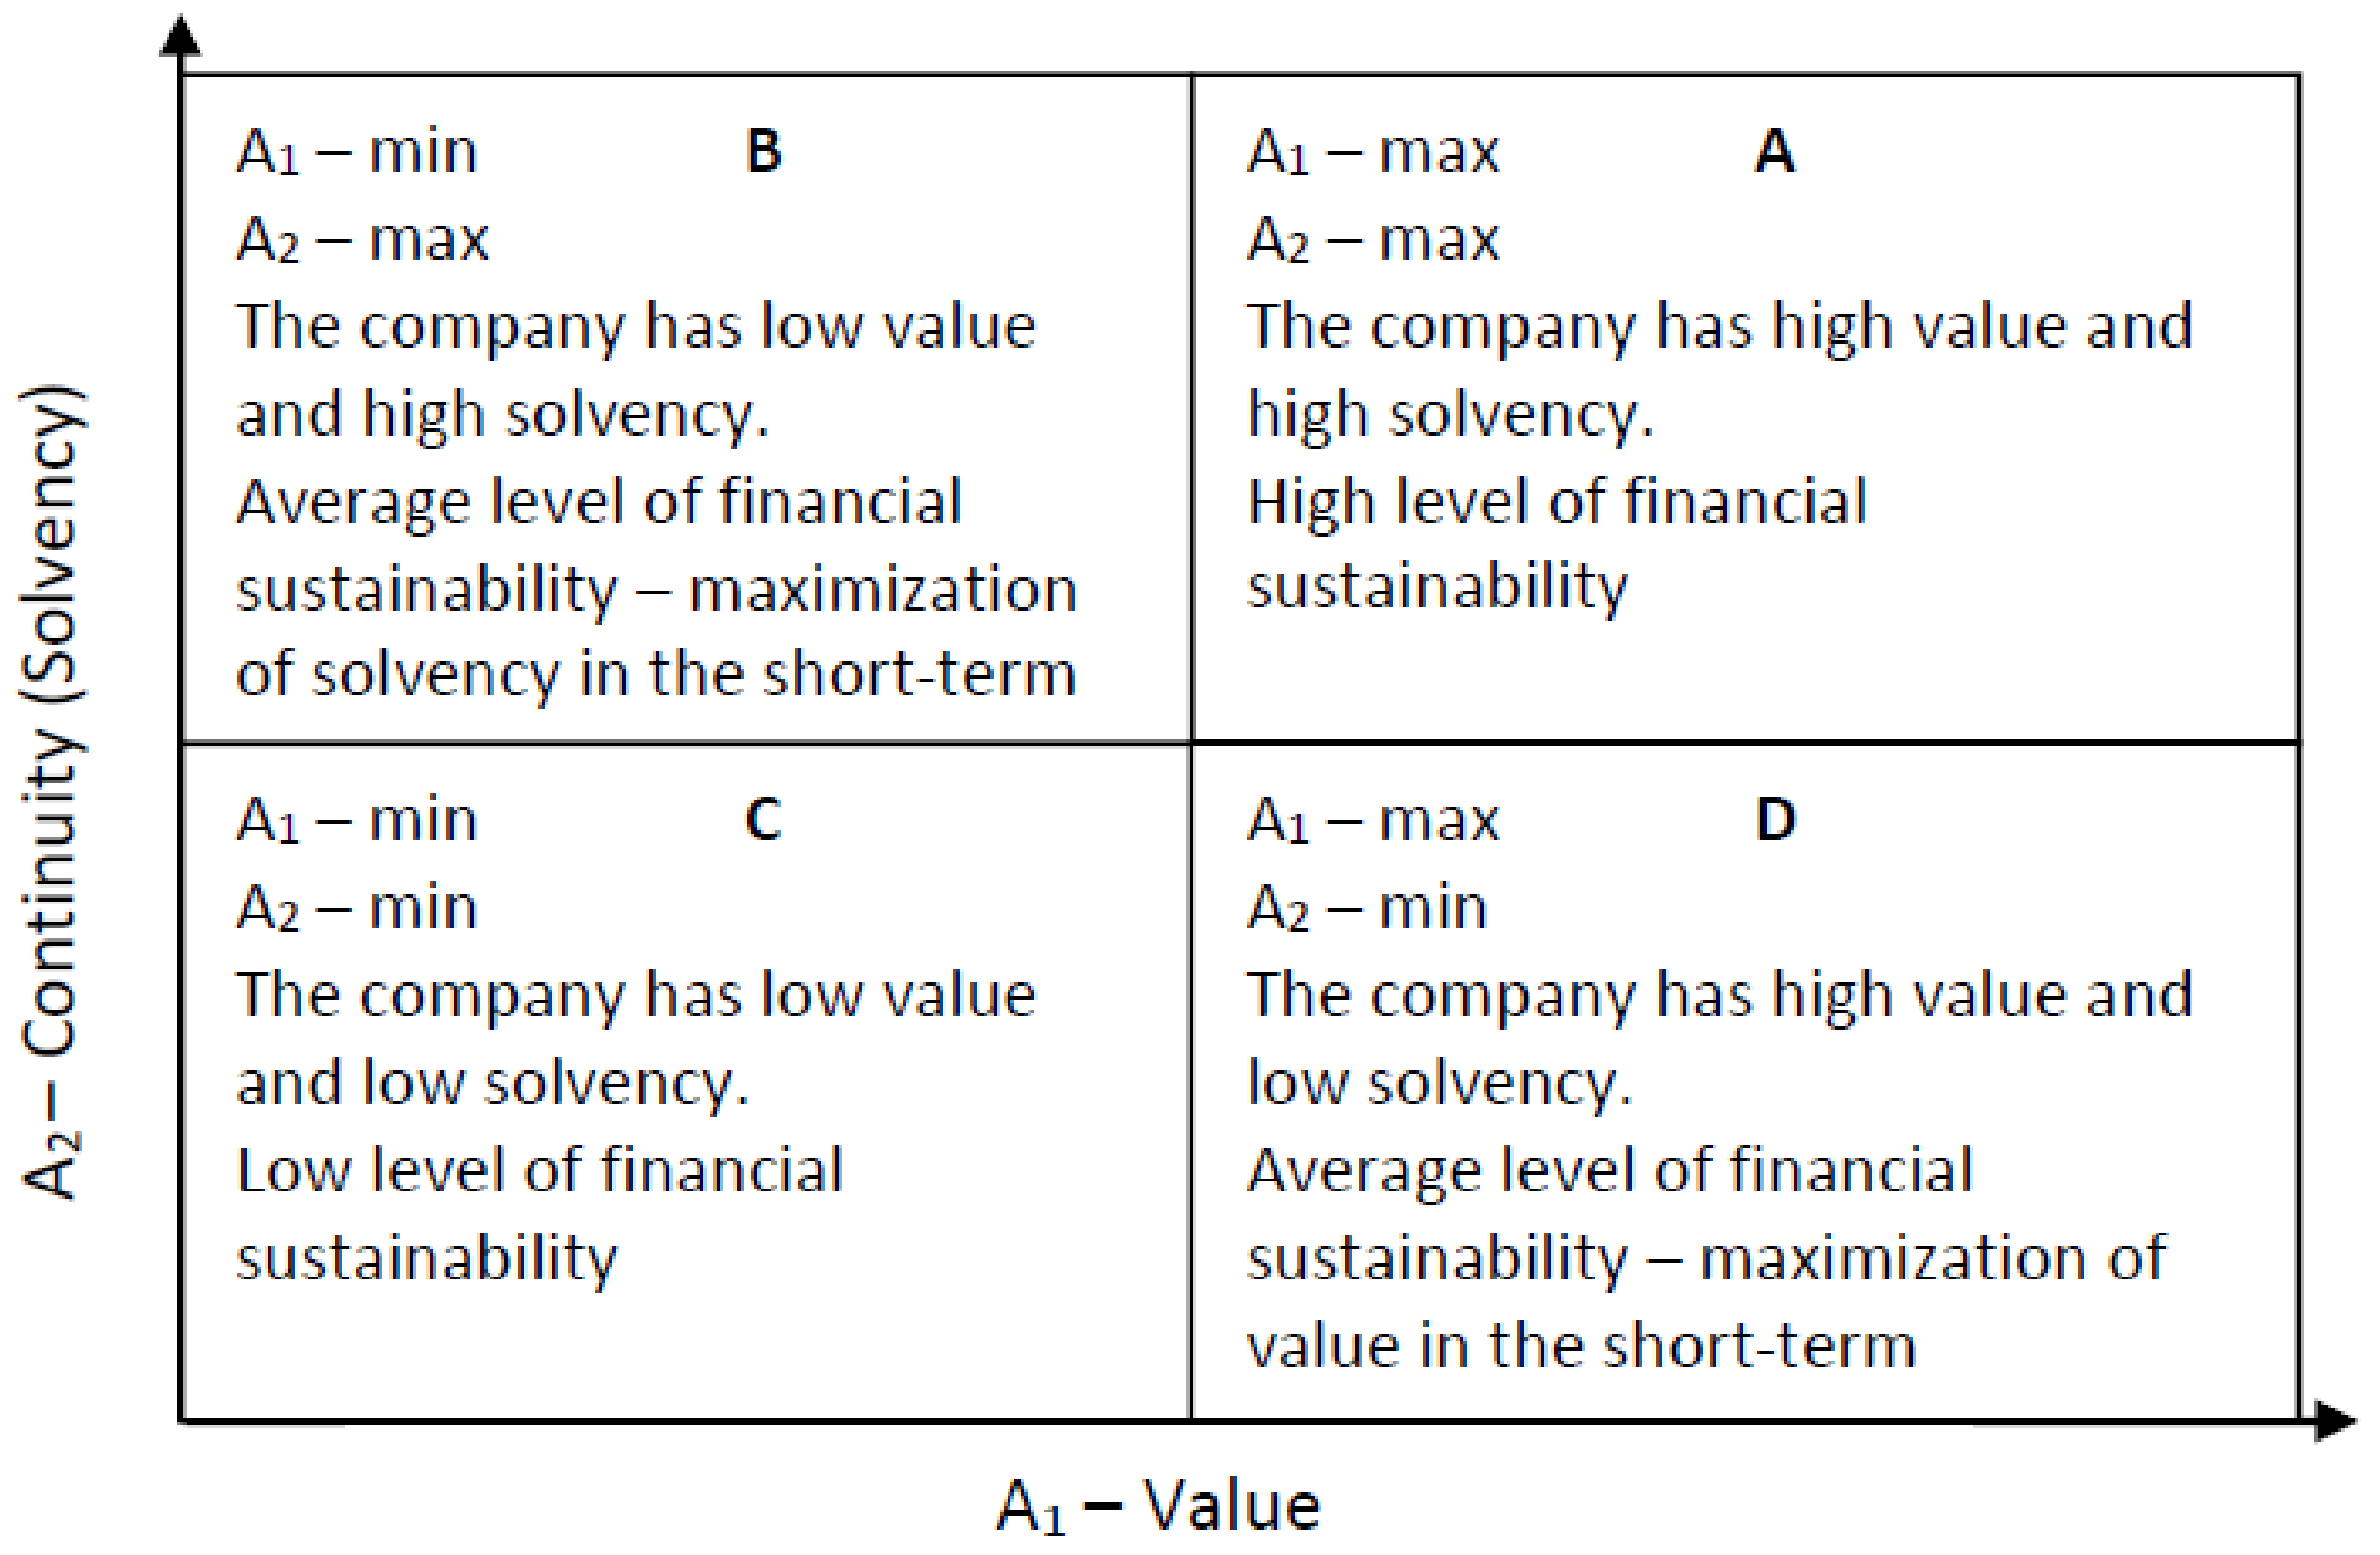
Using this technique, we build a complex indicator on the scale of [0;100] where the maximum number of points means the highest level of financial sustainability. We assume that financial factors included in the construction of the financial sustainability indicator are fully substitutable for each other. This approach supports the idea of ‘weak sustainability’, stating the substitution between environmental and human capital ensures non-decreasing total capital stock [53]. Hence, a decrease in one factor of sustainability is compensated by an increase in another factor without the depletion of the overall level of financial sustainability. Considering the multifaceted nature of financial sustainability and the inverse relation of some partial factors, we divide the core complex indicator (A) into a sub-indicator of value (A1) and a sub-indicator of continuity (A2) By estimating the sub-indicators, we get a better view of a relationship between the value and continuity (In a financial context continuity of business often refers to as solvency.) of an entity within a financial sustainability framework (Figure 1).
The horizontal axis presents the vector of value, whereas the vertical axis describes the vector of continuity of a business. Using the chart, we can easily define four scenarios of vectors’ relationship that produce different effects in terms of financial sustainability. The first scenario (A) is the most beneficial as high productivity, profitability, and market value are associated with a high level of solvency and liquidity of an entity. This combination would be typical for mature companies with an established market position. By contrast, scenario C demonstrates a low profitability and solvency that result in the lowest level of financial sustainability of a business. Such a situation can occur in fast-growing companies (for example, startups from the technological sector) or entities that experience financial difficulties. Scenarios B and D refer to a moderate level of financial sustainability in two variants. The first variant (scenario B) means the company retains a high level of solvency, but cannot generate enough profit and value for shareholders. Despite high creditworthiness in the short-term, this can provoke the shortage of investing activity and affect the competitiveness of a company in the long-term, which would result in moving a company to scenario C. However, a sound financial background in terms of solvency seems to be a necessary condition for increasing the profitability of business and advancing to scenario A. To achieve this goal, a manager should pay particular attention to the productivity and operating efficiency of an entity. The second variant (scenario D) demonstrates high value for shareholders, along with high leverage. In this case, the rising cost of financial distress and the deterioration of continuity of business can trade-off the benefits from value maximization that refers to the trade-off theory of capital structure [54]. Such a situation creates a threat of falling into scenario C. Therefore, pursuing financial sustainability requires a viable multidimensional strategy on all levels of an organization and ensures an appropriate relationship between value and continuity of business.
The research sample consists of twelve food processing companies from Northern Europe, including four entities from Finland (Apetit, Atria, Hkscan, Raisio), two from Sweden (AAK, Skane), and six from Norway (Austevoll, Grieg, Leroy, Marine, Orkla, Salmar). The research is based on data made available from financial statements of these companies and covers the period of 2005–2015.
3. Results
3.1. Factors of Financial Sustainability of Food Companies from Northern Europe
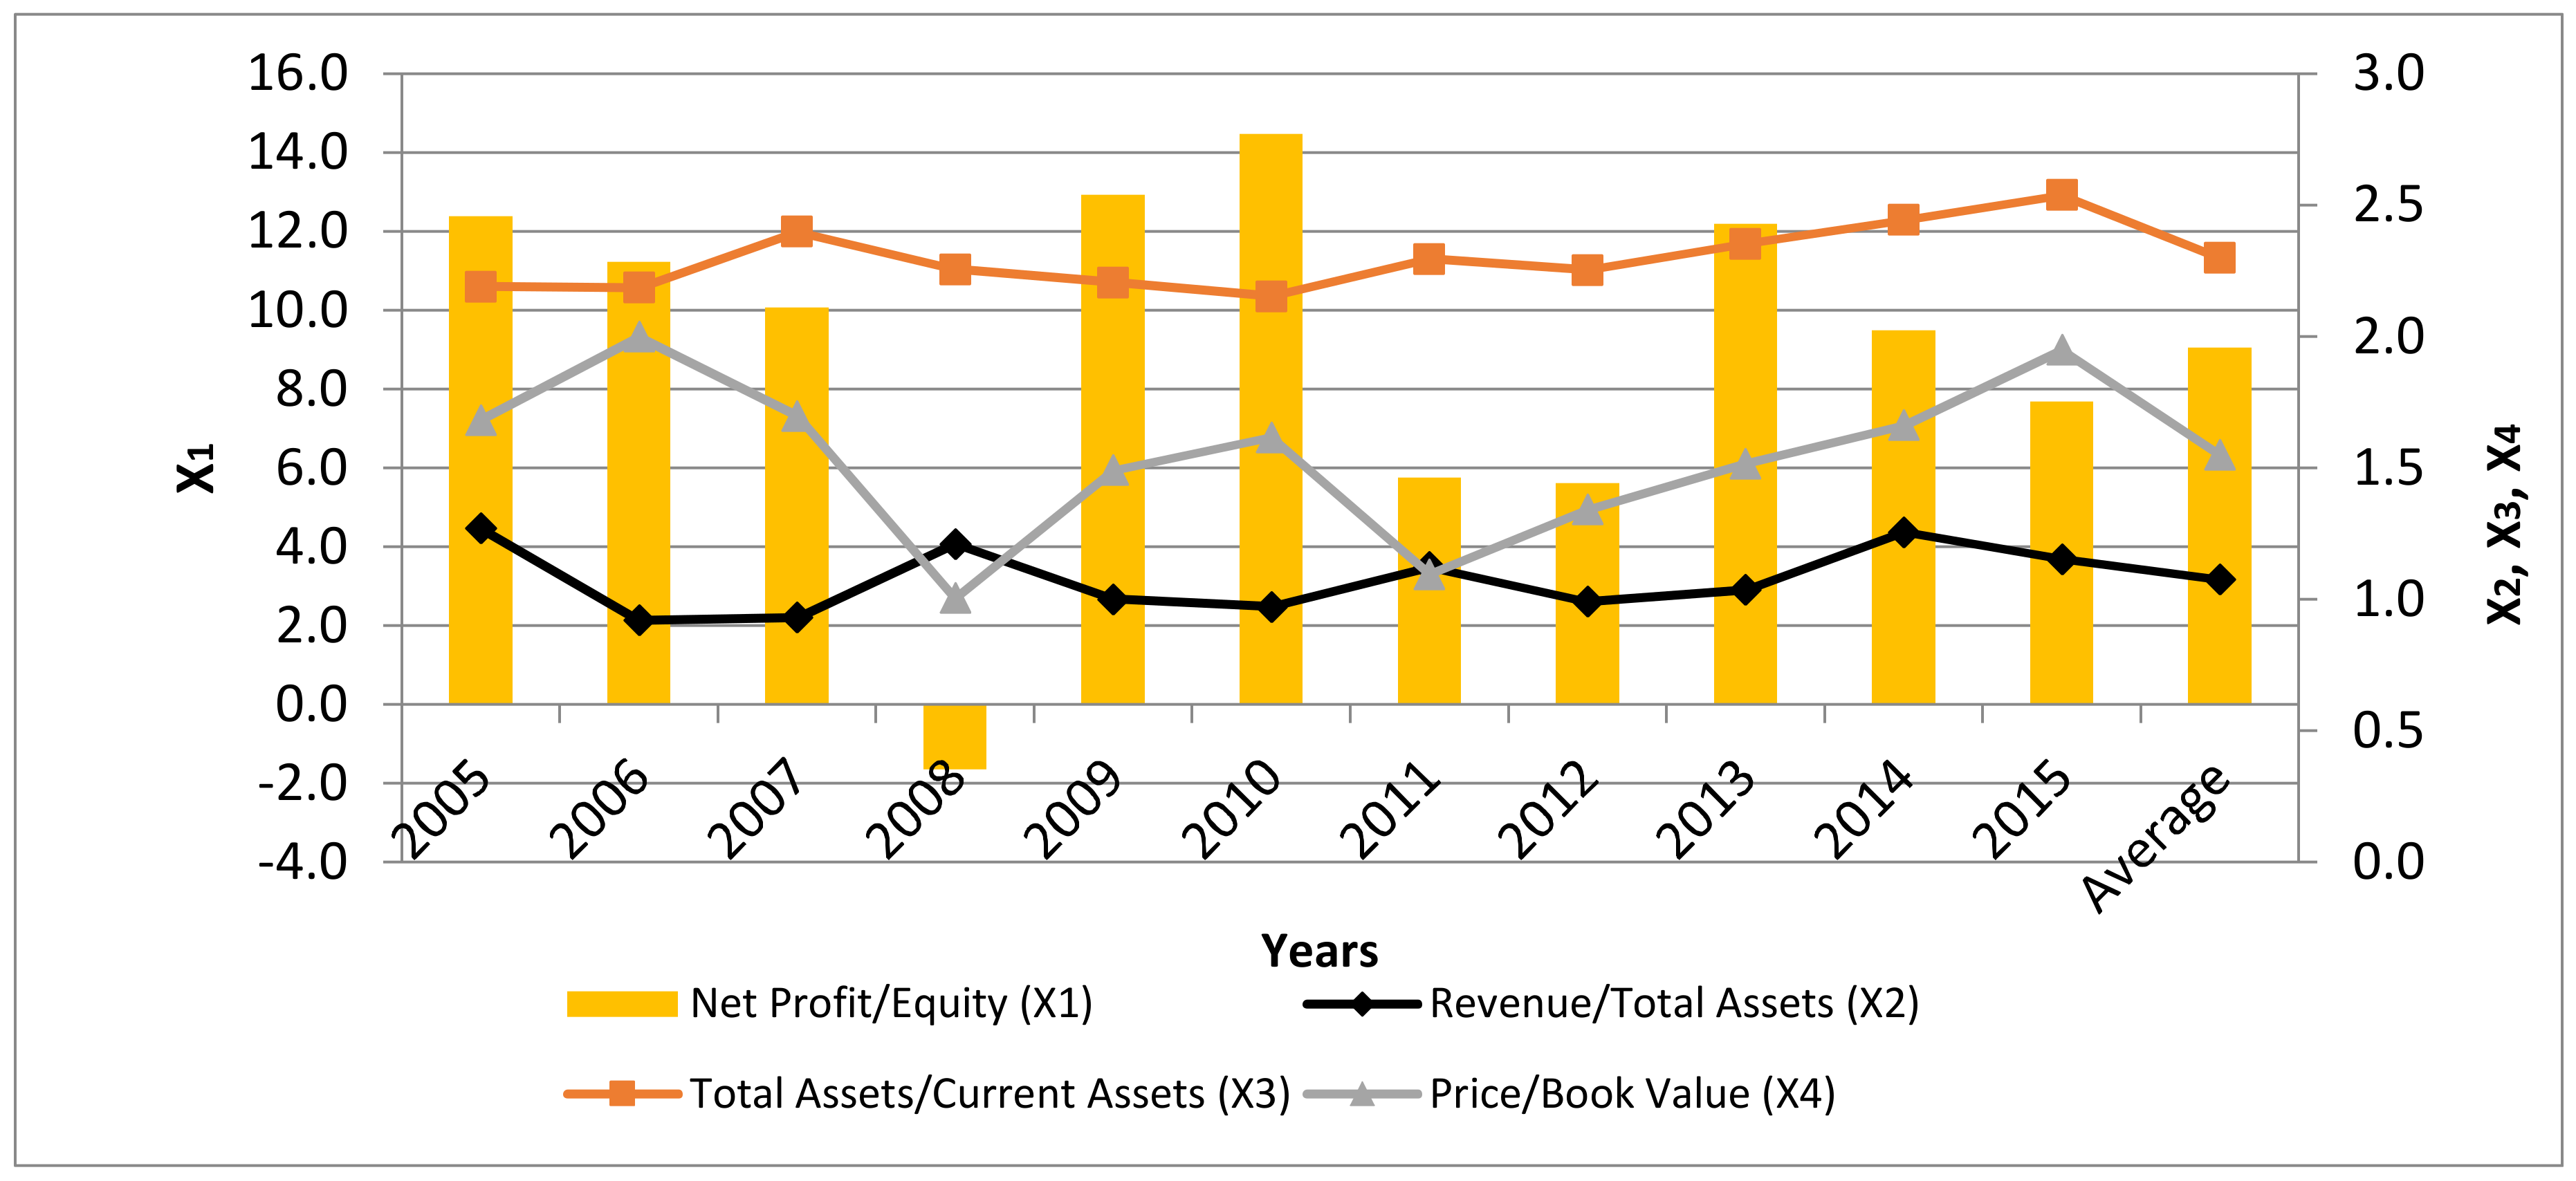
To depict orientation on the value of business within a framework of financial sustainability, we use financial ratios (x1, x2, x3, x4) (Figure 2) Food companies from Northern Europe demonstrated significant volatility of profitability and market value in 2005–2015. A common indicator of business performance, the return on equity ratio (x1), achieved a minimum of −1.7% in 2008 and a maximum of 14.5% in 2010, resulting in 9.1% on average. At the same time, the price to book ratio (x2) fluctuated between a minimum of 1.0 in 2008 and a maximum of 2.0 in 2015, while its average value reached 1.6. Generally, in the research sample, a higher profitability ratio referred to a higher price to book ratio, but growth rates of these ratios varied: The compound annual growth rate (CAGR) of the profitability ratio was negative (−4.7%), while the CAGR of the price to book value ratio came to 1.5%. The difference between growth rates could partially explain the relatively low valuations of food companies, as capitalization was often not supported by the increase in profitability in 2005–2015. The ratios of total assets to current assets (x3) and revenue to total assets (The assets turnover ratio.) (x4) are important measures of the operating efficiency and productivity of a business. These ratios were subject to minor fluctuations in comparison with the profitability and market value indicators. The ratio of total assets to current assets varied between 2.2 in 2010 and 2.5 in 2015, whereas its average value amounted to 2.3. The resistance of this relation gave evidence of a relatively high production potential, as fixed assets constituted the major part of total assets. The assets turnover ratio demonstrated the highest and lowest values in 2005 and 2006 (1.27 and 0.92, respectively), and the average ratio reached 1.1. It should be mentioned that the CAGR of total assets to current assets amounted to 1.5%, and the revenue to total assets to −1.0%, presenting a growing production potential, along with the sliding productivity of business entities in 2005–2015.
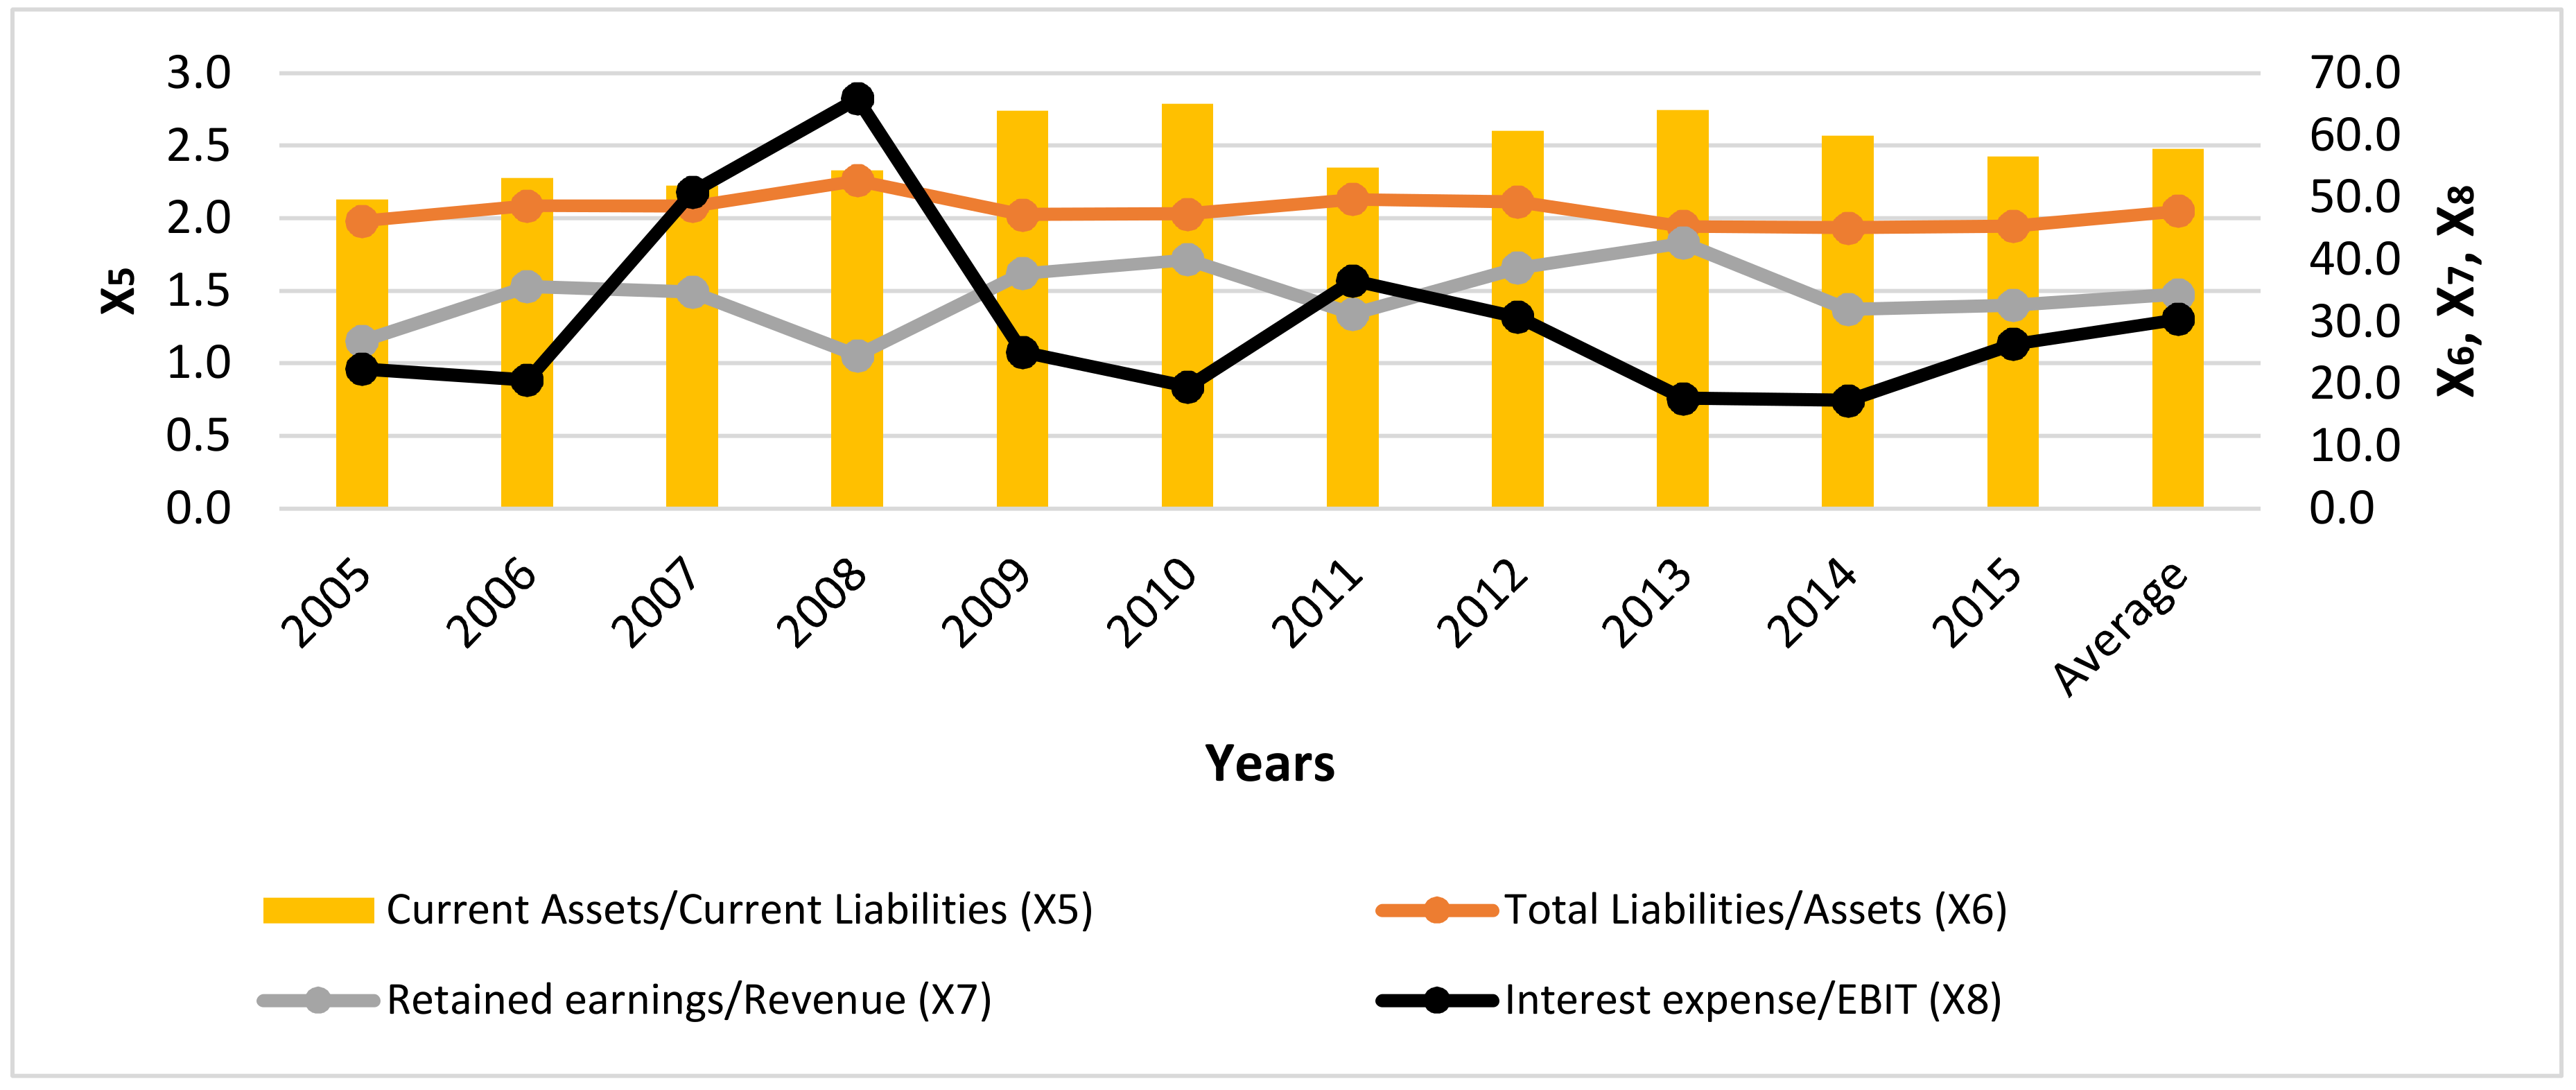
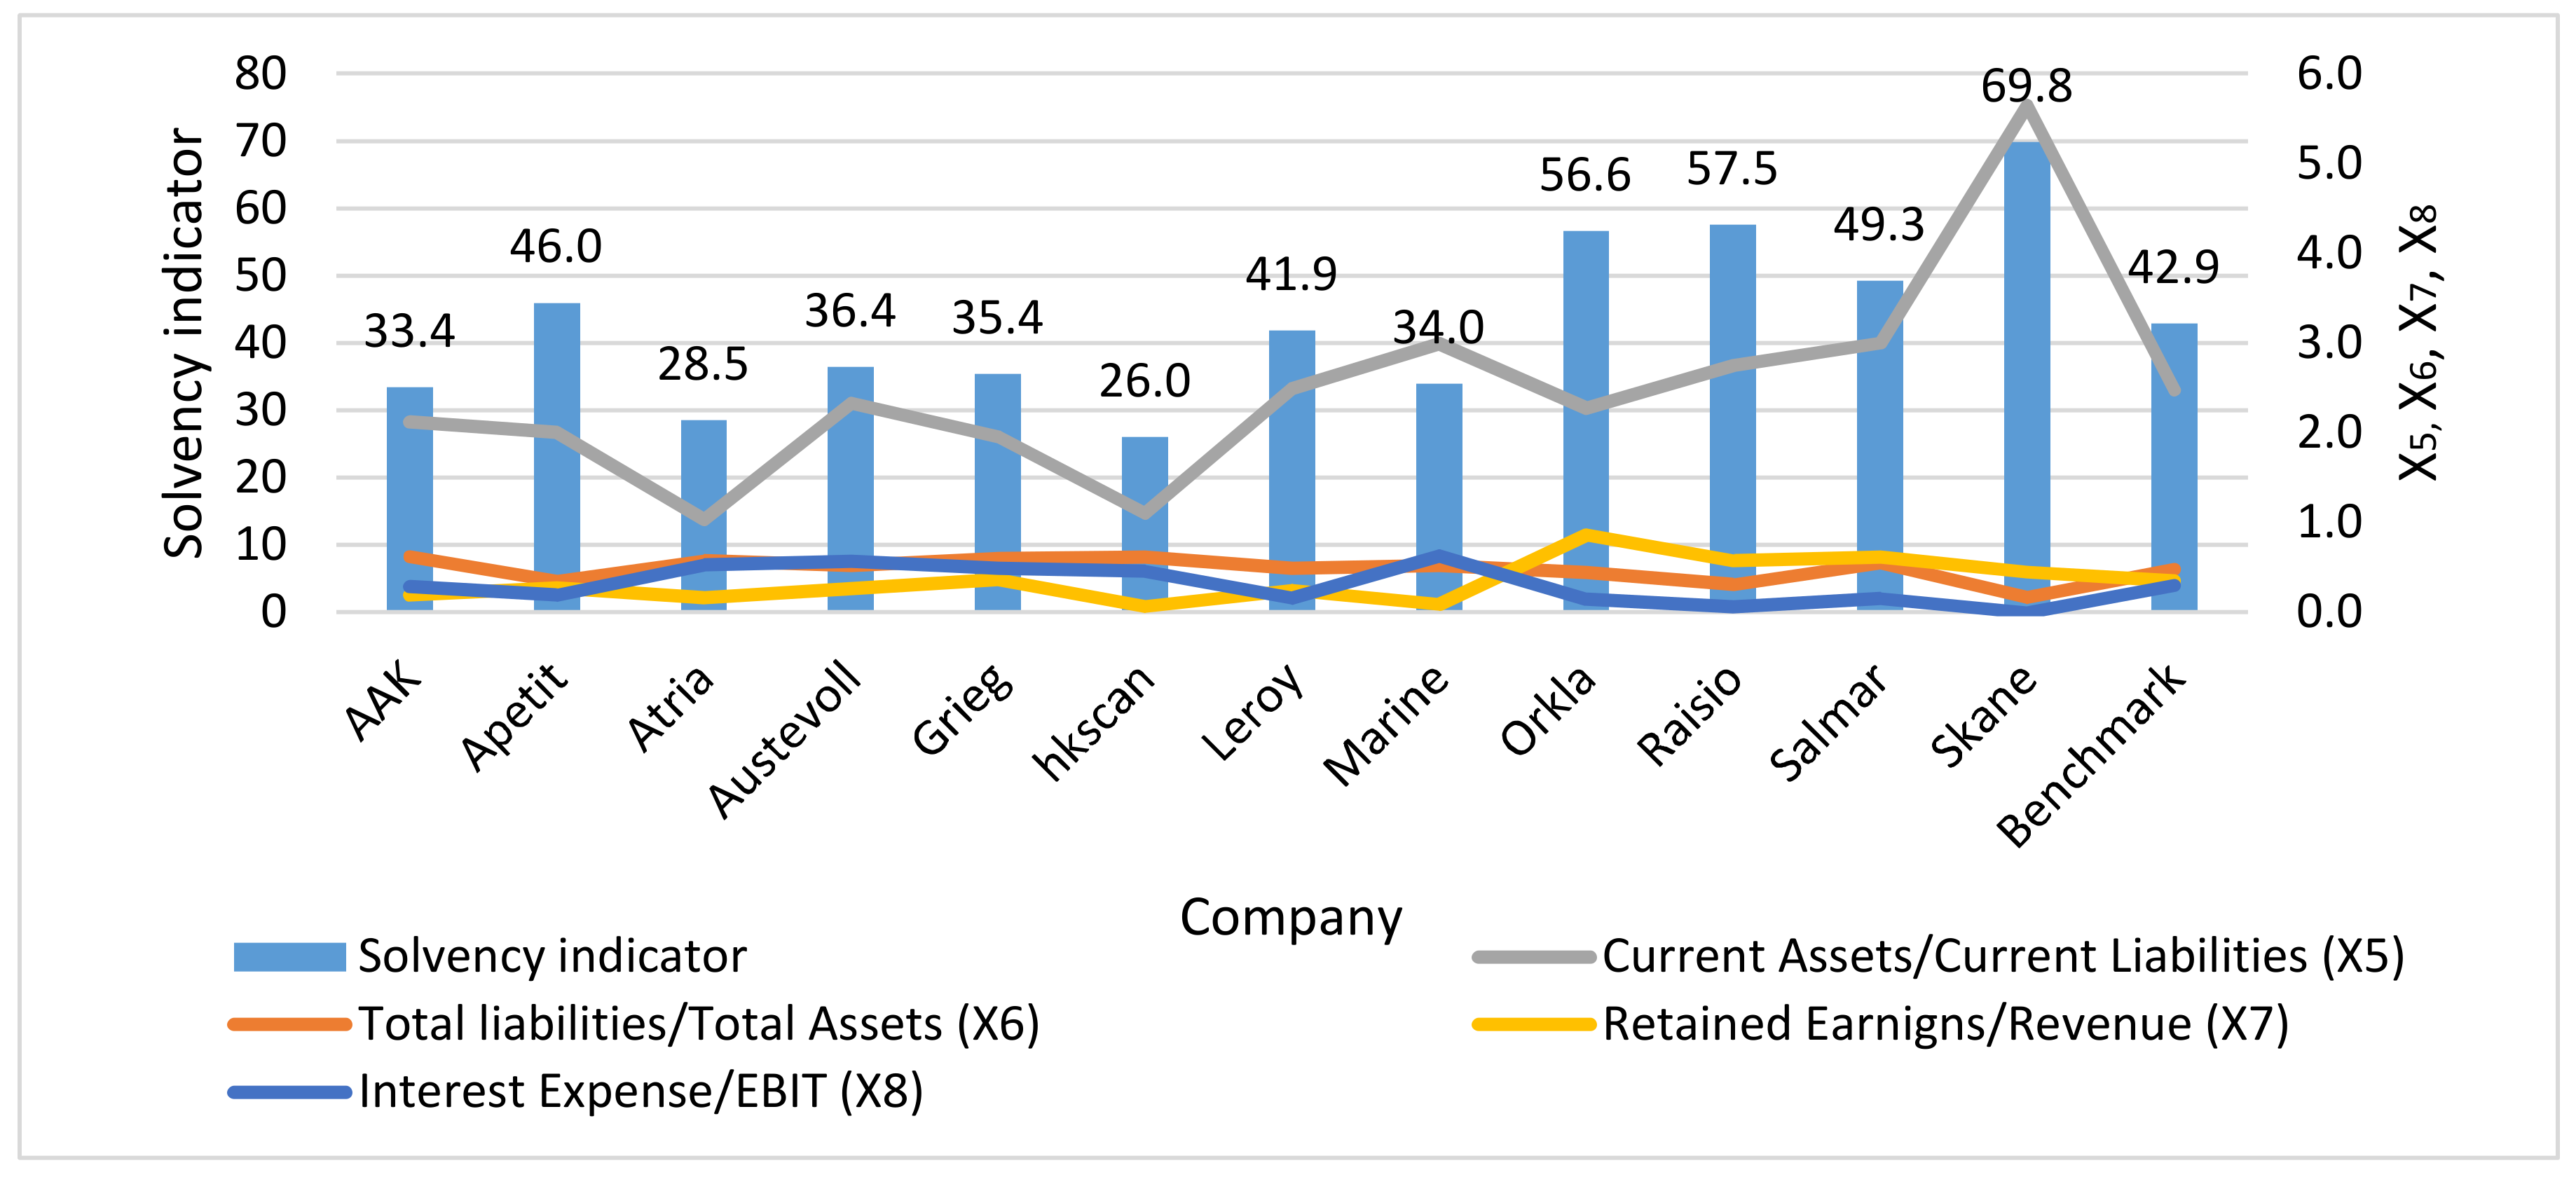
Basing on ratios (x5, x6, x7, x8) we noticed that food companies from Northern Europe demonstrated a high orientation on continuity (we use the term ‘solvency’ in further text) in 2005–2015 (Figure 3).
The current liquidity ratio (x5) fluctuated between 2.1 in 2005 and 2.8 in 2010, while its average value amounted to 2.5. High liquidity demonstrated an ability to cover expenses in the short-term. The average value of the debt ratio (x6) reached 47.9%. A minor difference (7.7 pp) between a maximum (52.8%) and a minimum (45.1%) value of the debt ratio in 2005–2015 gave evidence of a consistent financial policy of food companies. Considering such a trend, we explain high fluctuations of profitability by turbulence in the market environment and changes in operating efficiency rather than by modifications of capital structure. The share of retained earnings in revenue (x7), as well as the inverse interest coverage ratio (x8), are proxies for the ability of an entity to accumulate internal funds and regulate current obligations. The retained earnings ratio cyclically decreased from 35.7% in 2006 to 24.6% in 2008, from 37.8% in 2009 to 31.3% in 2011, and from 38.8% in 2012 to 32.7% in 2015. The average value of this ratio amounted to 34,4%. The retained earnings ratio demonstrated a negative relationship with the inverse interest coverage ratio that achieved a maximum in 2008 (66.0%) and a minimum in 2015 (17.4%), as well as the debt ratio. Hence, the reduction of retained earnings as a primary source of internal financing negatively influenced the financial sustainability of a business. Moreover, changes in the retained earnings ratio and the interest coverage ratio affected profitability: the net profit and retained earnings increased when the interest expense went down, and this strengthened the financial sustainability of business entities. This observation supports the pecking-order theory of capital structure.
3.2. Complex Indicators of Value and Solvency of Food Companies from Northern Europe
In the next step of the research, we estimate a complex indicator of the value of food companies from Northern Europe (Table 2). The synthetic index fluctuated in the range between 36.2 in 2008 and 46.5 in 2015, and its average value amounted to 41.7. Furthermore, the complex indicator rose from 36.2–44.8 in 2005–2012 to 42.4–46.5 in 2013–2015, which gave evidence of a growing value orientation in sample business entities.
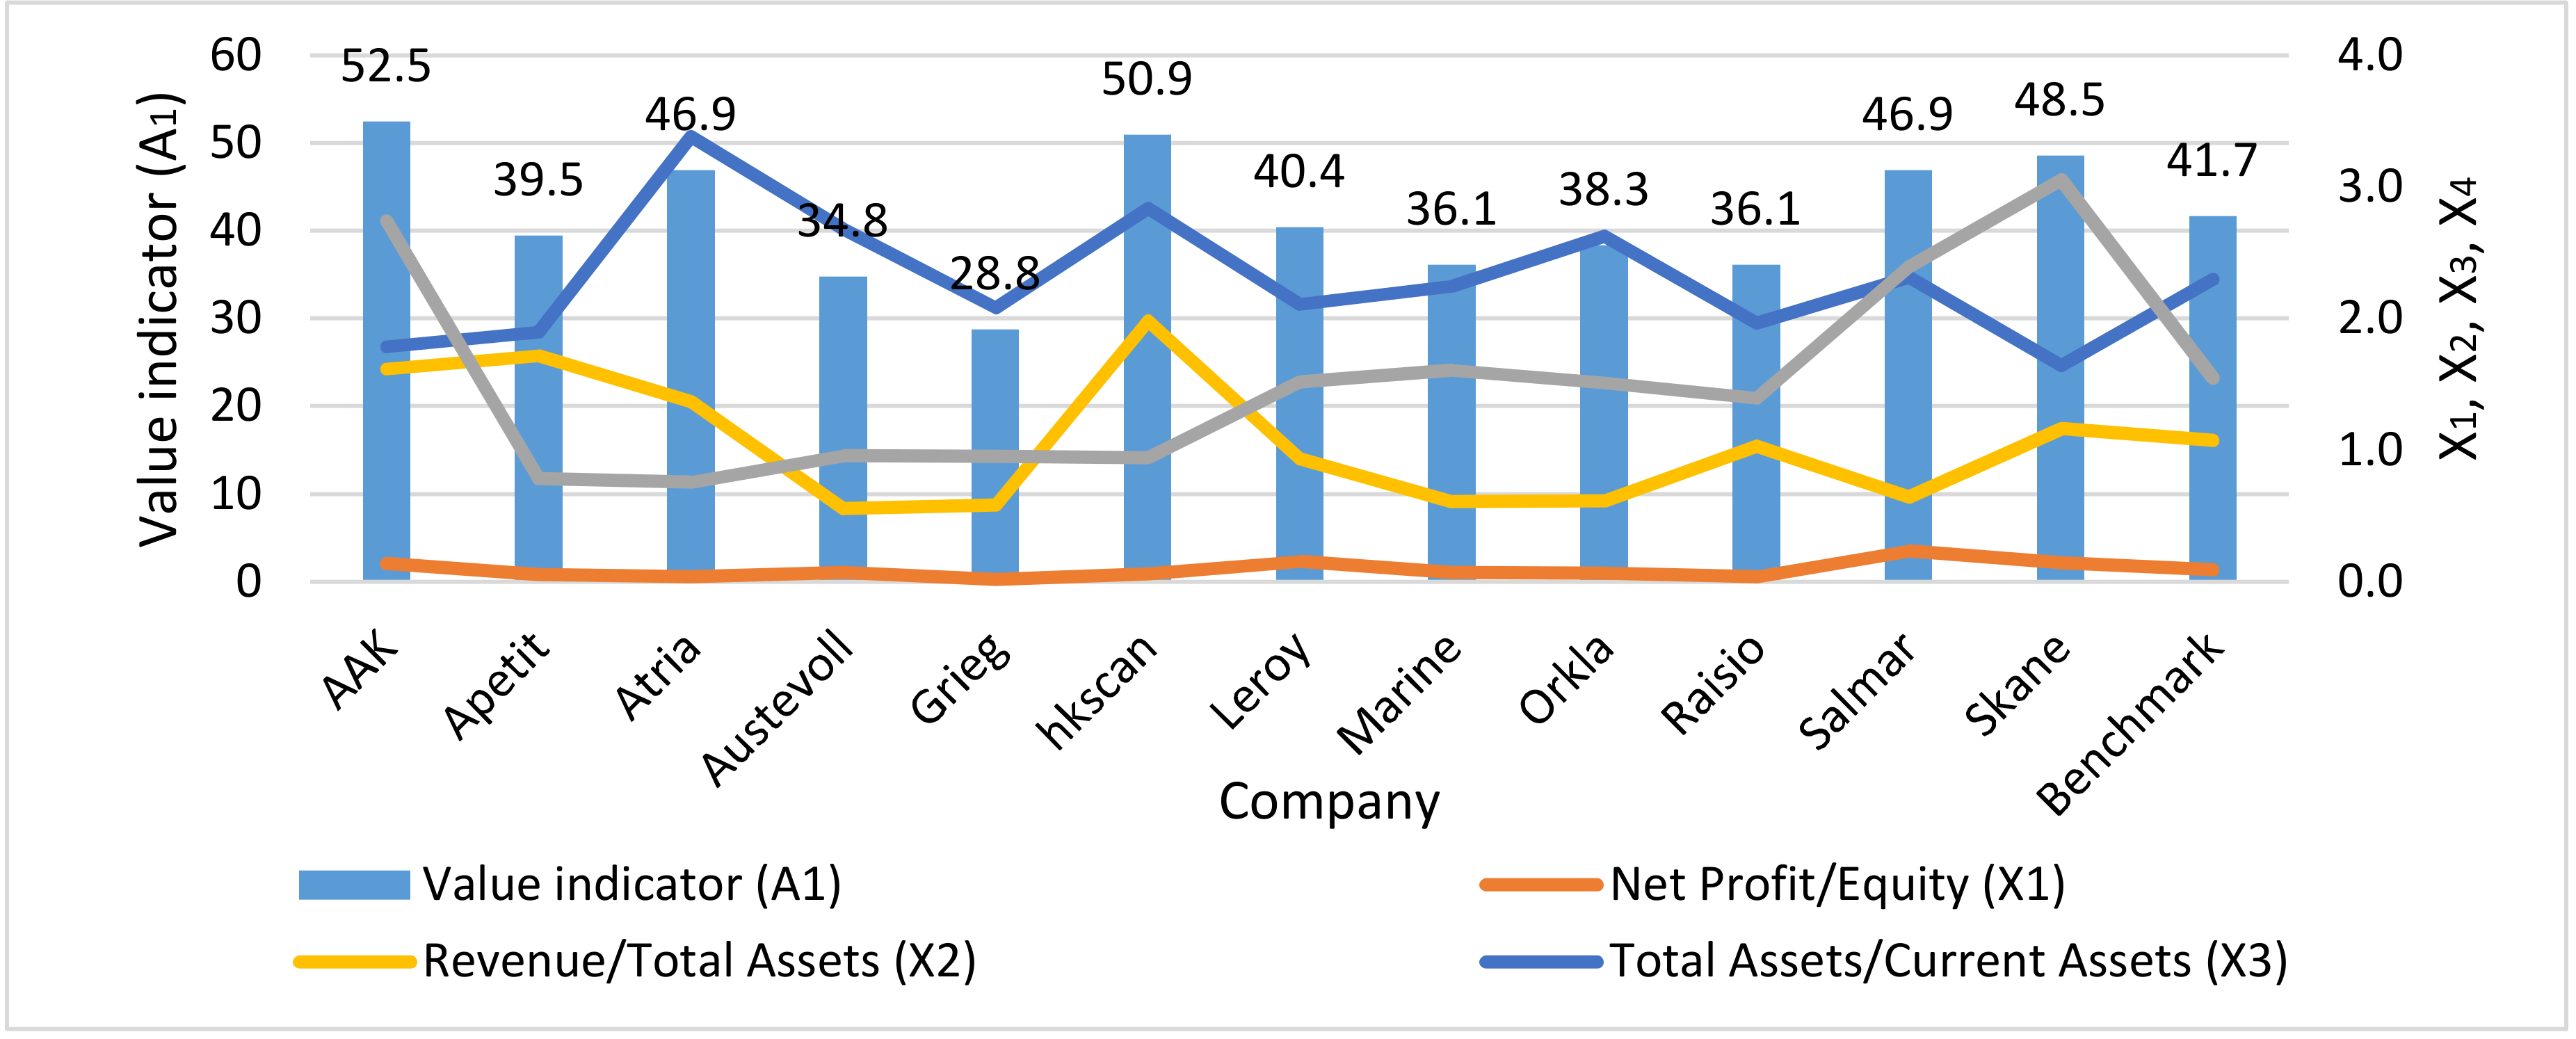
A visual presentation of the complex indicator of value (A1) and its components gives a more detailed view of a relationship between financial sustainability and value factors of food processing companies (Figure 4). We used the average value of the complex indicator in the sample group of companies as a benchmark. A group of business entities with comparatively high values of the complex indicator included AAK (52.5), Hkscan (50.9), and Skane (48.5). The profitability ratio of these companies ranged from 5.8% (Hkscan) to 14.5% (Skane), the market to book value ratio from 0.94 (Hkscan) to 3.05 (Skane), the total assets to current assets ratio from 1.64 (Skane) to 2.84 (Hkscan), and the productivity ratio from 1.17 (Skane) to 1.94 (Hkscan). Comparatively low values of indicators emerged in Grieg (28.8), Austevoll (34.8), Marine (36.1), and Raisio (36.1). The profitability of these companies fluctuated between 1.8% (Grieg) and 7.3% (Marine), the market to book value ratio between 0.95 (Grieg) and 1.61 (Marine), the total assets to current assets ratio between 1.96 (Raisio) and 2.68 (Austevoll), and the productivity ratio between 0.56 (Austevoll) and 1.03 (Raisio).
The complex indicator of solvency demonstrated the ability of food companies to meet their short-term and long-term obligations (Table 3). The growth of the complex indicator from the range 34.8–41.6 in 2005–2008 to 40.5–47.8 proved the overall increase of solvency in sample business entities.
We depict the relationship between the complex indicator of solvency and financial ratios of food companies from Northern Europe (Figure 5). The group of food companies with relatively high solvency indicators included Skane (69.8), Raisio (57.5), and Orkla (56.6). The range of the liquidity ratio in these companies was between 2.3 (Orkla) and 5.7 (Skane), the debt ratio between 16.6% (Skane) and 44.5% (Orkla), the retained earnings ratio between 45.3% (Skane) and 86.2% (Orkla), and the inverse interest coverage ratio between 1.0% (Skane) and 14.4% (Orkla). The companies with relatively low complex indicators of solvency were Hkscan (26.0), Atria (28.5), and AAK (33.4). The liquidity ratio in these business entities ranged from 1.0 (Atria) to 2.1 (AAK), the debt ratio from 57.7% (Atria) to 62.1% (AAK), the retained earnings ratio from 7.0% (Hkscan) to 19.2% (AAK), and the inverse interest coverage ratio from 28.6% (AAK) to 52.7% (Atria).
3.3. Complex Indicator of Financial Sustainability of Food Companies from Northern Europe
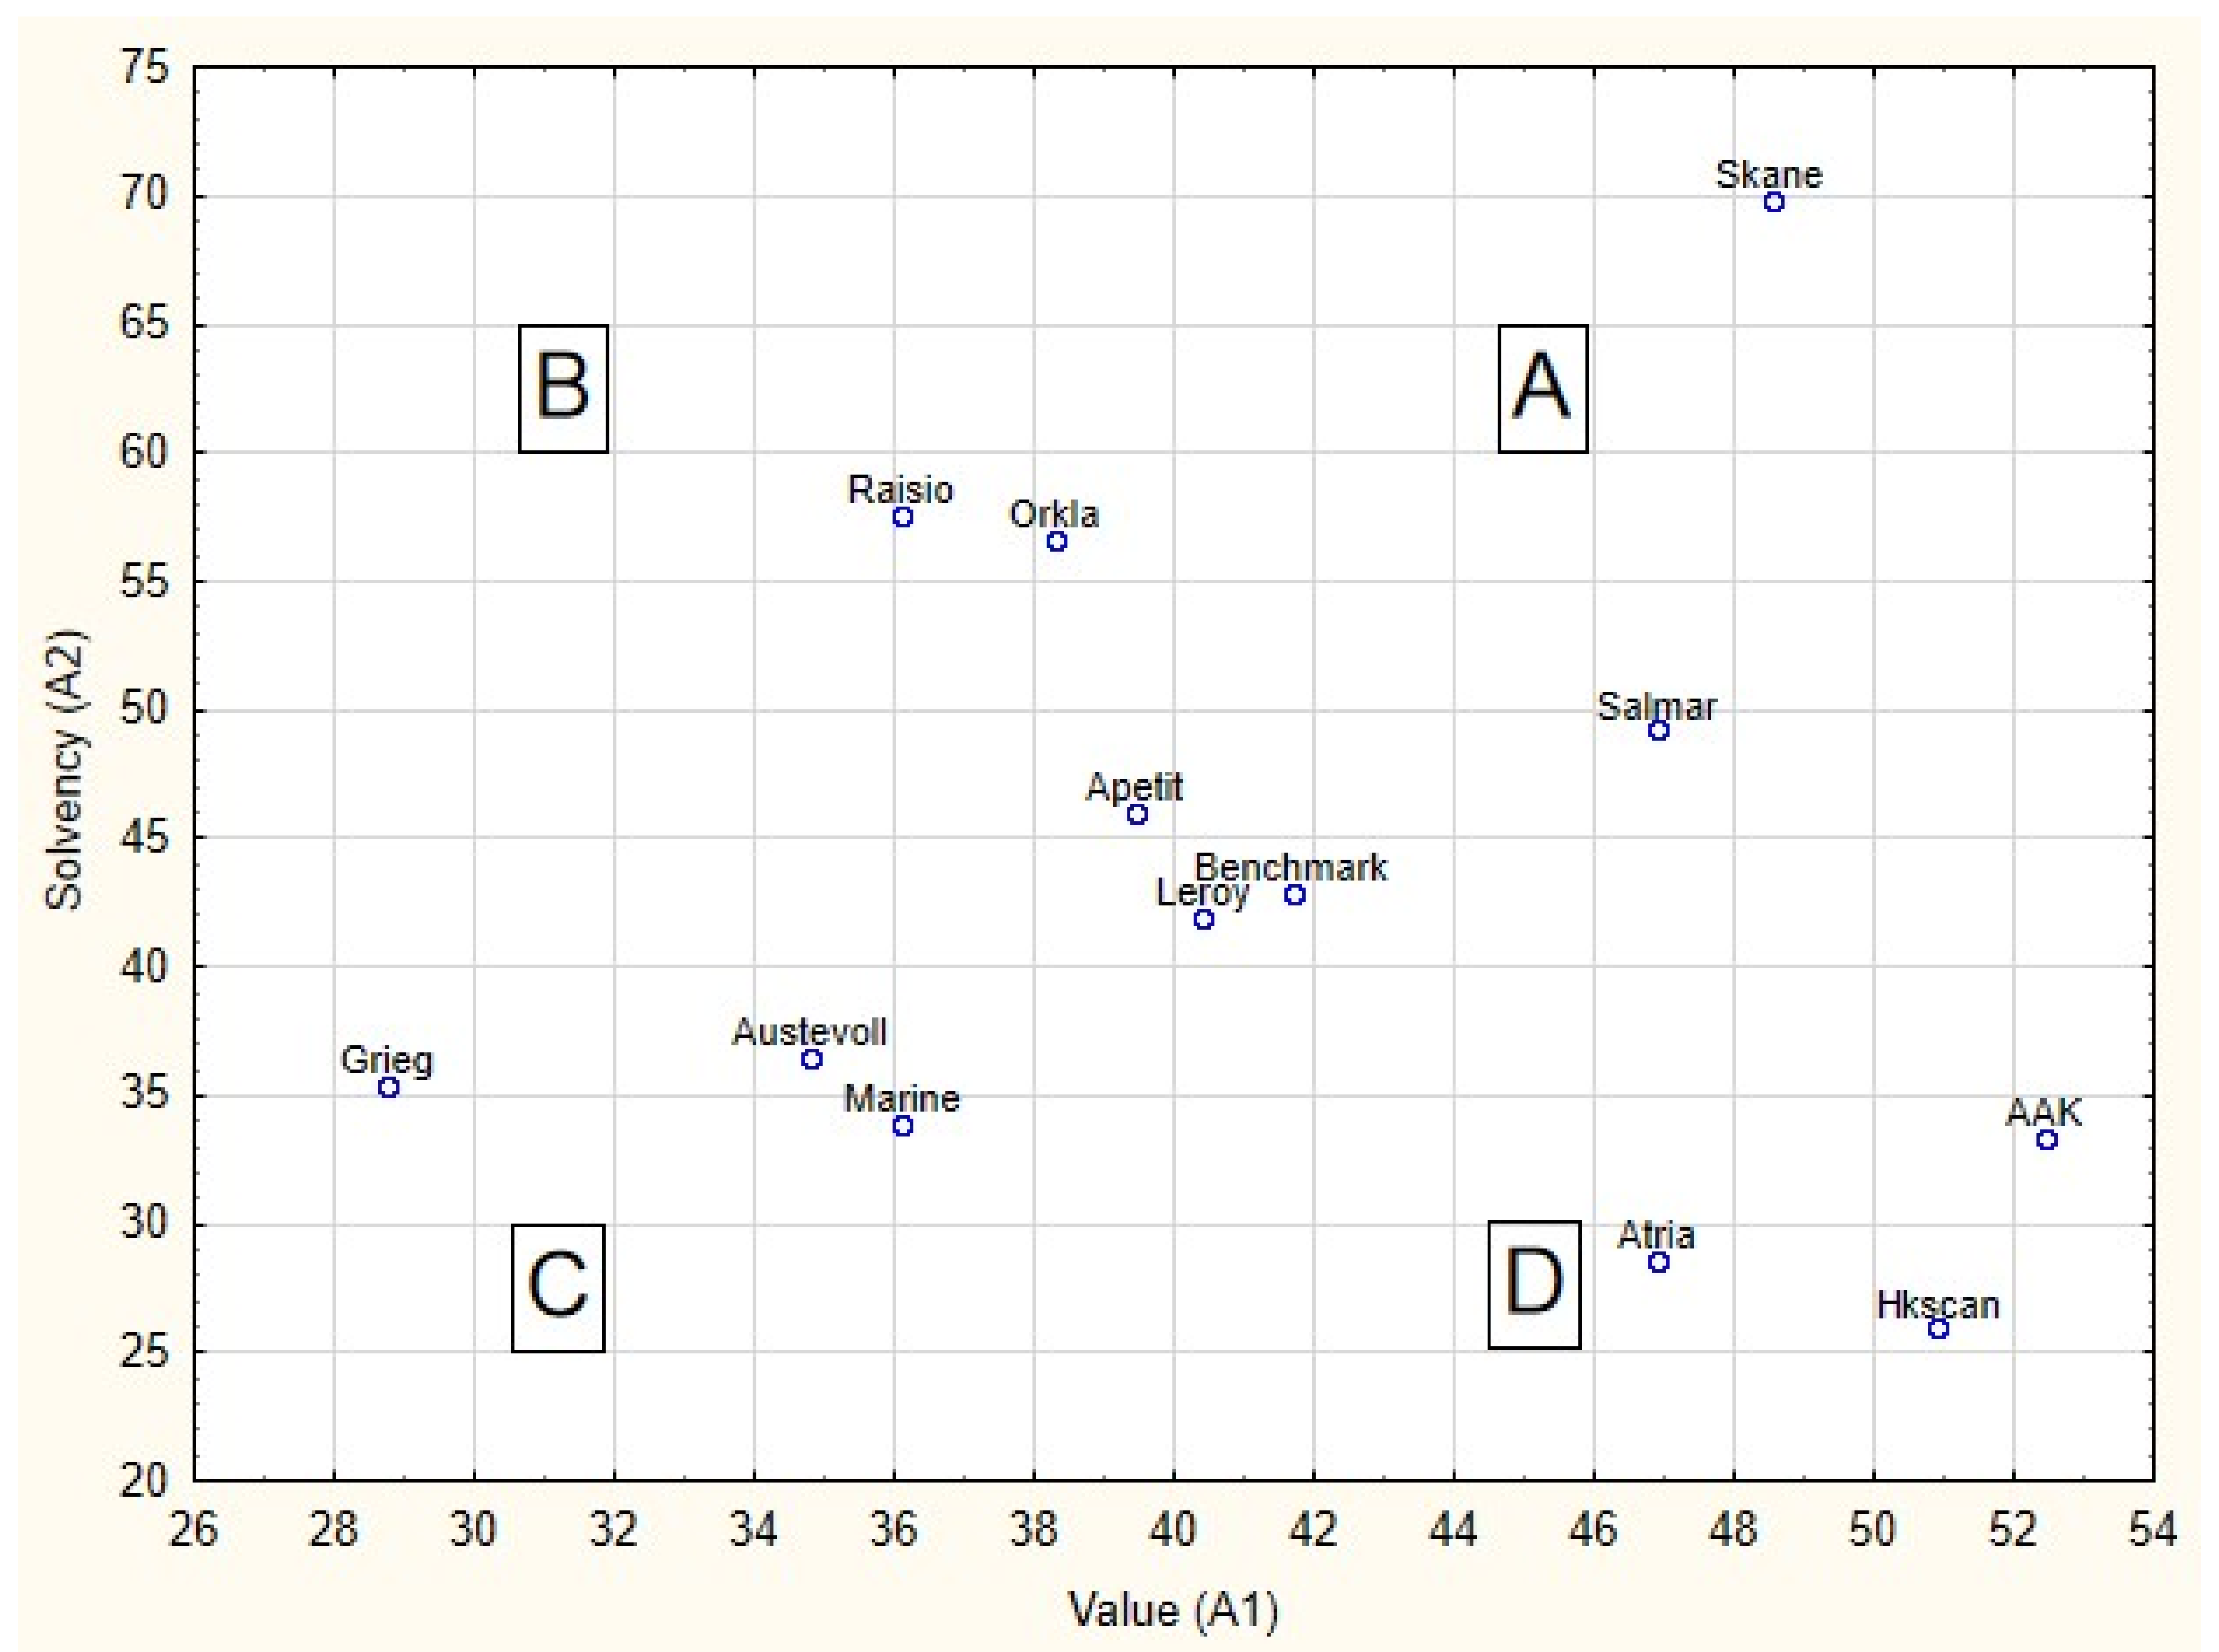
To depict the impact of various combinations of value and solvency on financial sustainability, we present the sample of food companies according to a distribution of values of particular complex indicators (Figure 6).
The horizontal axis illustrates the complex indicator of value, whereas the vertical axis demonstrates the indicator of solvency. Scenario A applies to such business entities as Skane and Salmar, as they retain a high value and comparatively high solvency. On the opposite side, companies Grieg, Austevoll, Marine, and Leroy represent a low value and solvency (scenario C). Scenario B is common for Raisio, Orkla, Apetit, and they retain a relatively high solvency and low value. Scenario D brings together such entities as Atria, Hkscan, and AAK that maximize their value but keep a low solvency. Both of these scenarios result in a moderate level of financial sustainability.
We use an additive function to aggregate vectors of value and solvency into one synthetic index and rank sample companies according to the level of financial sustainability (Table 4). The higher the value of the synthetic index, the better was the level of financial sustainability.
Using the average value of the synthetic index as a benchmark (42.3), we defined three groups of business entities. The first group included four companies with the highest level of financial sustainability (value of index 46.8–59.2 – companies Skane, Salmar, Orkla, and Raisio), the second group comprised three entities with the moderate level (value of index 41.2–42.9 – companies AAK, Apetit, and Leroy), and the third included five companies with the lowest level of financial sustainability (value of index 32.1–38.5 – companies Grieg, Hkscan, Atria, Austevoll, and Marine). We noted that the sole orientation of a business entity on value or solvency was not a sufficient condition to keep an appropriate level of financial sustainability. For example, such companies as Hkscan and AAK, despite a high value, demonstrated a low level of solvency that significantly decreased their overall financial sustainability. Hence, pursuing financial sustainability requires a viable multidimensional strategy that is to be implemented on all levels of a business organization.
We applied regression analysis to study the significance of the differences in the value of the complex indicator of financial sustainability in sample food companies from Northern Europe in 2005–2015 (Table 5). The value of the complex indicator was a dependent variable, while companies and time were independent dummy variables. We used a single time variable for 2005–2015 and the company Skane as a benchmark. The regression equation demonstrated the statistically significant joint impact of time and company dummy variables on the dependent variable. Moreover, the values of the complex indicator of financial sustainability of all sample companies were statistically different from the benchmark. Hence, we assumed that the level of financial sustainability was increasing over time (The value of the t-stat for time variable was 2.81, which is statistically significant at p = 0.05 level.) and differentiated the sample companies from food industry.
4. Discussion and Conclusions
The concept of financial sustainability of a business entity implies maintaining a financial policy, whereby managers can balance between risk and return without restricting benefits for different groups of stakeholders. We used fuzzy logic to build a relative aggregate measure of financial sustainability and evaluate the ambiguous effects of various factors of value and solvency on the financial sustainability of a firm. By applying the complex indicator of financial sustainability, we ranked food companies from Northern Europe according to the level of their financial sustainability. We also characterized the relationship between value and solvency within a financial sustainability framework of sample entities.
The complex indicator of financial sustainability consisted of eight financial factors that formed the vector of value and the vector of continuity of food companies. The sub-indicator of value grew when companies increased their profitability, market capitalization, and productive efficiency. The rise of liquidity and retained earnings, as well as the decrease of debt and interest expense, improved the sub-indicator of continuity of food companies. The unique combination of the values of the aforementioned financial factors and sub-indicators resulted in the aggregate value of the complex indicator of financial sustainability. Hence, companies with high sub-indicators of value and continuity demonstrated a high level of financial sustainability, while undervalued and insolvent entities with low values of sub-indicators had a low level of sustainability comparing to other firms. However, the exact level of financial sustainability of a company in a sample depended on the distribution of particular financial variables with ambiguous effects in terms of value and solvency.
According to the concept of weak sustainability, we assumed that the decrease in some factors of financial sustainability could be compensated by the increase in other factors [52,53]. Hence, two entities characterized by different combinations of partial financial factors that gave the equal aggregate value of a complex indicator would have the same level of financial sustainability. However, a more in-depth analysis of variables influencing financial sustainability delivered a detailed picture of a relationship between value and continuity of food companies from Northern Europe. Value ratios of food companies in the sample were significantly affected by various exogenous factors, including the business cycle, investors’ behavior, and institutional environment. Therefore, in 2005–2015, sample entities demonstrated a high volatility of profitability and market price and cyclical fluctuations in productivity and operating efficiency. The similar situation appeared in many other industries hurt by financial turbulences in the first decade of the XXI century [55]. Contraction of the assets turnover ratio and the profitability ratio additionally deteriorated the market value of food companies that remained at a relatively low level, comparing to their book value. These processes consequently suppressed the ability of firms to generate benefits for shareholders and reduced the level of their financial sustainability. The negative impact of decreasing profitability on the market value of the business was confirmed in the findings of other authors [56]. At the same time, sample entities maintained a high level of liquidity and held a target debt ratio. The retained earnings remained a significant source of financing for food companies, and the share of interest expense in operating profit gradually decreased in 2005–2015. The preference for internal sources of financing over external funds was typical for the entities in the agriculture and the food industry [57]. This gave evidence of a rising level of creditworthiness of food companies and had a positive influence on their financial sustainability. Considering the volatility and the decrease of the profitability ratios of sample entities in 2005–2015, they should focus on value and the operating efficiency of a business, rather than solvency and liquidity, to improve the overall level of financial sustainability.
Generally, the combinations of the vector of value and the vector of continuity pointed at an average level of financial sustainability of the majority of sample food companies from Northern Europe. However, these combinations of financial variables formed two major patterns of financial sustainability: The first one included the firms that were value-oriented and decreased their solvency, the second one referred to companies that maximized their solvency and reduced value. Such behavior also produced different risks for business entities, as value-oriented firms were subject to the cost of financial distress, while solvency-oriented units experienced problems with surplus liquidity and a higher cost of working capital. The nature of these sources of risk was broadly discussed in previous financial research [58]. We noticed that only a few companies from the sample approached the maximum level of financial sustainability, which means they managed to increase their value and solvency. Achieving such a goal was a difficult task, as many trade-offs between benefits and costs occur while managing financial resources [59]. Companies with a low level of financial sustainability significantly differed from the rest of the sample as they demonstrated low levels of profitability, solvency, and operating efficiency. The scarcity of sustainability indicated the deterioration of financial strategies that increased the risk of bankruptcy of these entities. Additionally, the regression analysis supported the hypothesis of significant differences in the level of financial sustainability of sample food companies in 2005–2015. Hence, the aggregate measure of financial sustainability proves to be a robust proxy for the multidimensional assessment of the financial situation of a business entity that can provide detailed information on different aspects of financial performance within a defined criterion of evaluation and according to information requirements of particular groups of stakeholders.
Our research constitutes a conceptual, theoretical approach to the financial sustainability of a firm and its measurement. Notably, by using a complex indicator, we can categorize business units according to the level of their financial sustainability. Further detailed analysis of financial indicators within a financial sustainability network enables to elaborate a financial strategy that would address the crucial issues of the relationship between value and solvency of a business. The limited research on financial sustainability, as well as the lack of evidence on the application of fuzzy logic and complex indicators for the assessment of value and solvency of a firm, makes it challenging to select the appropriate variables and construct an empirically robust model. However, we plan to extend our method and test chosen factors of financial sustainability by using a larger sample of food companies and applying a cross-country analysis in our research. We also intend to incorporate qualitative data into the concept of financial sustainability to depict the effects on non-financial variables and identify the channels of influence of particular groups of stakeholders on the financial sustainability of a firm.
Author Contributions
Conceptualization, S.Z. and M.W.; methodology, S.Z.; software, S.Z.; validation, S.Z., M.W.; formal analysis, S.Z.; investigation, S.Z.; resources, S.Z. and M.W.; data curation, S.Z.; writing—original draft preparation, S.Z. and M.W.; writing—review and editing, S.Z. and M.W.; visualization, S.Z.; supervision, S.Z. and M.W.; project administration, S.Z. and M.W.; funding acquisition, M.W.
Funding
This research received no external funding.
Conflicts of Interest
The authors declare no conflict of interest.
References
- Seuring, S.; Müller, M. From a literature review to a conceptual framework for sustainable supply chain management. J. Clean. Prod. 2008, 16, 1699–1710. [Google Scholar] [CrossRef]
- Bottani, E.; Gentilotti, M.C.; Rinaldi, M. A fuzzy logic-based tool for the assessment of corporate sustainability: A case study in the food machinery industry. Sustainability 2017, 9, 583. [Google Scholar] [CrossRef]
- Morelli, J. Environmental sustainability: A definition for environmental professionals. J. Environ. Sustain. 2013, 1, 1–9. [Google Scholar]
- Arrow, K.; Dasgupta, P.; Goulder, L.; Daily, G.; Ehrlich, P.; Heal, G.; Levin, S.; Mäler, K.-G.; Schneider, S.; Starrett, D.; et al. Are we consuming too much? J. Econ. Perspec. 2004, 18, 147–172. [Google Scholar] [CrossRef]
- Pezzey, J. Sustainable Development Concepts: An Economic Analysis; World Bank Environment Paper; No. 2; The World Bank: Washington, DC, USA, 1992. [Google Scholar]
- Markulev, A.; Long, A. On Sustainability: An Economic Approach, Productivity Commission Staff Research Note; Productivity Commission: Melbourne, Australia, 2013.
- Solow, R. Intergenerational equity and exhaustible resources. Rev. Econ. Stud. 1974, 41, 29–45. [Google Scholar] [CrossRef]
- Stiglitz, J. Growth with exhaustible natural resources: Efficient and optimal growth paths. Rev. Econ. Stud. 1974, 41, 123–137. [Google Scholar] [CrossRef]
- McKenzie, S. Social Sustainability: Towards Some Definitions; Hawke Research Institute, University of South Australia: Magill, Australia, 2004. [Google Scholar]
- UN World Commission on Environment and Development. Report of the World Commission on Environment and Development: Our Common Future: Environment & Society Portal. Available online: http://www.environmentandsociety.org/mml/un-world-commission-environment-and-development-ed-report-world-commission-environment-and (accessed on 3 August 2019).
- Thomas, L.-S.; Paranque, B. Finance and sustainability: From ideology to utopia. Int. Rev. Financ. Anal. 2018, 55, 80–92. [Google Scholar]
- Goerner, S.J.; Lietaer, B.; Ulanowicz, R.E. Quantifying economic sustainability: Implications for free-enterprise theory, policy and practice. Ecol. Econ. 2009, 69, 76–81. [Google Scholar] [CrossRef]
- Lagoarde-Segot, T. Diversifying finance research: From financialization to sustainability. Int. Rev. Financ. Anal. 2015, 39, 1–6. [Google Scholar] [CrossRef]
- Nier, E.; Yang, J.; Yorulmazer, T.; Alentorn, A. Network models and financial stability. J. Econ. Dyn. Control 2007, 31, 2033–2060. [Google Scholar] [CrossRef]
- Ashraf, S.; Félix, G.S.E.; Serrasqueiro, Z. Do traditional financial distress prediction models predict the early warning signs of financial distress? J. Risk Financ. Manag. 2019, 12, 55. [Google Scholar] [CrossRef]
- Samiloglu, F.; Demirgunes, K. The effect of working capital management on firm profitability: Evidence from Turkey. Int. J. Appl. Econ. Financ. 2008, 2, 445. [Google Scholar] [CrossRef]
- Modigliani, F.; Pogue, G.A. An introduction to risk and return: Concepts and evidence, part one. Financ. Anal. J. 1974, 30, 68–80. [Google Scholar] [CrossRef]
- Amini, M.; Bienstock, C.C. Corporate sustainability: An integrative definition and framework to evaluate corporate practice and guide academic research. J. Clean. Prod. 2014, 76, 12–19. [Google Scholar] [CrossRef]
- Sardaro, R.; Bozzo, F.; Petrillo, F.; Fucilli, V. Measuring the financial sustainability of vine landraces for better conservation programmes of Mediterranean agro-biodiversity. Land Use Policy 2017, 68, 160–167. [Google Scholar] [CrossRef]
- Podmioty Gospodarcze. Wyniki Finansowe. Available online: https://stat.gov.pl/obszary-tematyczne/podmioty-gospodarcze-wyniki-finansowe/ (accessed on 15 August 2019).
- Henning, J.I.F.; Jordaan, H. Determinants of financial sustainability for farm credit applications—A Delphi study. Sustainability 2016, 8, 77. [Google Scholar] [CrossRef]
- Soppe, A. Sustainable Corporate Finance. J. Bus. Eth. 2004, 53, 213–224. [Google Scholar] [CrossRef]
- Jensen, M.C. Value Maximization, Stakeholder Theory, and the Corporate Objective Function. J. Appl. Corp. Financ. 2001, 14, 8–21. [Google Scholar] [CrossRef]
- Muscettola, M.; Naccarato, F. The Casual Relationship Between Debt and Profitability: The Case of Italy. Athens J. Bus. Econ. 2015, 2, 17–32. [Google Scholar] [CrossRef]
- Singh, P.; Kumar, B. Trade-off Theory vs Pecking Order Theory Revisited: Evidence from India. J. Emerg. Mark. Financ. 2012, 11, 145–159. [Google Scholar] [CrossRef]
- Asonuma, A.; Papaioannou, M.G.; Peraza, G.; Vitola, K.; Tsuda, T. Sovereign debt restructurings in Belize: Debt sustainability and financial stability aspects. J. Bank. Financ. Econ. 2017, 2, 52–56. [Google Scholar] [CrossRef]
- Palmer, E. Financial sustainability of swedish welfare commitments. Public Policy Rev. 2014, 10, 253–276. [Google Scholar]
- Financing for Sustainable Development Report; The Inter-agency Task Force on Financing for Development United Nations: New York, NY, USA, 2019.
- Gambetta, N.; Azadian, P.; Hourcade, V.; Reyes, M.E. The Financing framework for sustainable development in emerging economies: The case of Uruguay. Sustainability 2019, 11, 1059. [Google Scholar] [CrossRef]
- Fila, J. Microfinance institutions in Poland—towards preventing social and financial exclusion. Econ. Environ. Stud. 2018, 18, 531–549. [Google Scholar] [CrossRef]
- Santis, P.; Albuquerque, A.; Lizarelli, F. Do sustainable companies have a better financial performance? A study on Brazilian public companies. J. Clean. Prod. 2016, 133, 735–745. [Google Scholar] [CrossRef]
- Sontag-Padilla, L.; Staplefoote, B.L.; Gonzalez Morganti, K. Financial Sustainability for Nonprofit Organizations. A Review of the Literature; Health and Rand Education: Santa Monica, CA, USA, 2012. [Google Scholar]
- Jansik, C.; Irz, X. Competitiveness of dairy farms in Northern Europe: A cross-country analysis. Agric. Food Sci. 2015, 24, 206–218. [Google Scholar] [CrossRef]
- Myšková, R.; Hájek, P. Comprehensive assessment of firm financial performance using financial ratios and linguistic analysis of annual reports. J. Int. Stud. 2017, 10, 96–108. [Google Scholar] [CrossRef] [PubMed] [Green Version]
- Delas, V.; Nosova, E.; Yafinovych, O. Financial security of enterprises. Procedia Econ. Financ. 2015, 27, 248–266. [Google Scholar] [CrossRef]
- Matson, J.; Thayer, J.; Shaw, J. Running a Food Hub: Assessing Financial Viability; United States Department of Agriculture: Washington, DC, USA, 2016.
- Koleda, N.; Oganisjana, K. Challenges in learning for company‘s financial viability assessment and management. Bus. Theory Pract. 2015, 16, 195–204. [Google Scholar] [CrossRef]
- Beaver, W.H. Financial Ratios as predictors of failure. J. Account. Res. 1966, 4, 71. [Google Scholar] [CrossRef]
- Ohlson, J.A. Financial ratios and the probabilistic prediction of bankruptcy. J. Account. Res. 1980, 18, 109. [Google Scholar] [CrossRef]
- Hosaka, T. Bankruptcy prediction using imaged financial ratios and convolutional neural networks. Expert Syst. Appl. 2019, 117, 287–299. [Google Scholar] [CrossRef]
- Altman, E.I. Financial ratios, discriminant analysis and the prediction of corporate bankruptcy. J. Financ. 1968, 23, 589–609. [Google Scholar] [CrossRef]
- Li, L.; Faff, R. Predicting corporate bankruptcy: What matters? Int. Rev. Econ. Financ. 2019, 62, 1–19. [Google Scholar] [CrossRef]
- Cleary, S. The Relationship between Firm Investment and Financial Status. J. Financ. 1999, 54, 673–692. [Google Scholar] [CrossRef]
- Bobinaite, V. Financial sustainability of wind electricity sectors in the Baltic States. Renew. Sustain. Energy Rev. 2015, 47, 794–815. [Google Scholar] [CrossRef]
- Sanz, L. Hospital Clínica Bíblica: Financial strategy for sustainable growth. J. Bus. Res. 2016, 69, 3905–3909. [Google Scholar] [CrossRef]
- Henock, M.S. Financial sustainability and outreach performance of saving and credit cooperatives: The case of Eastern Ethiopia. Asia Pac. Manag. Rev. 2019, 24, 1–9. [Google Scholar] [CrossRef]
- Schwab, L.; Gold, S.; Reiner, G. Exploring financial sustainability of SMEs during periods of production growth: A simulation study. Int. J. Prod. Econ. 2019, 212, 8–18. [Google Scholar] [CrossRef]
- Gryglewicz, S. A theory of corporate financial decisions with liquidity and solvency concerns. J. Financ. Econ. 2011, 99, 365–384. [Google Scholar] [CrossRef]
- Diakoulaki, D.; Mavrotas, G.; Papayannakis, L. A multicriteria approach for evaluating the performance of industrial firms. Omega 1992, 20, 467–474. [Google Scholar] [CrossRef]
- Diantimala, Y. The mediating effect of sustainability disclosure on the relationship between financial performance and firm value. J. Account. Financ. Audit. Stud. 2018, 4, 32–48. [Google Scholar]
- Nasibov, E.N. Fuzzy Logic in statistical data analysis. In International Encyclopedia of Statistical Science; Lovric, M., Ed.; Springer: Berlin/Heidelberg, Germany, 2011; pp. 558–563. ISBN 9783-6420-48982. [Google Scholar]
- Chen, Q.; Sipiläinen, T.; Sumelius, J. Assessment of agri-environmental externalities at regional levels in Finland. Sustainability 2014, 6, 3171–3191. [Google Scholar] [CrossRef]
- Cabeza Gutes, M. The concept of weak sustainability. Ecol. Econ. 1996, 17, 147–156. [Google Scholar] [CrossRef]
- Kraus, A.; Litzenberger, R.H. A state-preference model of optimal financial leverage. J. Financ. 1973, 28, 911–922. [Google Scholar] [CrossRef]
- De la O, M.; Jareño, F.F.; Skinner, F.S. The financial crisis impact: An industry level analysis of the us stock market González. Appl. Econom. Int. Dev. 2017, 17, 61–74. [Google Scholar]
- Hirschey, M.; Wichern, W. Accounting and market-value measures of profitability: Consistency, determinants, and uses. J. Bus. Econ. Stat. 1984, 2, 375–383. [Google Scholar]
- Mądra, M. The capital structure and determinants which influence on agricultural farms performance. Equilib. Quart. J. Econ. Econ. Policy. 2008, 1, 171–182. [Google Scholar] [CrossRef]
- Pindado, J.; Fernandes Rodrigues, L. Determinants of Financial Distress Costs; Social Science Research Network: Rochester, NY, USA, 2006. [Google Scholar]
- Abel, A.B. Optimal debt and profitability in the trade-off theory. J. Financ. 2018, 73, 95–143. [Google Scholar] [CrossRef]
Figure 1.
The relationship between value and continuity of business.

Figure 2.
Financial factors of the value of food companies from Northern Europe.

Figure 3.
Financial factors of the solvency of food companies from Northern Europe.

Figure 4.
The complex indicator of value versus financial ratios of food companies from Northern Europe.
Figure 4.
The complex indicator of value versus financial ratios of food companies from Northern Europe.

Figure 5.
The complex indicator of solvency versus financial ratios of food companies from Northern Europe.
Figure 5.
The complex indicator of solvency versus financial ratios of food companies from Northern Europe.

Figure 6.
Relationship between value and solvency within a financial sustainability framework of food companies from Northern Europe.
Figure 6.
Relationship between value and solvency within a financial sustainability framework of food companies from Northern Europe.


Table 1.
Factors of financial sustainability of a business entity.
| Factor | Construction | Vector |
|---|---|---|
| X1 | Net Profit/Equity | Value |
| X2 | Total Assets/Current Assets | Value |
| X3 | Price/Book Value | Value |
| X4 | Revenue/Total Assets | Value |
| X5 | Current Assets/Current Liabilities | Continuity |
| X6 | Total Liabilities/Total Assets | Continuity |
| X7 | Retained Earnings/Revenue | Continuity |
| X8 | Interest Expense/EBIT | Continuity |
Table 2.
The complex indicator of value (A1) of food companies from Northern Europe.
| Company | Ratio | |||||||||||
|---|---|---|---|---|---|---|---|---|---|---|---|---|
| 2005 | 2006 | 2007 | 2008 | 2009 | 2010 | 2011 | 2012 | 2013 | 2014 | 2015 | Average | |
| AAK | 49.8 | 56.1 | 44.7 | 43.9 | 54.5 | 49.1 | 51.1 | 53.7 | 60.4 | 54.9 | 59.0 | 52.5 |
| Apetit | 46.8 | 36.7 | 37.9 | 42.1 | 35.2 | 37.6 | 40.5 | 36.8 | 42.6 | 41.1 | 36.8 | 39.5 |
| Atria | 51.2 | 47.6 | 51.4 | 42.1 | 40.3 | 39.9 | 42.6 | 46.3 | 46.7 | 50.7 | 57.2 | 46.9 |
| Austevoll | 34.8 | 38.6 | 49.8 | 31.0 | 36.6 | 35.8 | 31.4 | 28.7 | 29.2 | 33.8 | 33.1 | 34.8 |
| Grieg | - | 28.8 | 27.9 | 11.2 | 29.4 | 37.1 | 21.9 | 25.5 | 36.8 | 35.9 | 33.1 | 28.8 |
| Hkscan | 52.3 | 56.9 | 51.3 | 47.6 | 51.6 | 45.4 | 49.2 | 46.6 | 47.4 | 58.3 | 53.5 | 50.9 |
| Leroy | 52.3 | 47.4 | 38.3 | 34.3 | 38.6 | 42.0 | 32.6 | 34.6 | 39.5 | 42.6 | 42.5 | 40.4 |
| Marine | 39.9 | 32.1 | 31.2 | 17.6 | 37.0 | 41.2 | 34.5 | 36.6 | 37.7 | 44.6 | 44.9 | 36.1 |
| Orkla | 38.6 | 39.6 | 40.5 | 30.9 | 32.6 | 28.5 | 30.0 | 29.6 | 45.2 | 49.8 | 56.1 | 38.3 |
| Raisio | 29.6 | 25.4 | 30.9 | 34.8 | 31.8 | 31.4 | 36.0 | 39.1 | 44.3 | 46.9 | 46.7 | 36.1 |
| Salmar | - | 46.9 | 53.3 | 43.6 | 48.8 | 52.1 | 38.4 | 38.8 | 42.8 | 51.5 | 52.6 | 46.9 |
| Skane | 52.3 | 55.4 | 49.1 | 55.0 | 55.1 | 57.7 | 51.9 | 40.9 | 36.6 | 37.2 | 42.6 | 48.5 |
| Average | 44.8 | 42.6 | 42.2 | 36.2 | 41.0 | 41.5 | 38.3 | 38.1 | 42.4 | 45.6 | 46.5 | 41.7 |
Table 3.
The complex indicator of solvency (A2) of food companies from Northern Europe.
| Company | Ratio | |||||||||||
|---|---|---|---|---|---|---|---|---|---|---|---|---|
| 2005 | 2006 | 2007 | 2008 | 2009 | 2010 | 2011 | 2012 | 2013 | 2014 | 2015 | Average | |
| AAK | 36.0 | 30.4 | 30.1 | 8.1 | 35.4 | 35.5 | 35.5 | 37.4 | 39.0 | 39.6 | 40.5 | 33.4 |
| Apetit | 36.5 | 39.3 | 39.5 | 44.5 | 57.8 | 52.8 | 52.8 | 43.2 | 48.1 | 46.6 | 44.4 | 46.0 |
| Atria | 33.1 | 31.0 | 34.6 | 28.0 | 29.9 | 25.3 | 18.4 | 28.5 | 24.1 | 29.7 | 31.5 | 28.5 |
| Austevoll | 36.4 | 41.2 | 22.8 | 24.7 | 33.2 | 39.5 | 39.9 | 36.7 | 42.3 | 41.8 | 42.4 | 36.4 |
| Grieg | - | 35.4 | 31.0 | 17.9 | 23.8 | 51.2 | 41.3 | 48.7 | 46.6 | 36.4 | 22.0 | 35.4 |
| hkscan | 30.1 | 30.2 | 22.9 | 18.6 | 28.4 | 22.9 | 18.5 | 19.2 | 29.0 | 34.1 | 32.3 | 26.0 |
| Leroy | 38.6 | 37.2 | 38.3 | 32.9 | 42.1 | 46.7 | 41.5 | 42.7 | 47.5 | 47.0 | 46.5 | 41.9 |
| Marine | 32.6 | 34.5 | 24.3 | 17.4 | 42.6 | 42.5 | 32.7 | 30.5 | 48.0 | 33.0 | 35.6 | 34.0 |
| Orkla | 48.4 | 59.4 | 57.9 | 48.1 | 61.7 | 58.1 | 57.5 | 59.2 | 58.4 | 58.1 | 56.4 | 56.6 |
| Raisio | 62.5 | 63.2 | 62.2 | 62.2 | 71.7 | 60.8 | 50.7 | 52.3 | 51.7 | 46.9 | 48.6 | 57.5 |
| Salmar | - | 49.3 | 54.8 | 46.2 | 53.4 | 51.7 | 39.5 | 40.1 | 56.7 | 50.9 | 50.2 | 49.3 |
| Skane | 62.2 | 68.4 | 59.2 | 68.9 | 63.1 | 70.4 | 57.4 | 85.5 | 82.5 | 76.6 | 74.0 | 69.8 |
| Average | 41.6 | 43.3 | 39.8 | 34.8 | 45.2 | 46.4 | 40.5 | 43.7 | 47.8 | 45.1 | 43.7 | 42.9 |
Table 4.
The complex indicator of financial sustainability of food companies from Northern Europe.
| Company | Complex Indicator | |||||||||||
|---|---|---|---|---|---|---|---|---|---|---|---|---|
| 2005 | 2006 | 2007 | 2008 | 2009 | 2010 | 2011 | 2012 | 2013 | 2014 | 2015 | Average | |
| AAK | 42.9 | 43.2 | 37.4 | 26.0 | 45.0 | 42.3 | 43.3 | 45.6 | 49.7 | 47.3 | 49.8 | 42.9 |
| Apetit | 41.6 | 38.0 | 38.7 | 43.3 | 46.5 | 45.2 | 46.7 | 40.0 | 45.3 | 43.9 | 40.6 | 42.7 |
| Atria | 42.1 | 39.3 | 43.0 | 35.0 | 35.1 | 32.6 | 30.5 | 37.4 | 35.4 | 40.2 | 44.4 | 37.7 |
| Austevoll | 35.6 | 39.9 | 36.3 | 27.8 | 34.9 | 37.6 | 35.6 | 32.7 | 35.8 | 37.8 | 37.8 | 35.6 |
| Grieg | - | 32.1 | 29.5 | 14.6 | 26.6 | 44.1 | 31.6 | 37.1 | 41.7 | 36.2 | 27.6 | 32.1 |
| hkscan | 41.2 | 43.6 | 37.1 | 33.1 | 40.0 | 34.2 | 33.9 | 32.9 | 38.2 | 46.2 | 42.9 | 38.5 |
| Leroy | 45.4 | 42.3 | 38.3 | 33.6 | 40.3 | 44.3 | 37.1 | 38.7 | 43.5 | 44.8 | 44.5 | 41.2 |
| Marine | 36.3 | 33.3 | 27.8 | 17.5 | 39.8 | 41.9 | 33.6 | 33.5 | 42.8 | 38.8 | 40.2 | 35.0 |
| Orkla | 43.5 | 49.5 | 49.2 | 39.5 | 47.1 | 43.3 | 43.7 | 44.4 | 51.8 | 53.9 | 56.3 | 47.5 |
| Raisio | 46.0 | 44.3 | 46.5 | 48.5 | 51.8 | 46.1 | 43.4 | 45.7 | 48.0 | 46.9 | 47.6 | 46.8 |
| Salmar | - | 48.1 | 54.0 | 44.9 | 51.1 | 51.9 | 39.0 | 39.5 | 49.7 | 51.2 | 51.4 | 48.1 |
| Skane | 57.2 | 61.9 | 54.1 | 61.9 | 59.1 | 64.1 | 54.7 | 63.2 | 59.6 | 56.9 | 58.3 | 59.2 |
| Average | 43.2 | 43.0 | 41.0 | 35.5 | 43.1 | 44.0 | 39.4 | 40.9 | 45.1 | 45.3 | 45.1 | 42.3 |
Table 5.
Analysis of statistical differences for the level of financial sustainability in food companies from Northern Europe.
Table 5.
Analysis of statistical differences for the level of financial sustainability in food companies from Northern Europe.
| Variable | Coefficient | Standard Error | t Stat | p-Value |
|---|---|---|---|---|
| Intercept | 56.8 | 1.71 | 33.22 | 0.00 |
| Time | 0.4 | 0.14 | 2.81 | 0.01 |
| AAK | −16.2 | 2.11 | −7.69 | 0.00 |
| Apetit | −16.5 | 2.11 | −7.80 | 0.00 |
| Atria | −21.5 | 2.11 | −10.16 | 0.00 |
| Austevoll | −23.6 | 2.11 | −11.16 | 0.00 |
| Grieg | −27.3 | 2.16 | −12.61 | 0.00 |
| hkscan | −20.7 | 2.11 | −9.81 | 0.00 |
| Leroy | −18.0 | 2.11 | −8.54 | 0.00 |
| Marine | −24.1 | 2.11 | −11.43 | 0.00 |
| Orkla | −11.7 | 2.11 | −5.55 | 0.00 |
| Raisio | −12.4 | 2.11 | −5.86 | 0.00 |
| Salmar | −11.3 | 2.16 | −5.22 | 0.00 |
Number of observations = 130, F = 22.79, significance F = 0.00.
© 2019 by the authors. Licensee MDPI, Basel, Switzerland. This article is an open access article distributed under the terms and conditions of the Creative Commons Attribution (CC BY) license (http://creativecommons.org/licenses/by/4.0/).
Share and Cite
MDPI and ACS Style
Zabolotnyy, S.; Wasilewski, M. The Concept of Financial Sustainability Measurement: A Case of Food Companies from Northern Europe. Sustainability 2019, 11, 5139. https://0-doi-org.brum.beds.ac.uk/10.3390/su11185139
AMA Style
Zabolotnyy S, Wasilewski M. The Concept of Financial Sustainability Measurement: A Case of Food Companies from Northern Europe. Sustainability. 2019; 11(18):5139. https://0-doi-org.brum.beds.ac.uk/10.3390/su11185139
Chicago/Turabian StyleZabolotnyy, Serhiy, and Mirosław Wasilewski. 2019. "The Concept of Financial Sustainability Measurement: A Case of Food Companies from Northern Europe" Sustainability 11, no. 18: 5139. https://0-doi-org.brum.beds.ac.uk/10.3390/su11185139
Note that from the first issue of 2016, this journal uses article numbers instead of page numbers. See further details here.