Article

Hydrologic Alteration at the Upper and Middle Part of the Yangtze River, China: Towards Sustainable Water Resource Management Under Increasing Water Exploitation

1
College of Hydraulic and Environmental Engineering, China Three Gorges University, Yichang 443002, China
2
Department of Petroleum, Koya Technical Institute, Erbil Polytechnic University, Erbil 44001, Kurdistan, Iraq
3
CERIS, Instituto Superior Tecnico, Universidade de Lisboa, 1049-001 Lisbon, Portugal
4
Department of Environmental Engineering, College of Engineering, Knowledge University, Erbil 44001, Kurdistan, Iraq
5
School of Technology, IIia State University, Tbilisi 0162, Georgia
*
Author to whom correspondence should be addressed.
Sustainability 2019, 11(19), 5176; https://0-doi-org.brum.beds.ac.uk/10.3390/su11195176
Submission received: 15 August 2019 / Revised: 13 September 2019 / Accepted: 18 September 2019 / Published: 20 September 2019

Abstract

:
The human influence on the river ecosystem has increased in recent years to feed the growing demand for water to communities by constructing different water structures. It is essential to understand the potential impacts of water structures on river hydrologic regimes. Thus, this study investigates the influence of the cascade dams located upstream of the Three Gorges Dam on the Yangtze River on the river ecosystem. The study was carried out for the period 2003–2015 for both Cuntan and Miaohe stations. The analysis was conducted considering two periods, pre-impact; before the dam construction and post-impact; after the dam construction. The assessment was carried out using “Indicators of Hydrologic Alteration.” The results of this study revealed that the cascade dams built upstream of Three Gorges Dam has both positive and negative impacts at both stations. Flows were found to have positive impacts in July while low in October for both stations. The 1-day minimum flows were found to decrease by 7% over Miaohe Station while the 1-day maximum was decreased up to 2% in Cuntan. Overall, the results of the study indicate that there are undesirable impacts which should be adjusted to maintain the river ecosystem at an acceptable level compared to its natural state. It is expected that the findings of the study can guide water managers to adjust the hydropower operation sustainably.

1. Introduction

The increase in inhabitants, expansion in rural activities, changing weather patterns, and to ensure water supplies during drought periods have increased water demands in many regions around the world [1,2,3,4,5]. To meet the growing water demands, several megastructures in the forms of sluices, barrages, dams are constructed, therefore altering the natural flow regimes of rivers [6,7,8,9]. Altering the natural regimes of rivers has positive and negative impacts on river ecosystems, which are well documented in the literature [10,11,12]. For example, construction of a dam can have positive impacts by reducing large floods, storing water for the dry season, and helping to generate electricity. At the same time, it can have negative impacts such as low water in the river in downstream, which can have severe impacts on the downstream river ecosystem [13,14]. Thus, sustainable river management requires adequate environmental flows (e-flows) in the river [15,16]. Therefore, it is essential to evaluate the characteristics of river flow before and after the alteration of the river’s flow regimes.
More than 170 indicators are available in the literature for the quantification of the hydrologic alteration [17,18]. Among them, many of the indicators are only used to study specific parameters like monthly peak flow or duration of flow [19,20]. However, with time, some more comprehensive tools were developed which are used to assess a wide range of hydrologic alteration parameters [21,22]. Among them, the “Indicators of Hydrologic Alteration (IHA)” is the most widely used tool which considers 33 indicators and 34 e-flow components to define the flow characteristics in the river [23]. Zuo and Liang [24] reported that one of the significant advantages of the IHA method is that it incorporates the Range of Variability Approach (RVA) which can evaluate the flow characteristics in two different periods (i.e., pre-, and post-impact on flow regime). Additionally, owing to its simplicity, strong theoretical background, and involvement of biologically relevant hydrologic indicators it has gained the attention of hydrologists and environmentalists to study the alteration of the natural flow regimes both in case of dams and diversion structures, e.g., run-of-river hydropower plants [24,25,26,27].
Koel and Sparks [28] used IHA to study the water level and its relationship on fish abundance in the Illinois River. The results of the study indicate that IHA is a useful tool which provides considerable valuable information to maintain the water level up to the specific limit to sustain the fish and other fauna and flora ecosystem needs. Shiau and Wu [29] applied IHA to understand the flow diversion in Peinan Creek, eastern Taiwan, and reported that IHA is simple to use and provides almost all necessary information related to flow diversion and it helps to estimate the potential impact that flow alteration may have on the ecosystem. Zuo and Liang [24] studied the impact of dam construction over the Shaying River, China, using IHA and reported that IHA identified a strong influence on the flow regime and claimed that the application of IHA had provided considerable information to the water resource managers and environmentalists working on the Shaying River, China. Besides the Shaying River, several studies are conducted across the Yangtze River. The Yangtze River is the longest and largest river in China, where around 50,000 small and large dams are constructed [30]. The constructions of these reservoirs have significantly altered the natural regimes of the Yangtze River, which are published in several articles. Among them, the Three Gorges Dam (TGD) is one of the reservoirs, which is also constructed across the Yangtze River.
TGD is also known to be the world’s largest electric power generator and stores the most substantial volume of water around the world [31]. Since its construction, several studies have been conducted over TGD, including hydrologic alteration using IHA [25,26,32]. Gao, Yang, Zhao, and Yang [25] investigated the impacts of flow over the Upper Yangtze River considering several reservoirs, including TGD. They reported that the construction of TGD had reduced the flow in the downstream side of the river, which has negatively impacted the ecosystem. However, at the same time, it helps to reduce peak flows [33]. They also reported that IHA provides considerable useful information on the ecosystem after the hydrologic alteration.
Similarly, Yu, Wang, Wang, Hou, and Qian [26] conducted a study over two stations, Yichang and Datong gauges located in the middle and lower Yangtze River to understand the reservoir operations using IHA. They reported that TGD has a significant impact on the flow in the lower Yangtze River. Wang, Wang, Lewis, Wu, and Huang [32] assessed the impacts of TGD over the Yangtze River using the stations of Cuntan, Yichang, and Wulong and found that TGD has altered 10 parameters out of 33 IHA indicators and emphasised that more stations should be considered to understand the impacts of TGD cascade over the Yangtze River. Nevertheless, at the current stage, flow data from other stations are not accessible. Therefore, in this study, the stations of Cuntan and Miaohe, which are located on the upstream side of TGD, were considered. Thus, the primary objective of the study is to evaluate the flow characteristics before and after the construction of several dams located upstream TGD. For this purpose, IHA with RVA approach was used to evaluate the river flow characteristics over two stations, i.e. Cuntan and Miaohe. Though several studies have been conducted to assess the impact of dam on sedimentation, river dynamics, ecology, etc., using IHA, the present study attempts to provide many details of information on the changes of flow regimes using IHA with RVA, used for understanding profound consequences of the dam on river flow. Changes in different characteristics of river flow including magnitude of monthly flow, extreme conditions, timings of annual extreme water, high and low pulses inflow, and rate and frequency of flow changes are analysed and presented to show the profound consequences of TDG on the Yangtze River flow regimes. It is expected that the findings of the study will provide technical support to the authorities as well as the current research, which is going on over the river ecosystem of TGD.
The rest of the paper is structured as follows: Section 2 describes the study area, climate, and the datasets used in the study. Section 3 describes the methods used in this study. Section 4 discusses the results of the study. Finally, Section 5 gives the conclusions made based on the above results and discussions.

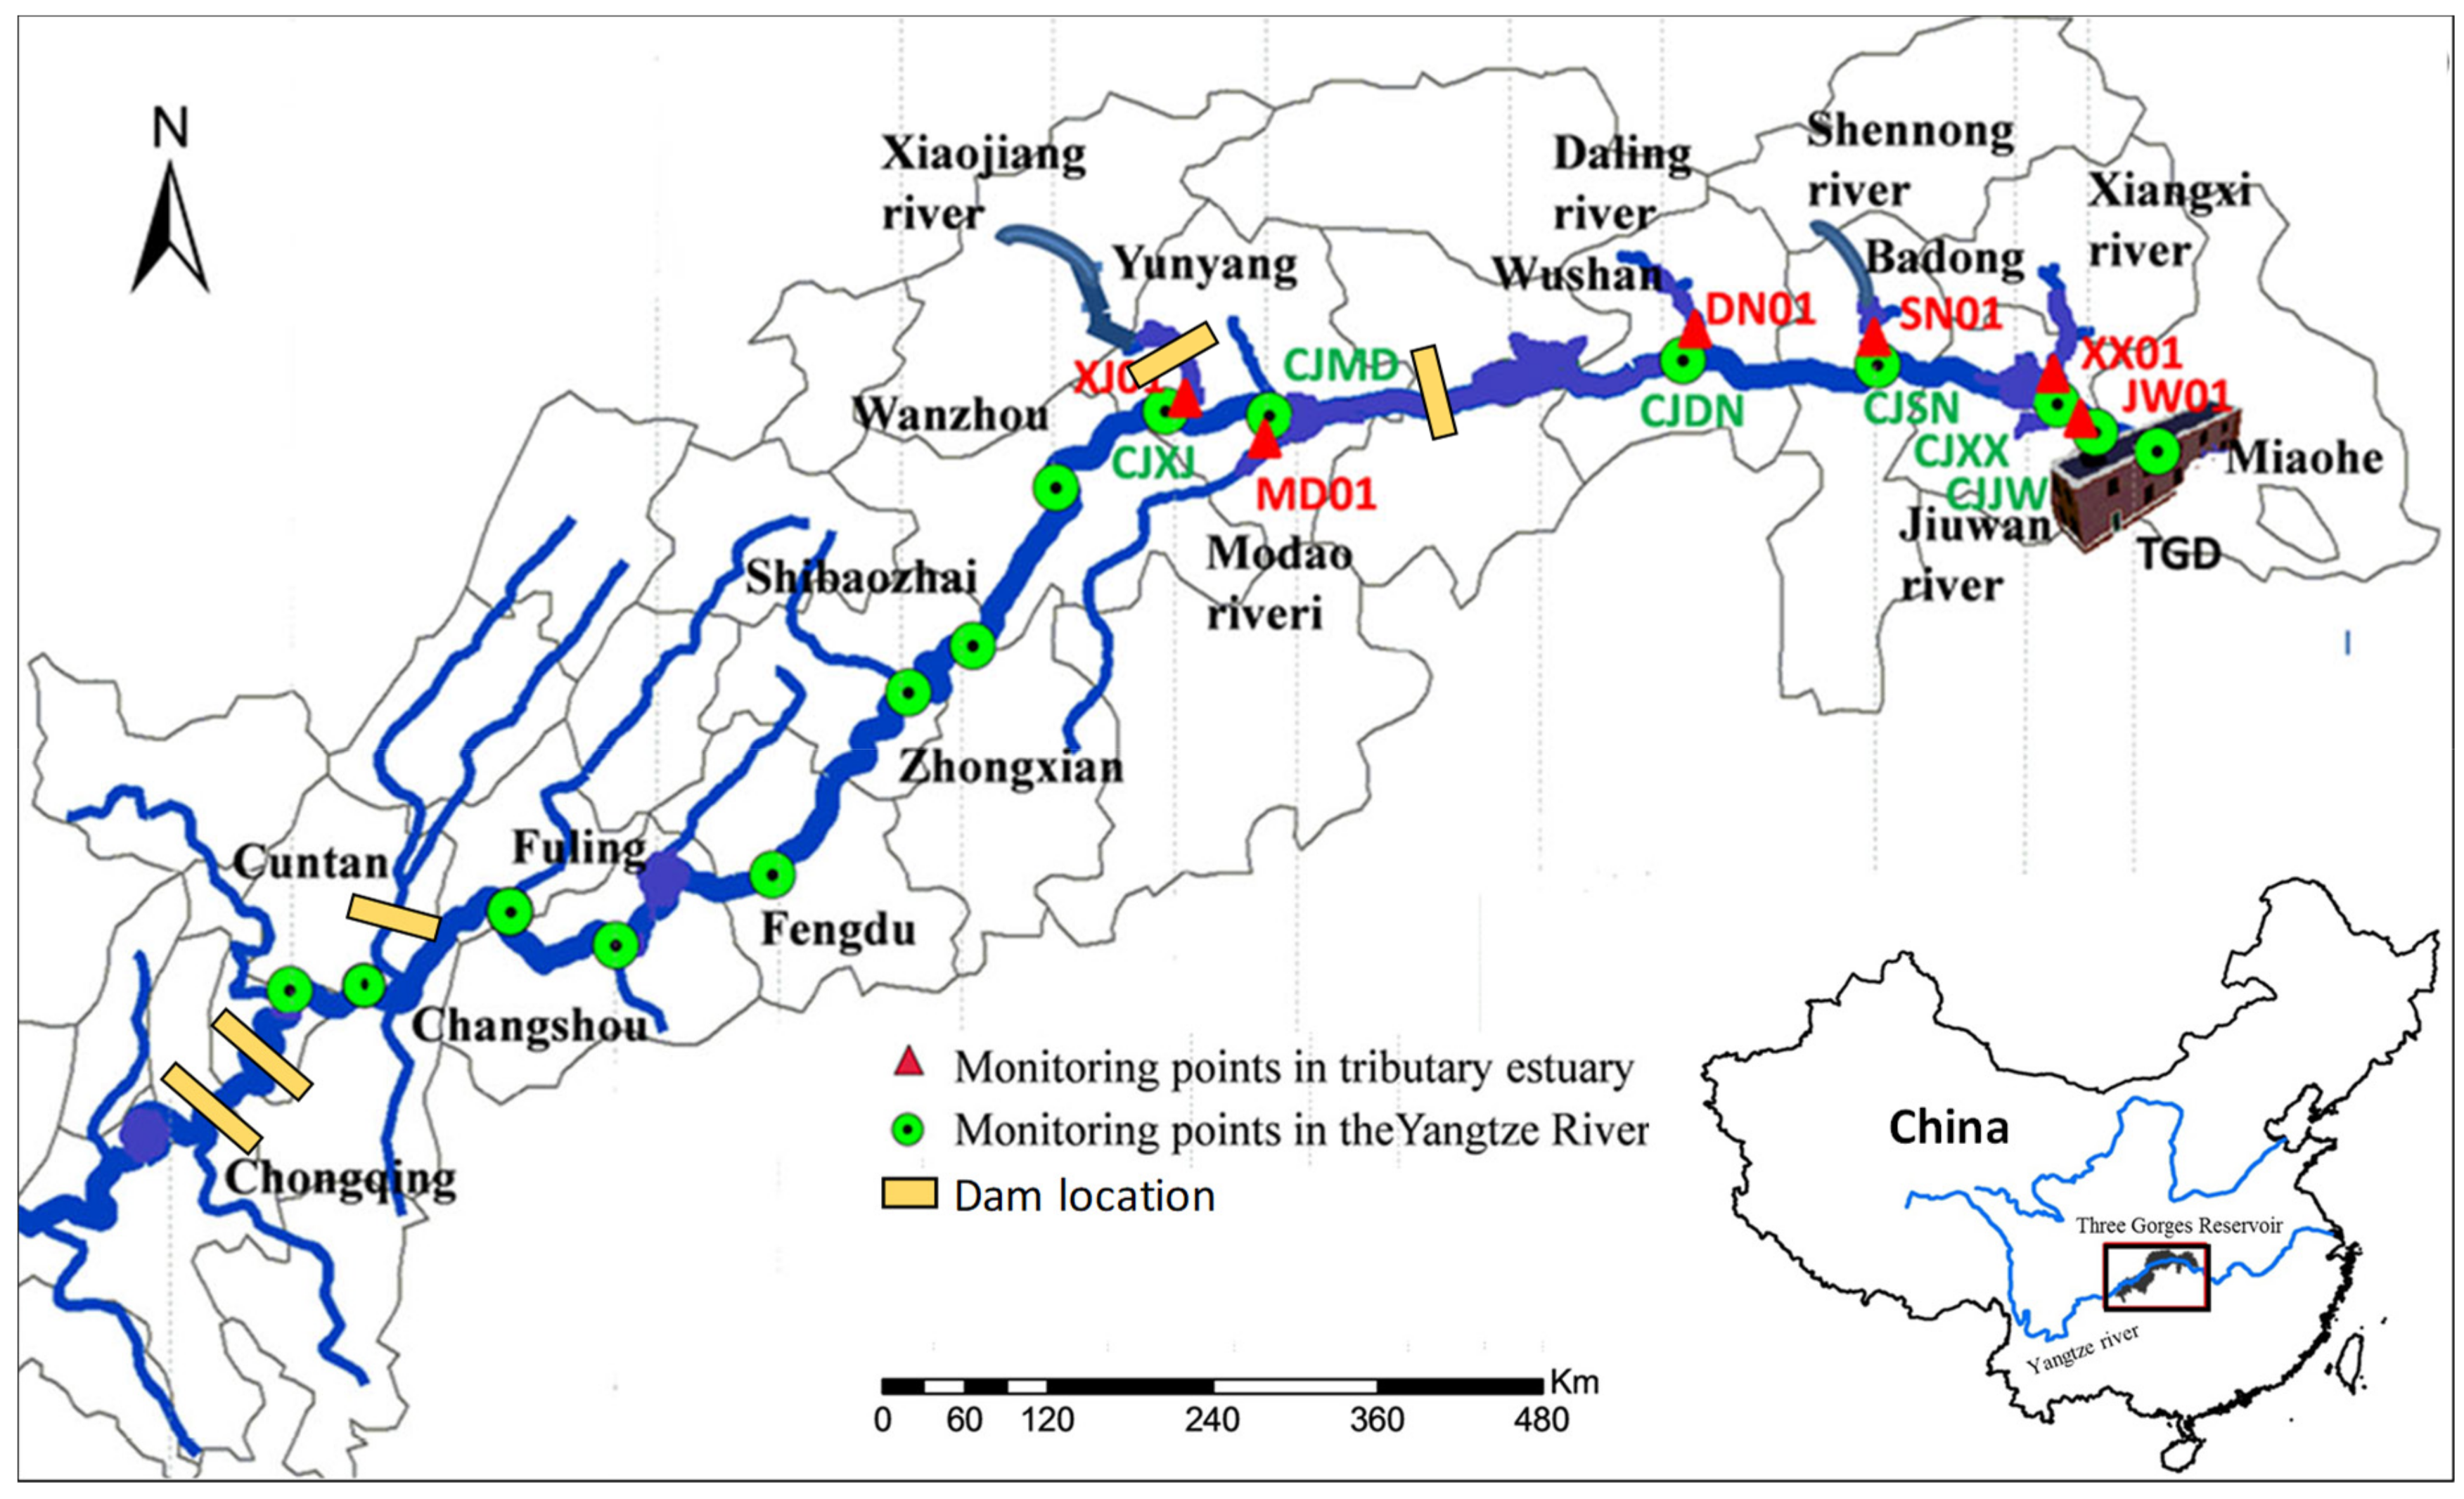
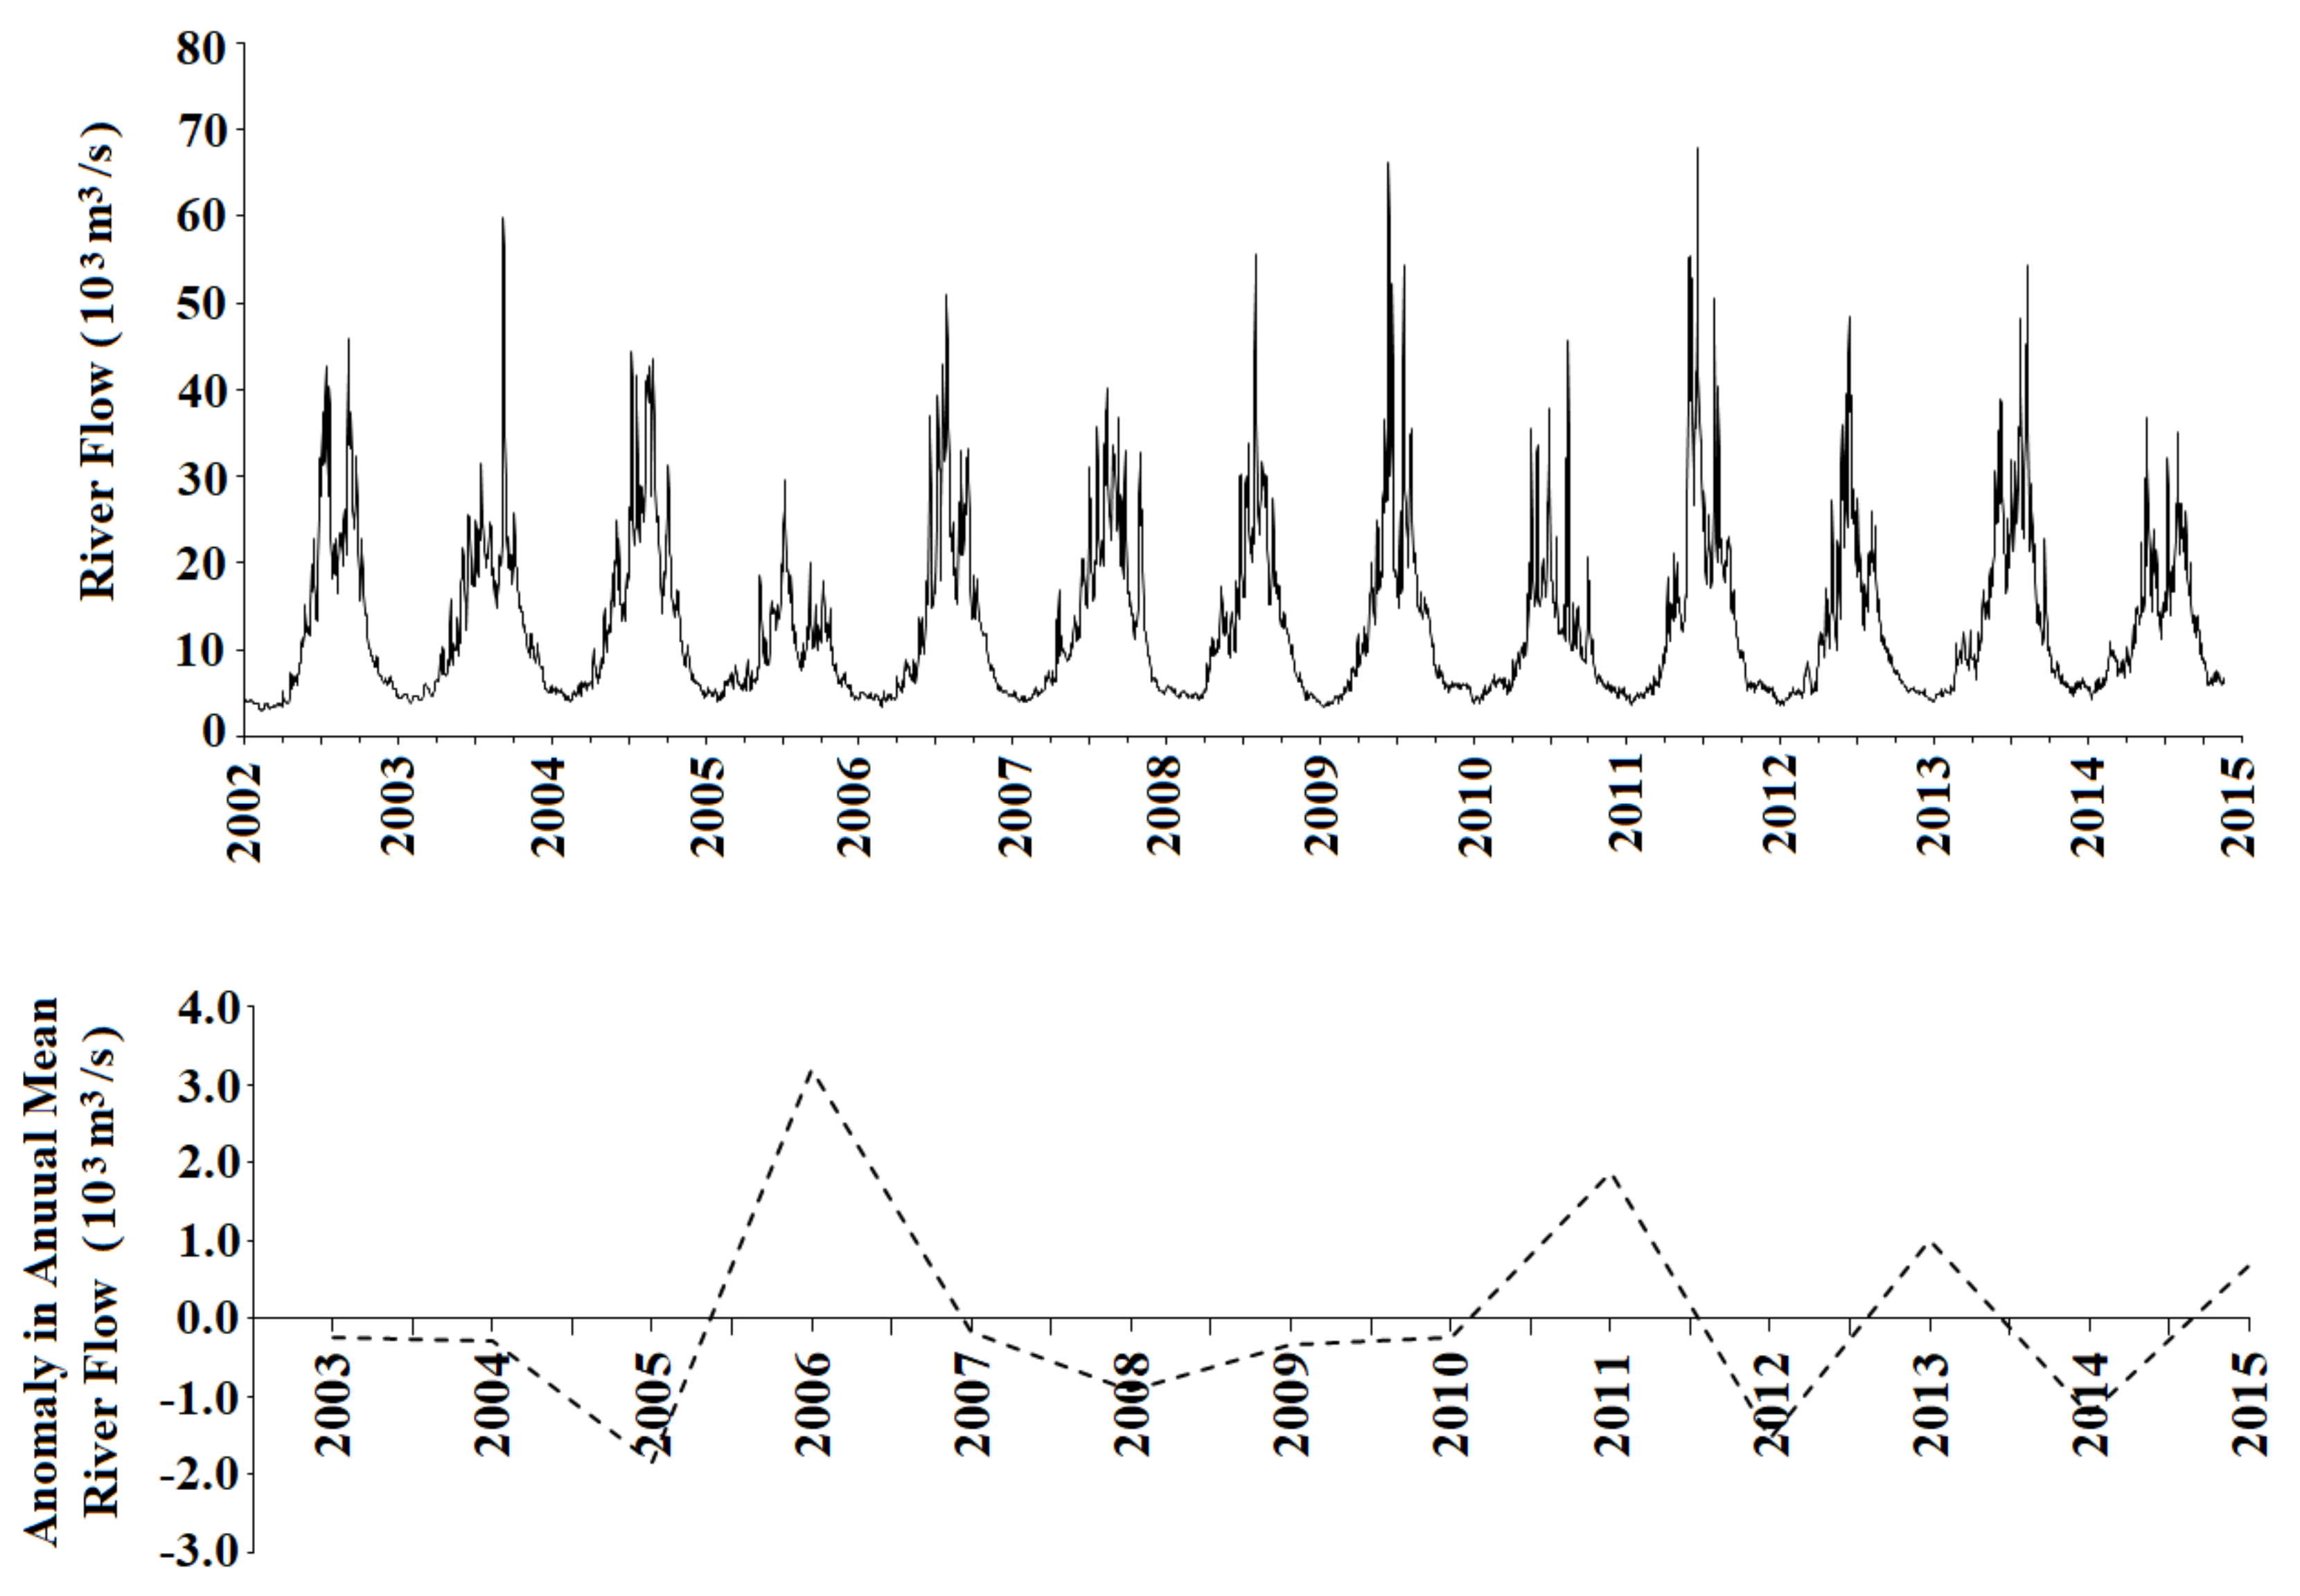
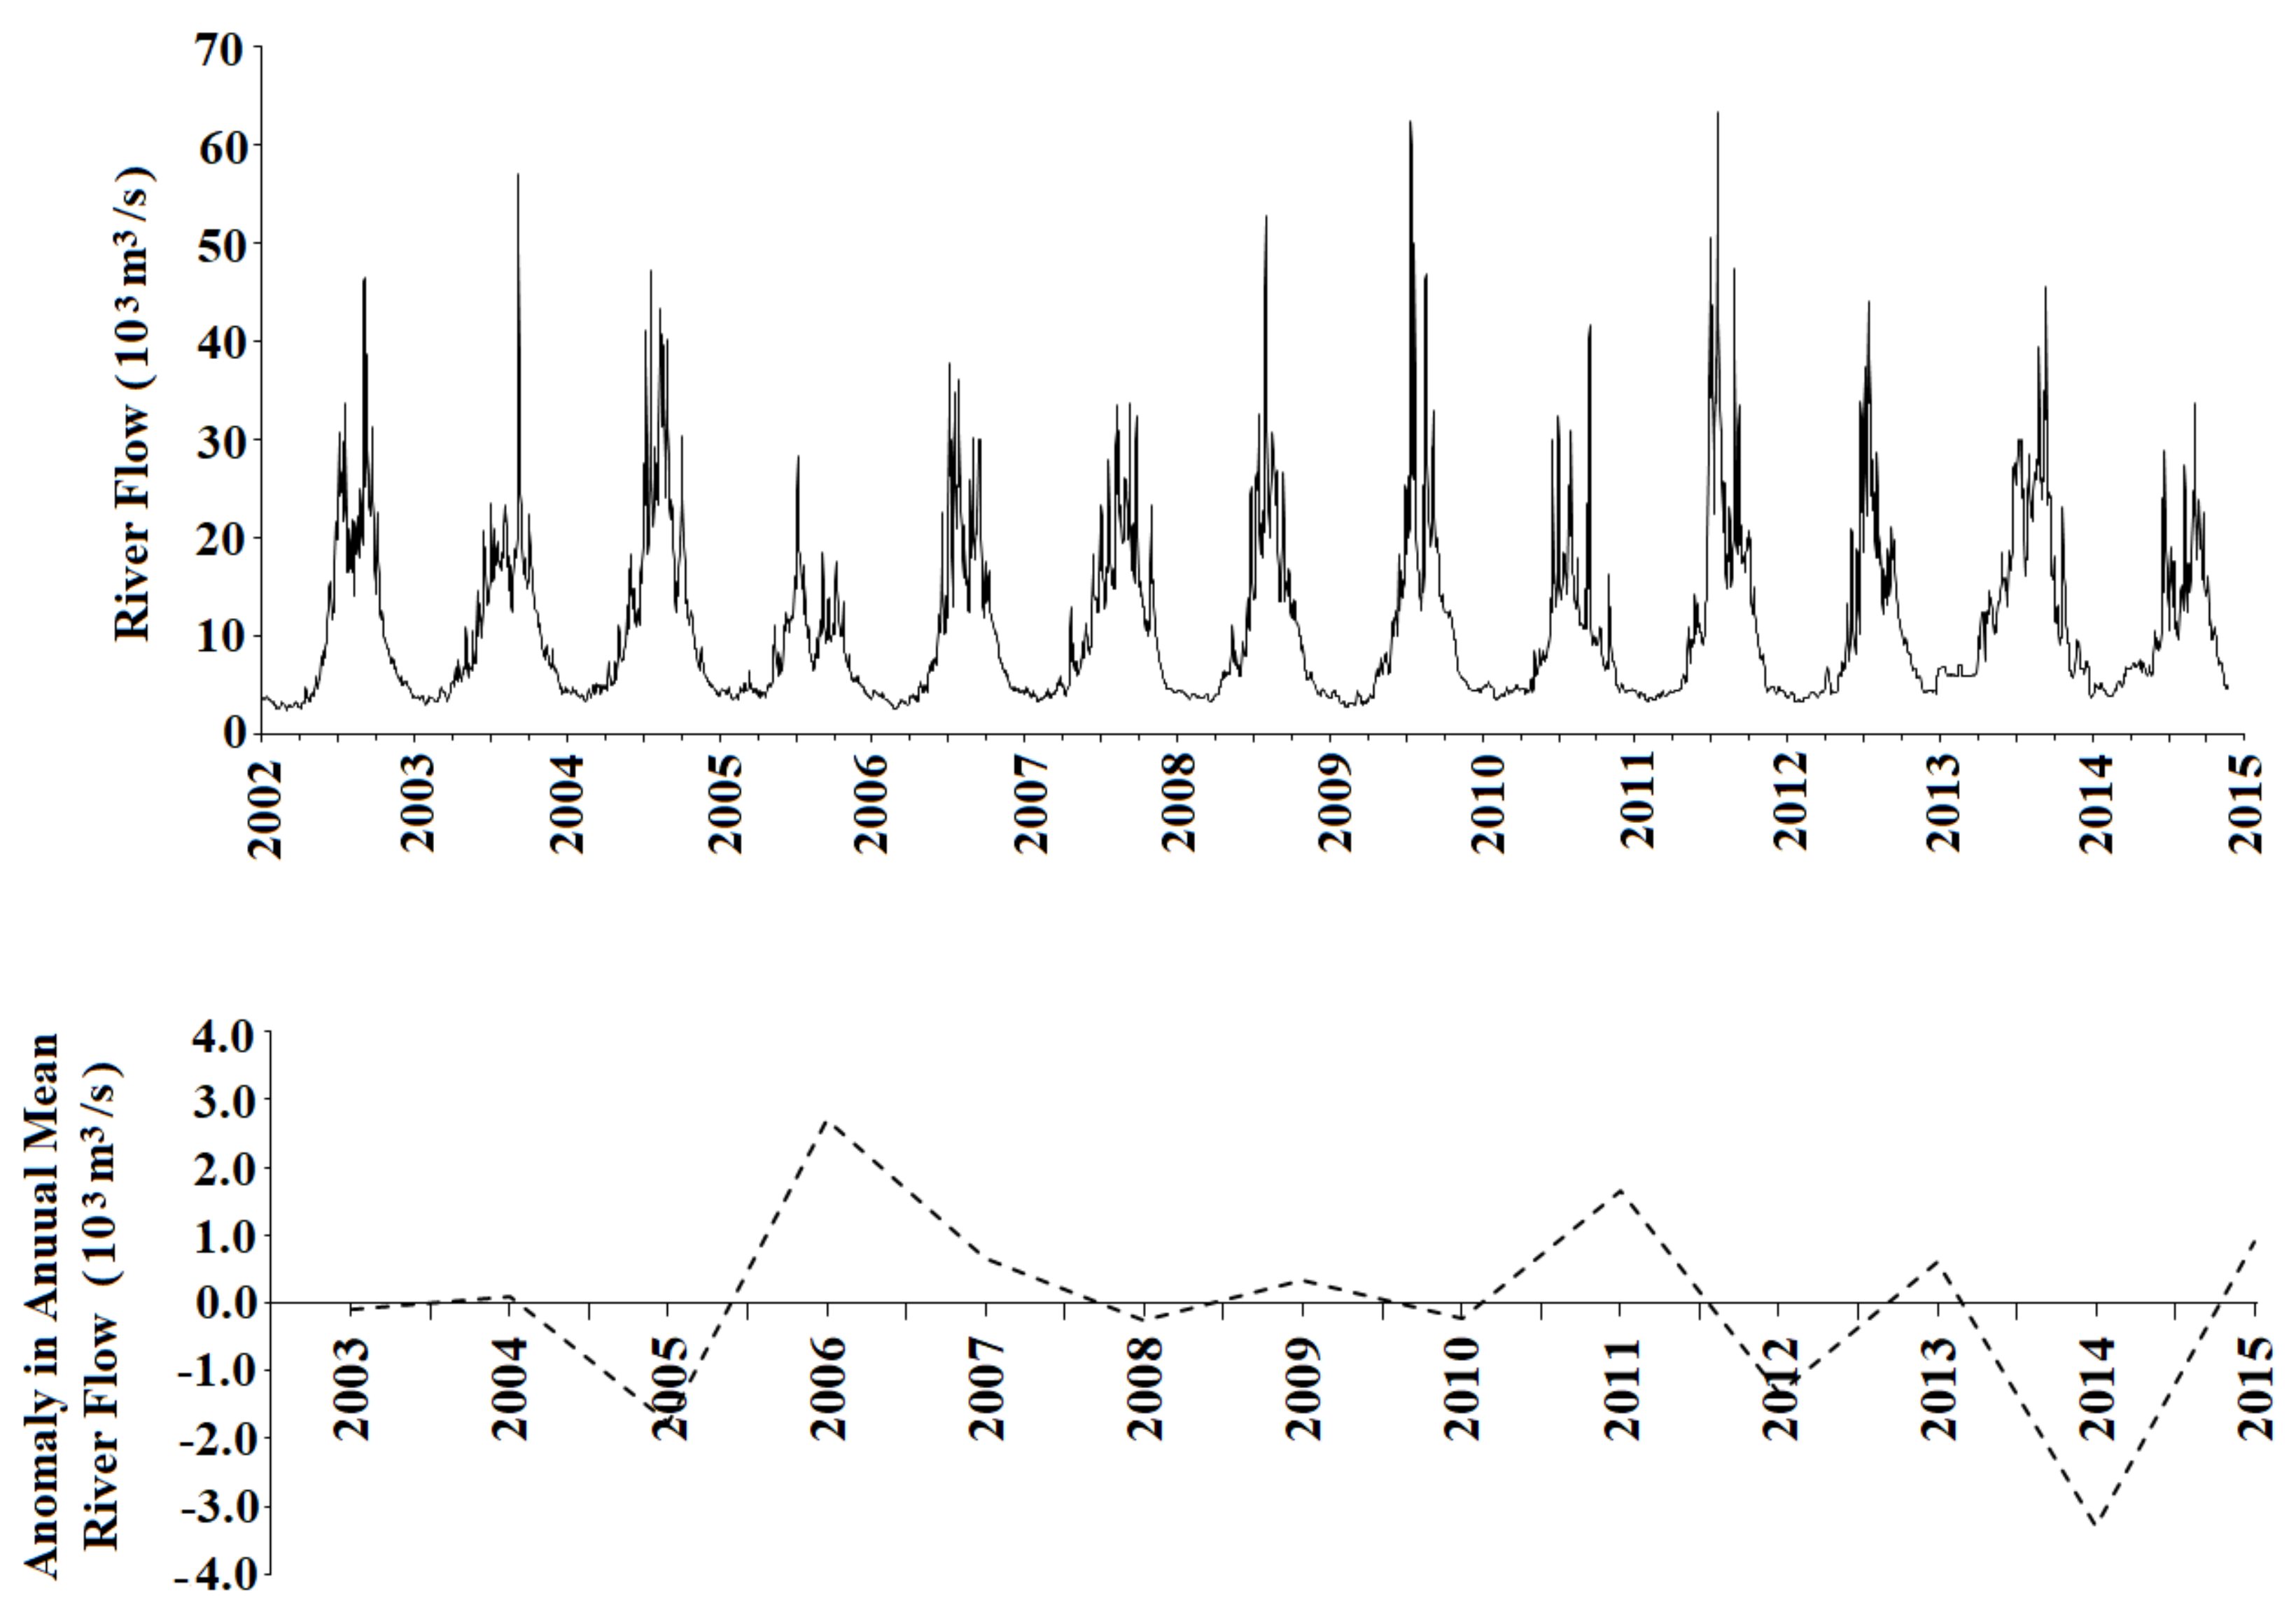
2. Study Area and Datasets

Yangtze River is the main river of China, which flows from the southwestern section of Qinghai and ends north of Shanghai [34]. The river basin covers an area of 1.8 × 10⁶ km2, and annual discharge is recorded as 892 km3 from 1950 to 2010 [35,36]. The spatiotemporal patterns of precipitation over the river basin showed that monsoon is a dominating factor that brings moist air from the East and the South China Sea [37,38]. On the other side, there are lots of variations in temporal patterns of the precipitation [39]. Precipitation is recorded high in summers and often results in floods [25,39]. The river is known to be the longest river in Asia with a length of 6400 km [40,41,42]. Due to its long length, around 50,000 reservoirs are constructed across the river in different sizes [30]. The TGD is one of the prominent structures constructed across the Yangtze River. The construction of TGD has prominently altered the ecological system of the river, on both the up and downstream sides of the dam [43,44]. Thus, in this study, two stations located in the upstream sides of the dam are considered for the analysis. The locations of the stations are shown in Figure 1. Both stations were selected because of their location and availability of useful quality data. The mean daily river data of both stations were collected from the Hydrologic Data Centre of the Ministry of Water Resources in China.

3. Methodology

Indicators of Hydrologic Alteration (IHA)

The Indicators of Hydrologic Alteration (IHA) is one of the most popular tools developed by Richter, Baumgartner, Powell, and Braun [23] of the Nature Conservancy (http://www.nature.org/). IHA is commonly used in hydrology to assess the hydrologic alteration due to anthropogenic stressors. Overall, IHA consists of 67 indicators, out of which 33 are used for hydrologic alteration, while 34 are used for e-flows component assessment. The parameters considered in IHA are logical and have a strong relationship with the river ecosystem and reflect the human interference on flow regimes by the construction of structures like a dam, barrages, and water diversions [46,47]. IHA indicators are primarily divided into five groups. The first group consists of 12 indicators that represent the magnitude of monthly water flow rates (m3/s), the second group is comprised of 11 indicators that represent the magnitude and duration of annual extreme water flow rates (m3/s), the third group contains 2 indicators which describe the timing of annual extreme water flow rates, while the fourth and fifth groups are comprised of 4 and 3 indicators which are used to define the frequency and duration of high and low pulses, rate and frequency of water flow rate changes, respectively. The details of these indicators are given in Table 1.
The major benefit of using IHA is that it provides several indicators in one suit and analyses them using the Range of Variability Approach (RVA). RVA can assess the performance of these indicators before human intervention on river regimes (pre-impact) and after human intervention (post-impact) [23]. The RVA component of IHA software makes it unique and provides a degree of alternation in the river or the catchment. Therefore, in this study, the nonparametric RVA was considered for the assessment of flow regimes. The nonparametric RVA is defined based on the percentile values. RVA-targeted boundaries are defined in the range of 25% to 75% percentiles, which are referred to as low and high boundaries of RVA. The following equation is used to calculate the IHA:
I H A % = O b s e r v e d   F r e q u e n c y E x p e c t e d   F r e q u e n c y E x p e c t e d   F r e q u e n c y × 100
where observed frequency and expected frequency represent the number of years in the observed and expected indicator, respectively, which falls within the targeted range. Richter et al. [48] classified the alterations into three major groups as a minimal, moderate, and high alteration. The values between 0 and33% are classified as minimal alteration, 34–67% as moderate alteration, while 68–100% as a high alteration. In this study, IHA was used to evaluate the impacts on two stations (Cuntan and Miaohe) located upstream of TGD. At both stations, the period of 2003–2009 was considered as pre-impact while 2012 to 2015 was considered a post-impact. Whereas, 2009–2012 corresponds to the construction period of the dam constructed downstream of these stations. The river flows at Miaohe and Cuntan stations are presented in Figure 2 and Figure 3, respectively. The deviation of annual average of daily flow from the mean flow over the years 2003–2015 is also shown in the figure to reveal wet and dry years. The figure shows less variability in river flow, but comparatively low flow and more dry years after construction of the dam.

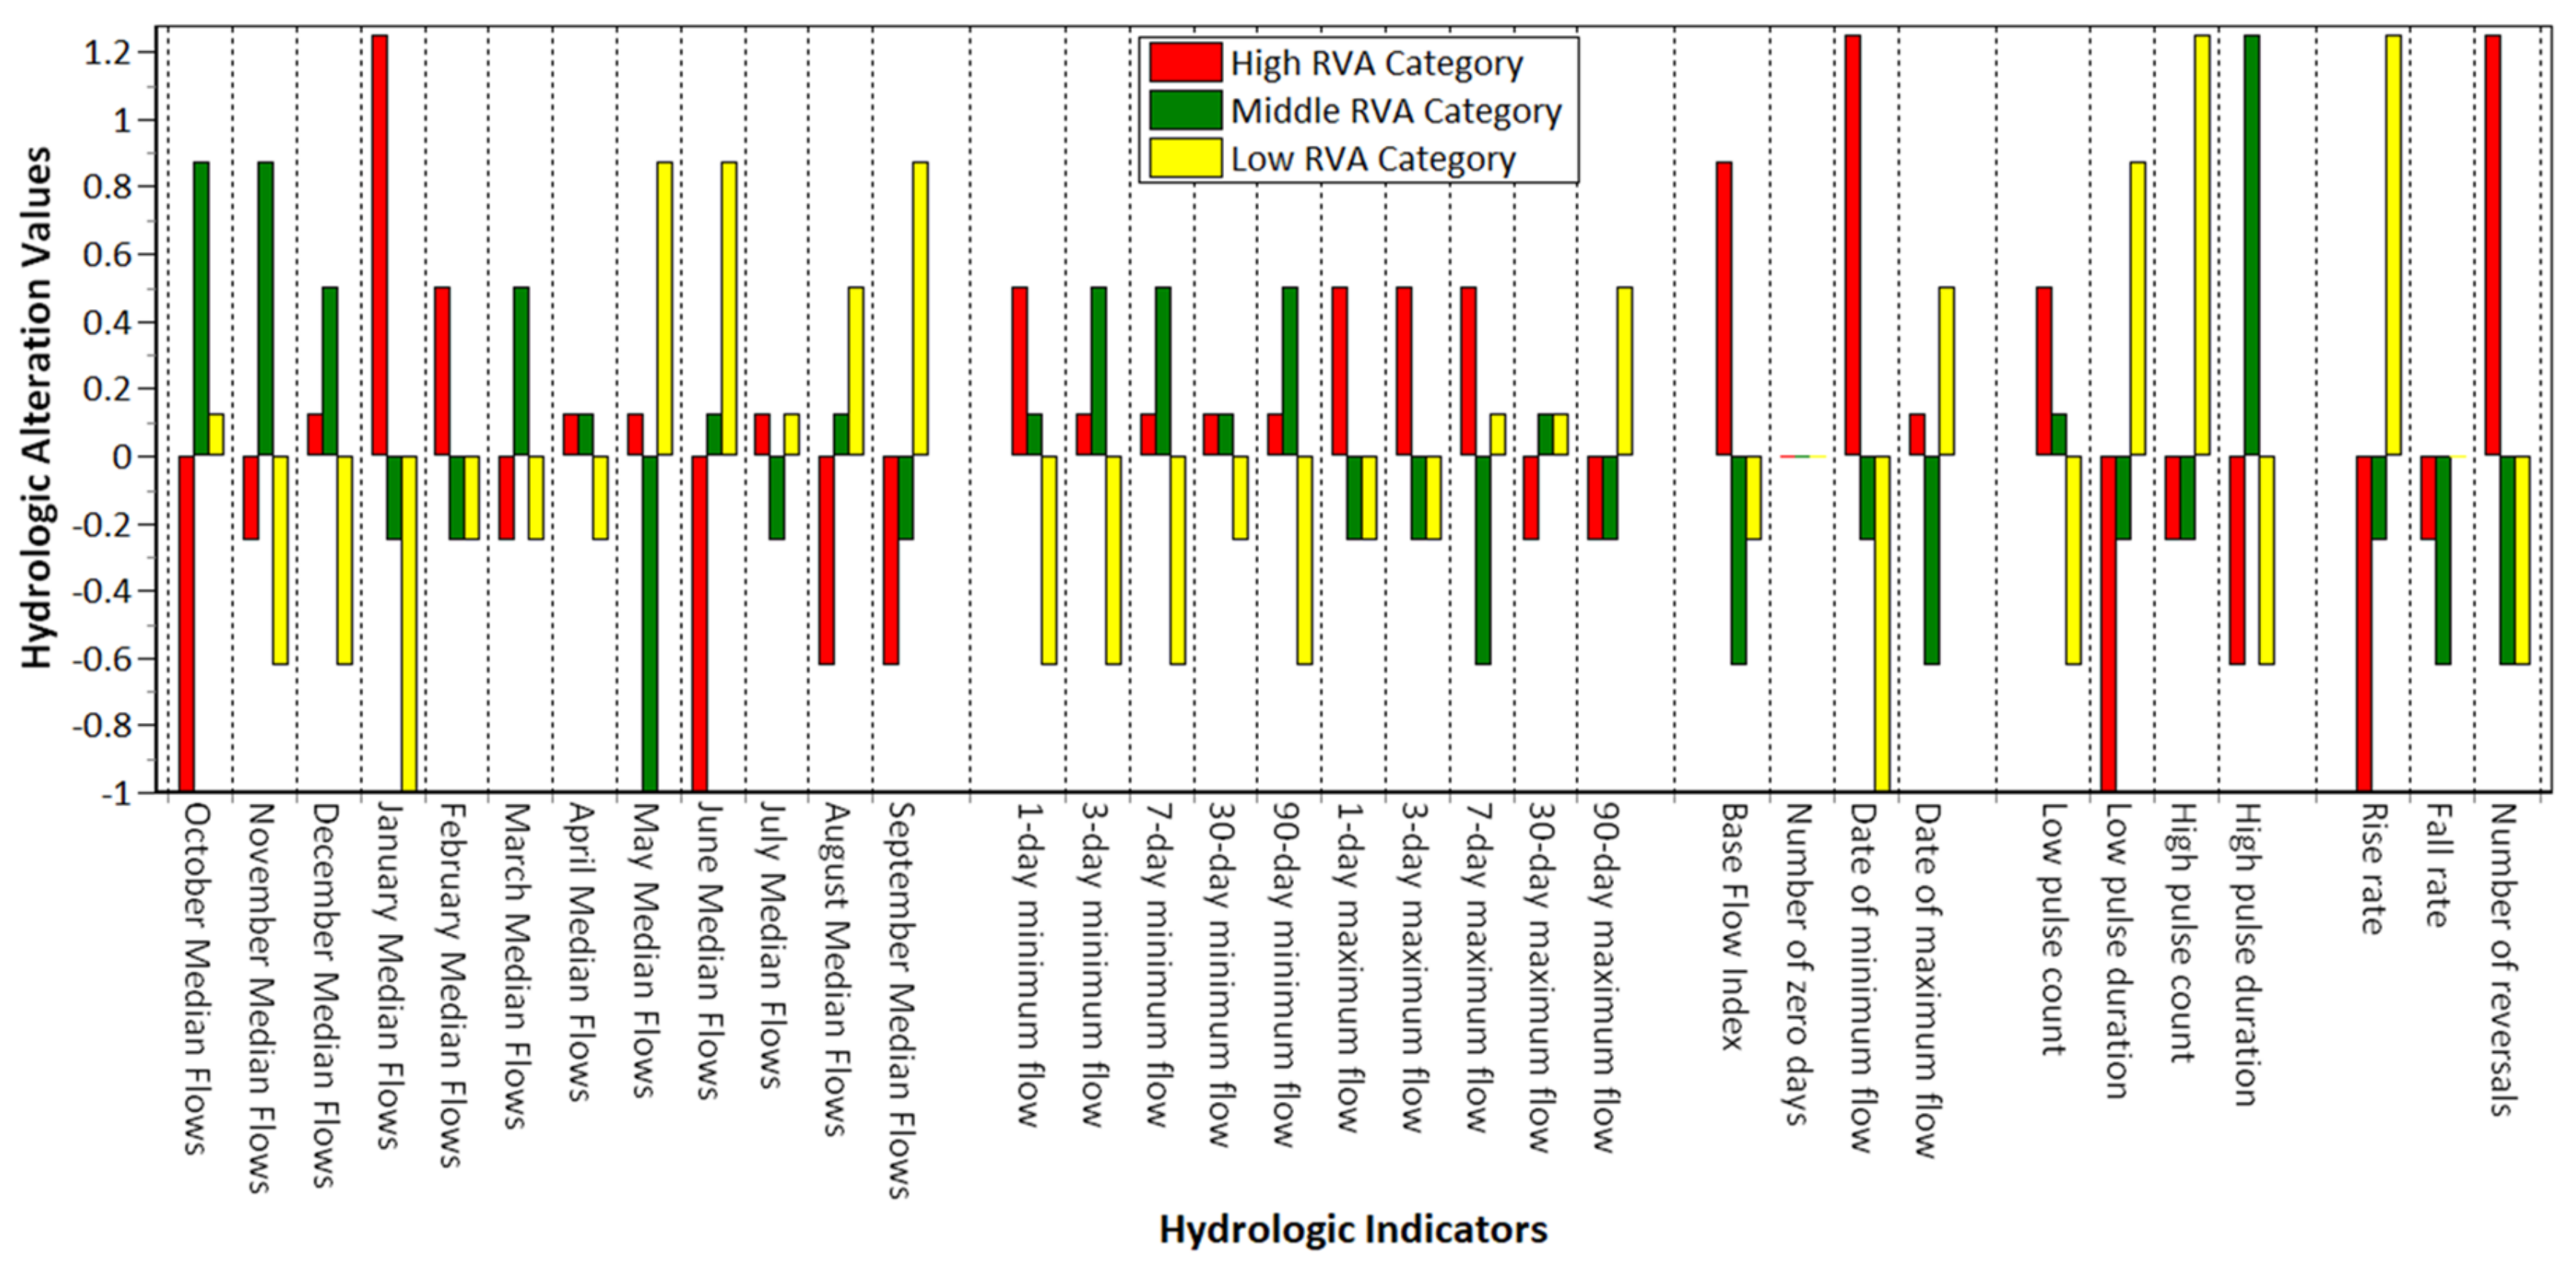
4. Results and Discussion

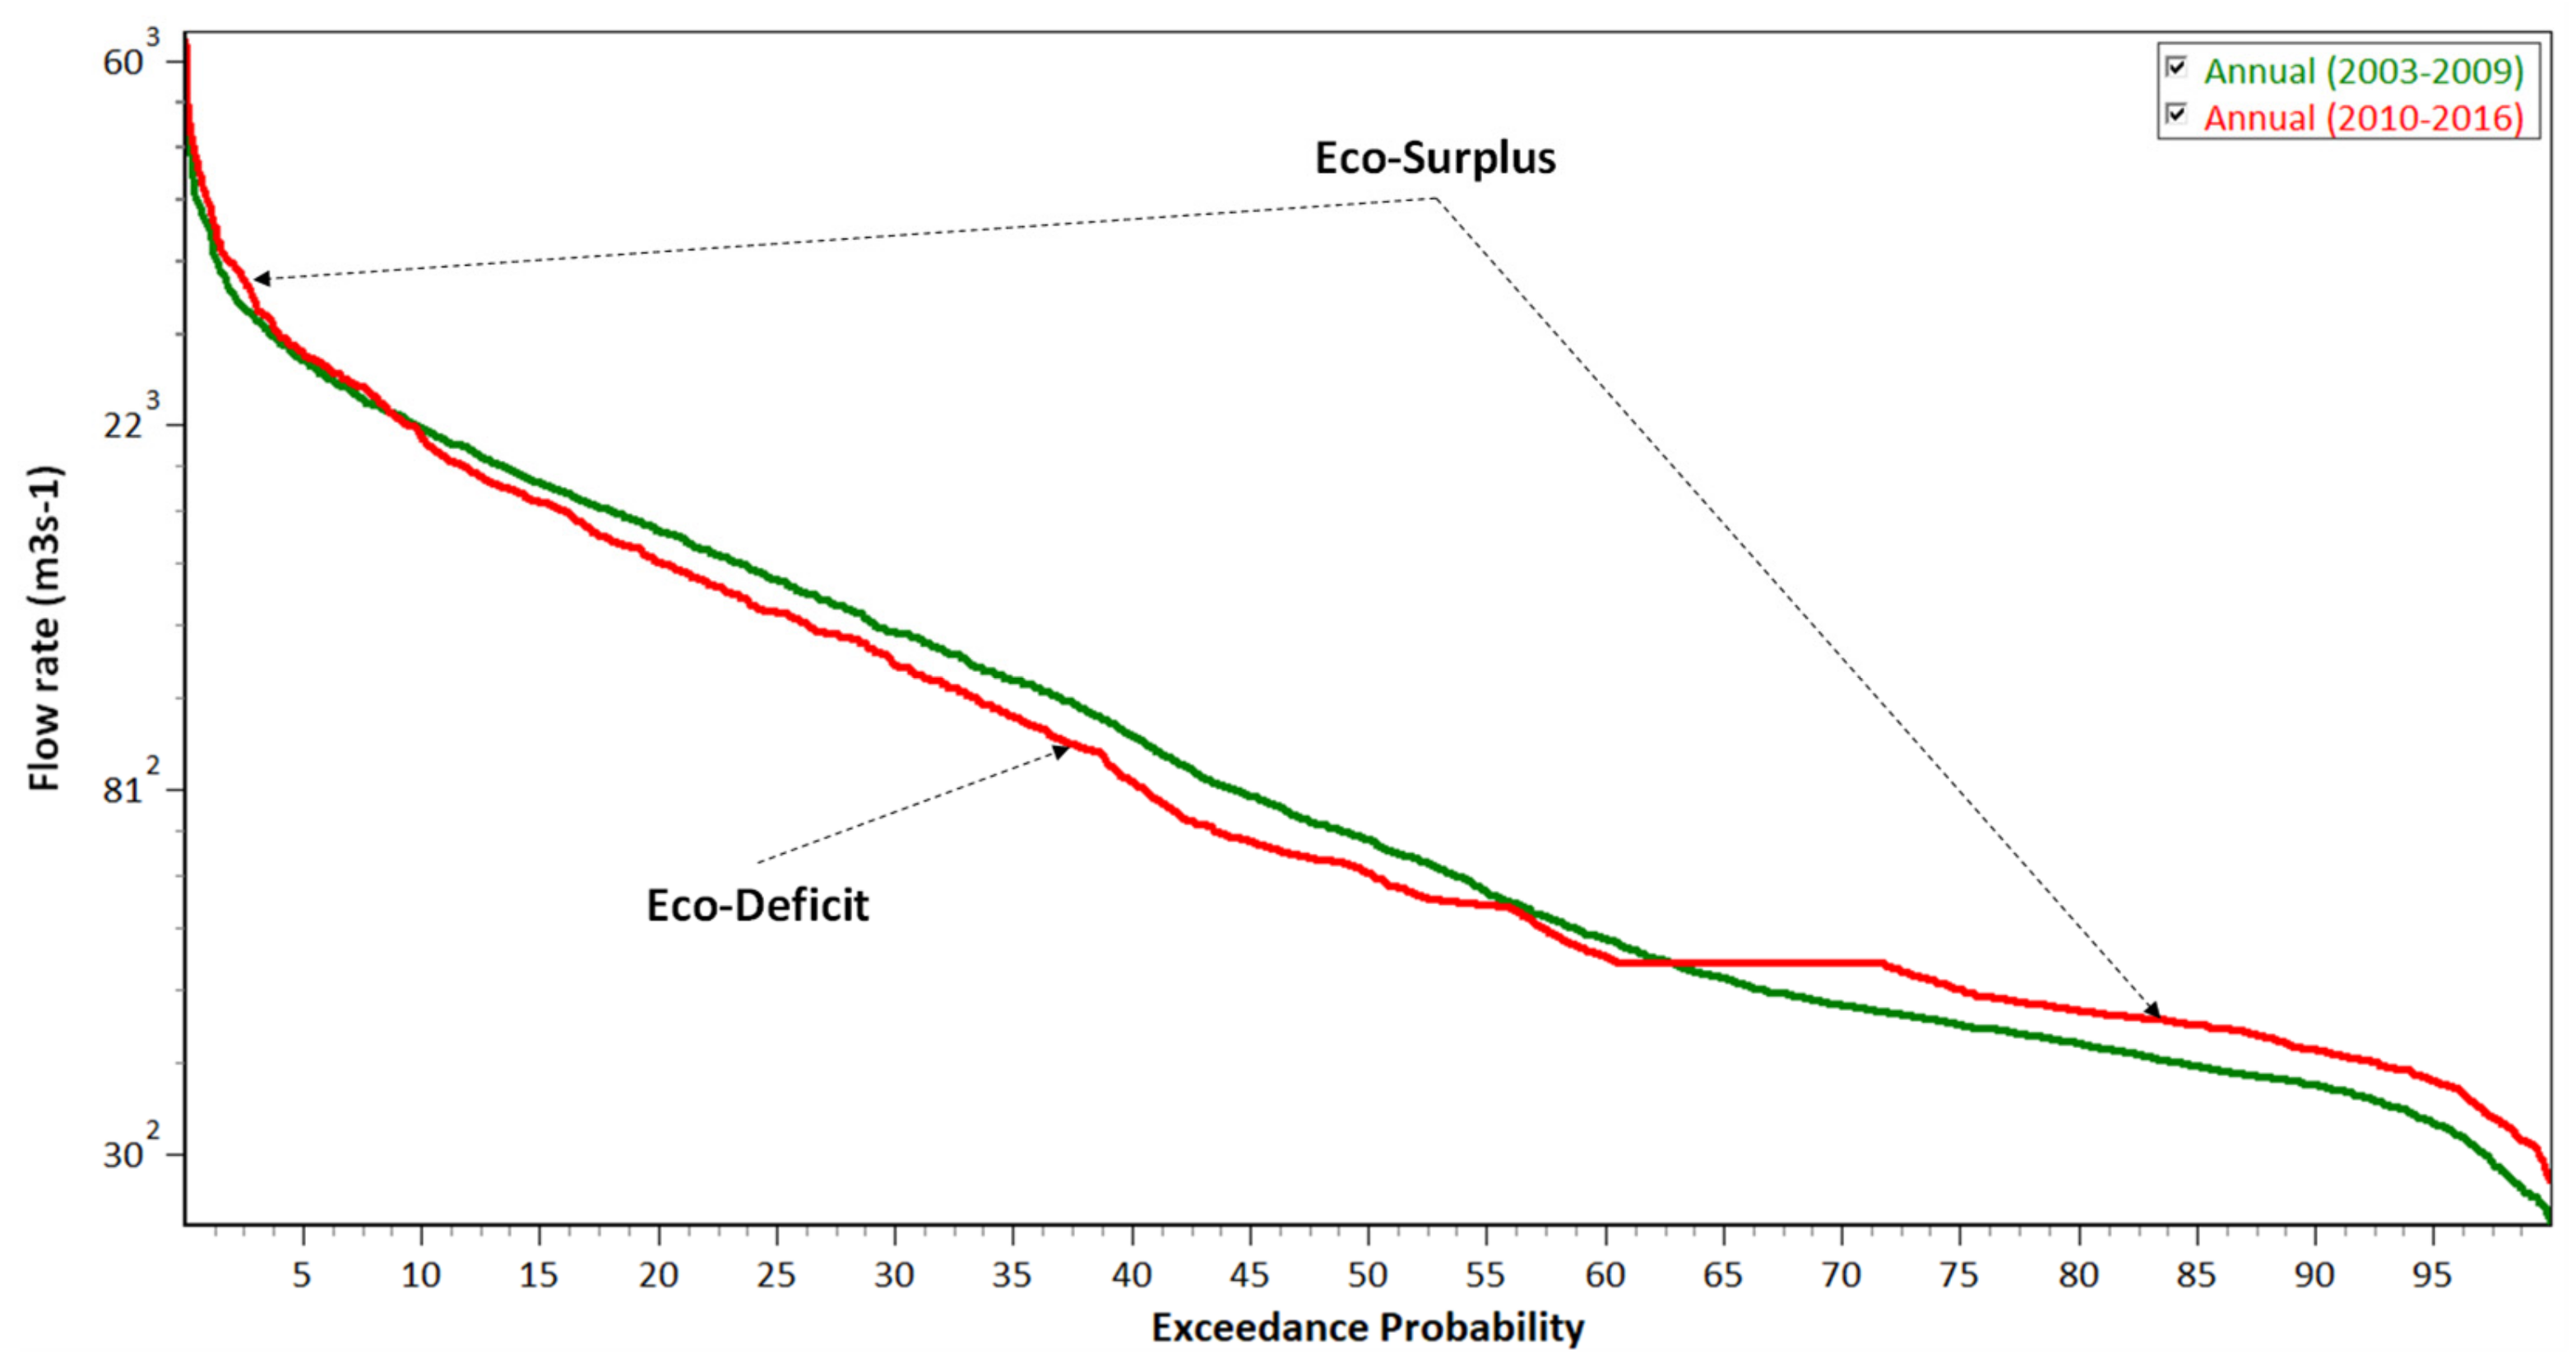
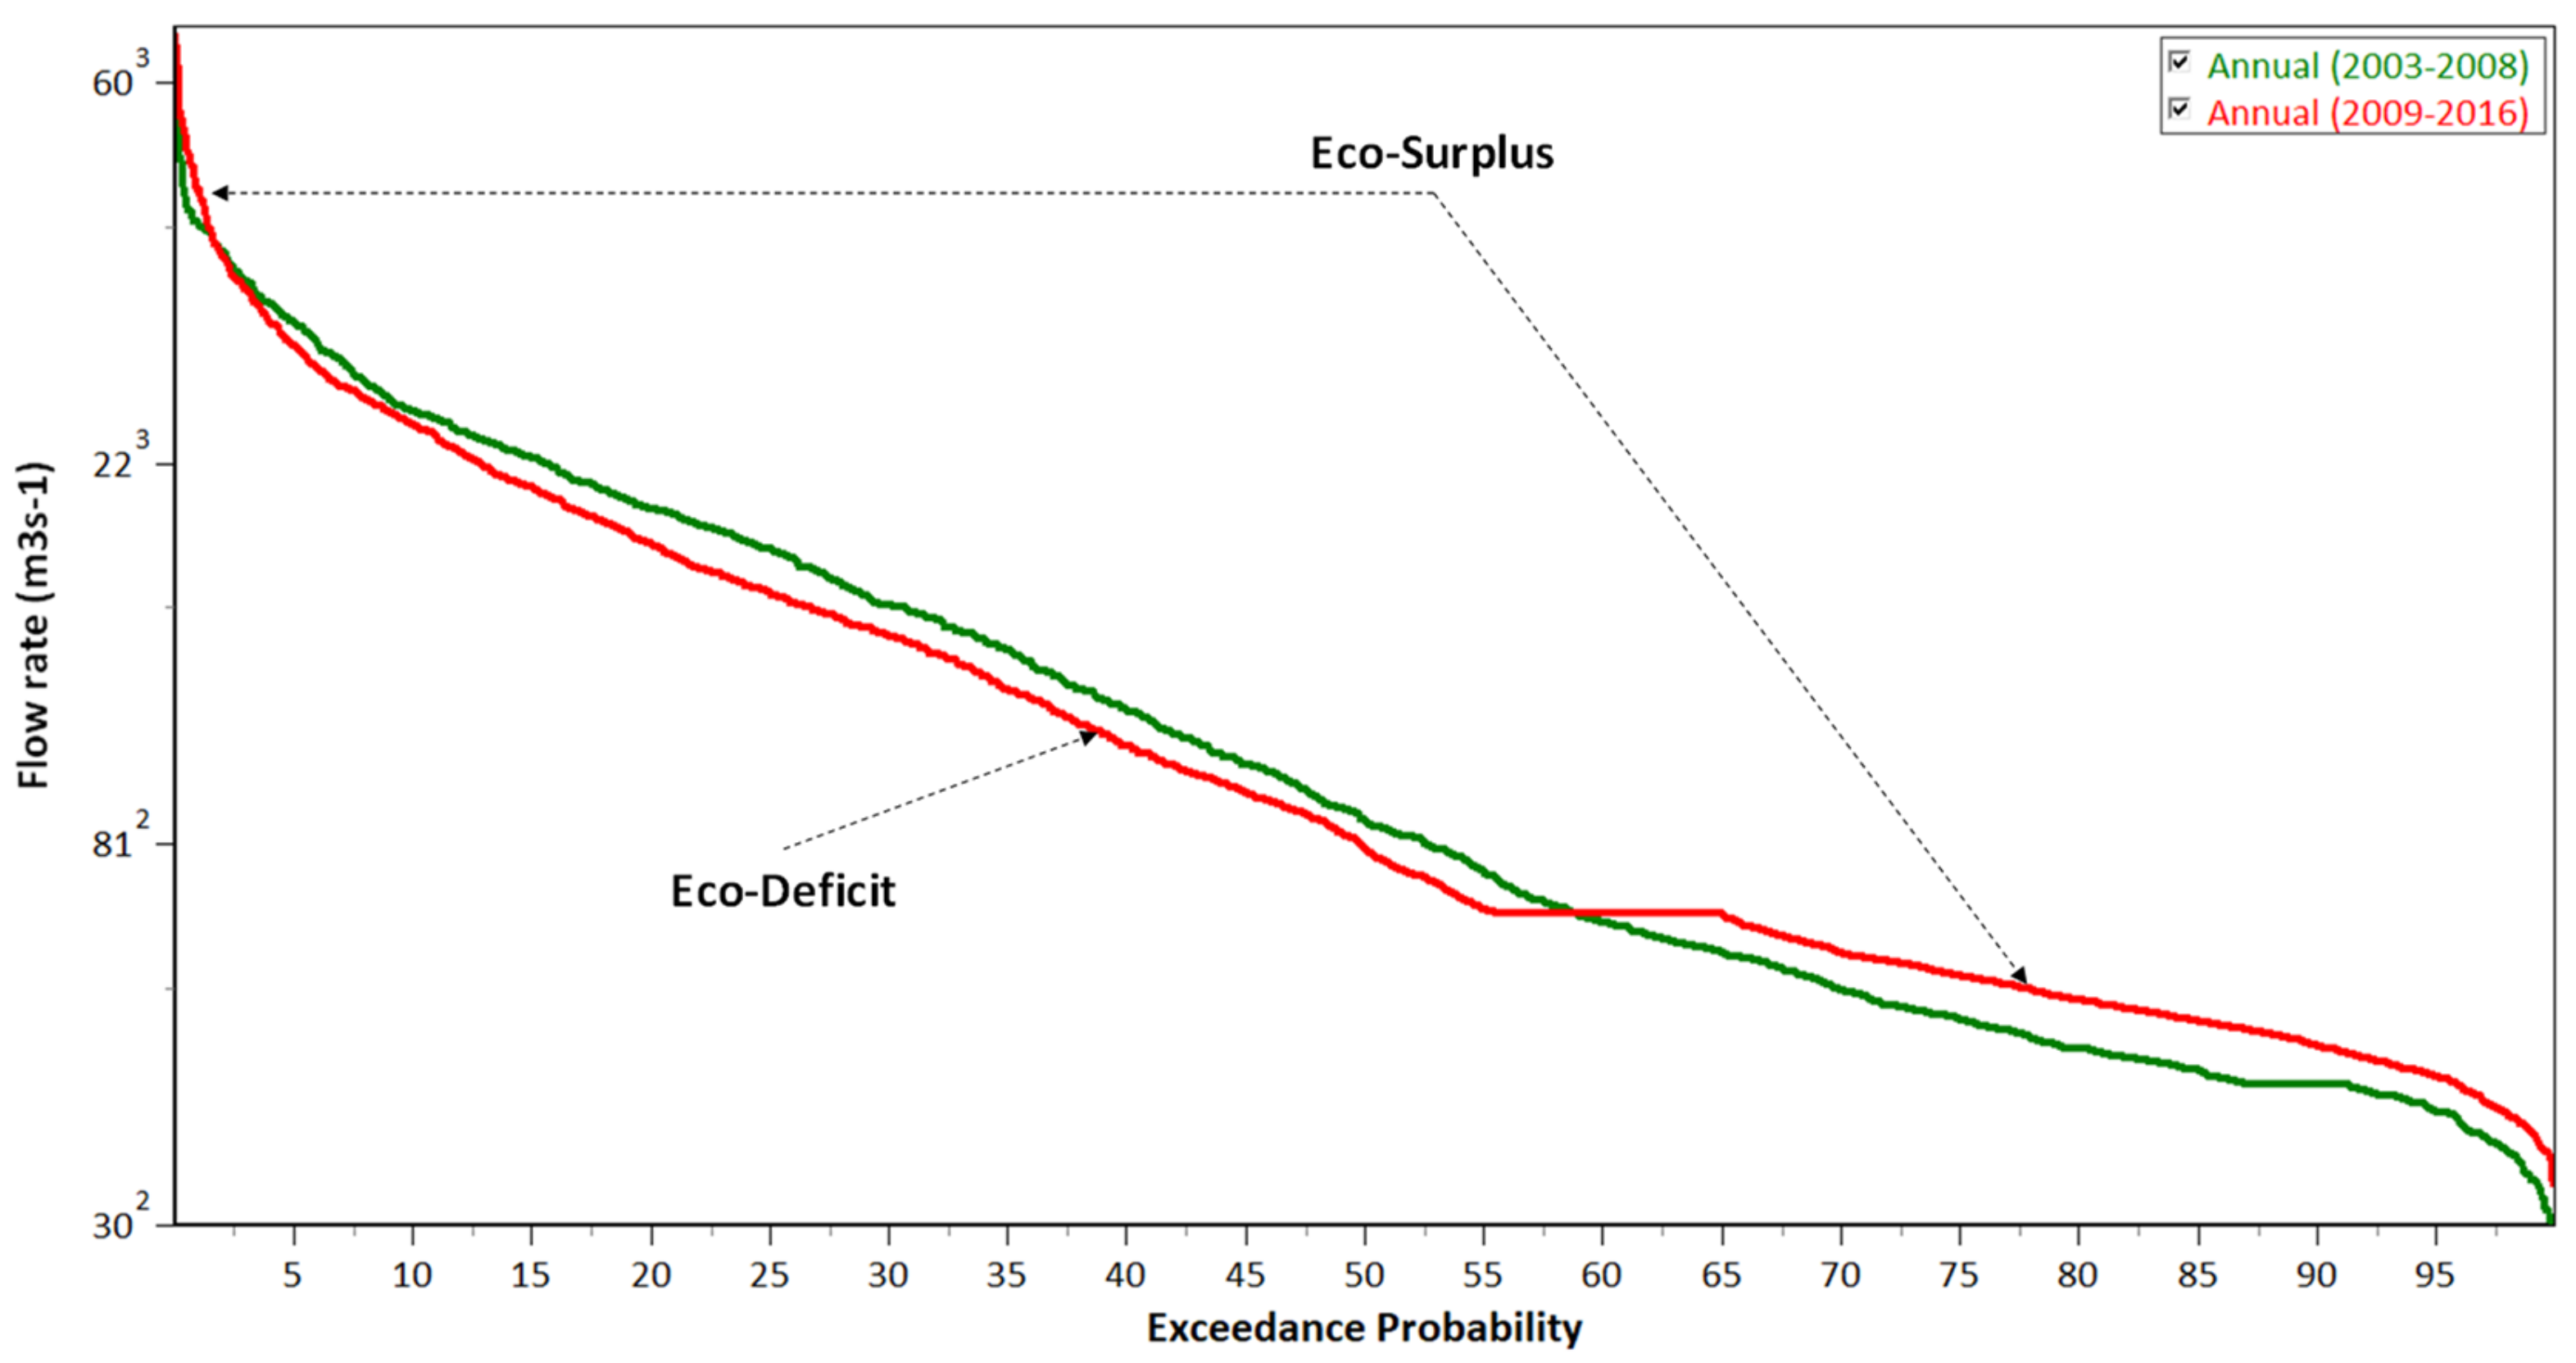
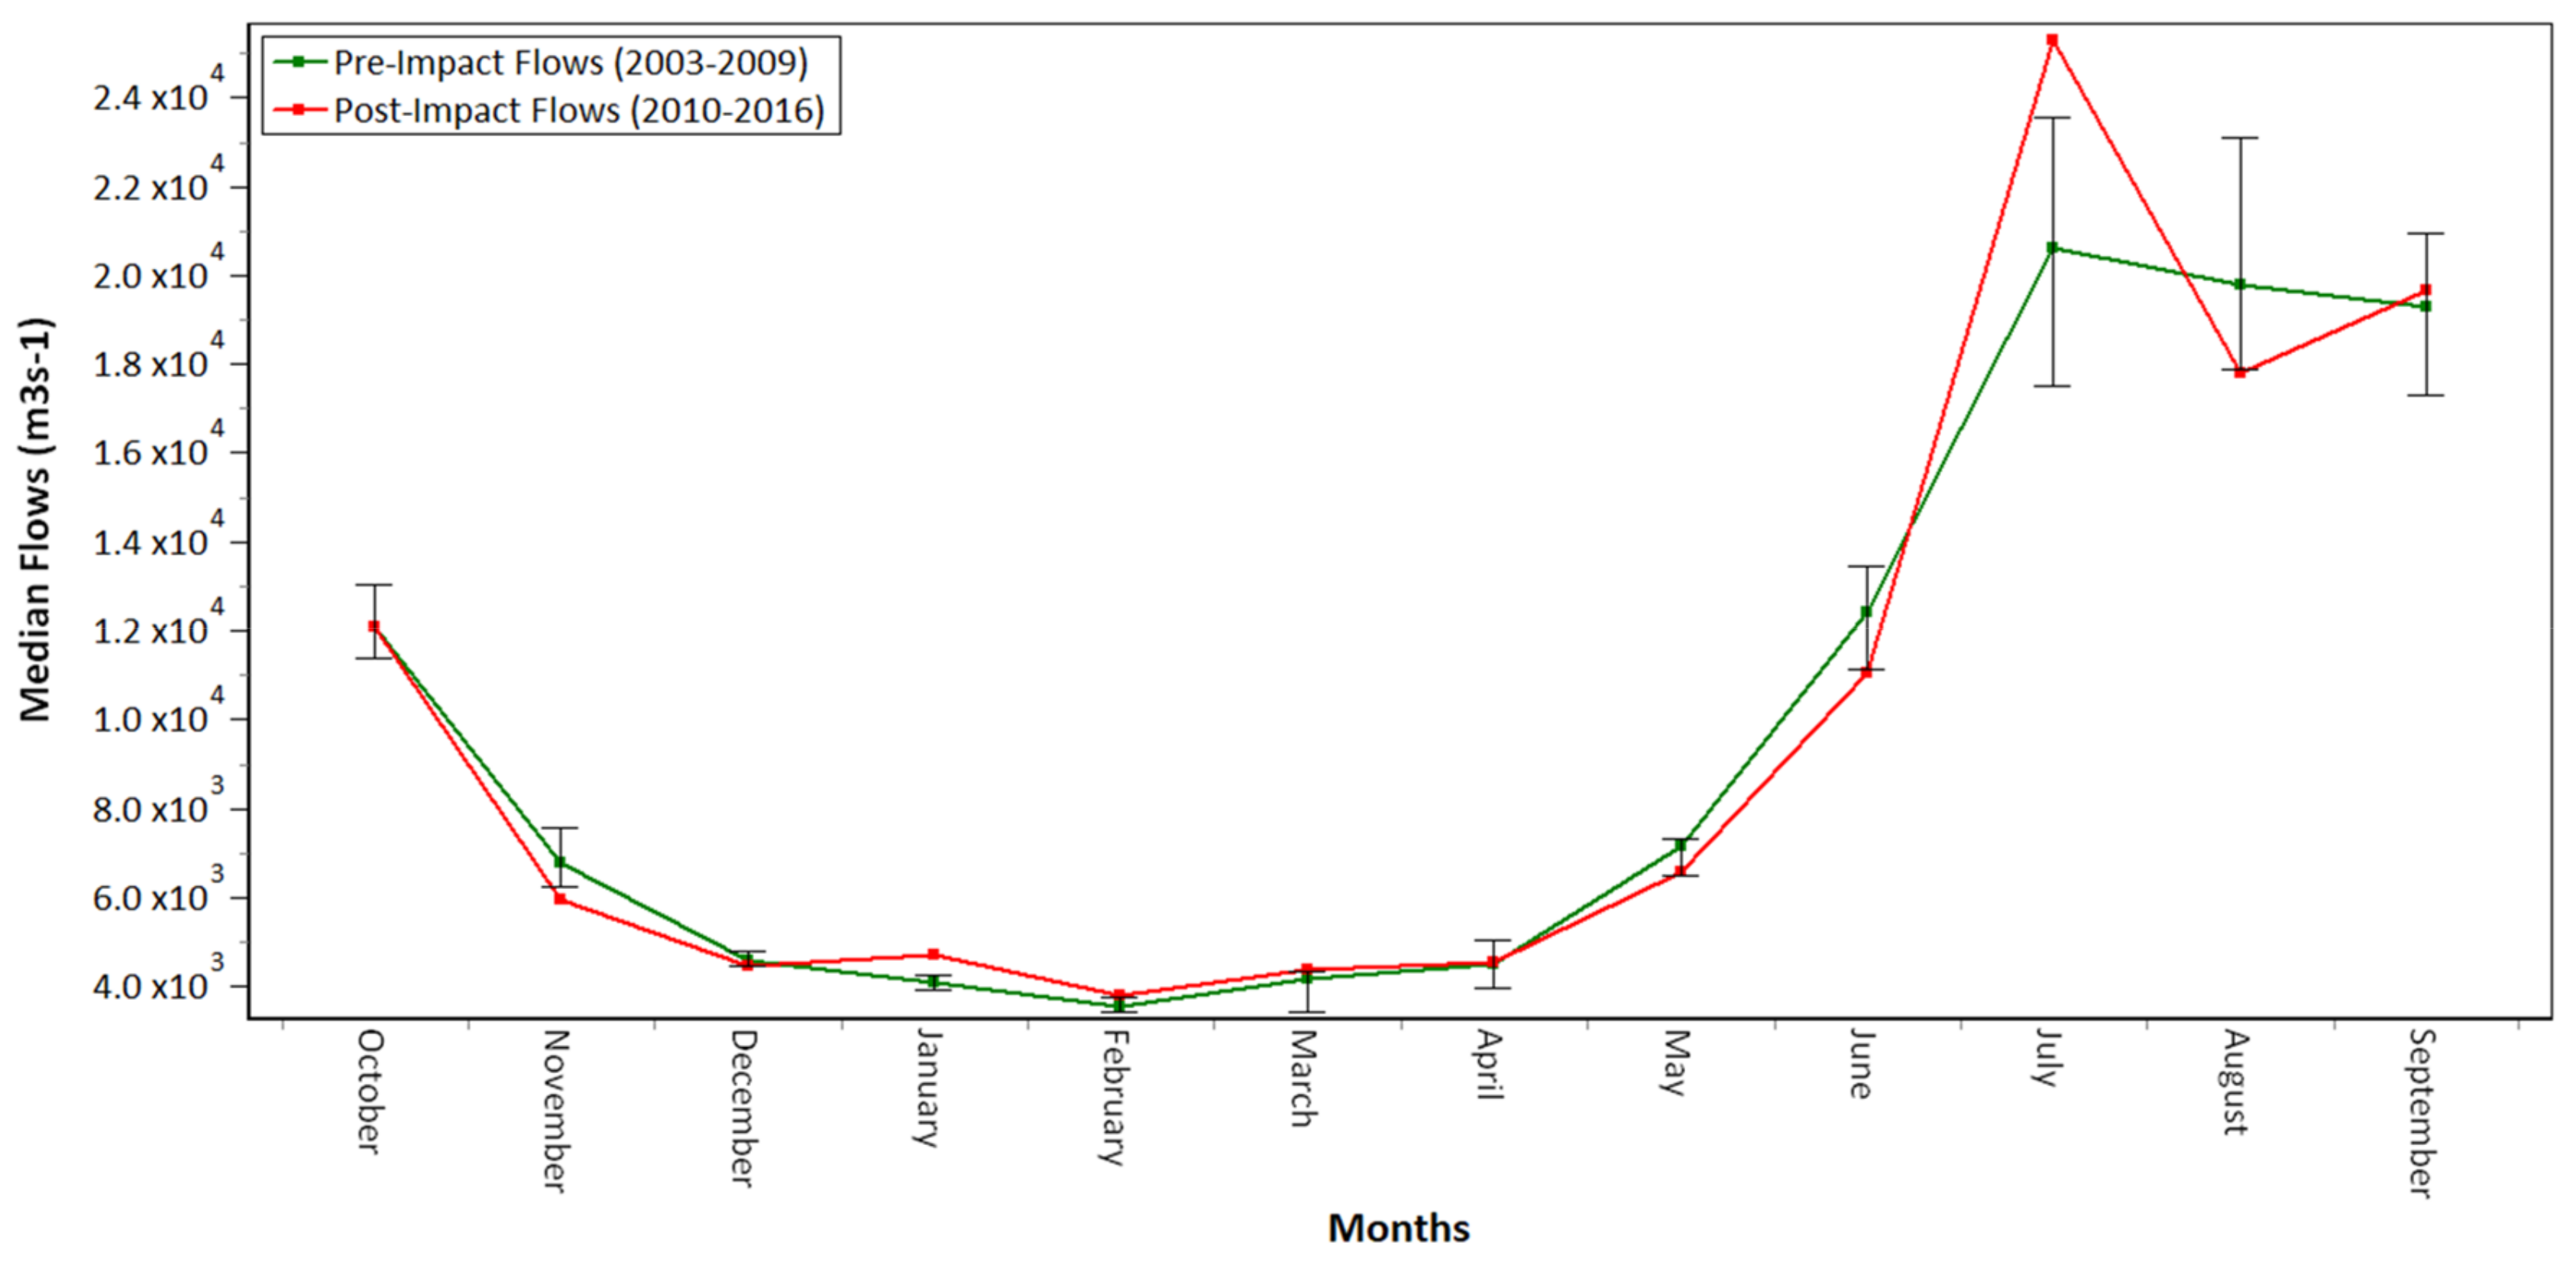
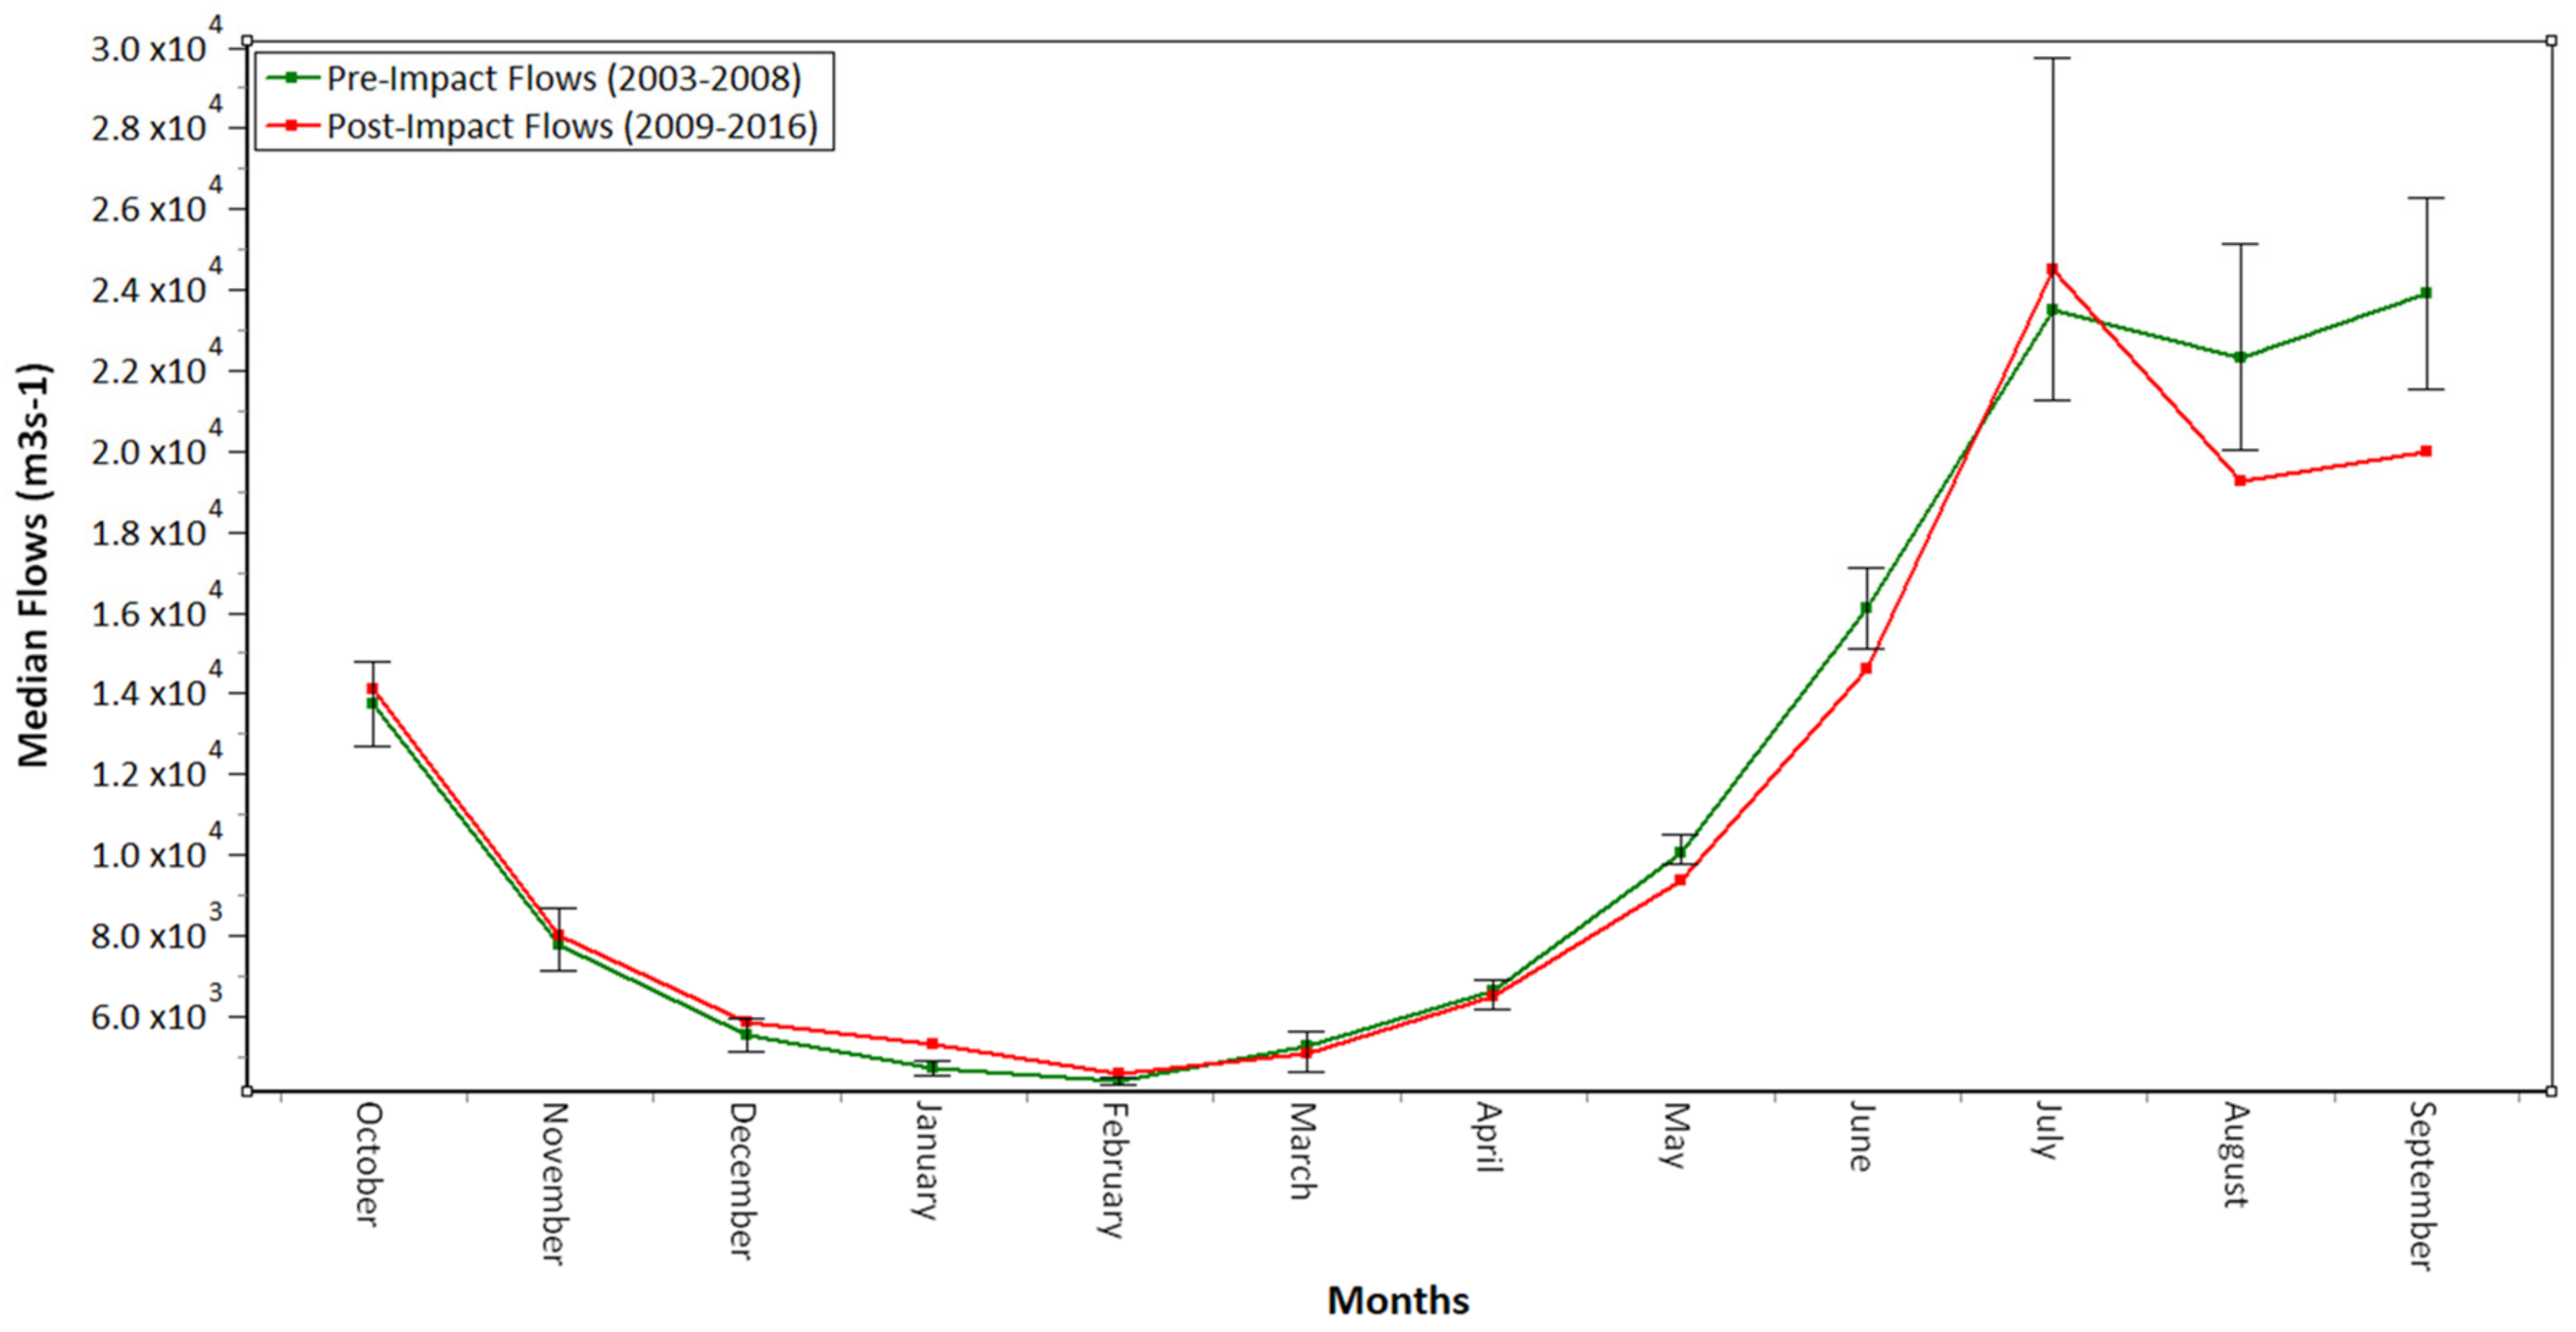
4.1. Magnitude of Monthly Flow

The user-friendly interface of the IHA method provides considerable information on flow, including pre- and post-impact on the flow regime. Vogel et al. [49] suggested the nondimensional measurements of eco-surplus and eco-deficit, which depend on a Flow Duration Curve (FDC). Critically, eco-surplus and eco-deficit could be calculated over any time of interest and respectively correspond to overall loss or increase in streamflow because of flow regulation during the specified period [49]. Richter et al. [50] proposed the range of variability method for describing river flow regime alteration utilising the IHA measurements and recommended that the 25th to 75th percentile range of these measurements could be utilised as river management purposes. Thus, Gao, Yang, Zhao, and Yang [25] proposed that the FDC 25th percentile and FDC 75th percentile could be utilised as the lower and upper limits of river ecosystem protection target downstream, and reclassified the terms of eco-deficit and eco-surplus. If the seasonal or annual FDC of a given year is below the FDC 25th percentile, the area between the seasonal or annual FDC and the FDC 25th percentile was defined as eco-deficit. This value refers to the water deficiency amount about the river ecosystem requirement. On the other hand, if the annual or seasonal FDC of a given year is situated over the 75th percentile FDC, the area between the annual or seasonal FDC and the 75th percentile FDC was called the eco-surplus. In the present study, the estimations of the eco-surplus and eco-deficit were divided by the annual median flow amount. Figure 4 shows that in the case of Cuntan Station, not only low flows but also high and medium flows are significantly reduced. A similar trend was also observed at Miaohe Station (Figure 5). Nevertheless, it should be noted that, in the case of Miaohe Station, reduction of the water volume is slightly higher than Cuntan Station. Significant impact of TGD on spatiotemporal pattern of river flow dynamics has also been reported in other studies [51,52]. Cai, Cowan, Briggs, and Raupach [51] estimated the impact of TGD on tide dynamics of the Yangtze River and reported high impact of the dam on tide dynamics during the autumn and winter. They also reported a substantial reduction in freshwater discharge during the wet-to-dry transition period but a slight increase in discharge during the dry season. Zhang et al. [53] reported that discharge in the Yangtze River after dam construction reduced by 3000–6000 m3/s at different points in the downstream. The flow difference occurs mainly due to the operation mode of the hydropower plant. Therefore, in this regards, better adjustment of the hydropower operation should be considered as potential measures to reduce flow alteration and therefore provide adequate e-flows downstream of the dam [13,27].
The approach proposed by Gao, Yang, Zhao, and Yang [25] better evaluates eco-deficit and eco-surplus because the median flow is not affected by extreme events. The FDC can be combined with this rating curve to derive a habitat duration curve and develop the relationship between habitat and eco-surplus/eco-deficit in streamflow. For instance, the ecological effect of dams on Chinese sturgeon habitat has become a significant concern in the Yangtze River. October is a crucial spawning period for Chinese sturgeon. However, flow during this time has considerably altered because of dam construction (Figure 4 and Figure 5). Other studies also reported the impact of flow regime change on river ecosystems. Cheng, Opperman, Tickner, Speed, Guo, and Chen [52] mentioned that the TGD caused profound effects on flow and sediment regimes of the Yangtze River, which also affected the geomorphology and ecology in the downstream. Zhou et al. [54] reported that the dam has significantly altered the river phosphorus content, which is a vital macronutrient of freshwaters. Gao et al. [55] monitored fish population distribution of the Yangtze River before and after construction of TGD and reported significant changes in species distributions due to dam construction. Wang et al. [56] evaluated the response of sediment geochemistry of the Yangtze River to TGD and found a decrease in Cd, Pb, and Zn in suspended sediments after dam construction. Dai et al. [57] assessed the trends in annual snail area burden in different provinces along the Yangtze River, both in the up- and downstream of the dam, and found that the total snail burden area remained more or less stable in upstream provinces, while it decreased in the downstream provinces after dam construction. Liu et al., in 2019, reported a significant decrease in fish species diversity of the river after dam construction. They also found extinction of a large number of native fish species and many species as endangered or vulnerable. Therefore, future studies may focus on developing the habitat–duration curve for Chinese sturgeon to present suitable environmental flows for ecological design and river management.
As an example, the monthly streamflow obtained at Cuntan Station is displayed in Figure 6. The month of July is selected as the median flow, which is usually found high. As can be seen in Figure 6, the flow varies from more than 15,000 m3/s to less than 25,000 m3/s from 2003 to 2009. However, the impact of the dam is evident on the streamflow. The flow is seen in the range of 25,000 to above 35,000 m3/s after dam construction.
Additionally, the 25th, median, and 75th percentiles of flow are also noticed to be altered. The 25th percentile is found low, and 75th percentile of flow is found high. The low and high flows are the release of water from the dam during July. The flow has a highest alteration in August, as well, it can be seen in Figure 6 that the flow varies from 6000 m3/s to more than 20,000 m3/s before the dam was constructed and varies from more than 12,000 m3/s to more than 25,000 m3/s after the construction of the dam. During September, it can be found as well that the flow varies from more than 10,000 m3/s to more than 25,000 m3/s before the construction of the dam and altered from less than 20,000 m3/s to more than 25,000 m3/s after the dam construction.
Similar to Cuntan, the monthly flows for Miaohe Station are shown in Figure 7. Like Cuntan, Figure 7 clearly shows the difference in the impact of the dam on Miaohe Station. The flow ranges between 14,000 m3/s and 24,000 m3/s in July, while after alteration it is found to be in the range of more than 14,000 m3/s to 25,000 m3/s. For August and September, as noticed in Figure 7, flow varies from less than 14,000 m3/s to more than 22,000 m3/s and from less than 14,000 m3/s to more than 24,000 m3/s from 2003 to 2009, respectively. The flow ranges from less than 14,000 m3/s to less than 20,000 m3/s and from less than 14,000 m3/s to more than 20,000 m3/s, respectively, after the construction of the dam.
Additionally, the 25th median and 75th percentiles of flow are also noticed to be altered, although it can be noted that flow has a decreasing trend in the lower part of the study period. For the sake of comparison, the impacts of the dam on median flow were analysed before and after the construction of the dam. The obtained results are presented in Table 2. The table shows the flows for pre- and post-impact for each month separately.
Furthermore, the differences in flow as the relative change in percentage are also shown in Table 2. A positive difference indicates an increase in flow, while a negative difference indicates a decreased in flow. As can be seen in the table, the flow is decreased in most of the months at Cuntan Station. The highest decrease occurs in October, which is estimated at −23.55%, which gradually starts decreasing from November to December. The highest increase of 35.44% can be seen in July, followed by May. It can be noticed that, even after the reservoir construction, flow is high during July. Zhang, Dong, Gupta, Wu, and Li [43] reported that flood season often coincides from June to September, where a large amount of water is released from the dam. Additionally, authorities also release a large amount of water to maintain the water level in the downstream part of the dam. The results obtained for Miaohe Station are displayed in Table 2 as well. The table also shows the positive and negative impact of flow over the station. However, its negative impacts or decreases in flow are observed in a more extended period of the year.
Similar to Cuntan, the highest flow is recorded in July, and the lowest flow is recorded in October. After July, flows start decreasing till November, this could be due to the release of water in the downstream side while it increases again in December to January. The months of February to April again show a decreased inflow. Overall, it can be remarked that Cuntan is more stable in terms of flow alteration compared to Miaohe Station.

4.2. Extreme Conditions

IHA considers several factors for the assessment of extremes inflow. Range of variability approach (RVA) is an analysis of two stations. Positive hydrologic alteration values indicate a higher frequency of values in the given range of variability (low, middle, or high) while negative values indicate a decreasing frequency. The RVA analysis (Figure 8 and Figure 9) shows a decrease in the frequency of minimum flows in the low RVA category and increase in the frequency of maximum flow in the low RVA category for Cuntan stations. In Cuntan Station, 30-day minimum and 1-day maximum had negative change. Both changes are noticed as −1.63% and −2.15%, respectively. On the other side, at Miaohe Station, detrimental changes are noticed in 1-day minimum, 3-day minimum, 7-day minimum, 30-day minimum, and base flow index. Furthermore, it can also be noticed that no zero flow was recorded during pre- and post-impact of the dam. Base flow, which is regarded as an impactful factor on the hydrology, is found to increase in Cuntan and decrease in Miaohe. The increase in base flow is due to the decreased inflow because of dam construction.
Over the same period, Miaohe Station showed decreasing in minimum flows, and 1-day maximum and 3-day maximum flows as well, but 7-day, 90-day and 30-day maximum flows are increasing in the low RVA categories.
It is most likely that these alterations are the result of increased frequencies of climate extremes. Increasing climate extremes have been reported in China in recent years [58]. Both stations experienced an increase in the frequency of low values for maximum flows. Overall, in terms of indicators, most changes were observed in the magnitude of monthly water conditions and the magnitude and duration of extreme annual conditions, particularly low flows for both stations. Moreover, frequency is decreased in low values of minimum flow. A summary in relative changes of the extremes in pre- and post-impact defined by IHA are presented in Table 3. Extremes are defined based on 1-, 3-, 7-, 30-, 90-day minimum and maximum flows, several days when the flow was zero and base flow index. The values in Table 3 indicate that there is an impact on all extremes; however, the 1-day minimum has the highest impact where the flow is reduced by −7.29% at Miaohe Station. Impact of TGD on minimum flow of the Yangtze River is also reported in [52,59]. Tian, Chang, Zhang, Wang, Wu, and Jiang [59] found significant increase in the annual mean low-flow after construction of a dam in the middle and lower Yangtze River. Cheng, Opperman, Tickner, Speed, Guo, and Chen [52] reported high influence of TGD on water security in the middle and lower Yangtze River. Mei et al. [60] argued that the decrease in minimum flow may be due to an increase in channel erosion. However, it can be noticed that overall, the post-impact of a dam on minimum flow is not as high as its impact on maximum flow.
Nevertheless, it should be noted that little deviation of the low flows from the natural regime has caused more implication in the ecosystem than the deviation of the maximum flows [50]. The results showed that there are positive and negative impacts on both stations. Cuntan Station mostly has positive impacts, while at Miaohe, negative impacts dominate permanently.

4.3. Timings of Annual Extreme Water

The third group of IHA provides information on the timings of annual extreme water conditions, and this group includes two parameters, i.e., first is the 1-day annual minimum water condition, while the second provides information on the 1-day annual maximum water condition. Both parameters are regarded as very important, and they provide crucial information on environmental disturbances or water stress in the aquatic ecosystem. The obtained results are presented in Table 4. Julian date of each annual 1-day minimum over Cuntan Station revealed that it had decreased 17% in the post-impact period. Likewise, Julian date of each annual 1-day maximum showed that days are 247 for pre-impact and 206 for the post-impact period. These changes reflect the effect of dam operation in the area. Similar to Cuntan, Miaohe showed a decrease in 1-day maximum, which was 229 in pre-impact and 206 in the post-impact period. Contrary to the maximum, the minimum showed an increase of 14%. Mei, Dai, Van Gelder, and Gao [60] and Tan et al. [61] also reported a decrease in peak flow in the downstream after the construction of the dam.

4.4. High and Low Pulses in Flow

The IHA categorised the frequency and duration of high pulses into group 4. Group 4 provides the information of parameters related to the occurrence of the duration of high and low water condition in a given year. These high and low conditions are defined based on 75th percentile above (high pulse) and 25th percentile below (low pulse) of the flow for the pre-impact period. The results obtained over Cuntan Station are displayed in Table 5.
The table showed that low pulse count and high pulse duration are reduced. It was noticed that low pulse is reduced to 20% while high pulse count is reduced to 40%. On the other side, low pulse and high pulse duration are found increased at Cuntan. This increase was noticed to be ≈162% for the low pulse duration while ≈133% for the high pulse duration. In Miaohe Station, low pulse count was found to increase while low pulse and high pulse count decreased. Whereas, no change was estimated in high pulse duration. Similar results were also obtained by Sojka et al. [62] over studying the hydrologic alteration over Powa River, Poland. Overall, it can be noted that low pulse count, high pulse count, and high pulse duration are slightly altered after the dam operation.

4.5. Rate and Frequency of Flow Changes

The parameters in group 5 of IHA show the rising rate, fall rate and reversals. Overall, these parameters provide information on abrupt changes in the interannual flow. The result obtained over Cuntan Station shown in Table 6 revealed that the rising rate is significantly decreased from 270 to 155 m3/s and slightly changed in fall rate. Fall rate was found to decrease from negative 230 to negative 250 m3/s. The number of reversals was also found to decrease from 124 in pre-impact to 77 in the post-impact period. Similar types of results are also noted in the study by Yan et al. [63], where they also reported a decrease in rising-rate when conducting a study over the lower Yellow River China. On the other side, Miaohe Station also showed quite similar results where rise and fall rates were found to decrease and increase, respectively. However, the number of reversals was found to increase in Miaohe and decreased in Cuntan.

5. Conclusions

This study enabled us to understand the impact of the cascade dams located upstream of the TGD in China on the river flow regime for the period 2003 to 2015. The assessment was carried out in two periods. In the first period, the flow patterns were assessed before the construction of the dam, pre-impact (i.e., 2003 to 2009). In the second period, the post-impacts of the dam were assessed from 2012 to 2015. The data obtained from Cuntan and Miaohe stations were utilised for these purposes. The main findings are: 1) it is noted that the construction of the dams has profoundly impacted the flow patterns of the river; 2) the flow was assessed in each month separately and it was noticed that there are a positive and negative impact on the flow of dam in the upstream part; 3) the flow was found to vary in different months over different locations; 4) the highest increase was seen in the month of July while the lowest decrease in October; 5) the results of extremes showed that the impacts of the dams were significantly high on 1-day maximum extremes, which have reduced flow in Cuntan and increase in Miaohe; 6) similarly, a high impact in the 90-day maximum reduced flow in both stations; 7) base flow was found to increase in Cuntan and decrease in Miaohe; 9) the low pulse count and high pulse duration are noted as reduced in Cuntan while low pulse and high pulse count are found to be increased; and 10) the rise–fall rates and a number of reversals are found to be deceased in Cuntan and increased in Miaohe. Therefore, it can be remarked that the results of the study can be useful for monitoring and developing adaptation measures to eradicate the negative impacts of the dams in the region. In the present study, the time spans were used as the pre-impact and post-impact periods (2003–2009 and 2012–2015 respectively) due to unavailability of data. The study can be repeated in future using the same time spans for pre-impact and post-impact periods when data will be available. The classical RVA has a number of limitations, such as it considers parameter variations only within the target range. To overcome the limitations, several modified versions have been made which can be used in future for better analysis of river flow regime changes.

Author Contributions

Conceptualization, R.A., A.K.; Data curation, R.A., S.A.; Formal analysis, R.A., A.K., S.A.; Supervision, A.K. and O.K.; Writing—original draft, R.A.; Writing—review & editing, R.A., A.K., O.K. All authors collaborated in carrying out this research.

Funding

The authors wish to sincerely thank the China Scholarship Council, China Three Gorges University for funding this study. Alban Kuriqi received a PhD grant from the Fundação para a Ciência e a Tecnologia, I.P. (FCT), Portugal, under the PhD Programme FLUVIO–River Restoration and Management, grant number: PD/BD/114558/2016.

Acknowledgments

The authors wish to sincerely thank the China Scholarship Council, China Three Gorges University, the Hydrologic Data Centre of the Ministry of Water Resources in China for providing data in this study, and the anonymous reviewers for their valuable comments. We are grateful to the developers of Indicators of Hydrologic Alteration (IHA) for providing free software.

Conflicts of Interest

The authors declare no conflict of interest.

References

  1. Wang, X.-J.; Jian-Yun, Z.; Shahid, S.; El Mahdi, A.; Rui-min, H.; Zhen-Xin, B.; Ali, M. Water resources management strategy for adaptation to droughts in China. Mitig. Adapt. Strateg. Glob. Chang. 2012, 17, 923–937. [Google Scholar] [CrossRef] [Green Version]
  2. Khan, N.; Pour, S.H.; Shahid, S.; Ismail, T.; Ahmed, K.; Chung, E.S.; Nawaz, N.; Wang, X. Spatial distribution of secular trends in rainfall indices of Peninsular Malaysia in the presence of long-term persistence. Meteorol. Appl. 2019. [Google Scholar] [CrossRef]
  3. Ahmed, K.; Shahid, S.; Chung, E.-S.; Wang, X.-J.; Harun, S.B. Climate Change Uncertainties in Seasonal Drought Severity-Area-Frequency Curves: Case of Arid Region of Pakistan. J. Hydrol. 2019, 570, 473–485. [Google Scholar] [CrossRef]
  4. Ali, R.; Ismael, A.; Heryansyah, A.; Nawaz, N. Long Term Historic Changes in the Flow of Lesser Zab River, Iraq. Hydrology 2019, 6, 22. [Google Scholar] [CrossRef]
  5. Ardıçlıoğlu, M.; Kuriqi, A. Calibration of channel roughness in intermittent rivers using HEC-RAS model: Case of Sarimsakli creek, Turkey. SN Appl. Sci. 2019, 1. [Google Scholar] [CrossRef]
  6. McAllister, D.E.; Craig, J.F.; Davidson, N.; Delany, S.; Seddon, M. Biodiversity impacts of large dams. Backgr. Pap. 2001, 1, 59–68. [Google Scholar]
  7. Ahn, J.M.; Lyu, S. The impact of water-intake for a tributary on the flow and saline intrusion in the lower Han River. KSCE J. Civ. Eng. 2017, 21, 1945–1955. [Google Scholar] [CrossRef]
  8. Billington, D.P.; Jackson, D.C.; Melosi, M.V. The History of Large Federal Dams: Planning, Design and Construction; US Department of the Interior, Bureau of Reclamation: Las Vegas, NV, USA, 2005.
  9. Kuriqi, A.; Ardiçlioglu, M.; Muceku, Y. Investigation of seepage effect on river dike’s stability under steady state and transient conditions. Pollack Period. 2016, 11, 87–104. [Google Scholar] [CrossRef]
  10. Richter, B.D.; Postel, S.; Revenga, C.; Scudder, T.; Lehner, B.; Churchill, A.; Chow, M. Lost in development’s shadow: The downstream human consequences of dams. Water Altern. 2010, 3, 14–42. [Google Scholar]
  11. Sakaris, P.C. A review of the effects of hydrologic alteration on fisheries and biodiversity and the management and conservation of natural resources in regulated river systems. In Current Perspectives in Contaminant Hydrology and Water Resources Sustainability; InTech: London, UK, 2013. [Google Scholar]
  12. Kuriqi, A.; Ardiçlioǧlu, M. Investigation of hydraulic regime at middle part of the Loire River in context of floods and low flow events. Pollack Period. 2018, 13, 145–156. [Google Scholar] [CrossRef]
  13. Kuriqi, A.; Pinheiro, A.; Sordo-Ward, A.; Garrote, L. Trade-off between environmental flow policy and run-of-river hydropower generation in Mediterranean climate. Eur. Water 2017, 60, 123–130. [Google Scholar]
  14. Kuriqi, A.; Rivaes, R.; Sordo-Ward, A.; Pinheiro, A.N.; Garrote, L. Comparison and validation of hydrological e-flow methods through hydrodynamic modelling. In Proceedings of the EGU General Assembly Conference, Vienna, Austria, 23–28 April 2017; p. 13634. [Google Scholar]
  15. Petts, G.E. Instream Flow Science For Sustainable River Management. JAWRA J. Am. Water Resour. Assoc. 2009, 45, 1071–1086. [Google Scholar] [CrossRef] [Green Version]
  16. Hayes, D.S.; Brandle, J.M.; Seliger, C.; Zeiringer, B.; Ferreira, T.; Schmutz, S. Advancing towards functional environmental flows for temperate floodplain rivers. Sci Total Environ. 2018, 633, 1089–1104. [Google Scholar] [CrossRef]
  17. Olden, J.D.; Poff, N. Redundancy and the choice of hydrologic indices for characterizing streamflow regimes. River Res. Appl. 2003, 19, 101–121. [Google Scholar] [CrossRef]
  18. Ge, J.; Peng, W.; Huang, W.; Qu, X.; Singh, S.K. Quantitative Assessment of Flow Regime Alteration Using a Revised Range of Variability Methods. Water 2018, 10, 597. [Google Scholar] [CrossRef]
  19. Song, X.; Zhuang, Y.; Wang, X.; Li, E. Combined Effect of Danjiangkou Reservoir and Cascade Reservoirs on Hydrologic Regime Downstream. J. Hydrol. Eng. 2018, 23, 05018008. [Google Scholar] [CrossRef]
  20. Vu, T.; Kiesel, J.; Guse, B.; Fohrer, N. Towards an improved understanding of hydrological change–linking hydrologic metrics and multiple change point tests. J. Water Clim. Chang. 2018, 1. [Google Scholar] [CrossRef]
  21. Yang, T.; Zhang, Q.; Chen, Y.D.; Tao, X.; Xu, C.Y.; Chen, X. A spatial assessment of hydrologic alteration caused by dam construction in the middle and lower Yellow River, China. Hydrol. Process. Int. J. 2008, 22, 3829–3843. [Google Scholar] [CrossRef]
  22. Linnansaari, T.; Monk, W.; Baird, D.; Curry, R. Review of approaches and methods to assess Environmental Flows across Canada and internationally. DFO Can. Sci. Advis. Secr. Res. Doc. 2012, 39, 1–74. [Google Scholar]
  23. Richter, B.D.; Baumgartner, J.V.; Powell, J.; Braun, D.P. A method for assessing hydrologic alteration within ecosystems. Conserv. Biol. 1996, 10, 1163–1174. [Google Scholar] [CrossRef]
  24. Zuo, Q.; Liang, S. Effects of dams on river flow regime based on IHA/RVA. Proc. Int. Assoc. Hydrol. Sci. 2015, 368, 275–280. [Google Scholar] [CrossRef] [Green Version]
  25. Gao, B.; Yang, D.; Zhao, T.; Yang, H. Changes in the eco-flow metrics of the Upper Yangtze River from 1961 to 2008. J. Hydrol. 2012, 448–449, 30–38. [Google Scholar] [CrossRef]
  26. Yu, Y.; Wang, C.; Wang, P.; Hou, J.; Qian, J. Assessment of multi-objective reservoir operation in the middle and lower Yangtze River based on a flow regime influenced by the Three Gorges Project. Ecol. Inform. 2017, 38, 115–125. [Google Scholar] [CrossRef]
  27. Kuriqi, A.; Pinheiro, A.N.; Sordo-Ward, A.; Garrote, L. Influence of hydrologically based environmental flow methods on flow alteration and energy production in a run-of-river hydropower plant. J. Clean. Prod. 2019, 232, 1028–1042. [Google Scholar] [CrossRef]
  28. Koel, T.M.; Sparks, R.E. Historical patterns of river stage and fish communities as criteria for operations of dams on the Illinois River. River Res. Appl. 2002, 18, 3–19. [Google Scholar] [CrossRef]
  29. Shiau, J.-T.; Wu, F.-C. Feasible diversion and instream flow release using range of variability approach. J. Water Resour. Plan. Manag. 2004, 130, 395–404. [Google Scholar] [CrossRef]
  30. Yang, S.; Milliman, J.; Li, P.; Xu, K. 50,000 dams later: Erosion of the Yangtze River and its delta. Glob. Planet. Chang. 2011, 75, 14–20. [Google Scholar] [CrossRef]
  31. Wu, J.; Gao, X.; Giorgi, F.; Chen, Z.; Yu, D. Climate effects of the Three Gorges Reservoir as simulated by a high resolution double nested regional climate model. Quat. Int. 2012, 282, 27–36. [Google Scholar] [CrossRef] [Green Version]
  32. Wang, Y.; Wang, D.; Lewis, Q.W.; Wu, J.; Huang, F. A framework to assess the cumulative impacts of dams on hydrological regime: A case study of the Yangtze River. Hydrol. Process. 2017, 31, 3045–3055. [Google Scholar] [CrossRef]
  33. Ali, R.; Kuriqi, A.; Abubaker, S.; Kisi, O. Long-Term Trends and Seasonality Detection of the Observed Flow in Yangtze River Using Mann-Kendall and Sen’s Innovative Trend Method. Water 2019, 11, 1855. [Google Scholar] [CrossRef]
  34. OECD. OECD Environmental Performance Reviews: China; OECD: Paris, France, 2007. [Google Scholar]
  35. Liu, X.; Beusen, A.H.; Van Beek, L.P.; Mogollón, J.M.; Ran, X.; Bouwman, A.F. Exploring spatiotemporal changes of the Yangtze River (Changjiang) nitrogen and phosphorus sources, retention and export to the East China Sea and Yellow Sea. Water Res. 2018, 142. [Google Scholar] [CrossRef] [PubMed]
  36. Yang, X.; Lu, X. Model of water regulation in the Yangtze River Basin and its effects using remote sensing techniques. In Proceedings of the IAHS International Commission on Continental Erosion Symposium, Chengdu, China, 11–15 October 2012; IAHS-AISH Publication: Wallingford, UK, 2012; Volume 356, pp. 235–243. [Google Scholar]
  37. Li, Z.; Yang, D.; Hong, Y.; Zhang, J.; Qi, Y. Characterizing spatiotemporal variations of hourly rainfall by gauge and radar in the mountainous Three Gorges region. J. Appl. Meteorol. Climatol. 2014, 53, 873–889. [Google Scholar] [CrossRef]
  38. Wu, H.; Li, J.; Song, F.; Zhang, Y.; Zhang, H.; Zhang, C.; He, B. Spatial and temporal patterns of stable water isotopes along the Yangtze River during two drought years. Hydrol. Process. 2018, 32, 4–16. [Google Scholar] [CrossRef]
  39. Zhao, F.; Shepherd, M. Precipitation changes near Three Gorges Dam, China. Part I: A spatiotemporal validation analysis. J. Hydrometeorol. 2012, 13, 735–745. [Google Scholar] [CrossRef]
  40. Yang, Z.-S.; Wang, H.-J.; Saito, Y.; Milliman, J.; Xu, K.; Qiao, S.; Shi, G. Dam impacts on the Changjiang (Yangtze) River sediment discharge to the sea: The past 55 years and after the Three Gorges Dam. Water Resour. Res. 2006, 42. [Google Scholar] [CrossRef]
  41. Sutton, A. The Three Gorges Project on the Yangtze River in China. Geography 2004, 89, 111–126. Available online: jstor.org/stable/40573956.
  42. Yu, H.C.; Liu, H.D.; Huang, Z.Q.; Shi, G.C. Experimental study on time-dependent behavior of silty mudstone from the Three Gorges Reservoir Area, China. KSCE J. Civ. Eng. 2017, 21, 715–724. [Google Scholar] [CrossRef]
  43. Zhang, X.; Dong, Z.; Gupta, H.; Wu, G.; Li, D. Impact of the Three Gorges Dam on the hydrology and ecology of the Yangtze River. Water 2016, 8, 590. [Google Scholar] [CrossRef]
  44. Chen, J.; Fang, X.; Wen, Z.; Chen, Q.; Ma, M.; Huang, Y.; Wu, S.; Yang, L. Spatio-Temporal Patterns and Impacts of Sediment Variations in Downstream of the Three Gorges Dam on the Yangtze River, China. Sustainability 2018, 10, 4093. [Google Scholar] [CrossRef]
  45. Long, L.-H.; Xu, H.; Ji, D.-B.; Cui, Y.-J.; Liu, D.-F.; Song, L.-X. Characteristic of the water temperature lag in Three Gorges Reservoir and its effect on the water temperature structure of tributaries. Environ. Earth Sci. 2016, 75, 1459. [Google Scholar] [CrossRef]
  46. Mathews, R.; Richter, B.D. Application of the Indicators of hydrologic alteration software in environmental flow setting. JAWRA J. Am. Water Resour. Assoc. 2007, 43, 1400–1413. [Google Scholar] [CrossRef]
  47. Gao, Y.; Vogel, R.M.; Kroll, C.N.; Poff, N.L.; Olden, J.D. Development of representative indicators of hydrologic alteration. J. Hydrol. 2009, 374, 136–147. [Google Scholar] [CrossRef]
  48. Richter, B.D.; Baumgartner, J.V.; Braun, D.P.; Powell, J. A spatial assessment of hydrologic alteration within a river network. Regul. Rivers Res. Manag. Int. J. Devoted River Res. Manag. 1998, 14, 329–340. [Google Scholar] [CrossRef]
  49. Vogel, R.M.; Sieber, J.; Archfield, S.A.; Smith, M.P.; Apse, C.D.; Huber-Lee, A. Relations among storage, yield, and instream flow. Water Resour. Res. 2007, 43. [Google Scholar] [CrossRef]
  50. Richter, B.; Baumgartner, J.; Wigington, R.; Braun, D. How much water does a river need? Freshw. Biol. 1997, 37, 231–249. [Google Scholar] [CrossRef] [Green Version]
  51. Cai, W.; Cowan, T.; Briggs, P.; Raupach, M. Rising temperature depletes soil moisture and exacerbates severe drought conditions across southeast Australia. Geophys. Res. Lett. 2009, 36. [Google Scholar] [CrossRef]
  52. Cheng, L.; Opperman, J.J.; Tickner, D.; Speed, R.; Guo, Q.; Chen, D. Managing the Three Gorges Dam to implement environmental flows in the Yangtze River. Front. Environ. Sci. 2018, 6, 64. [Google Scholar] [CrossRef]
  53. Zhang, W.; Gao, Y.; Xu, Q.; Yuan, J. Changes in dominant discharge and their influential factors in the middle and lower reaches of Yangtze River after the Three Gorges Dam impoundment. Adv. Water Sci 2018, 29, 331–338. [Google Scholar]
  54. Zhou, J.; Zhang, M.; Li, Z. Dams altered Yangtze River phosphorus and restoration countermeasures. J. Lake Sci. 2018, 30, 865–880. [Google Scholar]
  55. Gao, X.; Fujiwara, M.; Winemiller, K.O.; Lin, P.; Li, M.; Liu, H. Regime shift in fish assemblage structure in the Yangtze River following construction of the Three Gorges Dam. Sci. Rep. 2019, 9, 4212. [Google Scholar] [CrossRef]
  56. Wang, H.; Ran, X.; Li, J.; Liu, J.; Wu, W.; Li, M.; Zang, J. Response of the sediment geochemistry of the Changjiang River (Yangtze River) to the impoundment of the Three Gorges Dam. J. Environ. Sci. 2019, 83, 161–173. [Google Scholar] [CrossRef] [PubMed]
  57. Dai, S.-M.; Edwards, J.; Guan, Z.; Lv, S.; Li, S.-Z.; Zhang, L.-J.; Feng, J.; Feng, N.; Zhou, X.-N.; Xu, J. Change patterns of oncomelanid snail burden in areas within the Yangtze River drainage after the three gorges dam operated. Infect. Dis. Poverty 2019, 8, 48. [Google Scholar] [CrossRef] [PubMed]
  58. Wang, X.-J.; Zhang, J.-Y.; Shamsuddin, S.; Oyang, R.-l.; Guan, T.-S.; Xue, J.-G.; Zhang, X. Impacts of climate variability and changes on domestic water use in the Yellow River Basin of China. Mitig. Adapt. Strateg. Glob. Chang. 2017, 22, 595–608. [Google Scholar] [CrossRef]
  59. Tian, J.; Chang, J.; Zhang, Z.; Wang, Y.; Wu, Y.; Jiang, T. Influence of Three Gorges Dam on Downstream Low Flow. Water 2019, 11, 65. [Google Scholar] [CrossRef]
  60. Mei, X.; Dai, Z.; Van Gelder, P.; Gao, J. Linking three Gorges Dam and downstream hydrological regimes along the Yangtze River, China. Earth Space Sci. 2015, 2, 94–106. [Google Scholar] [CrossRef]
  61. Tan, G.; Chen, P.; Deng, J.; Xu, Q.; Tang, R.; Feng, Z.; Xiong, Y. Estimations and changes of the dominant discharge in Three Gorges Reservoir channel. Arab. J. Geosci. 2019, 12, 82. [Google Scholar] [CrossRef] [Green Version]
  62. Sojka, M.; Jaskuła, J.; Wicher-Dysarz, J.; Dysarz, T. Assessment of dam construction impact on hydrological regime changes in lowland river–A case of study: The Stare Miasto reservoir located on the Powa River. J. Water Land Dev. 2016, 30, 119–125. [Google Scholar] [CrossRef]
  63. Yan, Y.; Yang, Z.; Liu, Q.; Sun, T. Assessing effects of dam operation on flow regimes in the lower Yellow River. Procedia Environ. Sci. 2010, 2, 507–516. [Google Scholar] [CrossRef] [Green Version]
Figure 1. Locations of the hydrologic stations along the Yangtze River (adapted from [45]).
Sustainability 11 05176 g001
Figure 2. The time series of daily river flow (up) and the anomaly of annual average of daily flow at Miaohe station for the period 2003–2015 (down).
Sustainability 11 05176 g002
Figure 3. The time series of daily river flow (up) and the anomaly of annual average of daily flow at Miaohe station for the period 2003–2015.
Sustainability 11 05176 g003
Figure 4. Annual flow duration curve showing exceedance probability eco-deficit and eco-surplus events for Cuntan Station.
Sustainability 11 05176 g004
Figure 5. Annual flow duration curve showing exceedance probability eco-deficit and eco-surplus events for Miaohe Station.
Sustainability 11 05176 g005
Figure 6. The pre- and post-impact on monthly flows at Cuntan Station.
Sustainability 11 05176 g006
Figure 7. The pre- and post-impact on monthly flows at Miaohe Station.
Sustainability 11 05176 g007
Figure 8. RVA categorisation of hydrologic indicators at Cuntan Station.
Sustainability 11 05176 g008
Figure 9. RVA categorisation of hydrologic indicators at Miaohe Station.
Sustainability 11 05176 g009
Table 1. Hydrologic alteration indicators used in the Indicators of Hydrologic Alteration (IHA) approach adopted after [23].
Group 1: Magnitude of Monthly Water Flow Rates (m3/s)Group 2: Magnitude and Duration of Annual Extreme Water Flow Rates (m3/s)Group 3: Timing of Annual Extreme Water Flow RatesGroup 4: Frequency and Duration of High and Low PulsesGroup 5: Rate and Frequency of Water Flow Rate Changes
January1-Day minimumDate of minimumLow pulse countRise rate
February3-Day minimumDate of maximumLow pulse durationFall rate
March7-Day minimum High pulse countNumber of reversals
April30-Day minimum High pulse duration
May90-Day minimum
June1-Day maximum
July3-Day maximum
August7-Day maximum
September30-Day maximum
October90-Day maximum
NovemberBase flow index (dimensionless)
December
Table 2. Impact of a dam on the flow during different months at Cuntan and Miaohe stations.
MonthCuntan StationMiaohe Station
Pre-Impact (m3/s)Post-Impact (m3/s)Relative Change (%)Pre-Impact (m3/s)Post-Impact (m3/s)Relative Change (%)
January410041100.24480051807.92
February356035800.5644504370−1.80
March41904120−1.6752505011−4.55
April45154475−0.8968306200−9.22
May7140812013.7310,30010,5402.33
June12,40011,250−9.2715,20015,3500.99
July20,60027,90035.4423,70030,14027.17
August19,80019,700−0.5122,70021,130−6.92
September19,30019,6501.8122,35022,300−0.22
October12,1009250−23.5513,90010,500−24.46
November67955945−12.5178007587−2.73
December45904360−5.01569058613.01
Table 3. Extremes in pre-impact and post-impact of the dam at Cuntan and Miaohe stations.
IHA FactorCuntan StationMiaohe Station
Pre-Impact (m3/s)Post-Impact (m3/s)Relative Change (%)Pre-Impact (m3/s)Post-Impact (m3/s)Relative Change (%)
1-day minimum320032401.2539103625−7.29
3-day minimum322732871.8639733817−3.93
7-day minimum329333712.3740613930−3.23
30-day minimum36283569−1.6343264317−0.21
90-day minimum381138781.76468147912.35
1-day maximum46,50045,500−2.1545,80054,40018.78
3-day maximum41,,77044,6006.7844,43049,90012.31
7-day maximum35,84038,4607.3140,74044,5409.33
30-day maximum26,27029,98014.1231,69034,0107.32
90-day maximum21,55026,45022.7425,82028,46010.22
Number of zero-days00 00
Base flow index0.300.313.190.310.30−1.56
Table 4. Timings of extreme annual discharge in pre- and post-impact of the dam at Cuntan and Miaohe stations.
IHA FactorCuntan StationMiaohe Station
Pre-Impact Post-Impact Relative Change (%)Pre-Impact Post-Impact Relative Change (%)
Date of minimum4638−17.39414714.63
Date of maximum247206−16.59229206−10.04
Table 5. IHA parameters obtained for group 4 over Cuntan and Miaohe stations.
IHA FactorCuntan StationMiaohe Station
Pre-ImpactPost-ImpactRelative Change (%)Pre-ImpactPost-ImpactRelative Change (%)
Low pulse count54−205980
Low pulse duration410.5162.5112−81.81
High pulse count53−4065−16.66
High pulse duration614133.33550
Table 6. Rate and frequency of flow changes in pre-, and post-impact of the dam over Cuntan and Miaohe stations.
IHA FactorCuntan StationMiaohe Station
Pre-Impact (m3/s) Post-Impact (m3/s)Relative Change (%)Pre-Impact
(m3/s)
Post-Impact
(m3/s)
Relative Change (%)
Rise rate270155−42.59450365−18.88
Fall rate−230−2508.69−400−46315.75
Number of reversals12477−37.901311439.16

