Effectiveness of Dynamic Insertion Scheduling Strategy for Demand-Responsive Paratransit Vehicles Using Agent-Based Simulation


Department of Civil and Environmental Engineering, University of South Carolina, Columbia, SC 29208, USA
*
Author to whom correspondence should be addressed.
Sustainability 2019, 11(19), 5391; https://0-doi-org.brum.beds.ac.uk/10.3390/su11195391
Submission received: 16 August 2019
/
Revised: 25 September 2019
/
Accepted: 27 September 2019
/
Published: 29 September 2019
(This article belongs to the Section Sustainable Transportation)
Abstract
:This paper deals with the scheduling of paratransit vehicles. The current scheduling method utilized by paratransit providers is to provide a door-to-door ride for those customers who have made reservations. Thus, the paratransit providers know in advance the pickup and drop-off locations of each customer. Using this information, they are able to determine a route for each vehicle to minimize the total operating costs. In the current scheduling method, vehicles are not allowed to pick up unscheduled customers. This practice often leads to low seat utilization. To address this shortcoming, this paper explores the idea of allowing vehicles to pick up unscheduled customers who are in close proximity to the prescheduled stops (referred to as the dynamic response area or DRA). To this end, this paper develops an agent-based simulation model to evaluate the effectiveness of this strategy. The model was tested using the Chicago network. The results of the simulation experiments indicate that (1) the proposed strategy is able to serve more customers using the same fleet size, and (2) the proposed strategy will not significantly affect the scheduled customers’ in-vehicle travel time.
1. Introduction
Paratransit plays an important role in public transportation accessibility for senior citizens and people with disabilities. In the USA, this service is also known as demand-responsive (DR). Those who are eligible to use this system are provided with door-to-door service at their requested time. The American Public Transportation Association (APTA) in 2012 reported that the average number of paratransit trips per month in Los Angeles and Chicago was 265,794 and 289,022, respectively. The number of trips over the five-year period from 2007 to 2012 showed a 15% and 23% increase in paratransit demand annually in Los Angeles and Chicago, respectively. This suggests that there is increasing demand for this mode of transportation. To meet the demand, it is crucial for paratransit providers to have an efficient method to schedule routes for their vehicles such that they maximize the number of customers served while minimizing the total operating cost.
Paratransit operates in response to demand. Customers need to make reservations in advance. These requests have to be met by the paratransit providers. On occasion, due to emergencies, customers make requests for a ride on the same day of the call and possibly even a few minutes before the requested pickup time. These dynamic requests do not have to be met by providers, and providers are not penalized for not accommodating such requests. However, if their request is accepted, the customer probably gets a cheaper ride than their alternative. However, given that the providers’ revenues are indirectly dependent on the number of customers served, it is in the best interest of providers to serve as many customers as possible. The provider’s revenue is not directly dependent on the number of customers served because the drivers are paid on a per-hour basis, so additional passengers do not generally translate into increased revenue. However, additional customers would motivate paratransit providers to give an incentive to paratransit drivers for each dynamic request served.
There are several strategies that most paratransit providers use to provide service to their customers. These strategies are “no zoning,” “independent zoning,” and “zoning with transfer points” [1]. The “no zoning” strategy considers the entire city as a single zone. Thus, drivers might be tasked with picking up/dropping off customers from/to any part of the city. “Independent zoning” and “zoning with transfer points” are the most commonly used strategies in the United States. The “independent zoning” strategy allows the provider to serve those customers who need a ride from the provider’s zone to other zones. A significant characteristic of this strategy is that it allows vehicles to travel outside their original zone to drop off customers. The “zoning with transfer points” strategy prohibits vehicles from traveling outside their assigned zones. To transport customers from one zone to another, vehicles coordinate the pickup and drop-off at transfer points (located along the zonal boundaries).
In the aforementioned strategies, the in-vehicle travel time of customers cannot exceed 1.5 to 2.5 times the travel time it would take to provide a direct ride from the customers’ origins to destinations. In the “independent zoning” and “zoning with transfer points” strategies, most providers in the USA divide the city into a reasonable number of zones (2–4) to maximize their level of service for customers.
The objective of this paper is to evaluate a potential new strategy for scheduling paratransit vehicles. This strategy would allow vehicles to pick up unscheduled customers who are in close proximity to the prescheduled stops (referred to as the dynamic response area or DRA). It is speculated that this strategy would lead to higher vehicle utilization and thus more indirect revenue for the providers. However, it also has the potential to lower the level of service for scheduled customers. To evaluate the pros and cons of this strategy, an agent-based simulation model is developed to allow for comprehensive assessment of different strategy parameters, particularly the DRA.
The rest of the paper is organized as follows. Section 2 provides a review of related studies. Section 3 presents the proposed scheduling strategy. Section 4 provides the agent-based simulation model. Section 5 describes experimental design. Section 6 discusses the experimental results. Lastly, conclusions are discussed in Section 7.
2. Literature Review
Vehicle-routing problems with time windows have been well documented in the literature [2,3,4,5]. The dial-a-ride problem is a well-known problem in the vehicle-routing area. There is a large number of published studies on this topic, all of which aim to find better vehicle schedules to minimize the cost of operation and maximize the level of service. Cordeau and Laporte and Berbeglia et al. [6,7] reviewed a broad range of dial-a-ride problems and presented a classification of problems and their solutions. The development of exact, heuristic, and meta-heuristic approaches is the main focus of studies in this area. Some researchers have worked on the dynamic dial-a-ride problem. Coslovich el al. [8] suggested a two-phase insertion algorithm to accommodate more unscheduled (dynamic) customers in the system.
Operational methods and system evaluation of dial-a-ride systems have been studied by many researchers. McKnight and Pagano [9] appraised 42 dial-a-ride providers in the United States. Their investigation indicated that the quality of service for aged and disabled persons increases as the demand for each provider increases. Wilson and Hendrickson [10] provided a review of models developed for flexible route systems. Paquette et al. [11] concluded that more studies are needed to understand the benefits and costs of operational strategies in dial-a-ride systems. Burkhardt et al. [12] considered a zonal system in DR for specifying the fare. When the size of the zone is increased, longer trips are required to serve the customers and it may not be possible to serve all customers within a given time period [13]. Wilson et al. [14] noted the effects of the size of the zone on the system’s efficiency and showed that the number of vehicles used in each zone is related to the size of the zone. Ellis and McCollom [15] showed that demand-responsive transit has lower efficiency in rural areas than in urban areas. Chira-Chavala and Venter [16] showed that increasing the length of trips results in more empty trips in larger service areas. Lu et al. [17] proposed an innovative strategy that let providers serve customers in need of a ride to their zones as well as those who need a ride from their zones. The results of their new insertion algorithm showed that this strategy can decrease empty trips and total mileage by up to 25% and 8%, respectively.
A few studies have focused on the coordination of dial-a-ride systems. Burkhardt [18] calculated that a well-coordinated program could make about a $700 million economic impact per year to human service and transit agencies in the USA. Interzonal transportation decreases the cost of trips by reducing low seat utilization and increasing the passenger rate [19]. Häll et al. [20] presented an integrated dial-a-ride problem that used fixed routes to serve some parts of the path from origin to destination. Aldaihani and Dessouky [21] considered the utilization of fixed routes for the pickup delivery problem. Lin [22] used integer programming for the pickup delivery problem and showed that their model could reduce the number of vehicles and the cost of operation.
An analytical approach has been used to improve dial-a-ride systems. Daganzo [23] was the first to work on an approximate analytic model for the DR system. Fu [24] proposed an analytic model for paratransit capacity and quality-of-service analysis. Li and Quadrifoglio [25] specified an optimal service zone for feeder transit services.
Simulation has also been used to evaluate dial-a-ride systems. Wilson et al. [14] simulated a computer-aided routing system (CARS). Shinoda et al. [26] used a simulation approach for the purpose of comparing fixed routes and dial-a-ride systems. Shen and Quadrifoglio [27] indicated that the number of vehicles and low seat utilization in a decentralized strategy are greater than those in a centralized strategy. Agent-based simulation was found to be a suitable approach to modeling dial-a-ride systems. Cubillos et al. [28,29,30] employed agent-based simulations to model the interaction between different agents such as clients, trip request, broker, planner, vehicle manager, map, schedule, and vehicle. Velaga et al. [31] proposed an agent-based simulation algorithm in which customers may vote for several feasible schedules in terms of mileage, travel time, and price. The schedule with the highest score will be used to serve customers. Jin and Huang [32] investigated the cooperation of agents in simulation. They created a model with three layers of agents: taxi agents, dispatcher/scheduler agents, and high-level decision makers who determine the number of vehicles to be used. In their model, communication was allowed between each pair of neighboring layers.
As summarized above, the paratransit system is a topic of considerable interest and has been addressed by many papers. However, there are still many challenges to be addressed. Specifically, there remains a need for additional research for methodologies to minimize low seat utilization, customers’ wait time and travel time, number of transfer points, and cost of operation, as well as to maximize the number of customers served and the level of service for customers. This study examines a new potential scheduling strategy to serve more customers within a certain period of time. Specifically, this strategy would allow vehicles to pick up unscheduled customers who are in close proximity to the prescheduled stops. If successful, this strategy would benefit both customers and providers. To our knowledge, this is the first study to propose and examine this scheduling strategy.
3. Proposed Scheduling Strategy
The proposed scheduling strategy is similar to those insertion methods proposed by Coslovich and Lu [8,17], which were described earlier in the literature review. The key difference between the proposed scheduling strategy and strategies being used by most paratransit providers (e.g., Pace in Chicago, IL) is the consideration of serving dynamic customers near the prescheduled stops. This strategy would accommodate those customers who for one reason or another (e.g., an emergency) need a ride on the day of the call.
The current strategy used by providers involves picking up and dropping off customers and returning to the starting point, which leads to some empty seats over the course of the trip. For example, if there are three customers who need a ride from zone 1 to zone 2, a vehicle would depart from the provider’s location and travel to each customer’s location. Then the vehicle would proceed with dropping each customer off at their requested destination in zone 2, one at a time. After the first drop-off, there would be one empty seat, after the second drop-off there would be two empty seats, and so on. The proposed scheduling strategy seeks to utilize the available empty seats to serve more customers.
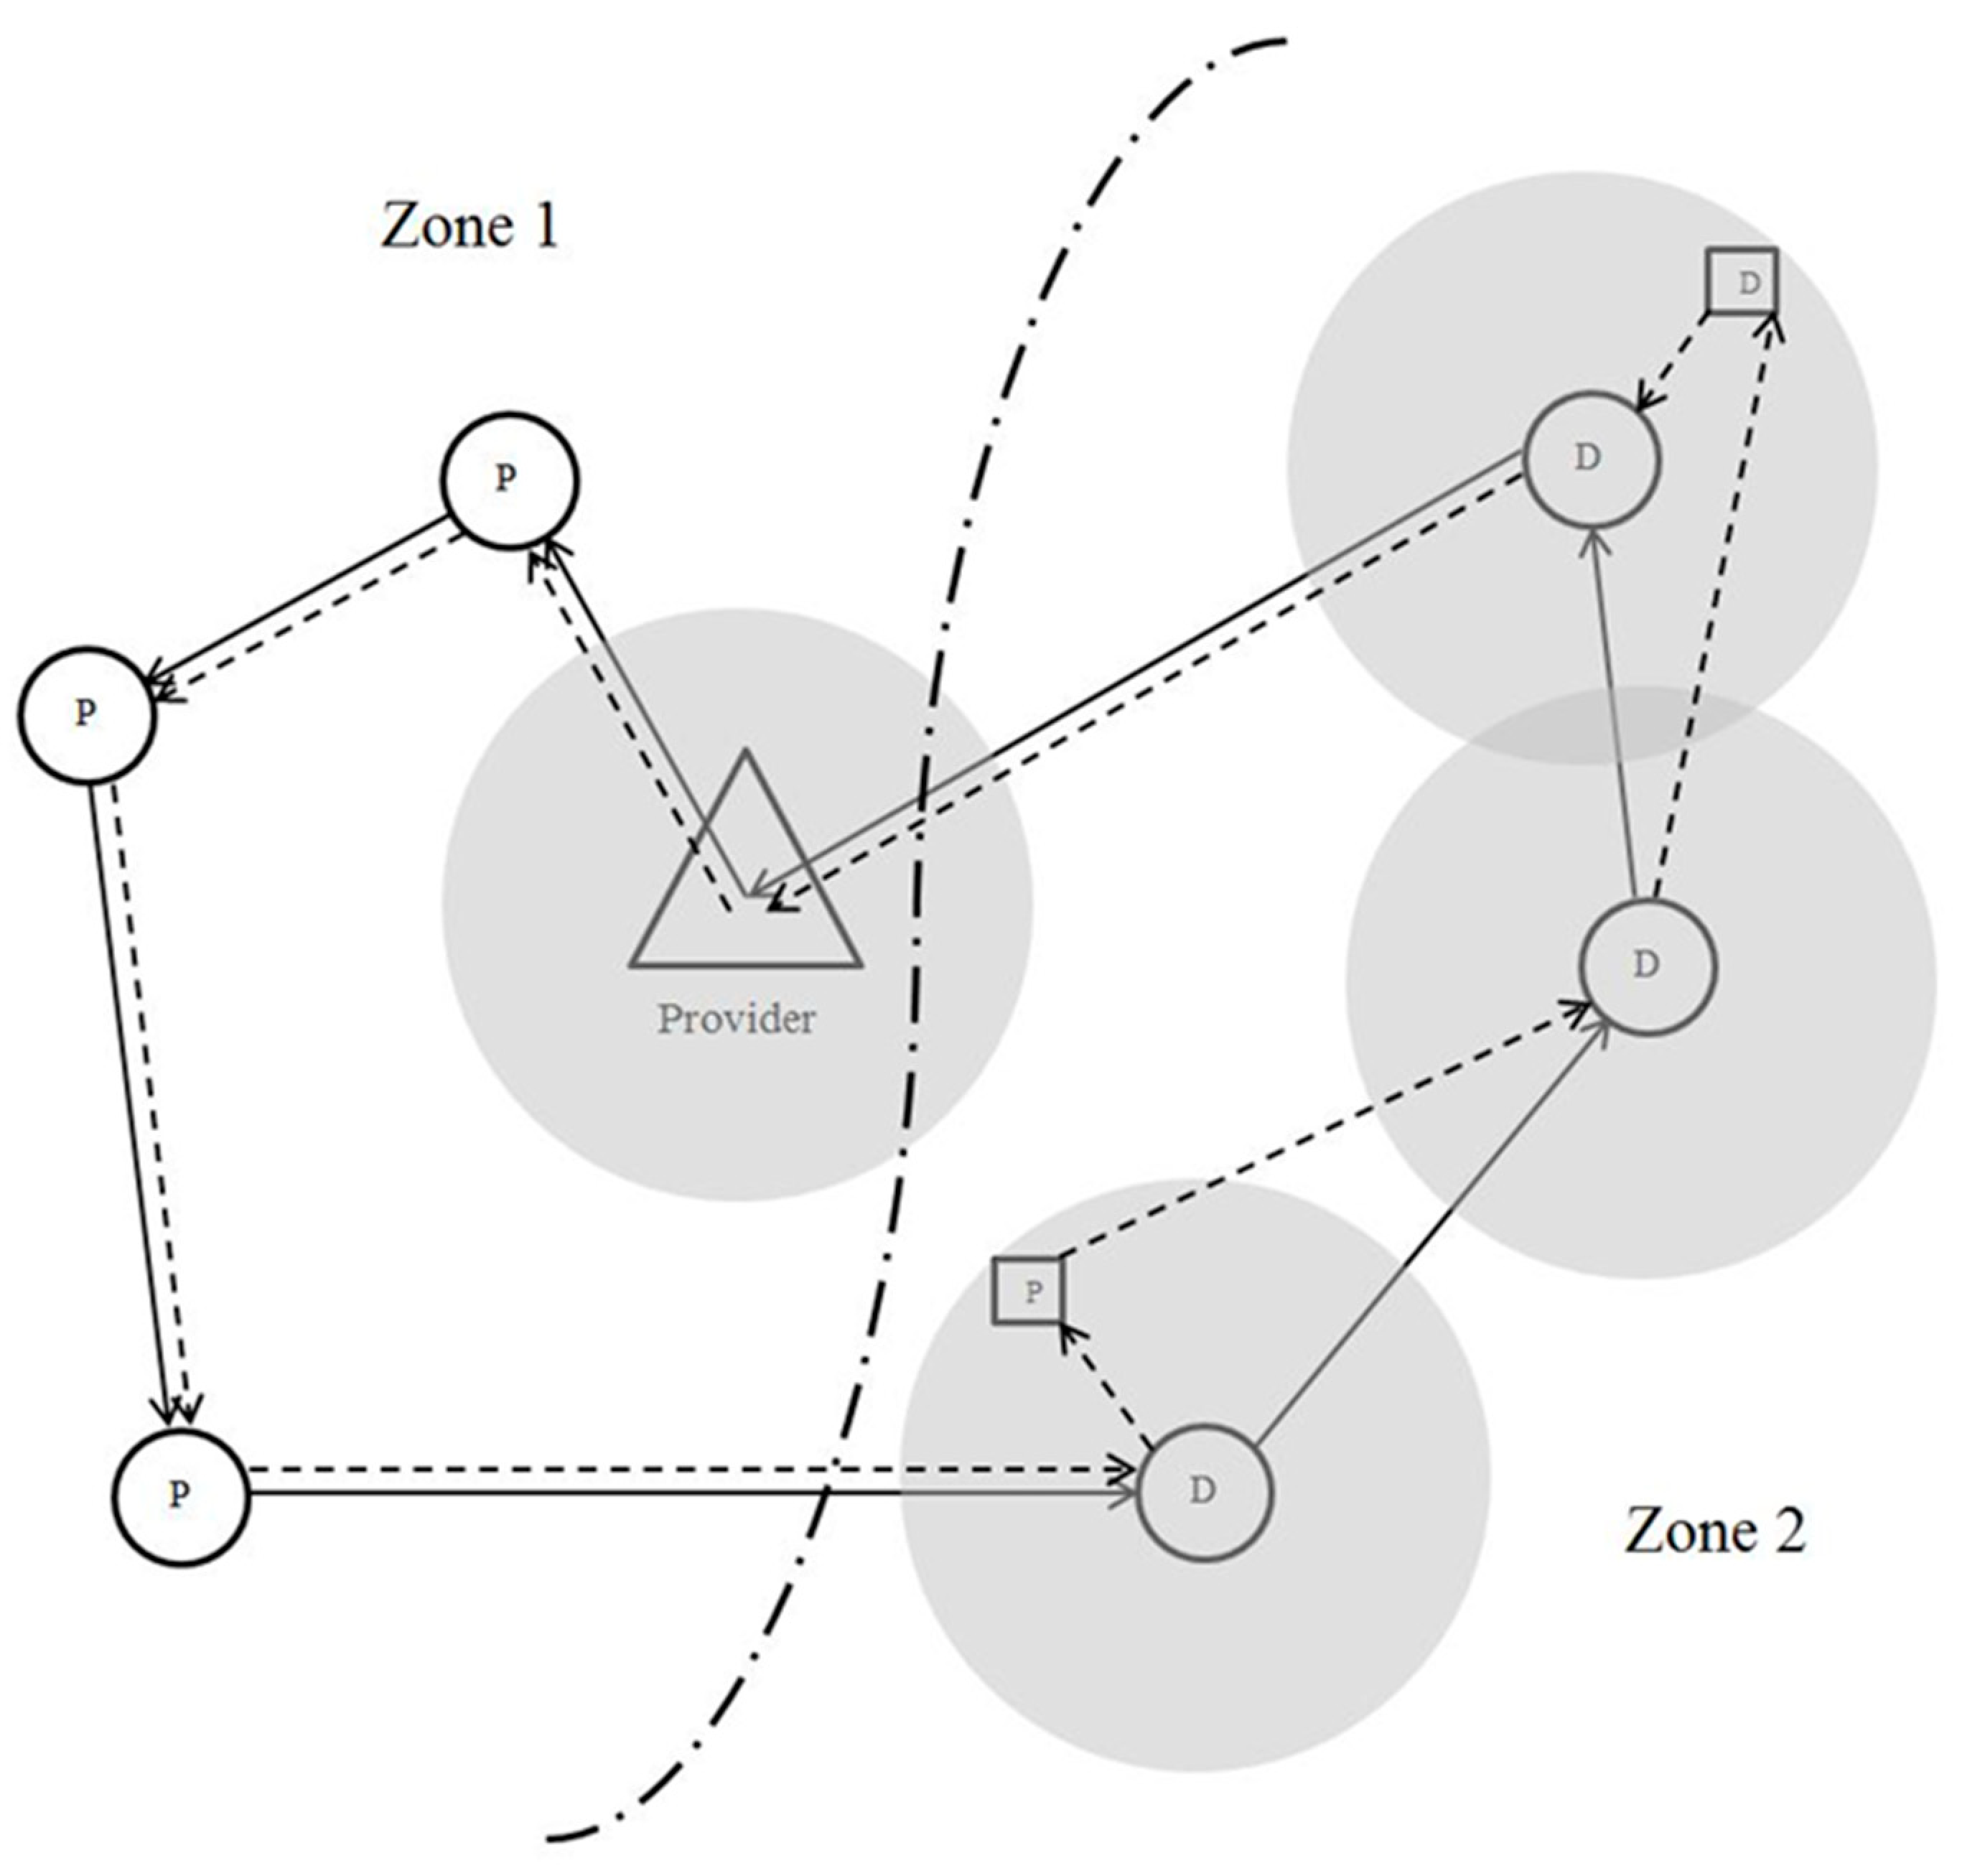
The proposed scheduling strategy allows the driver of the vehicle to consider unscheduled customers within a certain radius of any stop location along the scheduled route. Considering travel time variability [33], only those unscheduled customers within a limited area are taken into account to prevent vehicles from going too far outside of their routes and not being able to travel to the other destinations in time. Figure 1 provides an illustration of how the proposed strategy would be applied. In this illustration, there is one provider, represented by the triangle. All vehicles must depart from and return to this location. The customers’ locations are denoted as “P” and their destinations are denoted as “D.” A typical schedule would have the vehicle pick a customer up at each of the P (circle) locations and then proceed to drop each customer off at the D (circle) locations. Upon completion, the vehicle returns to the provider’s location. The route taken by the vehicle is illustrated by the solid line in Figure 1. With the proposed scheduling strategy, at each D location, the driver has the option of picking up a dynamic customer (denoted as “P” (square)) within the DRA (the shaded gray area in Figure 1). Note that the destination of the dynamic customer (denoted as “D” (square)) must also be within the DRA. The route taken by the vehicle using the proposed scheduling strategy is illustrated by the dashed line in Figure 1. The dash-dot line divides the network into zones 1 and 2.
4. Agent-Based Simulation Model
In a typical paratransit system, a manager is responsible for assigning the available vehicles to requested trips. This method of operation is known as a centralized system. In this system (e.g., Pace in Chicago, IL), once a route is assigned and the vehicle has departed from the provider’s location, vehicles do not deviate from the route, and thus, there is no opportunity to serve dynamic requests. The proposed scheduling strategy is more suitable to be implemented as a decentralized system, where drivers make autonomous decisions regarding whether or not they could serve the dynamic requests. To model this decentralized system, an agent-based simulation model is developed where driversare modeled as agents. The driver agent follows the given schedule to serve static customers, while it is able to search within the DRA to find potential dynamic customers. It is also able to change the schedule to pick up and deliver dynamic customers as well as static customers. The goal of each agent is to serve as many dynamic customers as possible, provided there are seats available. Agents are free to serve customers in any zone, and their tendency is to select dynamic requests on a first-come, first-served principle.
The vehicle agents have two types of behavior, one for static customers and one for dynamic customers. For static customers, the driver agent selects the customer with the lowest trip time, which includes the travel time to the customer’s pickup and drop-off locations. It should be noted that drivers have access only to those customers whose pickup locations are within the zone of the provider. This “greedy” approach continues until the vehicle capacity is reached. For dynamic customers, they are served by the vehicle agent if it has one or more empty seats. When there are available seats, the vehicle agent looks for dynamic customers within the DRA radius of the current stop. Among these customers, the vehicle agent then checks their destinations and selects among those customers whose destination are within the DRA of the following scheduled stops based on first-come first-served principle.
The model was implemented using NetLogo, a multi-agent programmable modeling environment [34], and its implementation is presented below in the form of pseudocodes.
Pseudocodes
Step 0. Setup network and prescheduled customers.
- a
- Setup network and prescheduled customers based on the shape and distribution of the customers in the case study city.
Step 1. Static insertion. For the provider of each zone, do the following:
- a
- Let j represent the number of available seats in each vehicle
- b
- Create a list of available customers.
- c
- Consider all customers one by one and calculate the travel time from provider to pick up the customer, drop off the customer, and return to the starting point.
- d
- Add the customer with minimum travel time to the selected list.
- e
- Remove the selected customer in (d) from the available customers list.
- f
- Consider all available customers one by one and do:
- a-1
- Find the shortest path that serves all customers in the selected list, including the return trip to the starting point (e.g., two origins, two destinations, and a provider), and calculate the path travel time.
- g
- Add the customer who minimizes the travel time to the selected list.
- h
- Repeat (d), (e), (f), and (g) as long as the number of customers in the selected list is less than or equal to j.
Step 2. Set up dynamic customers’ request.
Step 3. Dynamic insertion.
- a
- Ask a vehicle to start a path from the provider and follow the stops based on what is shown in selected list. At each stop, do:
- a.1
- If there is at least one empty seat in the vehicle, do:
- a.1.1
- Search for any dynamic customers’ origin located in DRA of the stop location. If there is any customer, do:
- a.1.1.1
- Search for the destination of the dynamic customer to see if it is located in the DRAs of the following stops. If yes, pick up the dynamic customer.
- b
- Check for any dynamic customer who needs to be dropped off at this stop.
Step 4. Repeat steps 1 through 3 for all providers, one by one.
5. Experimental Design
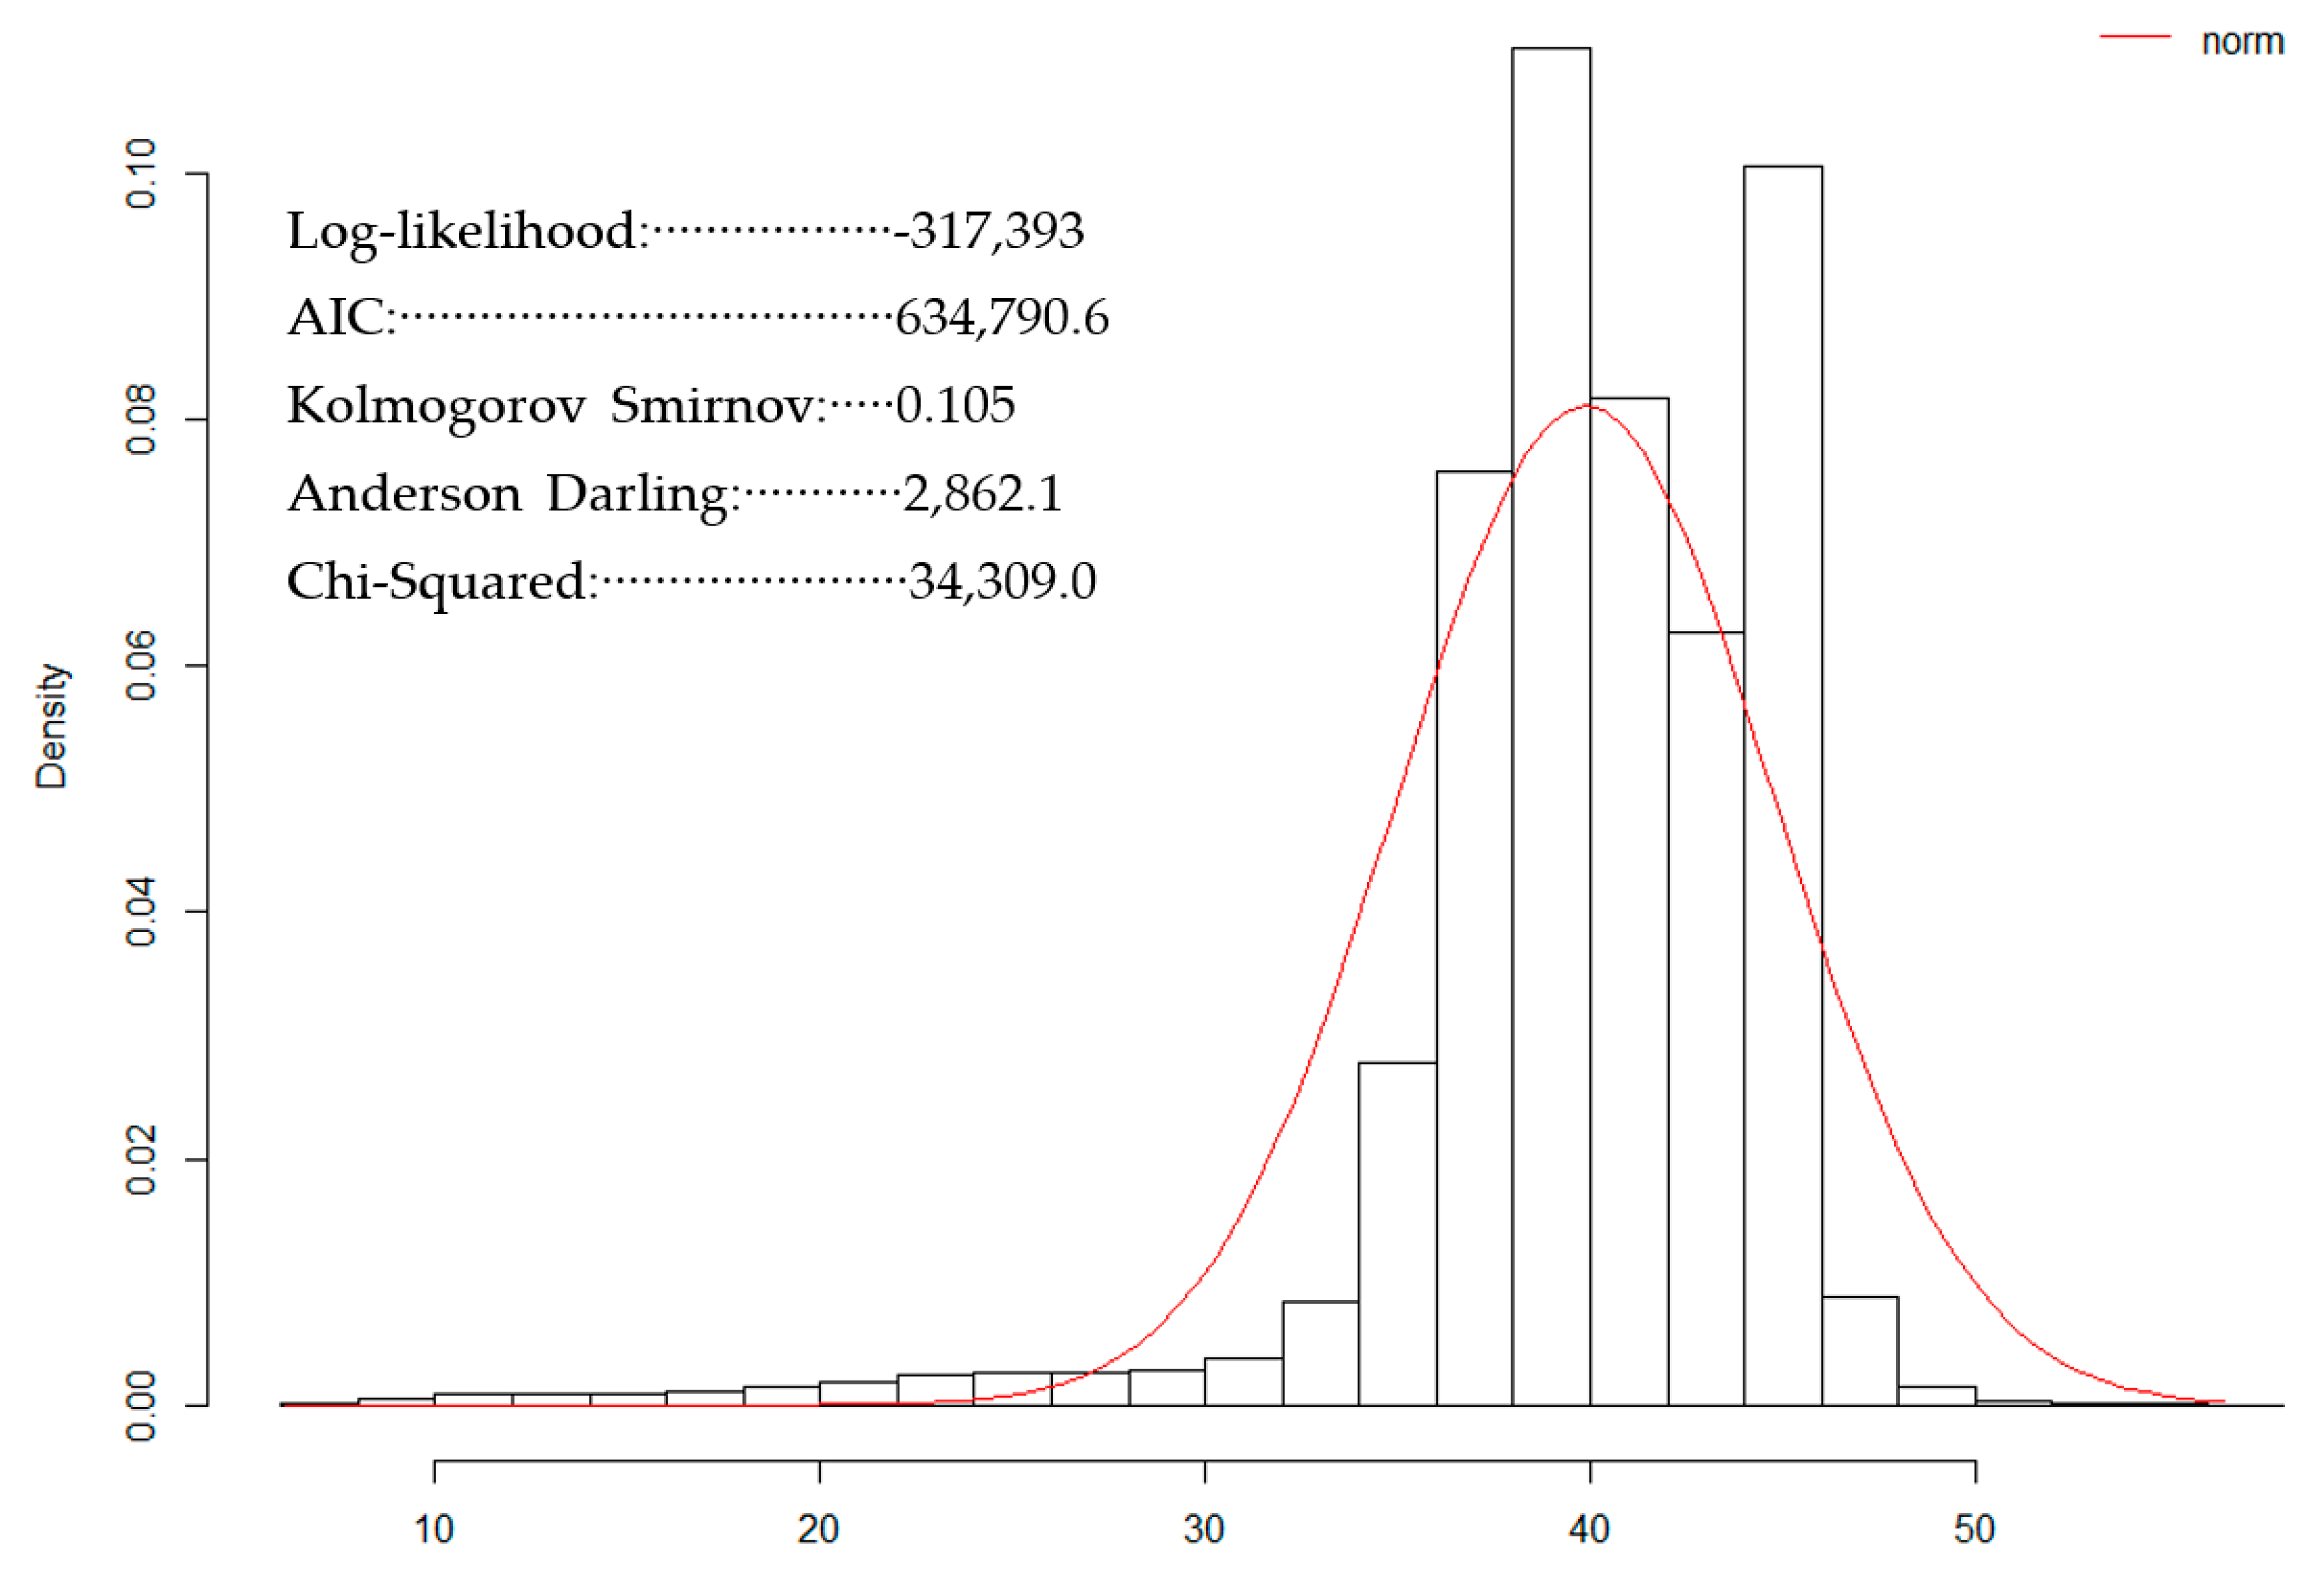
The developed agent-based simulation model was used to evaluate the benefits of the proposed scheduling strategy. The experiment uses a network similar in size to the Chicago, IL paratransit network. Three zones are considered, similar to how Pace divides the Chicago network into three different zones. Each zone has one provider. Without a loss of generality, the experiments use the Euclidean distance between each pair of stops instead of the actual route distance. To simulate traffic congestion, a speed distribution was constructed using data collected from iPeMS [35] for a two-lane highway in South Carolina from September 2018 to September 2019. Among the best fit distributions [36], the normal distribution with a mean of 39.88 mi/h and standard deviation of 4.92 mi/h was used since it is the most practicable option. Figure 2 shows the histogram and the theoretical density of the fitted distribution along with its goodness of fit statistics. To obtain the travel time between each pair of origin and destination, the distance was divided by the speed sampled from the best-fit distribution.
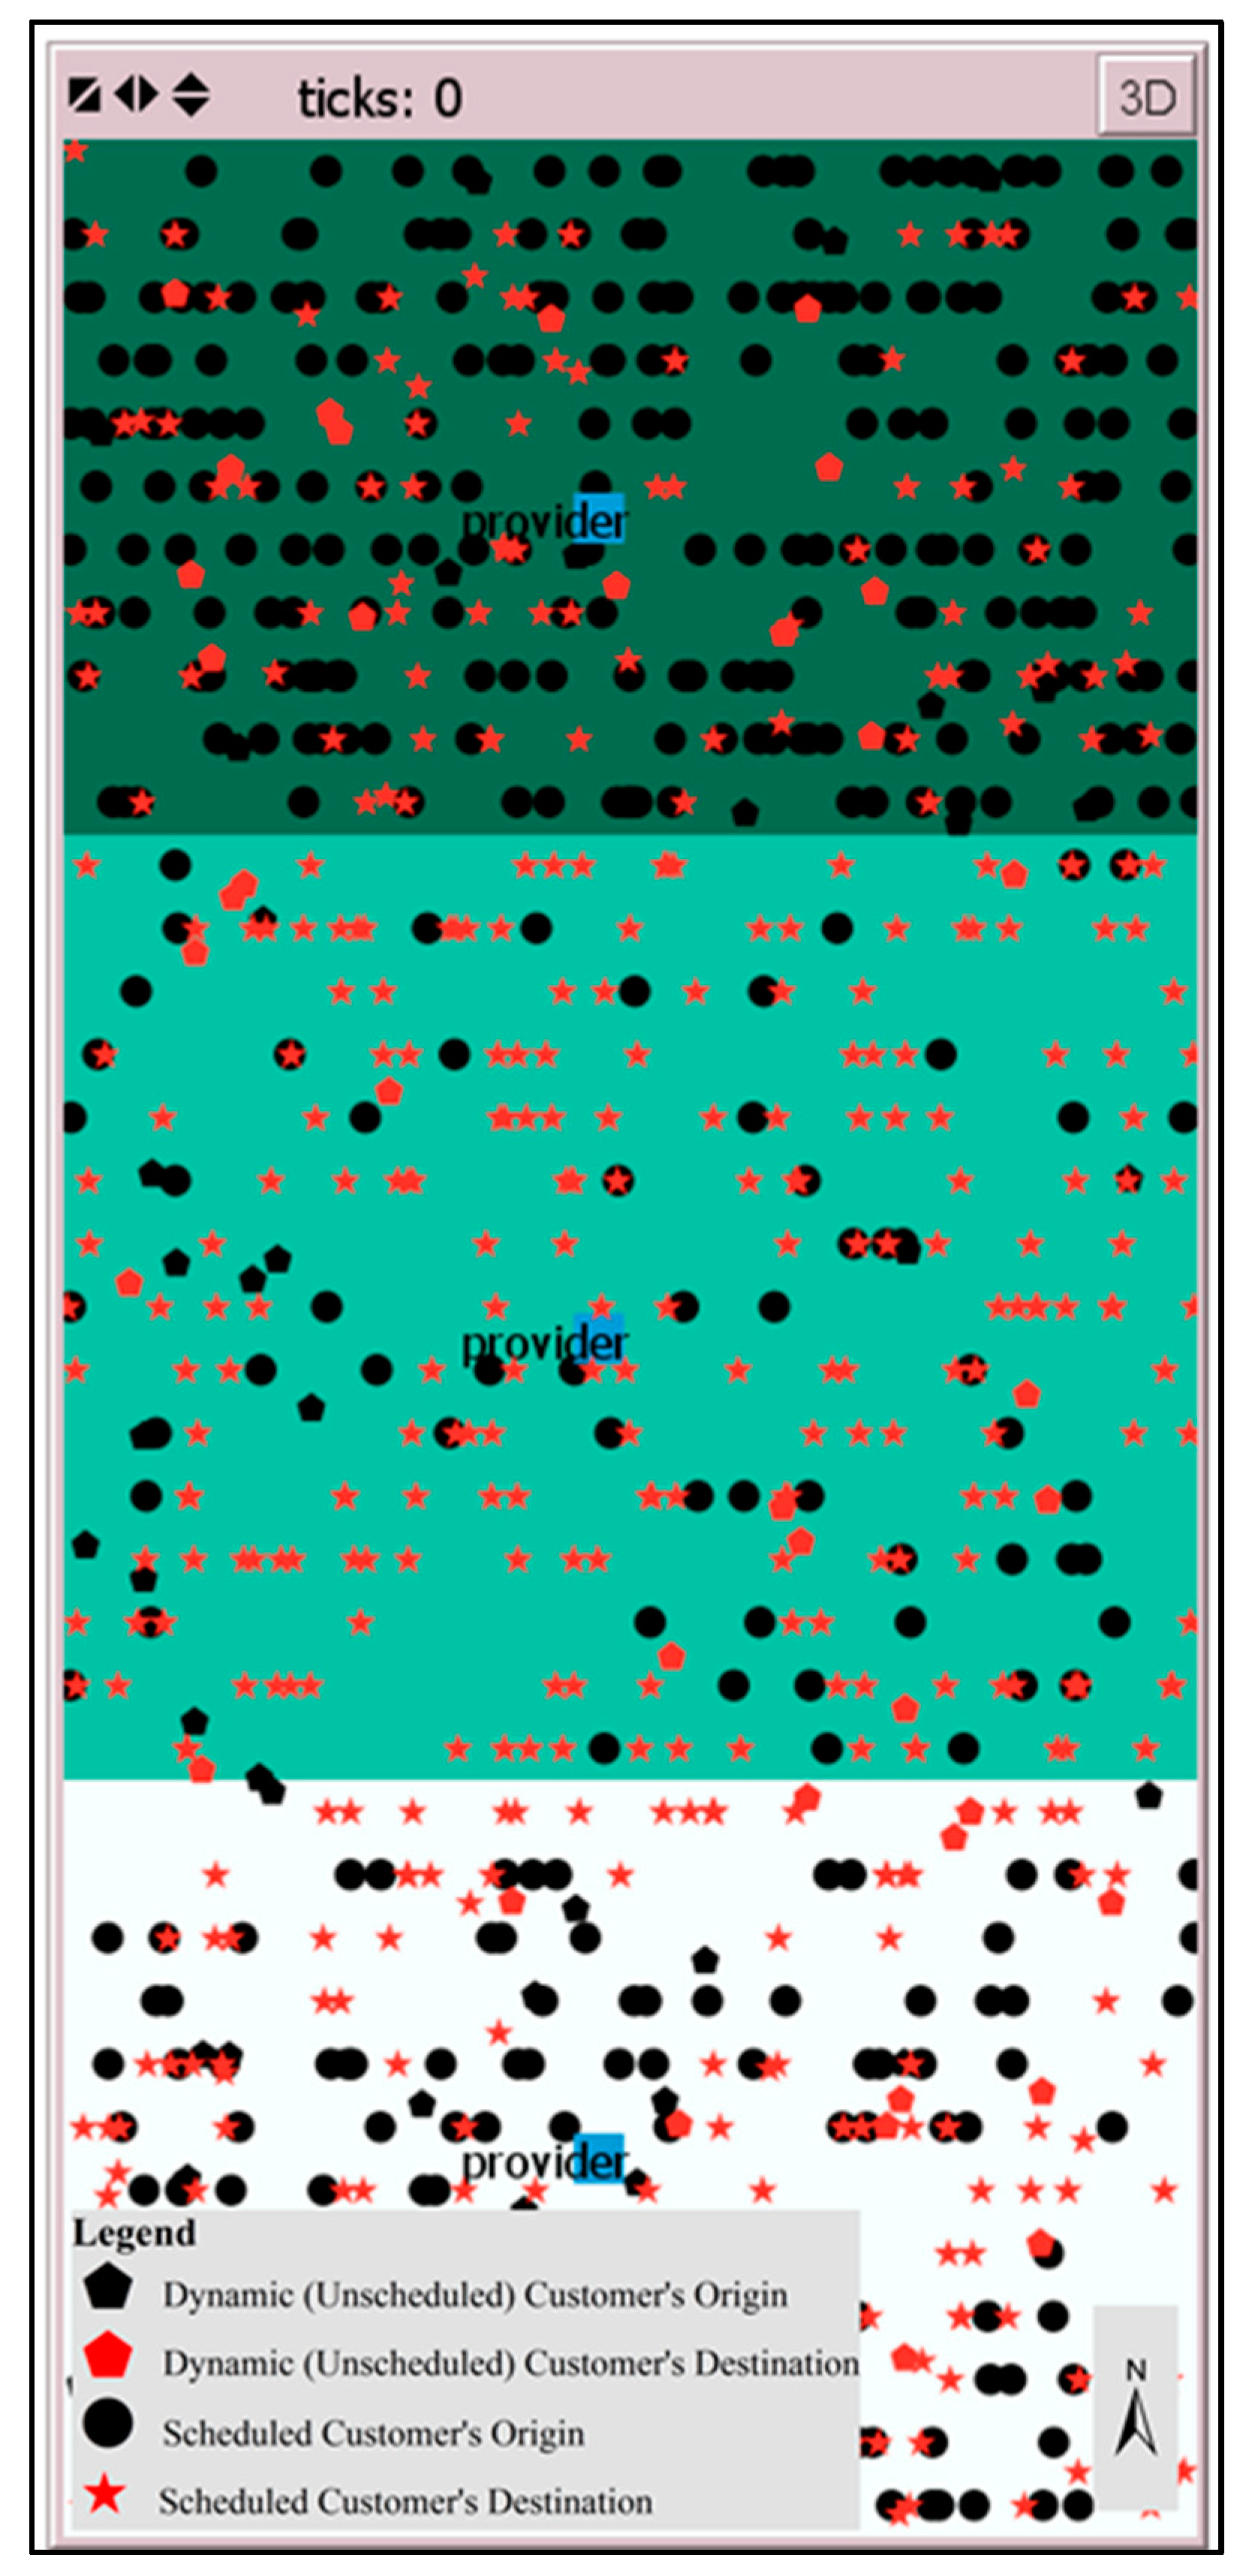
To compare the proposed scheduling strategy with a scheduling strategy similar to that used by Pace for the Chicago network, the number of customers in each zone was generated based on the number of trips per month reported by the APTA. Only those trips with requested drop-off times within the peak hour are considered. So, there is a chance that a customer will arrive earlier than their requested time, but not later. The peak hour average requests are shown in Table 1 for each zone. Because there are no public data on the location of customers in the Chicago network, the customers’ locations were distributed randomly in each zone for the experiments. Their origins are shown as black circles and their destinations are shown as red stars in Figure 3. The location of dynamic customers (both origins and destinations) are distributed randomly throughout the network. Their origins are shown as black pentagons and their destinations are shown as red pentagons in Figure 3. To determine the effectiveness of our proposed strategy, two experiments were conducted. Experiment 1 investigates the impact of DRA radius on the vehicle-hours traveled and number of dynamic customers served. For this experiment, the number of dynamic customers is assumed to be 10% of the total number of customers. Experiment 2 investigates the effect of dynamic customers percentage on the vehicle-hours traveled and the number of dynamic customers served by varying the percentage of dynamic customers from 0% to 60%.
The following modeling and operational parameters were used in the experiments.
- Paratransit providers look at each customer’s trip independently. If a customer needs a return trip, it should be reserved in advance as a separate ride, but both reservations could be made in one call.
- Vehicles have one hour to serve customers.
- The number of vehicles available is infinite.
- Vehicles’ capacity is considered to be 3–5.
- Drivers are assumed to have access to dynamic requests.
- The shape of the network is rectangular.
- Providers are located in the geographical center of each zone.
6. Experimental Results and Discussion
The results of the simulation experiment 1 are summarized in Table 2. The performance of the proposed scheduling strategy is compared to the current strategy (similar to what being used by Pace). Recall that the goal of the proposed scheduling strategy is to serve as many customers as possible. Thus, to measure the efficiency of the proposed scheduling strategy, the number of dynamic customers served is presented. Also, the number of vehicles required by each scheduling strategy is presented. Table 2 also shows the impact of the DRA size on the proposed scheduling strategy.
As shown in Table 2, there is no difference in the number of vehicles required between the proposed strategy and the current strategy. These results indicate that the proposed strategy is able to serve more customers using the same fleet size. By servicing more customers, the total travel time is expected to increase. However, the increase is less than 6%. This is likely due to the size of the DRA being relatively small. Thus, it can be concluded that the proposed scheduling strategy will not significantly affect the scheduled customers’ travel distance and in-vehicle travel time.
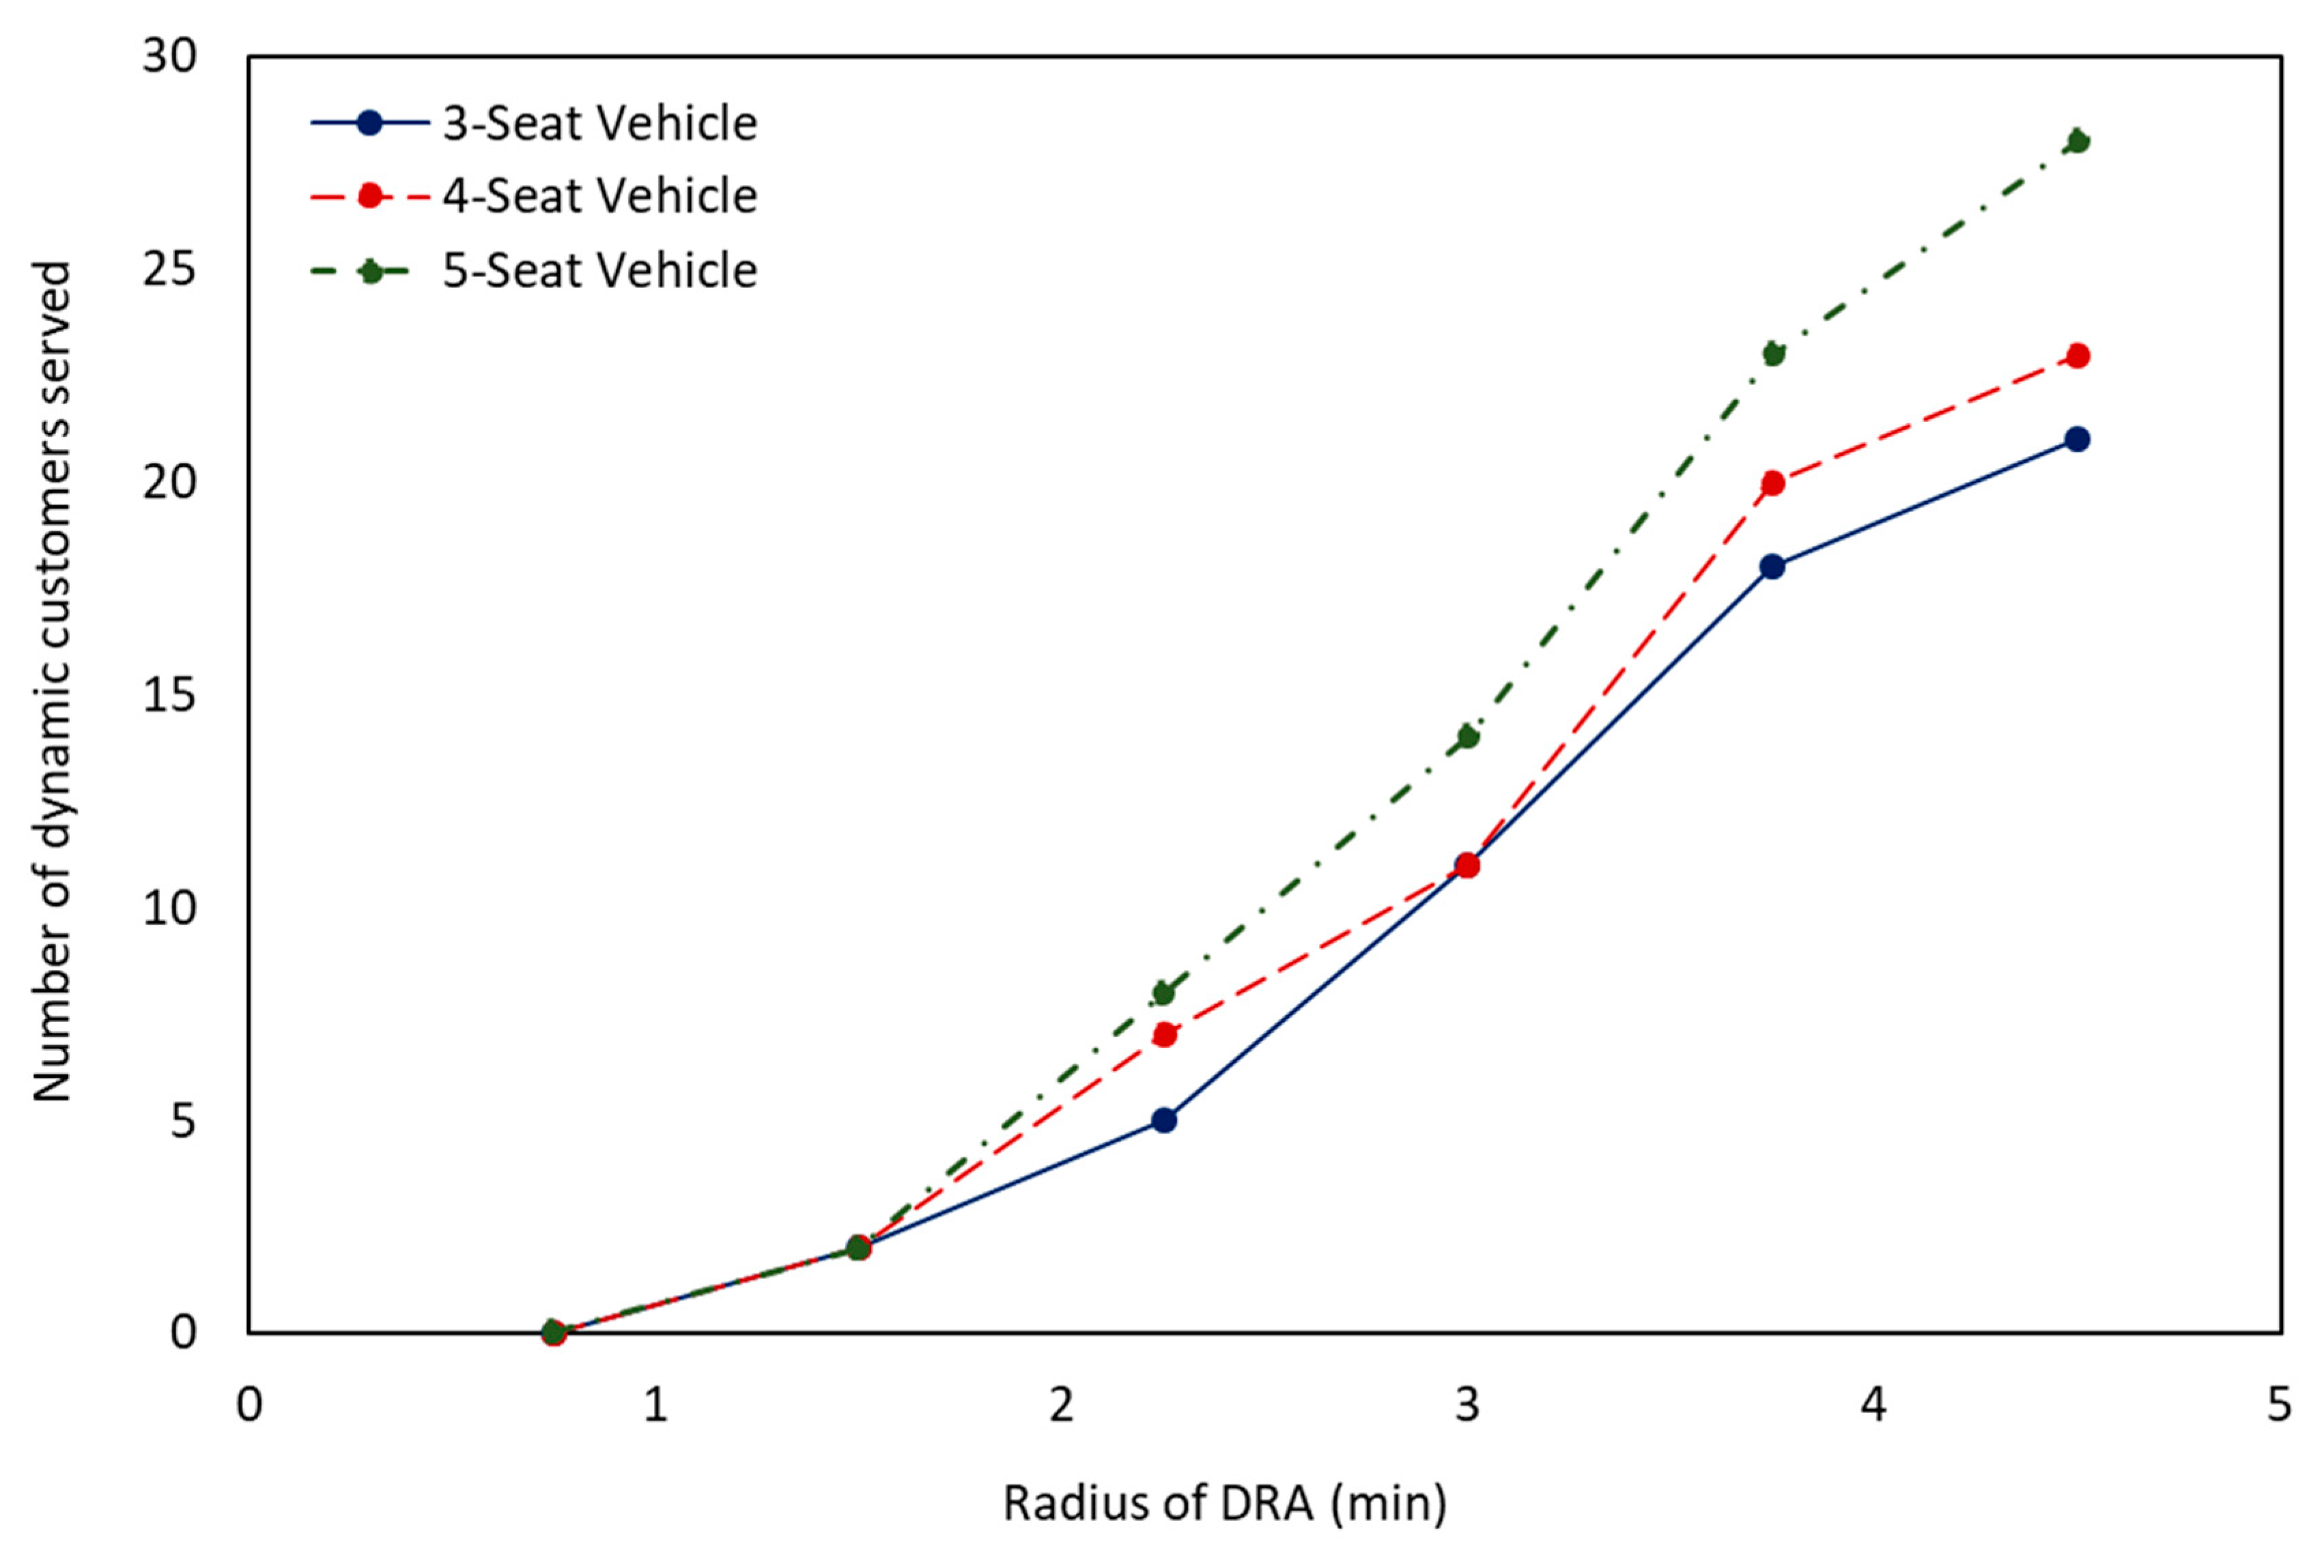
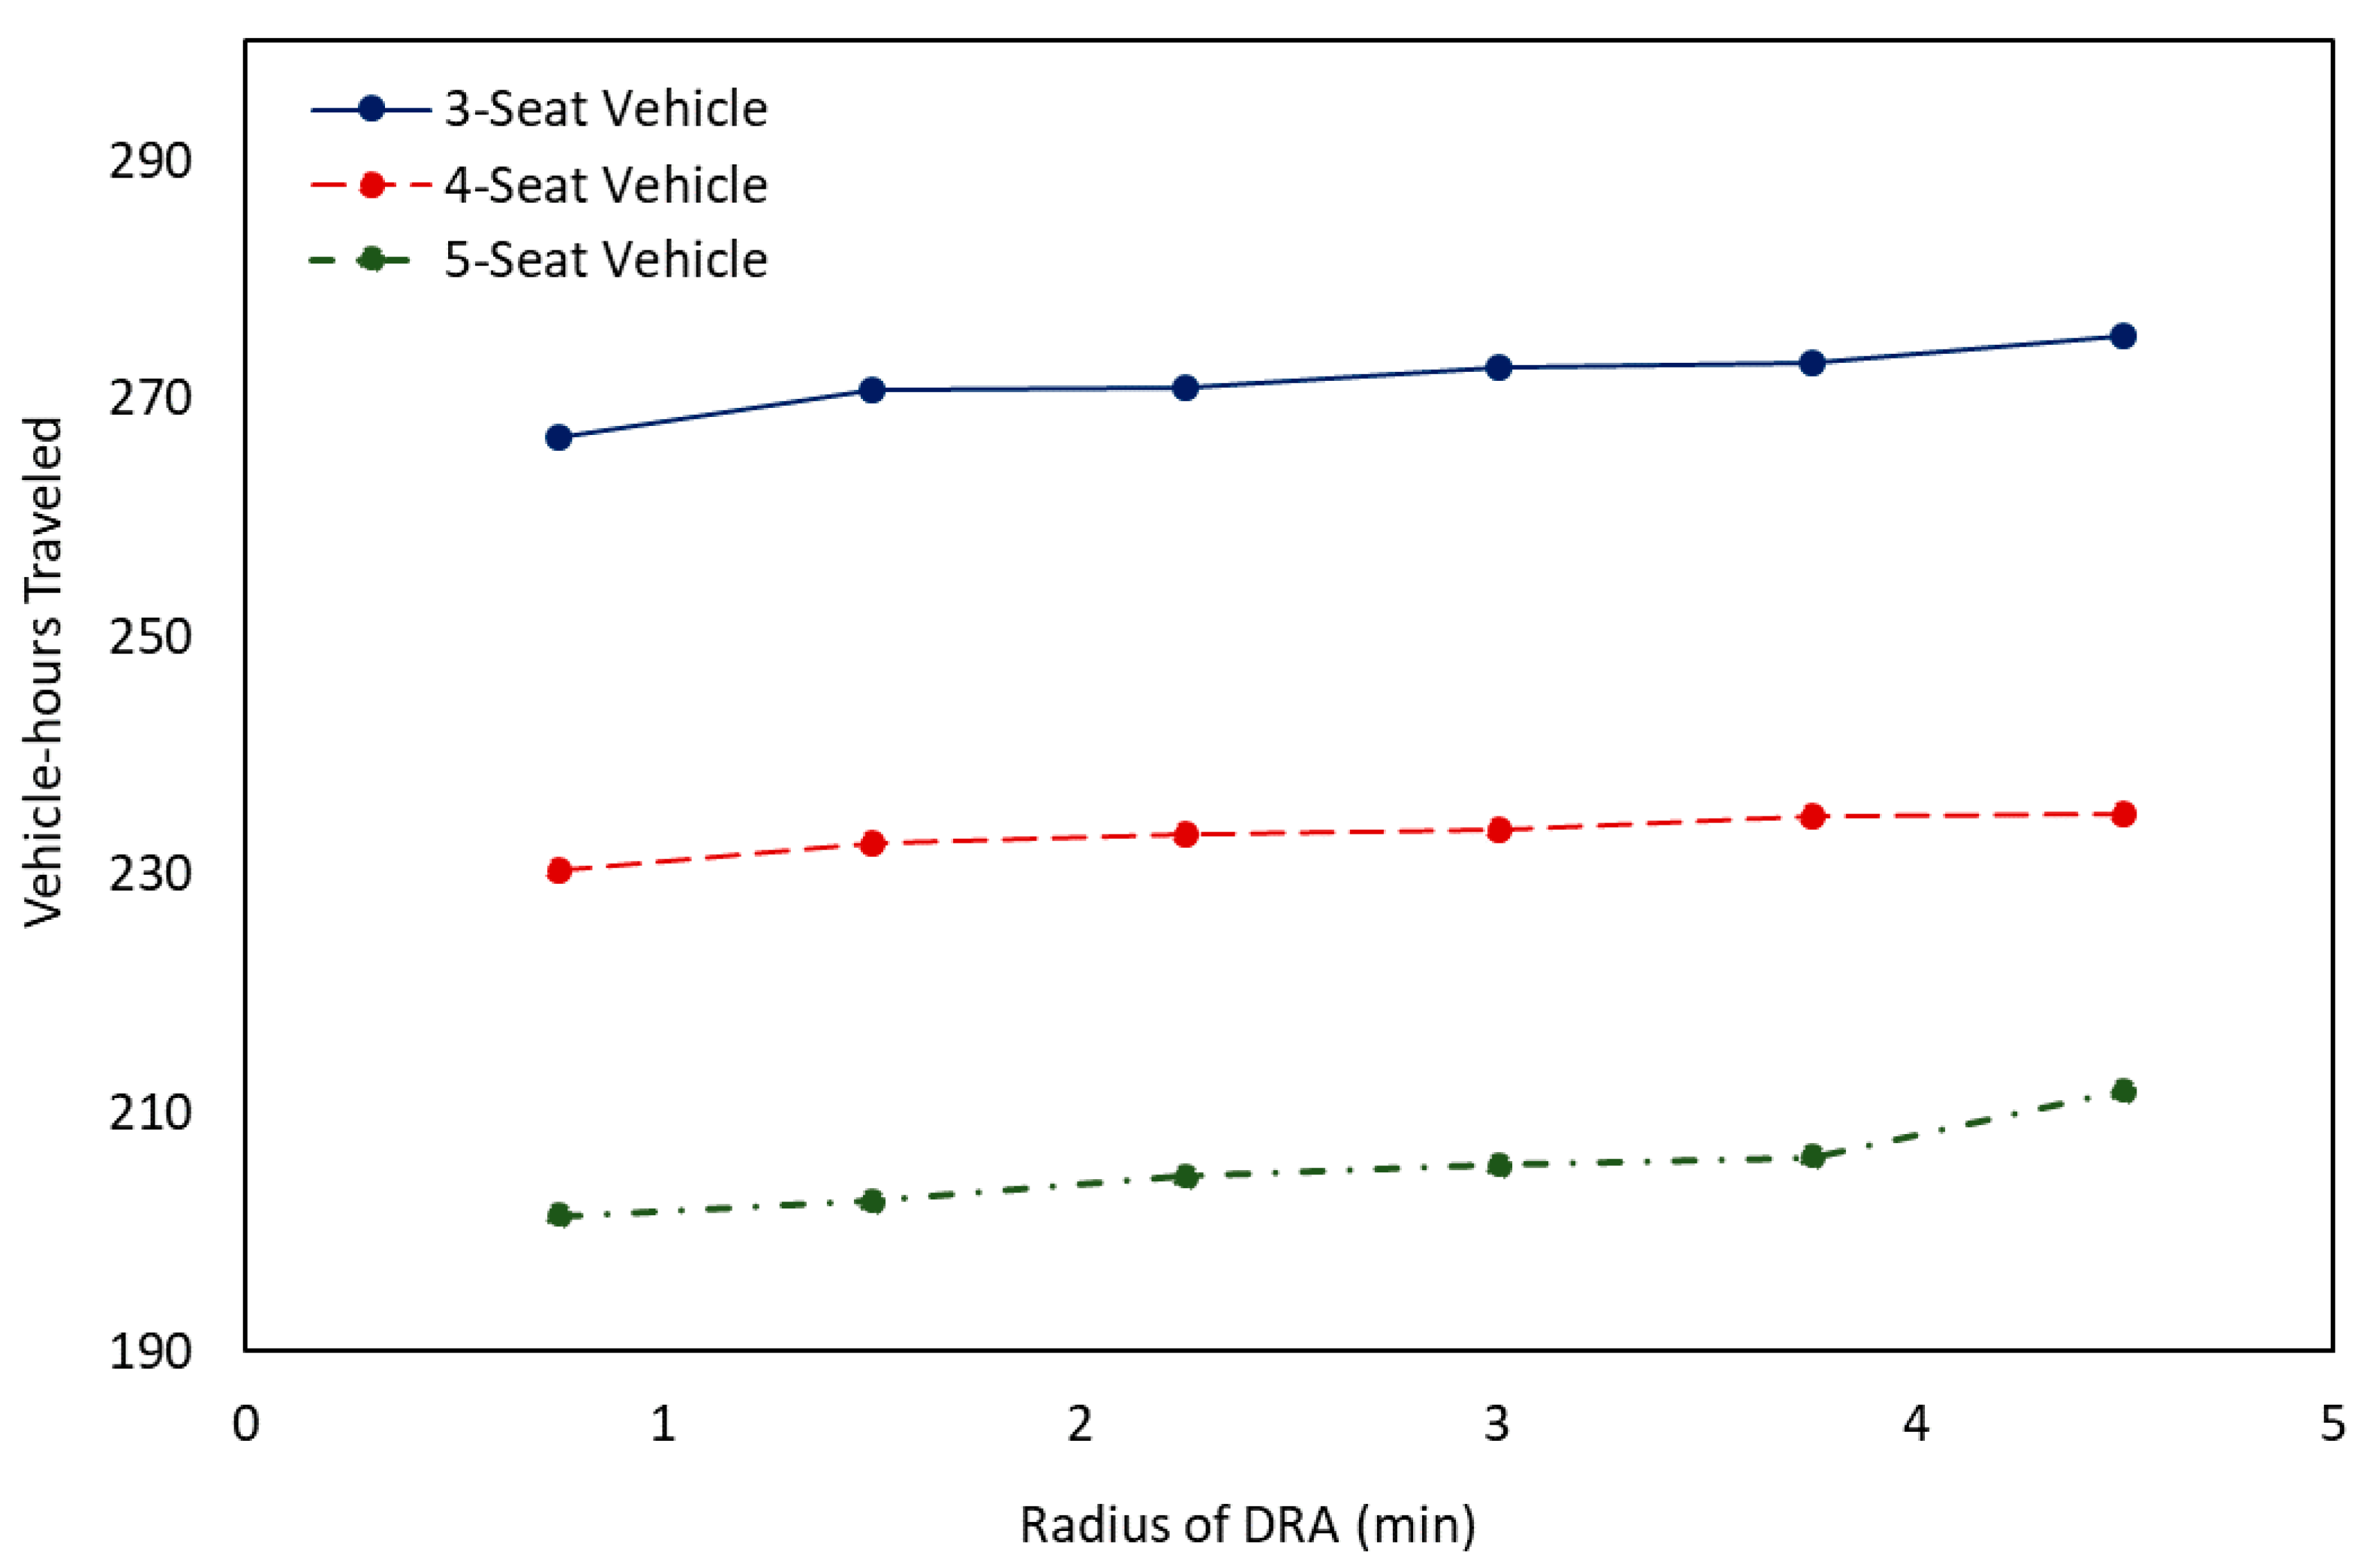
To further illuminate the experimental results, Figure 4 and Figure 5 show the number of dynamic customers served and the vehicle-hours traveled with respect to the radius of the DRA. The results shown in Figure 4 exhibit a nonlinear relationship between the number of dynamic customers served and DRA radius. All three curves show a sharp increase when the DRA radius exceeds 2 min. Thus, a small increase in the DRA radius (when it is greater than 2 min) would result in a large increase in the number of customers served. The results in Figure 4 also show that the average number of dynamic customers served by the proposed scheduling strategy increases as the vehicle’s capacity increases. Finally, Figure 5 indicates that the vehicle-hours increase slightly as the DRA increases.
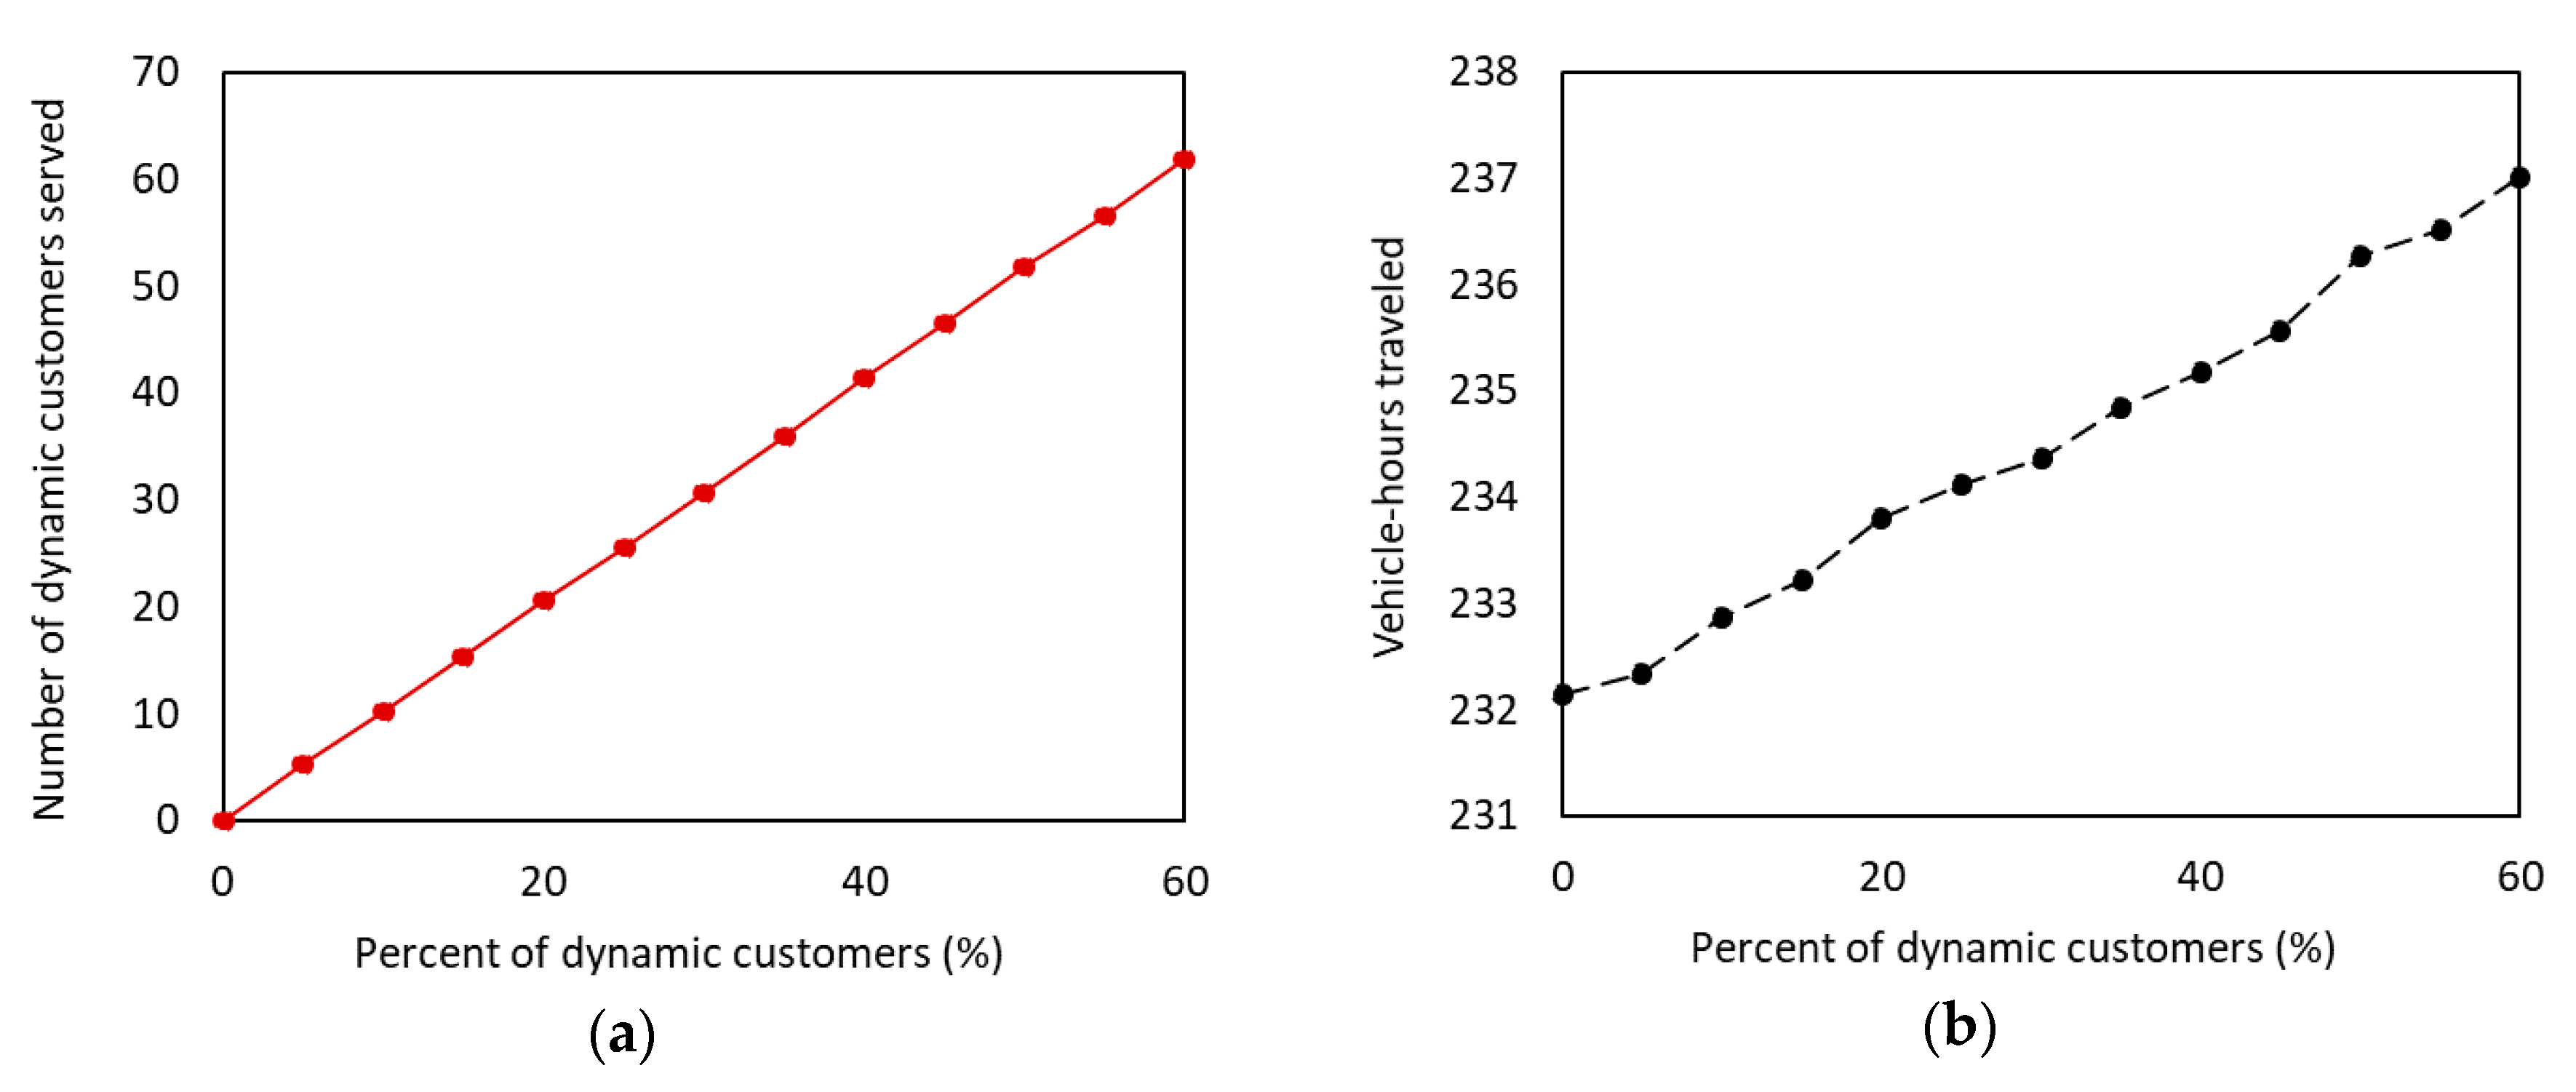
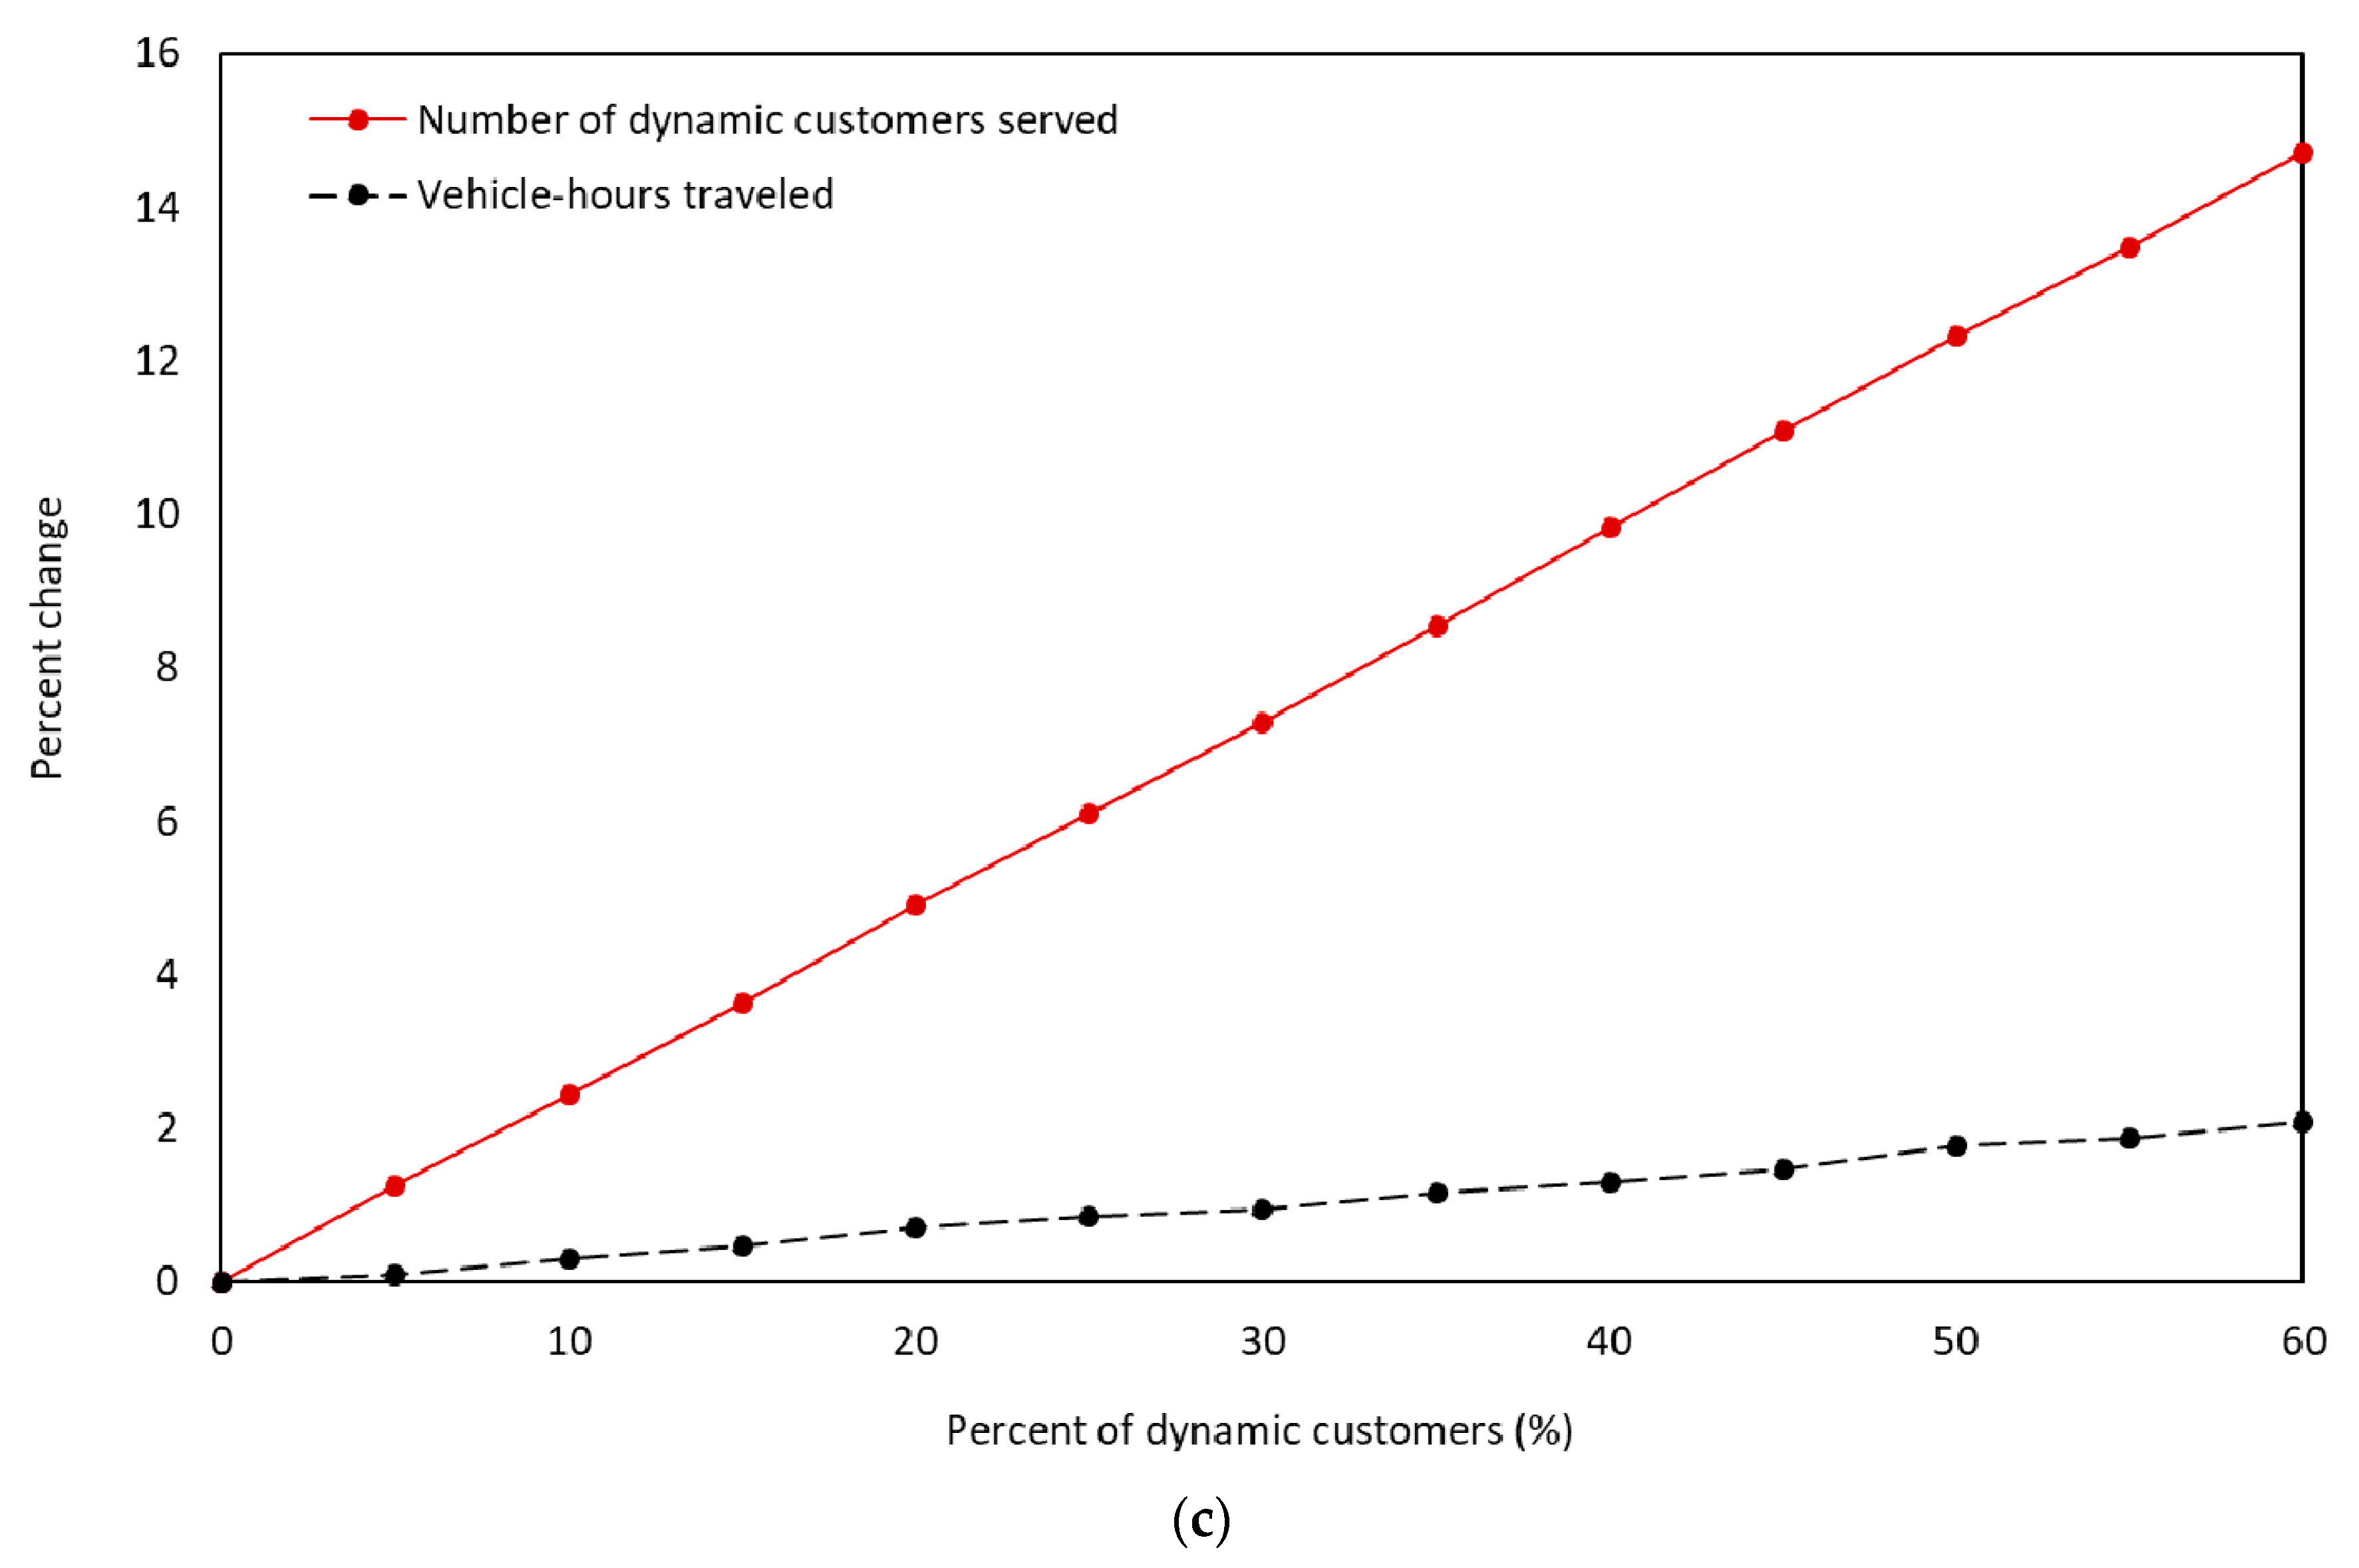
The effect on vehicle-hours traveled can be seen in Figure 6b as the number of dynamic customers served increases (Figure 6a); note that these experiments used four-seat vehicles. As expected, the total vehicle-hours traveled increases monotonically. Figure 6c shows the difference between the percentage increase of customers served and total vehicle-hours traveled. It can be seen that the difference increases as the percentage of dynamic customers increases. This suggests that the proposed scheduling strategy is not negatively affected by a high number of dynamic customers. For instance, a 14% increase in the number of dynamic customers served resulted in only a 1% increase in the total vehicle-hours traveled.
7. Summary and Conclusions
This paper investigated a scheduling strategy for paratransit vehicles that aims to serve more customers during a certain period of time while using the same fleet size. To evaluate the proposed scheduling strategy, an agent-based simulation model was developed. The model was then used to compare the performance of the proposed scheduling strategy against the strategy currently being used by most providers, using the Chicago network as an example. The experimental results indicate that (1) the proposed strategy is able to serve more customers using the same fleet size, and (2) the proposed strategy will not significantly affect the scheduled customers’ travel distance and in-vehicle travel time. The findings from this study indicate that the proposed scheduling strategy is promising. Future research will seek to extend this work by using an actual road network and considering both outbound and return trips for customers, as well as the need of some customers to arrive within a certain time window.
Author Contributions
Conceptualization, M.T. and N.H.; methodology, M.T. and N.H.; validation, M.T. and N.H.; formal analysis, M.T. and N.H.; resources, M.T. and N.H.; data curation, M.T. and N.H.; writing—original draft preparation, M.T. and N.H.; writing—review and editing, M.T. and N.H.; visualization, M.T. and N.H.; supervision, M.T. and N.H.; project administration M.T. and N.H.; funding acquisition, M.T. and N.H.
Funding
This research received no external funding.
Conflicts of Interest
The authors declare no conflict of interest.
References
- Shen, C.; Quadrifoglio, L. Evaluation of zoning design with transfers for paratransit services. Transp. Res. Rec. 2012, 2277, 82–89. [Google Scholar] [CrossRef]
- Solomon, M.M. Algorithms for the vehicle routing and scheduling problems with time window constraints. Oper. Res. 1987, 35, 254–265. [Google Scholar] [CrossRef]
- Bräysy, O.; Gendreau, M. Vehicle routing problem with time windows, Part I: Route construction and local search algorithms. Transp. Sci. 2005, 39, 104–118. [Google Scholar] [CrossRef]
- Bräysy, O.; Gendreau, M. Vehicle routing problem with time windows, Part II: Metaheuristics. Transp. Sci. 2005, 39, 119–139. [Google Scholar] [CrossRef]
- Torkjazi, M.; Huynh, N.; Shiri, S. Truck appointment systems considering impact to drayage truck tours. Transp. Res. Part E Logist. Transp. Rev. 2018, 116, 208–228. [Google Scholar] [CrossRef]
- Cordeau, J.F.; Laporte, G. The dial-a-ride problem: Models and algorithms. Ann. Oper. Res. 2007, 153, 29–46. [Google Scholar] [CrossRef]
- Berbeglia, G.; Cordeau, J.F.; Gribkovskaia, I.; Laporte, G. Static pickup and delivery problems: A classification scheme and survey. TOP 2007, 15, 1–31. [Google Scholar] [CrossRef]
- Coslovich, L.; Pesenti, R.; Ukovich, W. A two-phase insertion technique of unexpected customers for a dynamic dial-a-ride problem. Eur. J. Oper. Res. 2006, 175, 1605–1615. [Google Scholar] [CrossRef]
- McKnight, C.E.; Pagano, A.M. Effect of Size and Type of Organization on Quality of Special Transportation Services. Transp. Res. Rec. 1984, 973, 39–44. [Google Scholar]
- Wilson, N.H.; Hendrickson, C. Performance models of flexibly routed transportation services. Transp. Res. Part. B Methodol. 1980, 14, 67–78. [Google Scholar] [CrossRef]
- Paquette, J.; Cordeau, J.F.; Laporte, G. Survey: Quality of service in dial-a-ride operations. Comput. Ind. Eng. 2009, 56, 1721–1734. [Google Scholar] [CrossRef]
- Burkhardt, J.E.; Hamby, B.; McGavock, A.T. Users’ Manual for Assessing Service Delivery Systems for Rural Passenger Transportation, in TCRP Report 6; Transportation Research Board of the National Academies: Washington, DC, USA, 1995. [Google Scholar]
- KFH Group; Urbitran Associates; McCollom Management Consulting; Cambridge Systematics; Transit Cooperative Research Program; Transit Development Corporation. Guidebook for Measuring, Assessing, and Improving Performance of Demand-Response Transportation, in TCRP Report 124; Transportation Research Board of the National Academies: Washington, DC, USA, 1995. [Google Scholar]
- Wilson, N.H.M.; Sussman, J.M.; Goodman, L.A.; Hignnet, B.T. Simulation of a computer aided routing system (CARS). In Proceedings of the Third Conference on Applications of Simulation, Winter Simulation Conference, Los Angeles, CA, USA, 8–10 December 1969; pp. 171–183. [Google Scholar]
- Ellis, E.H.; McCollom, B.E. TCRP Report 136: Guidebook for Rural Demand-Response Transportation: Measuring, Assessing, and Improving Performance; The National Academies Press: Washington, DC, USA, 2009. [Google Scholar]
- Chira-Chavala, T.; Venter, C. Cost and Productivity Impacts of a “Smart” Paratransit System. Transp. Res. Rec. J. Transp. Res. Board 1997, 1571, 81–87. [Google Scholar] [CrossRef]
- Lu, W.; Shen, C.W.; Quadrifoglio, L. Innovative Operating Strategies for Paratransit Services with Zoning. Transp. Res. Rec. 2014, 2469, 120–128. [Google Scholar] [CrossRef] [Green Version]
- Burkhardt, J. Economic Benefits of Coordinating Human Service Transportation and Transit Services. Transp. Res. Rec. J. Transp. Res. Board 2004, 1887, 55–61. [Google Scholar] [CrossRef] [Green Version]
- Cook, T.J.; Lawrie, J.J.; Henry, A.J. From Rural Single-County to Multicounty Regional Transit Systems: Benefits of Consolidation. Transp. Res. Rec. J. Transp. Res. Board 2003, 1841, 54–61. [Google Scholar] [CrossRef]
- Häll, C.H.; Andersson, H.; Lundgren, J.T.; Värbrand, P. The integrated dial-a-ride problem. Public Transp. 2009, 1, 39–54. [Google Scholar] [CrossRef]
- Aldaihani, M.; Dessouky, M.M. Hybrid scheduling methods for paratransit operations. Comput. Ind. Eng. 2003, 45, 75–96. [Google Scholar] [CrossRef]
- Lin, C.K.Y. A cooperative strategy for a vehicle routing problem with pickup and delivery time windows. Comput. Ind. Eng. 2008, 55, 766–782. [Google Scholar] [CrossRef]
- Daganzo, C.F. An approximate analytic model of many-to-many demand responsive transportation systems. Transp. Res. 1978, 12, 325–333. [Google Scholar] [CrossRef]
- Fu, L. Analytical Model for Paratransit Capacity and Quality-of-Service Analysis. Transp. Res. Rec. J. Transp. Res. Board 2003, 1841, 81–89. [Google Scholar] [CrossRef]
- Li, X.; Quadrifoglio, L. Optimal Zone Design for Feeder Transit Services. Transp. Res. Rec. J. Transp. Res. Board 2009, 2111, 100–108. [Google Scholar] [CrossRef] [Green Version]
- Shinoda, K.; Noda, I.; Ohta, M.; Kumada, Y.; Nakashima, H. Is dial-a-ride bus reasonable in large scale towns? Evaluation of usability of dial-a-ride systems by simulation. In International Workshop on Multi-Agents for Mass User Support; Springer: Berlin, Germany, 2003; pp. 105–119. [Google Scholar]
- Shen, C.; Quadrifoglio, L. Evaluating Centralized versus Decentralized Zoning Strategies for Metropolitan ADA Paratransit Services. J. Transp. Eng. 2013, 139, 524–532. [Google Scholar] [CrossRef] [Green Version]
- Cubillos, C.; Crawford, B.; Rodríguez, N. MADARP: A distributed agent-based system for online DARP. In International Symposium on Parallel and Distributed Processing and Applications; Stojmenovic, I., Thulasiram, R., Yang, L., Jia, W., de Mello, R., Eds.; Springer: Berlin, Germany, 2007; pp. 160–169. [Google Scholar]
- Cubillos, C.; Gaete, S.; Crawford, B. Design of an agent-based system for passenger transportation using PASSI. In Nature Inspired Problem—Solving Methods in Knowledge Engineering; Mira, J., lvarez, J.A., Eds.; Lecture Notes in Computer Science; Springer: Berlin/Heidelberg, Germany, 2007; Volume 4528, pp. 531–540. [Google Scholar]
- Cubillos, C.; Guidi-Polanco, F.; Demartini, C. MADARP: Multi-agent architecture for passengertransportation systems. In Proceedings of the IEEE Intelligent Transportation Systems, Vienna, Austria, 16 September 2005. [Google Scholar]
- Velaga, N.R.; Rotstein, N.D.; Oren, N.; Nelson, J.D.; Norman, T.J.; Wright, S. Development of an integrated flexible transport systems platform for rural areas using argumentation theory. Res. Transp. Bus. Manag. 2012, 3, 62–70. [Google Scholar] [CrossRef] [Green Version]
- Jin, X.; Huang, Z. An intelligent model for urban demand-responsive transport system control. J. Softw. 2009, 4, 766–776. [Google Scholar]
- Torkjazi, M.; Mirjafari, P.S.; Poorzahedy, H. Reliability-based network flow estimation with day-to-day variation: A model validation on real large-scale urban networks. J. Intell. Transp. Syst. 2018, 22, 121–143. [Google Scholar] [CrossRef]
- Wilensky, U.; NetLogo. Center for Connected Learning and Computer-Based Modeling, 1999 Northwestern University, Evanston, IL, USA. Available online: http://ccl.northwestern.edu/netlogo/ (accessed on 15 January 2014).
- IPeMS-iteris. Available online: https://www.iteris.com/products/performance-analytics/ipems (accessed on 2 September 2019).
- Easy-Fit Software. Available online: http://www.mathwave.com/easyfit-distribution-fitting.html (accessed on 2 September 2019).
Figure 1.
Illustration of proposed scheduling strategy.

Figure 2.
Histogram and normal distribution density for average speed (mph).

Figure 3.
Network of scheduled and unscheduled customers in the hypothetical network of the city of Chicago, IL.
Figure 3.
Network of scheduled and unscheduled customers in the hypothetical network of the city of Chicago, IL.

Figure 4.
Number of dynamic customers served with respect to DRA.

Figure 5.
Vehicle-hours traveled with respect to DRA.

Figure 6.
Effect of dynamic customers percentage on (a) number of dynamic customers served, (b) vehicle-hours traveled, and (c) their percent change.
Figure 6.
Effect of dynamic customers percentage on (a) number of dynamic customers served, (b) vehicle-hours traveled, and (c) their percent change.


Table 1.
Area size and average peak hour requests per zone for Chicago network.
| Zone | Demand Type | Zone Area (sq. km) | Peak Hour Average Number of Customers |
| Northern | Scheduled | 176 | 240 |
| Central | Scheduled | 240 | 60 |
| Southern | Scheduled | 176 | 120 |
| All City | Dynamic | N/A | 42 |
| Total | N/A | 592 | 462 |
Table 2.
Performance comparison between current and proposed scheduling strategies.
| Method | Capacity (Seat) | Number of Vehicles Used in Peak Hour | Number of Customer-trips | Radius of DRA (min) | Vehicle-Hours Traveled | Percent Change in Total Travel Time (%) | Number of Dynamic Customers Served |
|---|---|---|---|---|---|---|---|
| Current | 3 | 140 | 420 | N/A | 266.8 | N/A | N/A |
| Current | 4 | 105 | 420 | N/A | 230.3 | N/A | N/A |
| Current | 5 | 84 | 420 | N/A | 201.4 | N/A | N/A |
| Proposed | 3 | 140 | 420 | 0.75 | 266.8 | 0.0 | 0 |
| 1.5 | 270.8 | 1.5 | 2 | ||||
| 2.25 | 270.9 | 1.5 | 5 | ||||
| 3 | 272.7 | 2.2 | 11 | ||||
| 3.75 | 272.9 | 2.3 | 18 | ||||
| 4.5 | 275.2 | 3.1 | 21 | ||||
| Proposed | 4 | 105 | 420 | 0.75 | 230.3 | 0.0 | 0 |
| 1.5 | 231.7 | 1.0 | 2 | ||||
| 2.25 | 232.4 | 1.3 | 7 | ||||
| 3 | 232.9 | 1.5 | 10 | ||||
| 3.75 | 234.9 | 2.0 | 20 | ||||
| 4.5 | 235.1 | 2.1 | 23 | ||||
| Proposed | 5 | 84 | 420 | 0.75 | 201.4 | 0.0 | 0 |
| 1.5 | 202.6 | 0.6 | 2 | ||||
| 2.25 | 204.7 | 1.6 | 8 | ||||
| 3 | 205.6 | 2.1 | 14 | ||||
| 3.75 | 206.3 | 2.4 | 23 | ||||
| 4.5 | 211.9 | 5.2 | 28 |
© 2019 by the authors. Licensee MDPI, Basel, Switzerland. This article is an open access article distributed under the terms and conditions of the Creative Commons Attribution (CC BY) license (http://creativecommons.org/licenses/by/4.0/).
Share and Cite
MDPI and ACS Style
Torkjazi, M.; Huynh, N. Effectiveness of Dynamic Insertion Scheduling Strategy for Demand-Responsive Paratransit Vehicles Using Agent-Based Simulation. Sustainability 2019, 11, 5391. https://0-doi-org.brum.beds.ac.uk/10.3390/su11195391
AMA Style
Torkjazi M, Huynh N. Effectiveness of Dynamic Insertion Scheduling Strategy for Demand-Responsive Paratransit Vehicles Using Agent-Based Simulation. Sustainability. 2019; 11(19):5391. https://0-doi-org.brum.beds.ac.uk/10.3390/su11195391
Chicago/Turabian StyleTorkjazi, Mohammad, and Nathan Huynh. 2019. "Effectiveness of Dynamic Insertion Scheduling Strategy for Demand-Responsive Paratransit Vehicles Using Agent-Based Simulation" Sustainability 11, no. 19: 5391. https://0-doi-org.brum.beds.ac.uk/10.3390/su11195391
Note that from the first issue of 2016, this journal uses article numbers instead of page numbers. See further details here.