Article

Environmental Risk Assessment of Accidental Pollution Incidents in Drinking Water Source Areas: A Case Study of the Hongfeng Lake Watershed, China

1
Key Laboratory for Geographical Process Analysis & Simulation of Hubei Province, Wuhan 430079, China
2
College of Urban and Environmental Sciences, Central China Normal University, Wuhan 430079, China
3
School of Civil Engineering and Environmental Science, The University of Oklahoma, Norman, OK 73019, USA
*
Author to whom correspondence should be addressed.
Sustainability 2019, 11(19), 5403; https://0-doi-org.brum.beds.ac.uk/10.3390/su11195403
Submission received: 24 August 2019 / Revised: 22 September 2019 / Accepted: 26 September 2019 / Published: 29 September 2019
(This article belongs to the Collection Risk Assessment and Management)

Abstract

:
Accidental pollution incidents have caused a major threat to water safety of drinking water sources. However, few studies have focused on quantitative risk assessment of pollution incidents in a watershed which contains drinking water sources. A coupling model consisting of the Seveso III Directive, SWAT, and MIKE21 models was constructed for risk assessment of sudden pollution incidents at the watershed scale. The potential hazard of risk sources (e.g., industrial enterprises), the vulnerability of risk receptors (e.g., drinking water intakes), and the environmental risk of different sub-regions of the watershed were evaluated by this model. In addition, a case study was applied in Hongfeng Lake watershed (HLW), where the Hongfeng Lake drinking water source is located. The results showed that about 68% of the industrial enterprises in the HLW were potentially hazardous according to the Seveso III Directive, including 5 high hazard enterprises, 13 medium hazard enterprises, and 37 low hazard enterprises, most of which were concentrated in the coal mining, chemical production, and building material industries. The HLW was divided into the Yangchang River watershed (YRW), the Maiweng River watershed (MRW1), the Maxian River watershed (MRW2), the Houliu River watershed (HRW), and the lake area by the hydrological characteristics, among which, the vulnerability index of YRW was the largest. Besides, it was essential to consider the vulnerability assessment of drinking water intakes when conducting an environmental risk assessment in the HLW. Regional environmental risk grade of YRW, MRW1, MRW2, HRW, and the lake area was high, medium, low, low, and none, respectively. The environmental risk assessment results showed good consistency with the pollution characteristics and spatial distribution of industrial enterprises in the HLW. Furthermore, the theory of a three-level prevention system for “risk sources–water body connection–water intakes” was proposed for environmental risk management in the HLW. Overall, the case study in the HLW indicated that the coupling model proposed in this study had a good compatibility for environmental risk assessment of sudden water pollution incidents in a watershed.

1. Introduction

Over the past decades, China has been experiencing rapid industrialization and agricultural modernization, accompanied by a sharp deterioration in ecological environment. During this period, toxic chemicals have been widely used in industrial production, which has seriously threatened the water safety of drinking water sources [1].
There were 592 accidental water pollution incidents that occurred in the years 2012~2017 [2]. For instance, in 2016, large amounts of illegal sewage from an industrial wastewater treatment plant in Yanfeng County, Jiangxi Province, caused serious pollution to a drinking water source of Shanggao County [3]. Compared with long-period water pollution incidents, prediction in the occurrence of sudden water pollution incidents remains hard due to its uncertainty, complexity, and urgency [4]. As a sensitive environmental risk receptor, the water security of drinking water sources has been deeply affected by the surrounding industrial enterprises for a long time [5,6]. If the drinking water source is contaminated, it will directly aggravate the quality of drinking water supply in the whole country and indirectly have detriment in social stability [7]. The safety of drinking water sources remains a principal issue of future environmental management. Conducting an environmental risk assessment for drinking water sources and establishing a risk assessment system are beneficial to ameliorate the current situation of accidental water pollution incidents in drinking water source areas [8].
An environmental risk assessment (ERA) is the evaluation of the influence of industrial pollutions and other anthropogenic activities on human health and ecosystem [9]. In recent years, a variety of methods have been used to assess environmental risk. Salvi et al. proposed a set of risk assessment approaches for accidental pollution incidents, which took intensity, frequency, and vulnerability into account [10]. Tian et al. used the analytic hierarchy process (AHP) to analyze the feature of environmental risk in industrial enterprises [11]. Peng et al. introduced a novel five-step system to identify the environmental risk sources [12]. Meng et al. applied information-diffusion theory to estimate the maximum value of environmental risk of each individual risk source and get the result of total value of regional environmental risk [13]. Wang et al. invented a water source risk assessment method based on GIS under the pressure–state–response framework and quantitatively assessed the risk value of various risk sources in Shenzhen Reservoir [14]. Zhang et al. and Liu et al. improved a watershed-scale accidental pollution risk assessment system by the relative risk model, which provided a more comprehensive risk assessment system concerned with multiple risk receptors and sources [15,16]. Gu et al. estimated the vulnerability of drinking water sources through the fuzzy analytic hierarchy process (FAHP) [17]. Luo et al. established an integrated environmental risk assessment system of drinking water sources for risk sources and risk receptors based on the analytic hierarchy process (AHP) [18]. Xing et al. realized research area gridding and classified the regional environmental risk into different levels by designing an environmental risk model, which included field intensity and vulnerability index [19]. Jia et al. established a risk assessment index system containing environmental risk sources’ intensity, risk receptors’ vulnerability, sewage pipeline diffusivity, and the corresponding risk assessment model for sudden water pollution incidents [20]. Xiao et al. tested the hazard and vulnerability of each working unit of the water function areas and finally acquired the results of each working unit’s risk evaluation through the risk grade matrix by using the fuzzy comprehensive evaluation method [2].
For the above work, the evaluation methods of risk sources have been developed well, which can give quantitative results of environmental risk. However, the analyses of the vulnerability of risk receptors are lacking in quantitative evaluation methods. The estimation of risk receptors’ vulnerability relies heavily on weights which has no certain standards. Owing to the large scale of the study area, the assessment of environmental vulnerability can only be roughly obtained from the number of receptors in some studies [20]. Thus, it is difficult to precisely quantify the vulnerability of risk receptors.
Hongfeng Lake is located in Yungui plateau, and it is a dominant drinking water source that supplies fresh water for approximately three million people in Guiyang City. Some researchers have focused on the chemical speciation distribution, biogeochemical cycle, and release mode of various elements in the Hongfeng Lake watershed (HLW) [21,22,23]. Others have evaluated the potential ecological risk of heavy metals in the sediments of the HLW [14,24,25]. Wang et al. discussed the effect of seasonal hypoxia on the release of phosphorus from sediments of the HLW [26]. Wang et al. analyzed and evaluated the potential ecological risk of heavy metal pollution, in quantitative terms, in sediments of the HLW [27]. So far, few researchers have conducted risk assessments of sudden water pollution incidents on the scale of the watershed [2,16]. Furthermore, few literatures focus on the risk assessment of sudden water pollution incidents in the HLW.
The Seveso III Directive refers to the European Council’s third revision of the Seveso Directive, which aims to prevent major incidents of hazardous materials and control the hazard to human and environment caused by major accidents [28]. In this study, a coupling model consisting of the Seveso III Directive, SWAT, and MIKE21 models was constructed to assess the environmental risk of sudden pollution incidents in quantitative terms surrounding the drinking water source area. In this coupling model, the potential hazard of risk sources and the vulnerability of risk receptors were considered to acquire the integrated environmental risk level. Moreover, Hongfeng Lake drinking water source was selected as a case study to use the proposed coupling model on the scale of the watershed. The objectives of this study were: (1) To build a quantitative environmental risk assessment model to evaluate the accidental pollution incidents in the drinking water source area; (2) to apply the proposed approach to the Hongfeng Lake watershed, which contains a drinking water source; and (3) to provide a basis for the environmental management of the Hongfeng Lake watershed.

2. Materials and Methods
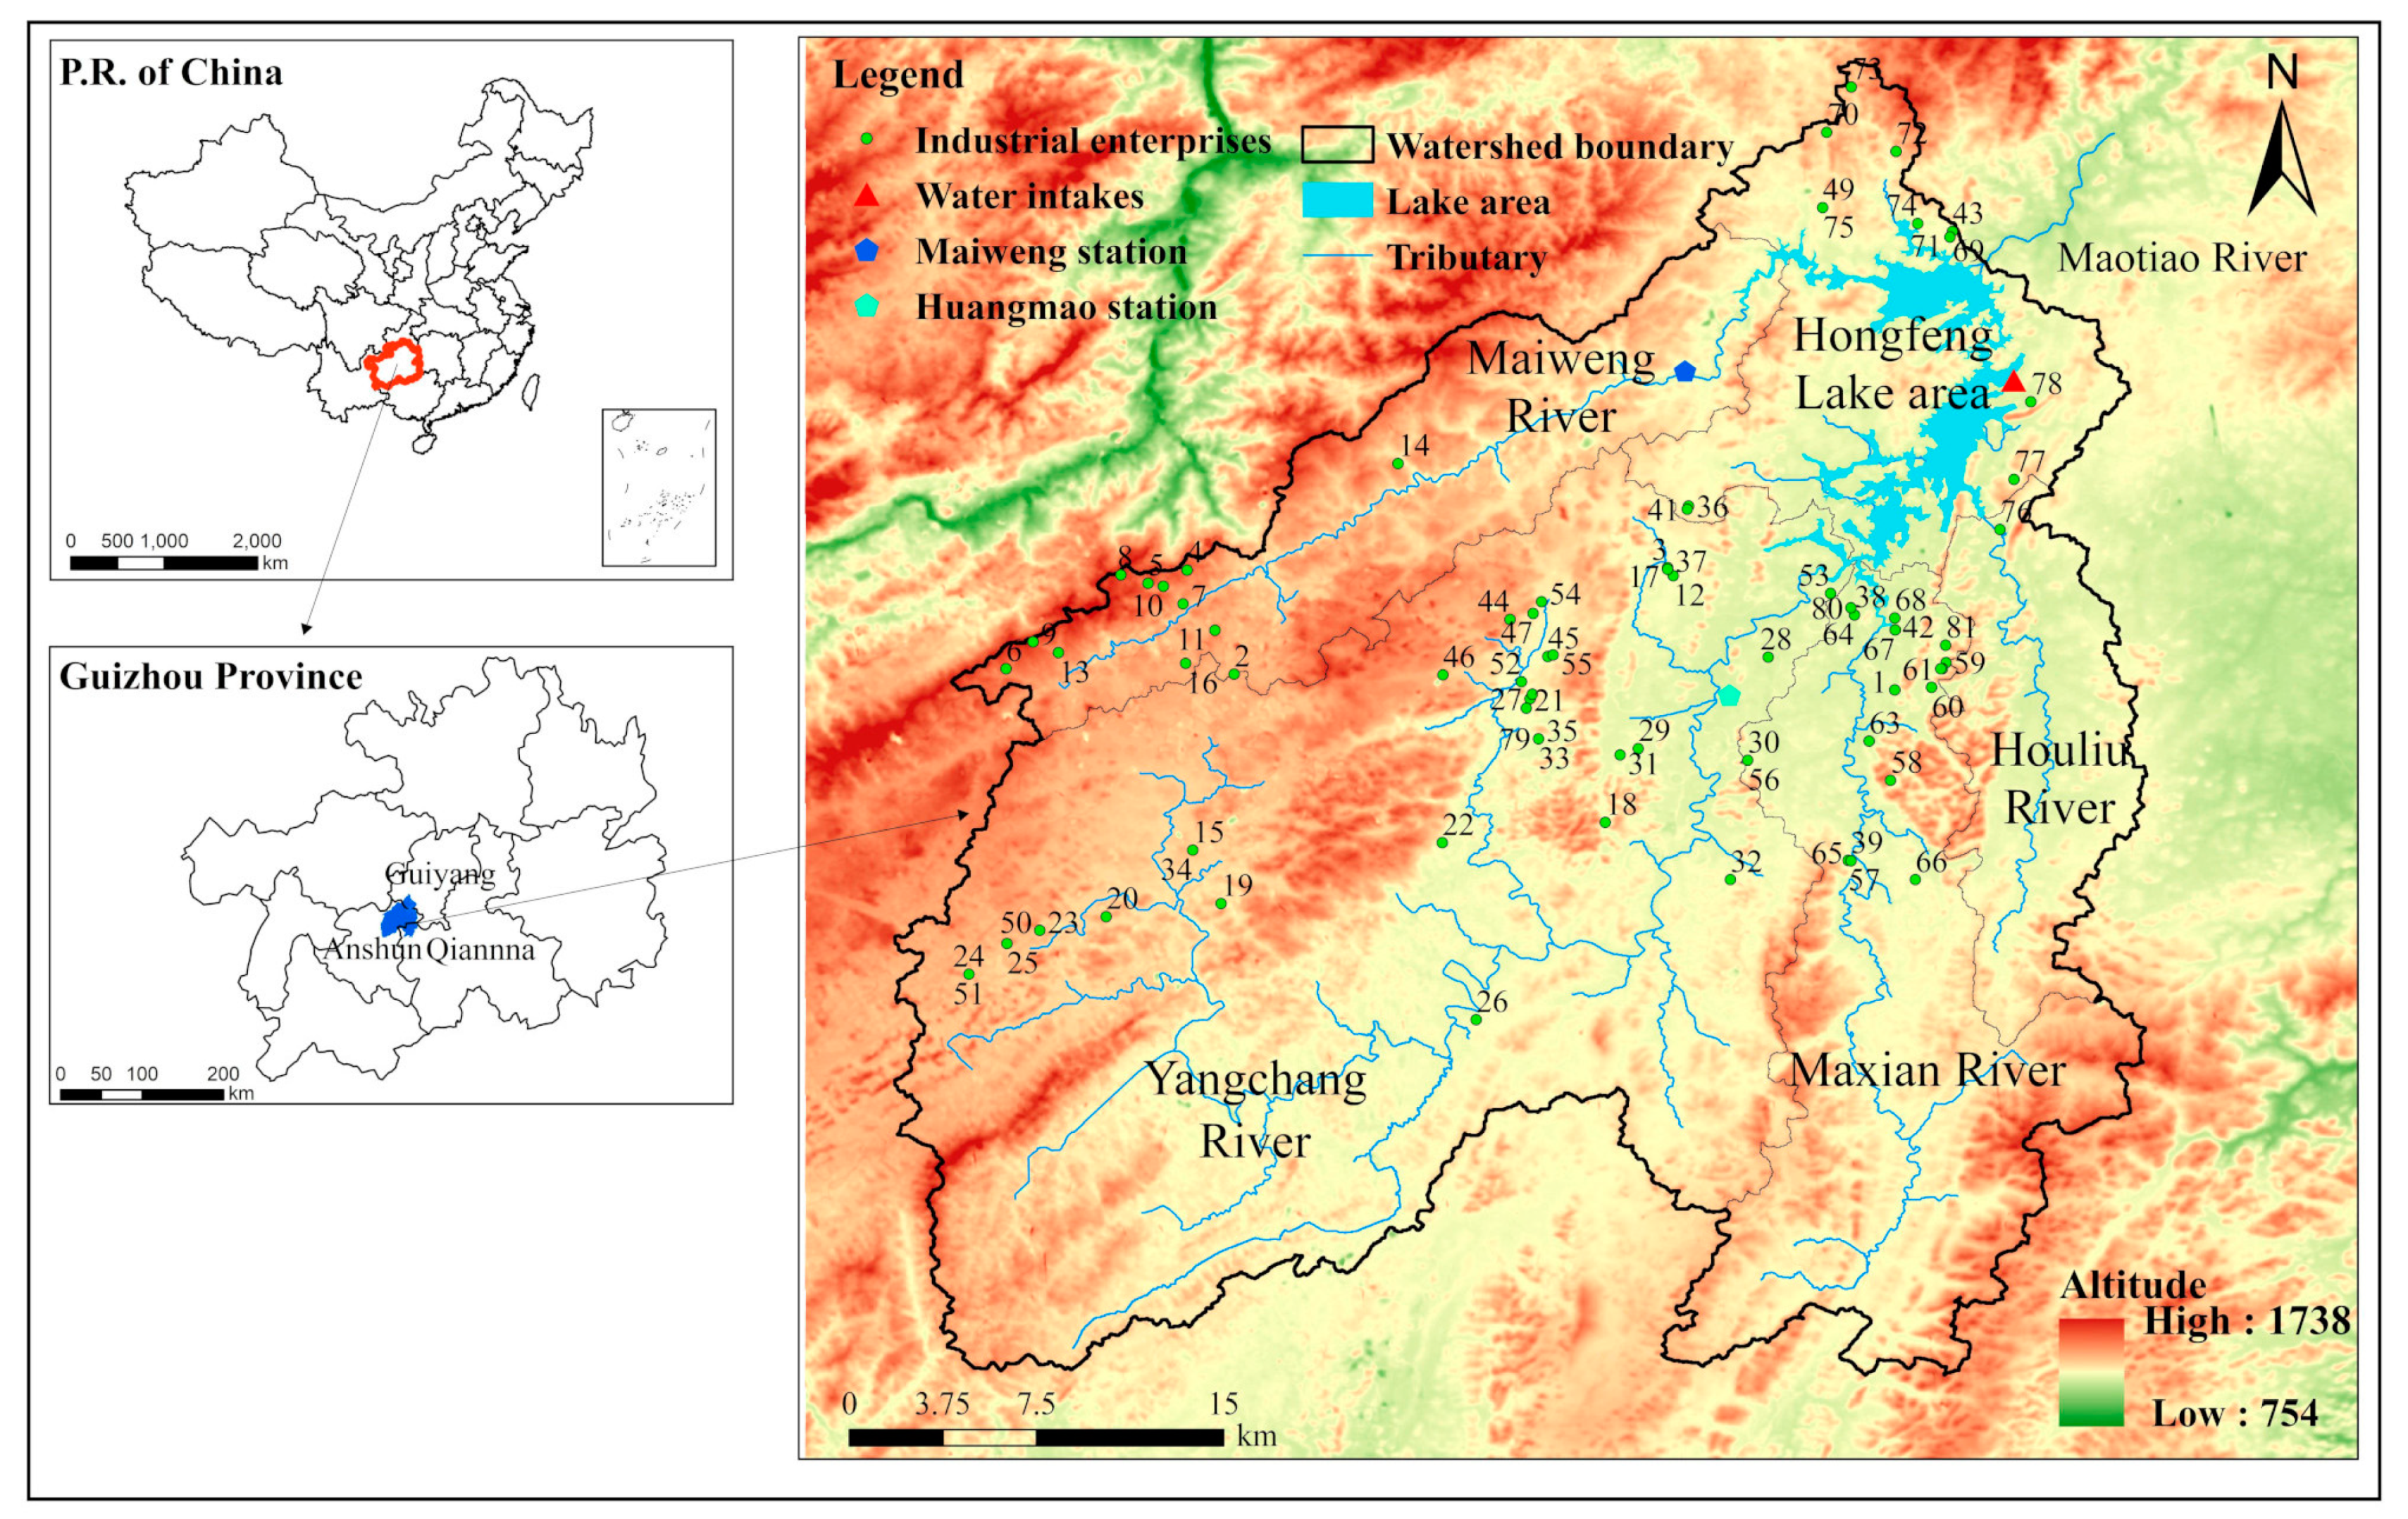
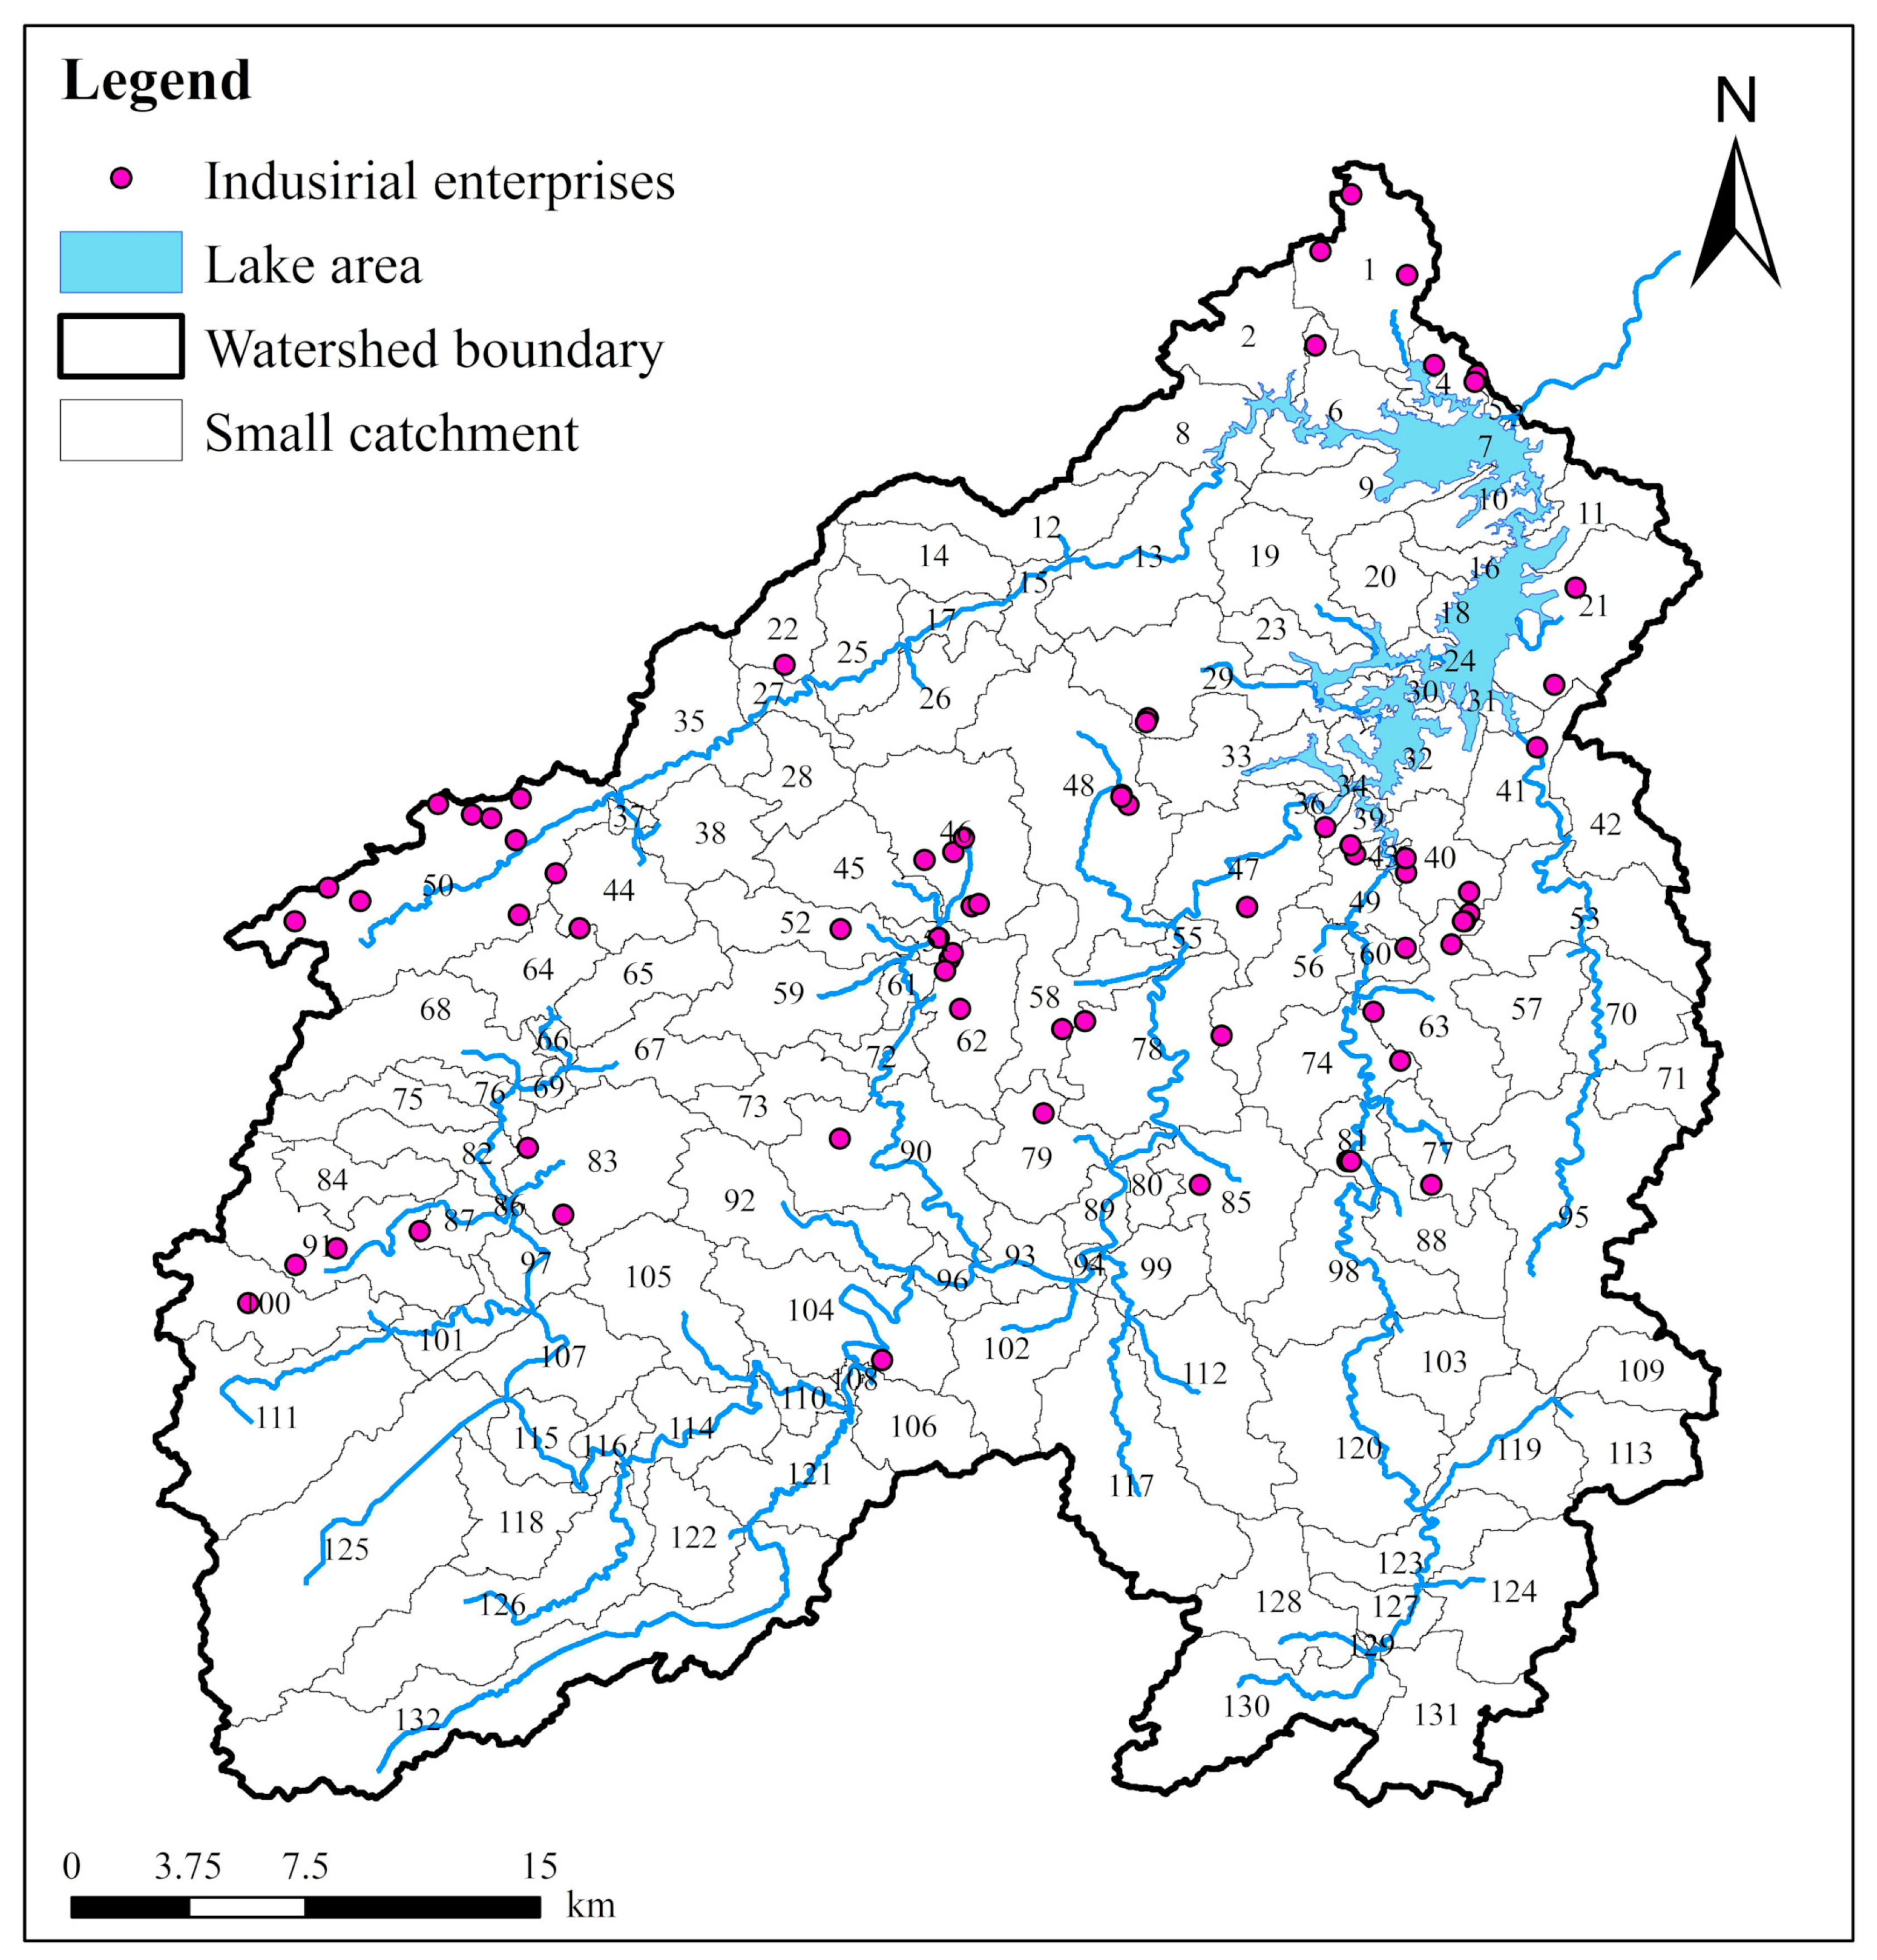
2.1. Study Area

Hongfeng Lake (26°31′–26°34′ N, 106°24′–106°43′ E), an artificial lake, is located near Qingzhen City, a suburb of Guiyang City, Guizhou Province, Southwestern China [29], which is shown in Figure 1.
Hongfeng Lake is located in the subtropical humid monsoon climate zone, with an annual average temperature of 14.06 °C and an annual precipitation of 1176 mm [30]. Hongfeng Lake was constructed in the 1960s as one of the seven cascade hydropower stations along the Maotiao River, a tributary of the Wujiang River. Hongfeng Lake is a multi-functional water body for drinking water supply, flood control, hydropower, shipping, commercial aquaculture, and recreation [30]. As a main drinking water source, Hongfeng Lake is mainly utilized to supply fresh water for urban areas of Guiyang, Guizhou Province. The drinking water intakes of Hongfeng Lake are Guiyang Xijiao and Qingzhen Bailongdong (26.513444° N, 106.441139° E). Guiyang Xijiao water intake is marked in Figure 1.
There are four main tributaries flowing into Hongfeng Lake, which are Yangchang River, Maxian River, Houliu River, and Maiweng River. Yangchang River is the largest tributary flowing into the Lake [24], and Maotiao River is the only tributary that flows out of the Lake. According to the hydrological and geographical characteristics, the Hongfeng Lake watershed (HLW) is divided into five sub-regions, which are Maiweng River watershed, Yangchang River watershed, Maxian River watershed, Houliu River watershed, and the surrounding area of the Lake. The area of the HLW is approximately 1596.0 km2 and the area of the lake is 57.2 km2, with an average water depth of 10.5 m (max. 45 m) [30]. The HLW is dominated by woodland and farmland, accounting for more than 60% of the total area [31,32]. The soil type in the HLW is dominated by yellow soil and lime soil [31]. A few industrial enterprises of different types are distributed in the HLW [11].

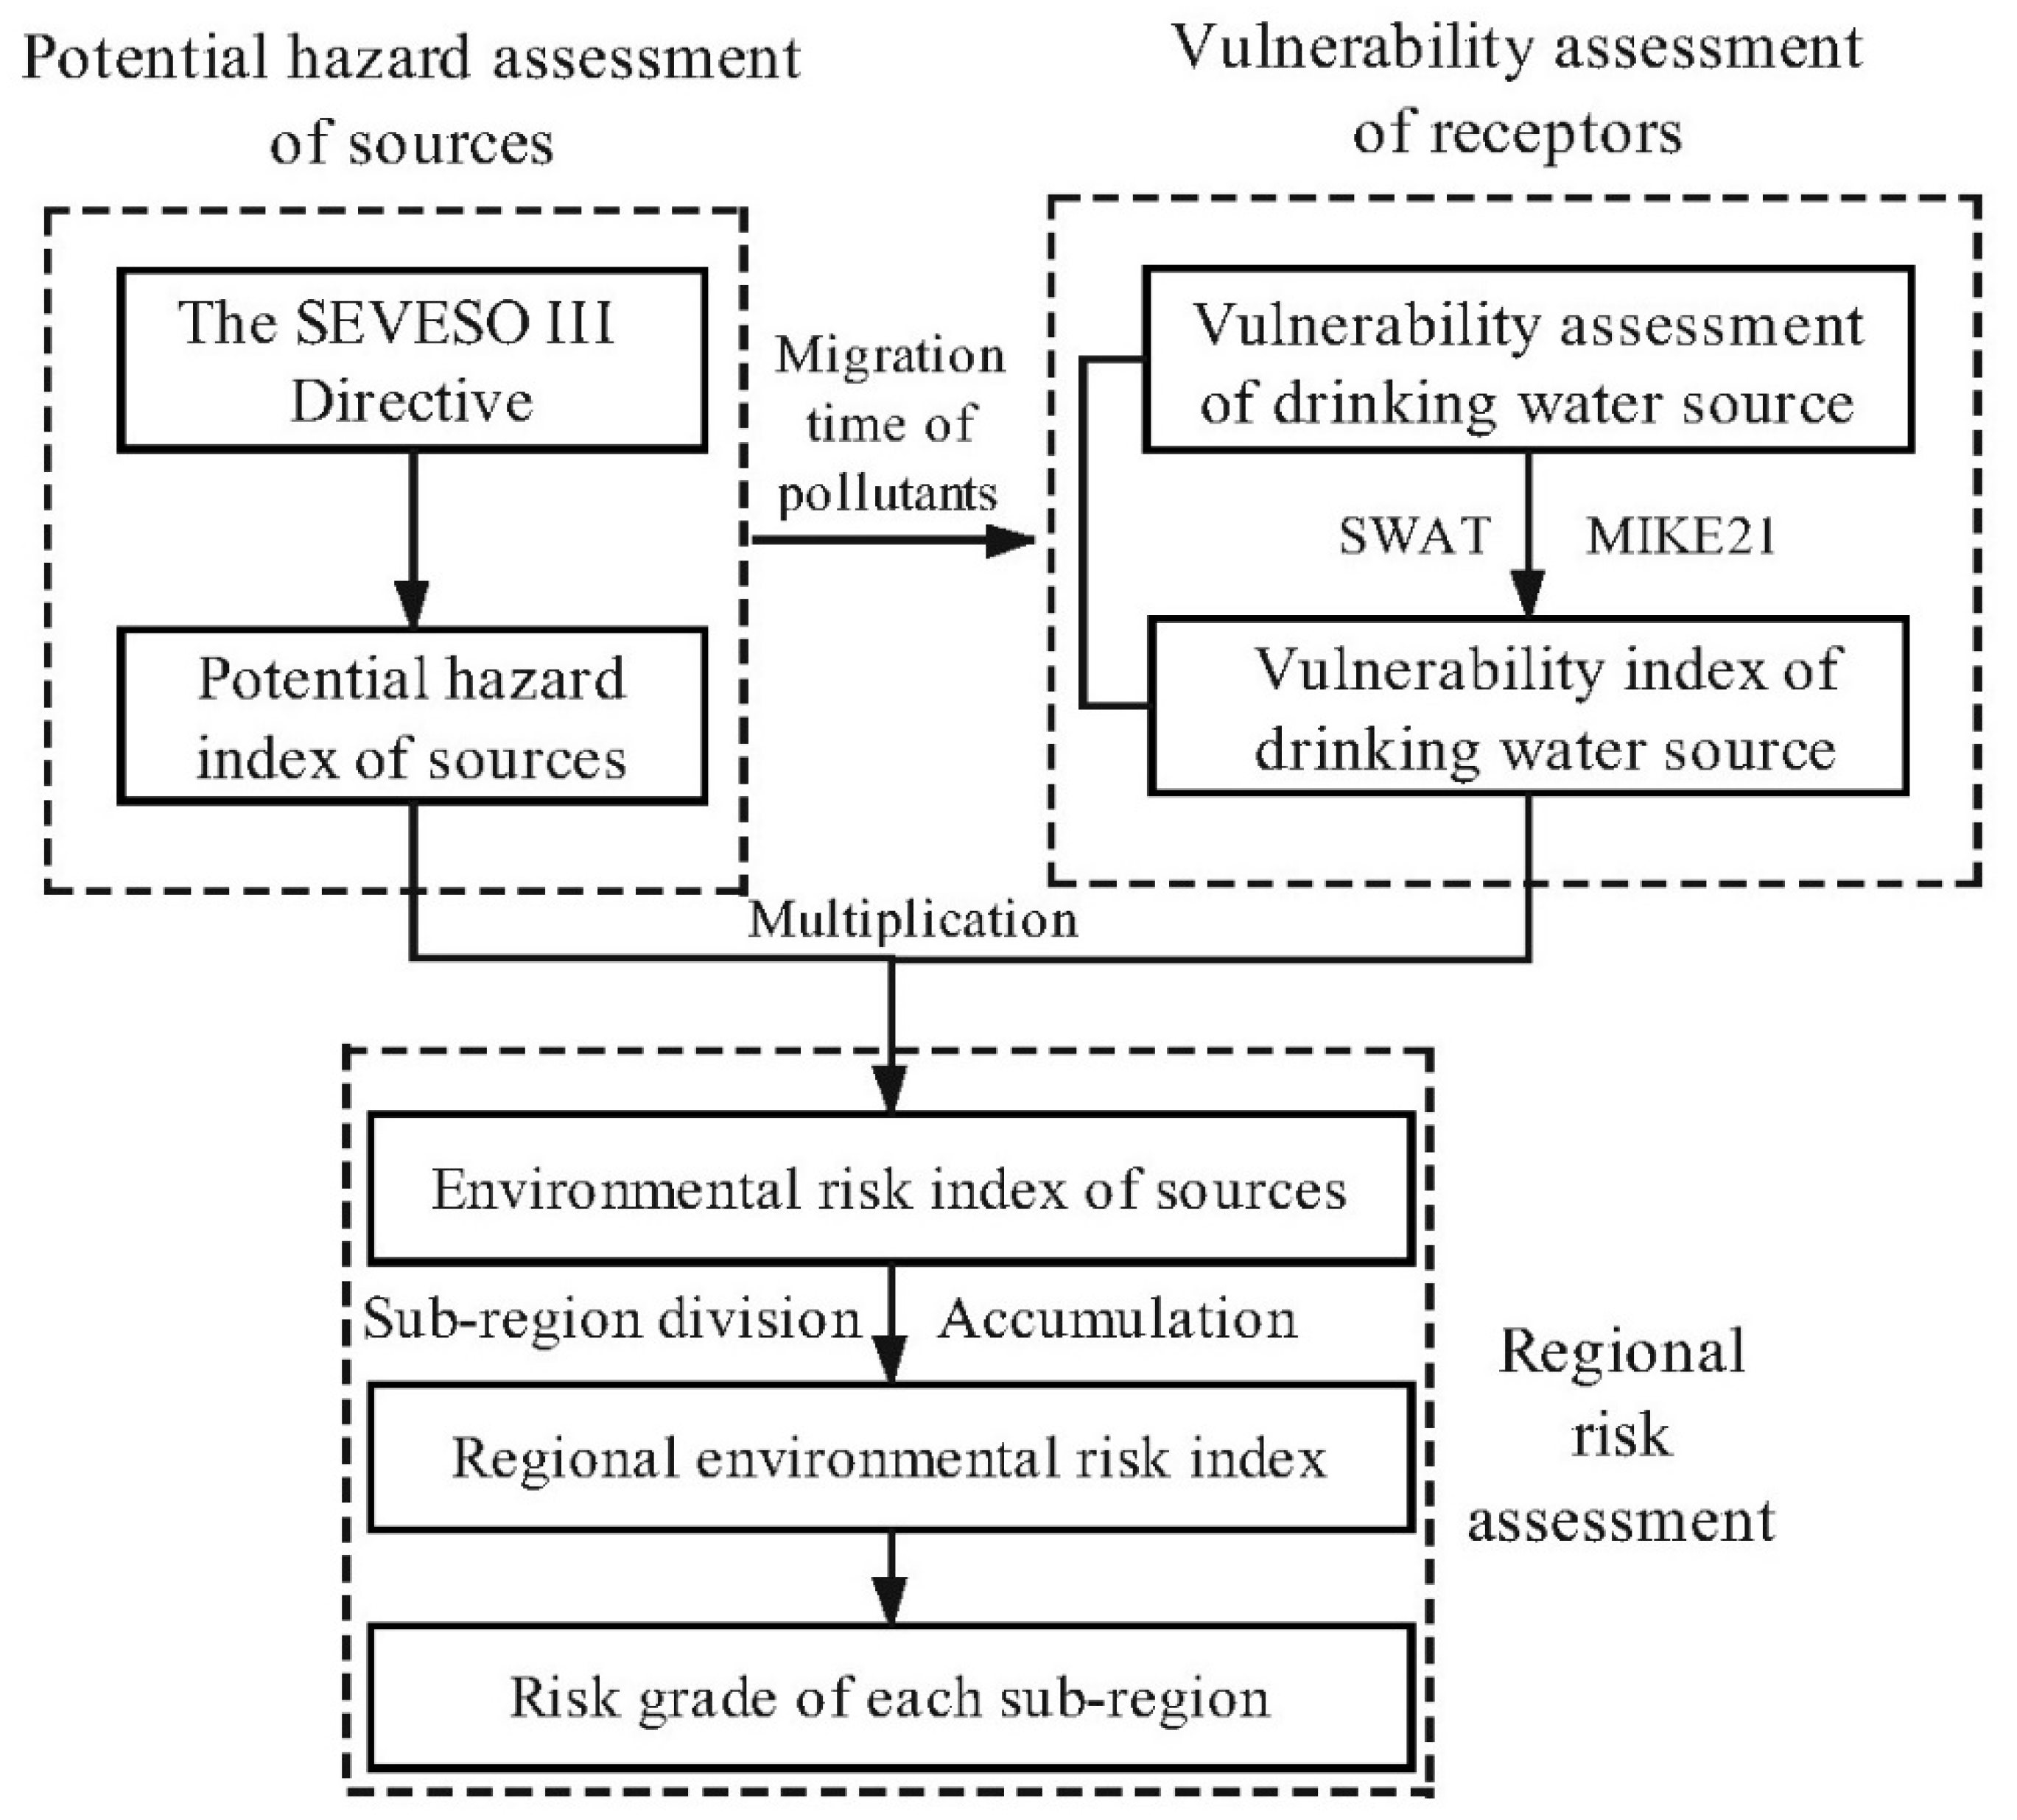
2.2. A Coupling Model for Sudden Environmental Risk Assessment

In this study, a coupling model was formed to assess environmental risk of sudden water pollution incidents in a drinking water source area. The main procedures of applying this model are shown in Figure 2.
The model takes the potential hazard of industrial enterprises and the vulnerability of drinking water intakes into consideration to obtain the environmental risk level of each industrial enterprise. Then, the regional environmental risk level of each sub-region in the watershed was evaluated and the risk level was classified according to the value. The main procedures of the model are listed as follows:
  • Potential hazard assessment of risk sources (PHI)
The pollutants emitted by the risk source into the water will cause great harm to the environment. This paper uses Seveso III Directive model to calculate the potential hazard index to characterize the harm of the risk source [11]. The type and quantity of hazardous materials stored in the risk sources are considered in the Seveso III Directive.
  • Vulnerability assessment of risk receptors (UVI)
Risk receptors are also important factors affecting the results of an environmental risk assessment. In this study, the damage degree of the receptor is indicated by vulnerability. For urban centralized drinking water source areas, the vulnerability is related to the population served by drinking water intakes and the migration time of leaking pollutants. The migration time is calculated by the SWAT and MIKE21 models [33].
  • Integrated environmental risk assessment of risk sources (ERI)
After completing the above two steps, the integrated environmental risk assessment of risk sources is conducted, which is expressed as the environmental risk index (ERI). The ERI is calculated on the basis of the PHI and the UVI. The environmental risk level of risk sources can be divided into different grades by the value of ERI.
  • Regional environmental risk assessment (ERIS)
Regional environmental risk is the accumulation of the ERI of each risk source in a certain sub-region [2], which is defined as regional environmental risk index (ERIS). To carry out environmental risk management efficiently, regional environmental risk level can be rated by the value of ERIS.

2.3. Assessment System

2.3.1. Potential Hazard Assessment of Risk Sources

The Seveso III Directive hopes to enhance the capacity of environmental protection of the entire region in a lasting and efficient way [34,35]. It is relatively complete and has been widely accepted in the European Union [10,28,36,37]. The fundamental assumption of the Seveso III Directive to assess the environmental risk is that industrial enterprises have the potential hazard of leaking pollutants. The potential hazard index (PHI), a function of the inherent characteristics of industrial enterprise, is used to classify the hazard grade of industrial enterprises. The type of substances and productions, as well as the number of substances handled, stored, and processed by the enterprises, need acquiring to calculate the PHI. Besides, the probability of a pollution incident also needs to be taken into account. In a practical experiment, the detailed statistics of industrial enterprises used to calculate the probability are difficult to obtain. From a safety perspective, it is considered that the probability of a pollution accident is equal for all industrial enterprises that store hazardous substances.
The limit values of hazardous substances are defined in the Seveso III Directive model, which are divided into A-type limit values (ThrA) and B-type limit values (ThrB). The quantity of hazardous substances is expressed as Mi,j. When Mi,j is 0, the hazard of industrial enterprises is defined as no hazard. When 0 < Mi,j ThrA, it is defined as low hazard. When ThrA < Mi,j ThrB, it is defined as medium hazard. When Mi,j > ThrB, it is defined as high hazard. The Seveso III Directive uses the threshold method to classify hazardous substances, while it is inadequate to reflect the real situation of the hazard of industrial enterprises. In order to make the potential hazard assessment more accurate, this study introduces linear functions to continuously classify the potential hazard index of industrial enterprises [38]. The PHI of industrial enterprises of each sub-region is accumulated to obtain the regional potential hazard index (PHIs). The following Equations are used to calculate the value of the PHI and PHIs:
P H I i , j = P ( M i , j ) = { 0 M i , j = 0 M i , j 2 ThrA 0 < M i , j ThrA M i , j ThrA 2 ( ThrB ThrA ) + 0.5 ThrA < M i , j ThrB 1 M i , j > ThrB
P H I i = m a x ( P H I i , 1 , P H I i , 2 , , P H I i , j )
PHIs = i = 1 I PHI i
where PHIi,j is the potential hazard index of the j-th class of hazardous substance stored by the i-th enterprise, Mi,j is the number of the j-th class of hazardous substance stored by the i-th enterprise, ThrA and ThrB are the A-type and B-type limit values of the quantity of the hazardous substances, I is the total number of all the enterprises, PHIi is the potential hazard index of the i-th enterprise, and PHIs is the cumulative potential hazard index of all the enterprises in a certain sub-region of the study area.

2.3.2. Vulnerability Assessment of Risk Receptors

For an urban centralized drinking water source area, its vulnerability is calculated by the drinking water intake and expressed by the vulnerability index (UVI). The value of UVI is closely related to the population quantity served by drinking water intakes and the time required for the leaking pollutants to reach the water intake, along with the water flow. The calculation Equations are as follows:
{ U V I i , k = ( t max t i , k ) / t max × p k / k = 1 K p k ( 0 < t i , k < t max ) U V I i , k = 0 ( t i , k t max )
where UVIi,k is the vulnerability index of the k-th drinking water intake caused by the i-th enterprise, K is the total number of all the drinking water intakes, pk is the population quantity served by the k-th drinking water intake, ti,k is the migration time for pollutants from the i-th enterprise to the k-th drinking water intake, and tmax is the maximum value of ti,k.
The population quantity served by a drinking water intake is directly proportional to its water withdrawal. Therefore, if there is a lack of the population information served by each drinking water intake of the study area, Equation (4) can be expressed as Equation (5):
{ U V I i , k = ( t max t i , k ) / t max × w k / k = 1 K w k ( 0 < t i , k < t max ) U V I i , k = 0 ( t i , k t max )
U V I i = k = 1 K U V I i , k
where wk is the water withdrawal per day of the k-th drinking water intake, m3 d−1, and UVIi is the vulnerability index of all the drinking water intakes of the study area caused by the i-th enterprise.
In addition, some assumptions are follows: It is necessary to count the time required for the pollutants migrating to the drinking water intakes; the diffusion process of leaking pollutants needs to be considered, and the process of dilution, degradation, and sedimentation are excluded; the potential hazard of these substances is considered to remain constant for a certain period (e.g., 24 h) and the pollution accident can be effectively controlled during this period. For a lake-type drinking water source, the leaking pollutants migrate along the tributary to the lake inlet firstly, and then migrate with the water flow to the drinking water intake. Therefore, for a lake-type drinking water source, the migration time for a certain pollutant from the i-th enterprise to the k-th drinking water intake (ti,k) consists of two parts, which are calculated as follows:
t i , k = t i , k 1 + t i , k 2
where ti,k1 is the migration time for a certain pollutant from the i-th enterprise to the lake inlet, and ti,k2 is the migration time for the same pollutant from the lake inlet to the k-th drinking water intake of a lake-type water source.
  • Estimation of the average flow velocity of each reach (V)
The SWAT model was used to divide the tributaries and simulate monthly average flow discharge of the study area. Based on the DEM data, the sub-watersheds and reaches were divided. Then the division results were loaded into the SWAT model. The geographic coordinates of each industrial enterprise were counted, and a geographic information layer was generated. The layer was imported into ArcGIS and stacked with the base map of the study area. The precipitation series of the study area was used to simulated monthly average flow of each reach. In addition, the simulated flow was adjusted by the measured flow of the hydrological station. The greater the flow discharge, the greater the flow velocity and the faster the migration of pollutants from the risk source. Therefore, from a safety point of view in the response of a possible pollution incident, the largest monthly average flow was selected as the flow data (Q). All reaches were adjusted by the ratio of the width of several typical reaches by remoting sensing images to the measured width of the divided reaches to acquire the average river width (D). Similarly, the average depth (H) of each reach could be obtained. The average flow velocity (V) of each reach can be calculated as follows:
V = Q / ( D × H )
where V is the average velocity, Q is the average flow discharge, D is the average river width and H is the average river depth.
  • Migration Time from the Industrial Enterprise to the Lake Inlet (ti,k1)
The time for a certain pollutant from the i-th enterprise migrating from the nearest tributary of the enterprise to the lake inlet is calculated as follows:
t i , k 1 = D 0 / V 0 + n = 1 N L n / V n
where D0 is the distance for a certain pollutant from the leakage position to the nearest reach of the i-th enterprise, V0 is the average velocity of the pollutants flowing into the nearest reach, n is the serial number of the reach through which the leaking pollutants flows, 1 is the serial number of the reach where the pollutants first flow into, N is the total number of all the reaches through which the pollutant will flow, Ln is the length of the n-th reach, and Vn is the average velocity of the n-th reach.
  • Migration Time from the Lake Inlet to the Drinking Water Intake (ti,k2)
The MIKE21 model was used to simulate the migration and transformation of leaking pollutants [39], and eventually obtain the migration time. The hydrodynamic adopts the Hydrodynamic module (HD module) and the water quality adopts the Transport module. The transformation involves two processes of diffusion and degradation, which are determined by parameters. The risk concentration is set based on the concentration characteristics of pollutants in the past years. The initial value of the model is determined according to the monitoring concentration of pollutants in the area. The migration and transformation process of leaking pollutants in different tributaries are simulated, respectively.

2.3.3. Integrated Environmental Risk Assessment of Risk Sources

The integrated environmental risk of sources is expressed by the environmental risk index (ERI), which is calculated as:
E R I i = P H I i × ( U V I i × w f u + A V I i × w f a + I V I i × w f i )
where ERIi is the environmental risk index of the i-th industrial enterprise; PHIi is the potential hazard index of the i-th industrial enterprise; UVIi, AVIi, IVIi represent the threat of the i-th enterprise to the urban area, the agricultural area, and the industrial area, respectively; wfu, wfa, wfi are the weighting factor of the urban area, the agricultural area, and the industrial area, respectively.
The weighting factor is determined according to the actual field situation of the study area. This study focuses on an urban centralized drinking water source; thus, only the vulnerability of an urban area is considered. It is assumed that both the value of wfa and wfi are 0 and the value of wfu is 1. Equation (10) is simplified as follows:
E R I i = P H I i × U V I i

2.3.4. Regional Environmental Risk Assessment

Generally, the studied area where the drinking water source is located can be divided into several sub-regions according to its hydrological characteristics, and the regional environmental risk (ERIs) is the accumulation of ERI of each industrial enterprise in a certain sub-region. The value of ERIs of each sub-region is calculated as follows:
E R I s = i = 1 I E R I i
where ERIs is the regional environmental risk of each sub-region in the watershed, ERIi is the environmental risk index of the i-th industrial enterprise, and I is the total number of industrial enterprises in a certain sub-region. The regional environmental risk level of different sub-regions in the watershed can be divided into four grades: High, medium, low, and none, according to the value of ERIs.

3. Results

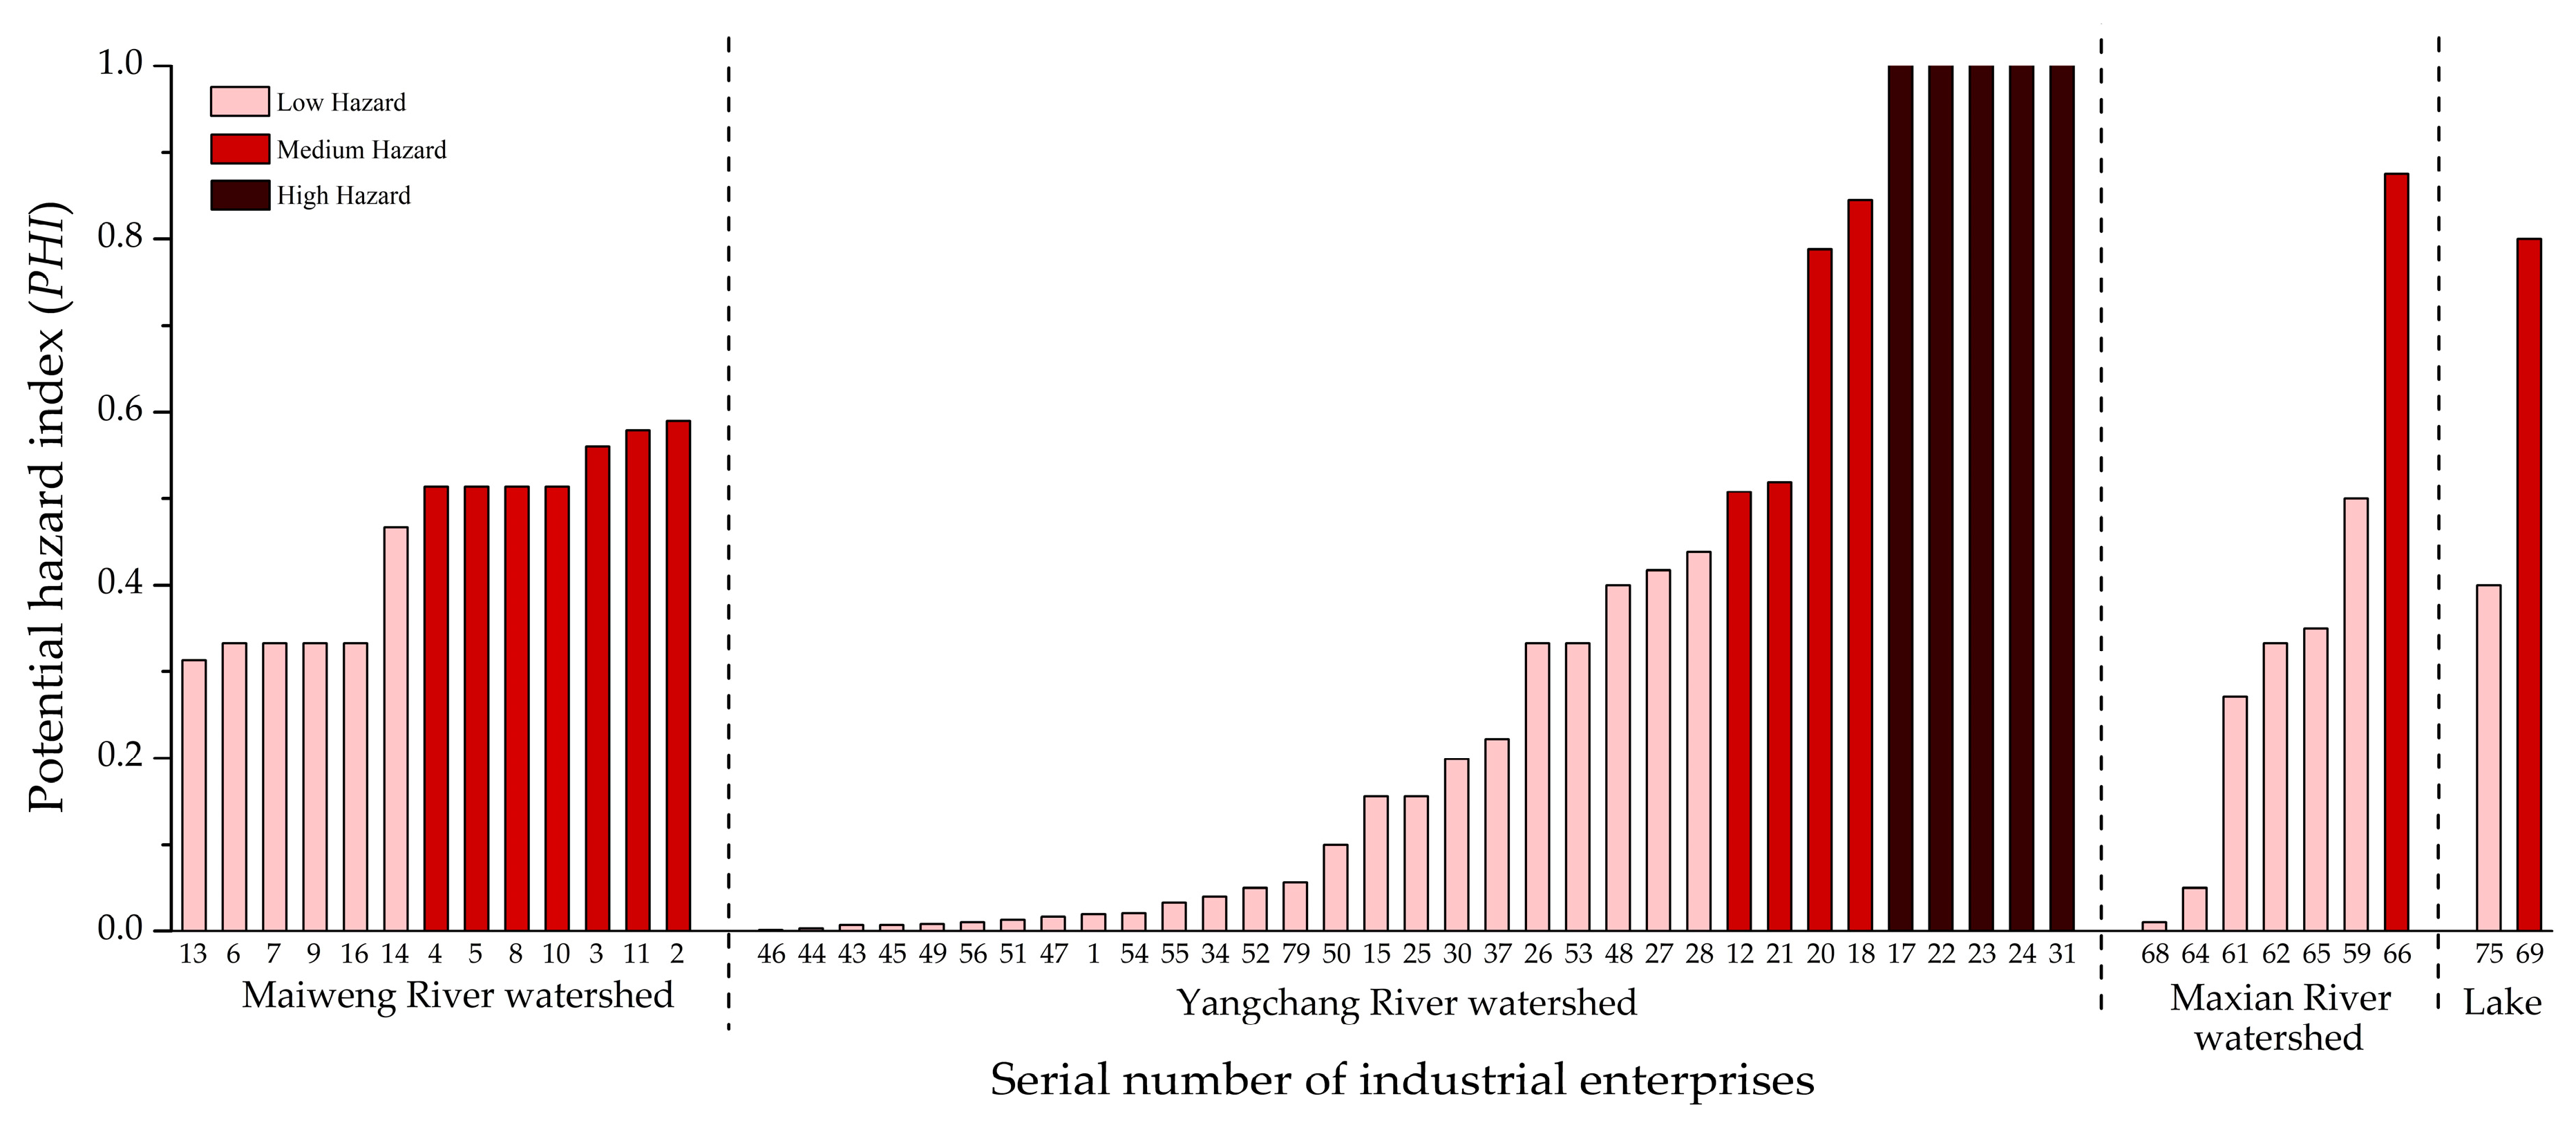
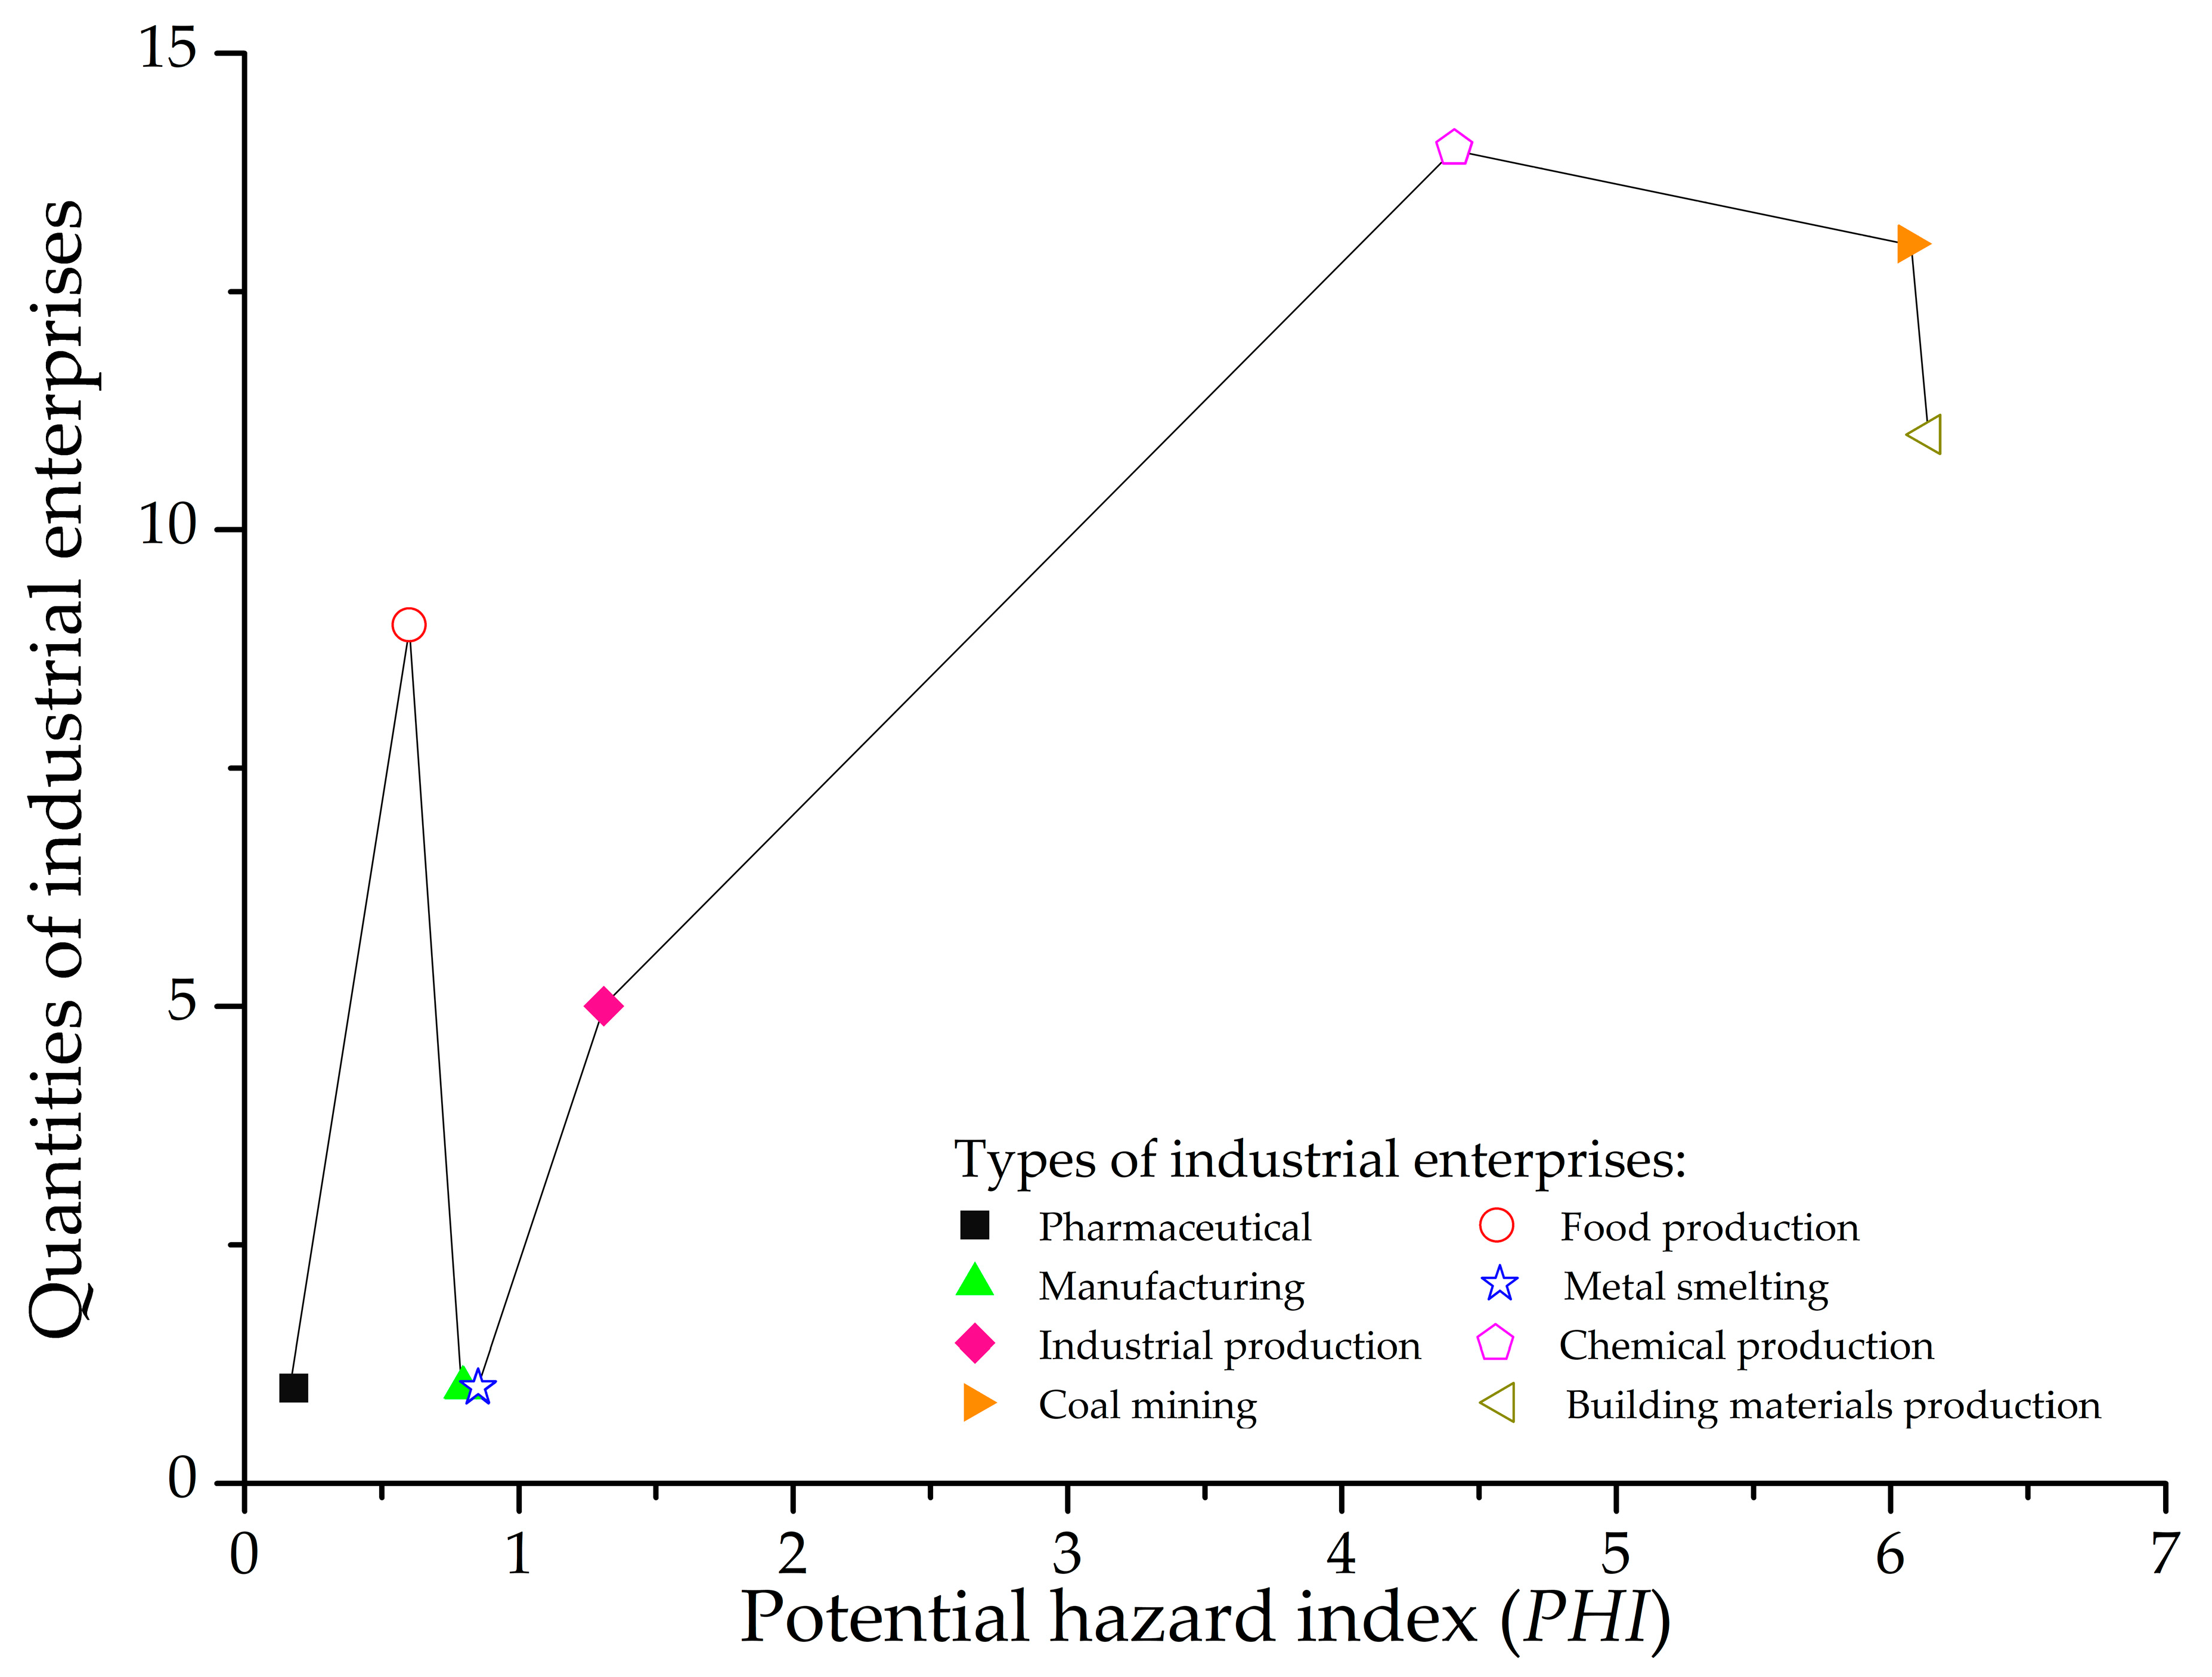
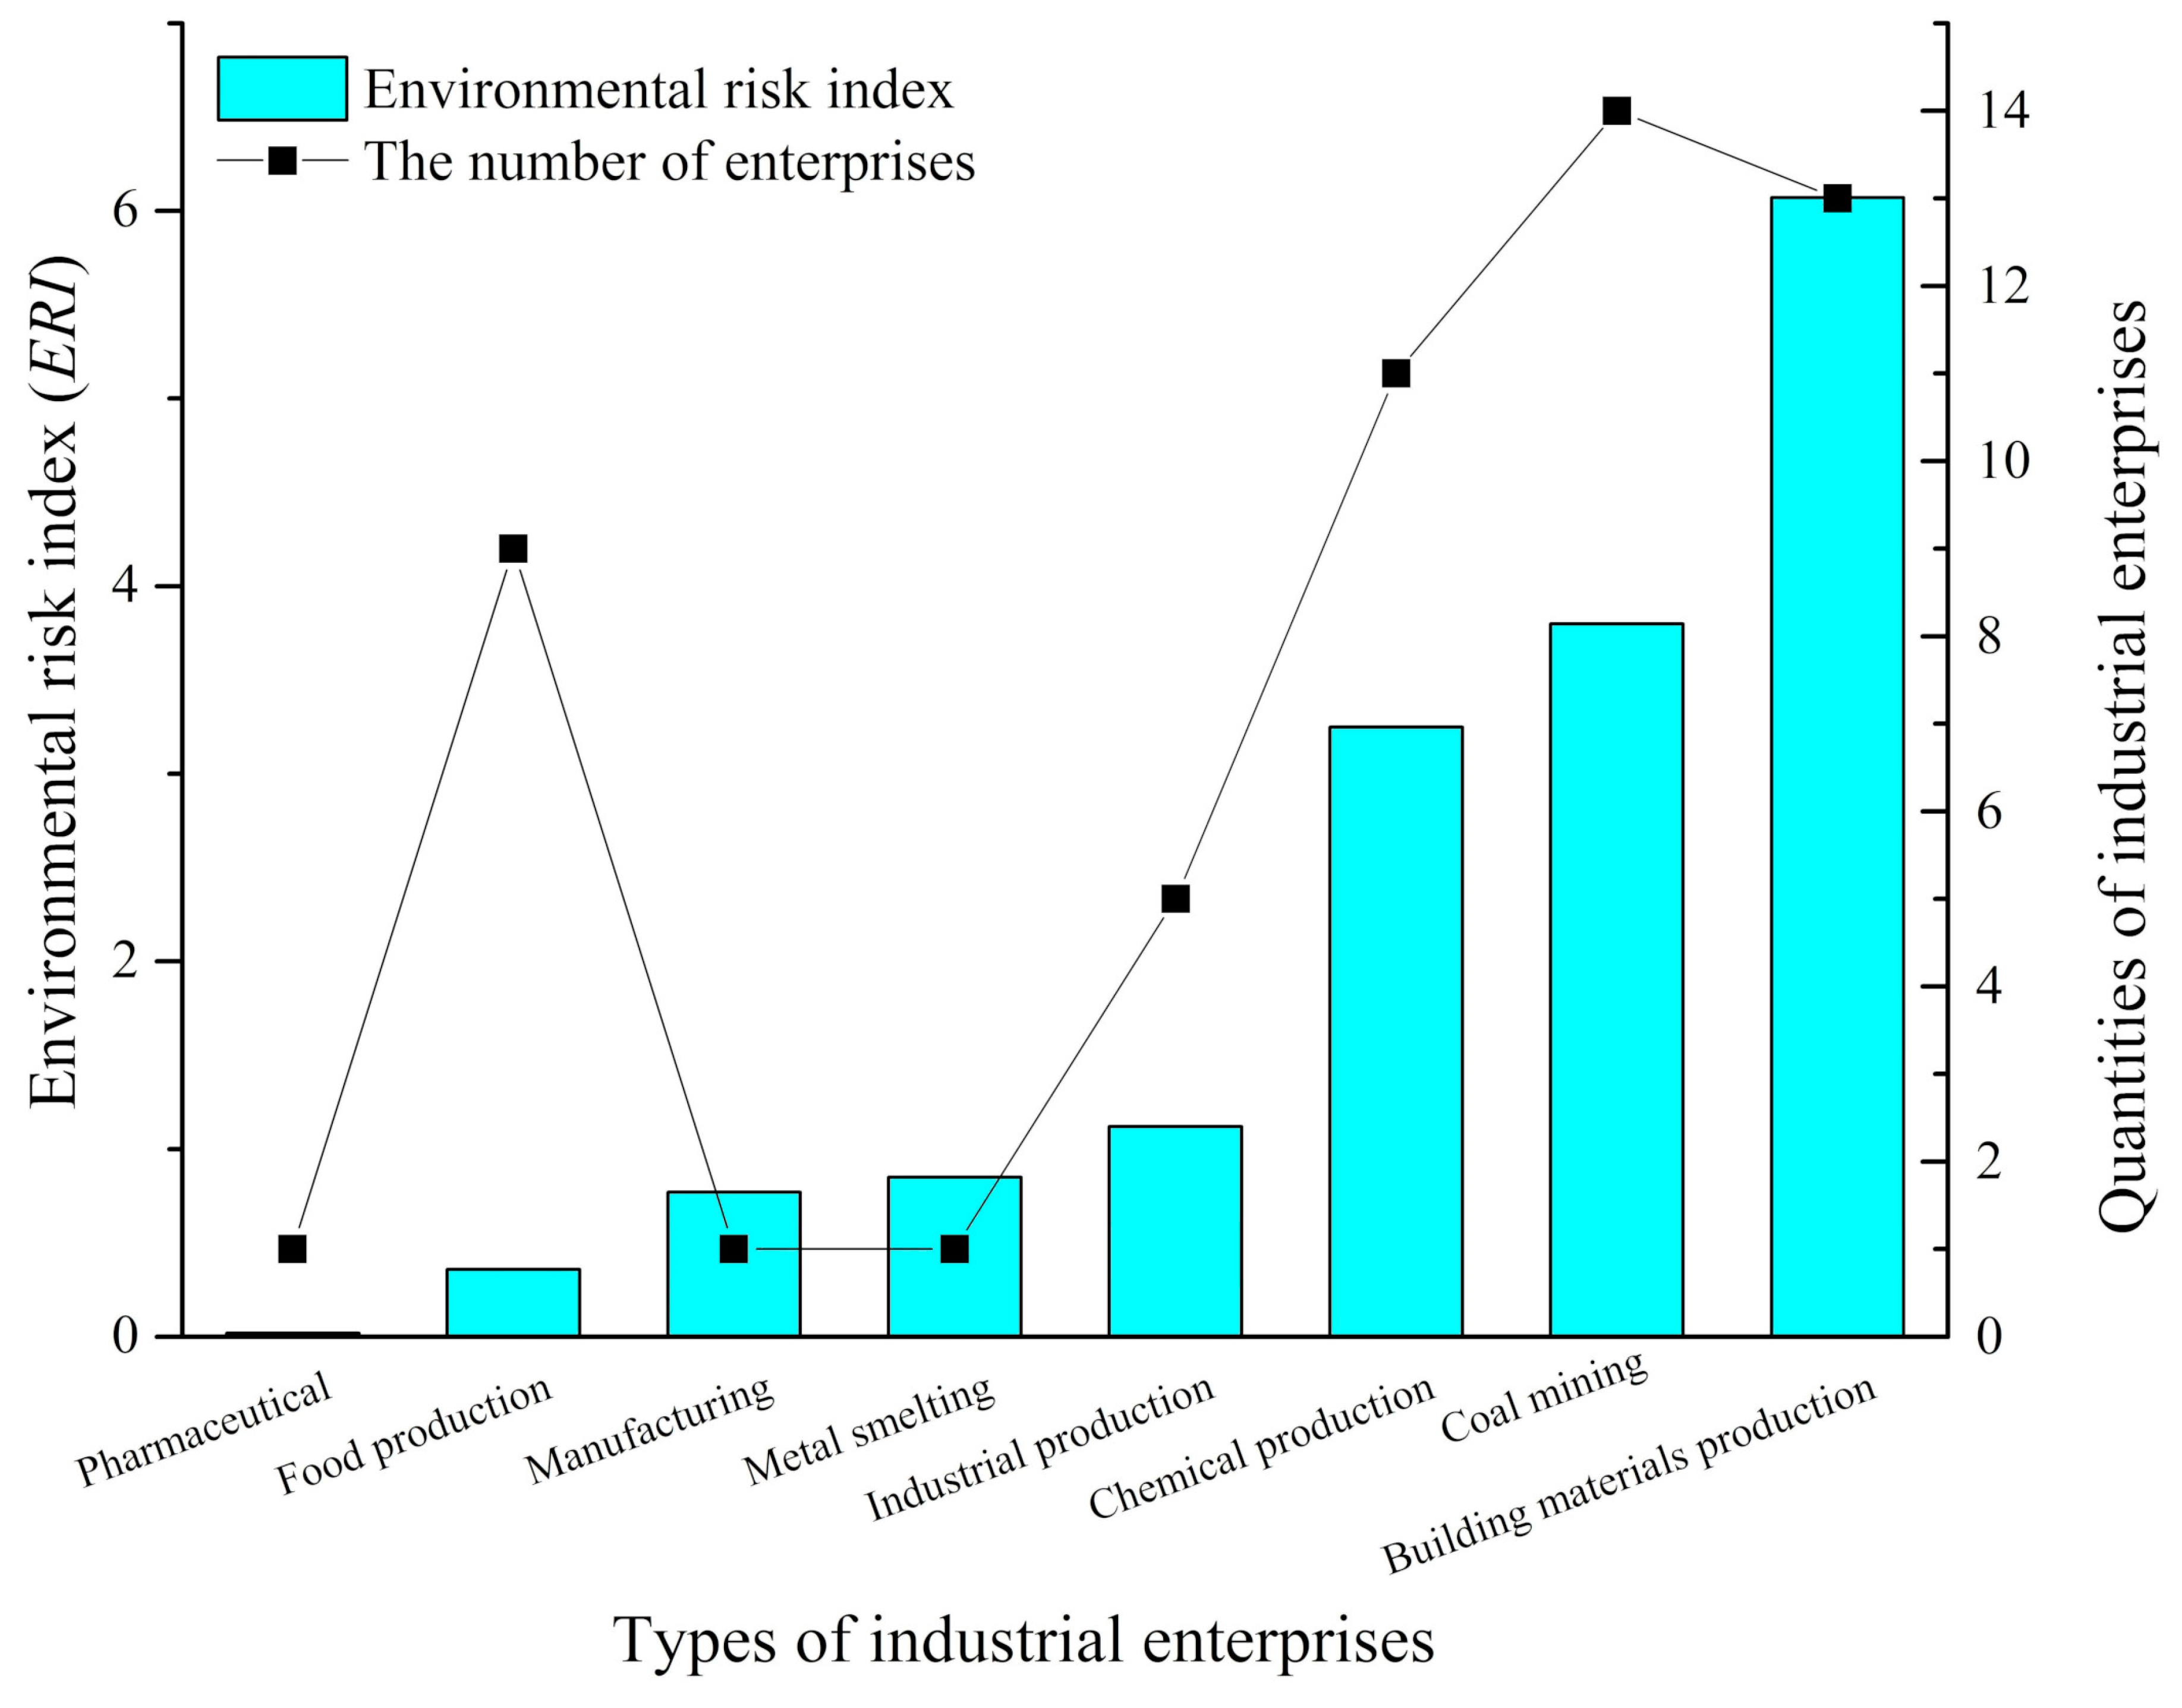
3.1. Potential Hazard Index of Industrial Enterprises

According to the field investigation and the document about pollution sources information of the Hongfeng Lake watershed (HLW) provided by Two Lakes and One Reservoir Administration of Guiyang City, the quantities and characteristics of the raw materials, as well as productions stored and used by 81 industrial enterprises in the HLW, were acquired. The potential hazard index (PHI) of each enterprise was calculated. The potentially hazardous enterprises (PHI > 0) were classified according to different sub-regions of the HLW, which is illustrated in Figure 3.
Overall, the spatial distribution of potentially hazardous enterprises showed obvious differences (Figure 3). There were 55 potentially hazardous enterprises, accounting for 67.9% of the total enterprises. All of the industrial enterprises were graded based on the value of PHI, among which, 32.1% had no hazard, 45.7% had low hazard, 16.0% had medium hazard, and 9.9% had high hazard. The value of PHI varied greatly among different enterprises, the coefficient of variation of which was 1.23. Since the PHI of all the industrial enterprises in the Houliu River watershed was 0, it could be considered that the Houliu River watershed had no potential hazard. The PHI of enterprises in each sub-region varied greatly. For the enterprises in the Yangchang River watershed, the PHImin was 0.001, the PHImax was 1, and the average value was 0.324. The Maiweng River watershed had a smaller range of PHI than other sub-regions of the HLW, with an average value of 0.454. The mean PHI values of the Maxian River watershed and the surrounding area of the lake were 0.341 and 0.600, respectively. The number of industrial enterprises in the Yangchang River watershed was the most, the averaged PHI of which was the smallest.
The value of PHI is not only related to the quantities of industrial enterprise, but also to the types of enterprises. To investigate the potential hazard of different types of industrial enterprises, the enterprises were divided into eight types. The quantities and values of the cumulative potential hazard index for each type of enterprise were calculated, the results of which were demonstrated in Figure 4. The value of PHI was significantly influenced by the types of enterprises. The cumulative PHI of building material production enterprises was the largest, followed by coal mining and chemical production enterprises. The cumulative PHI of pharmaceutical enterprises was the lowest.

3.2. Vulnerability Index of Drinking Water Sources

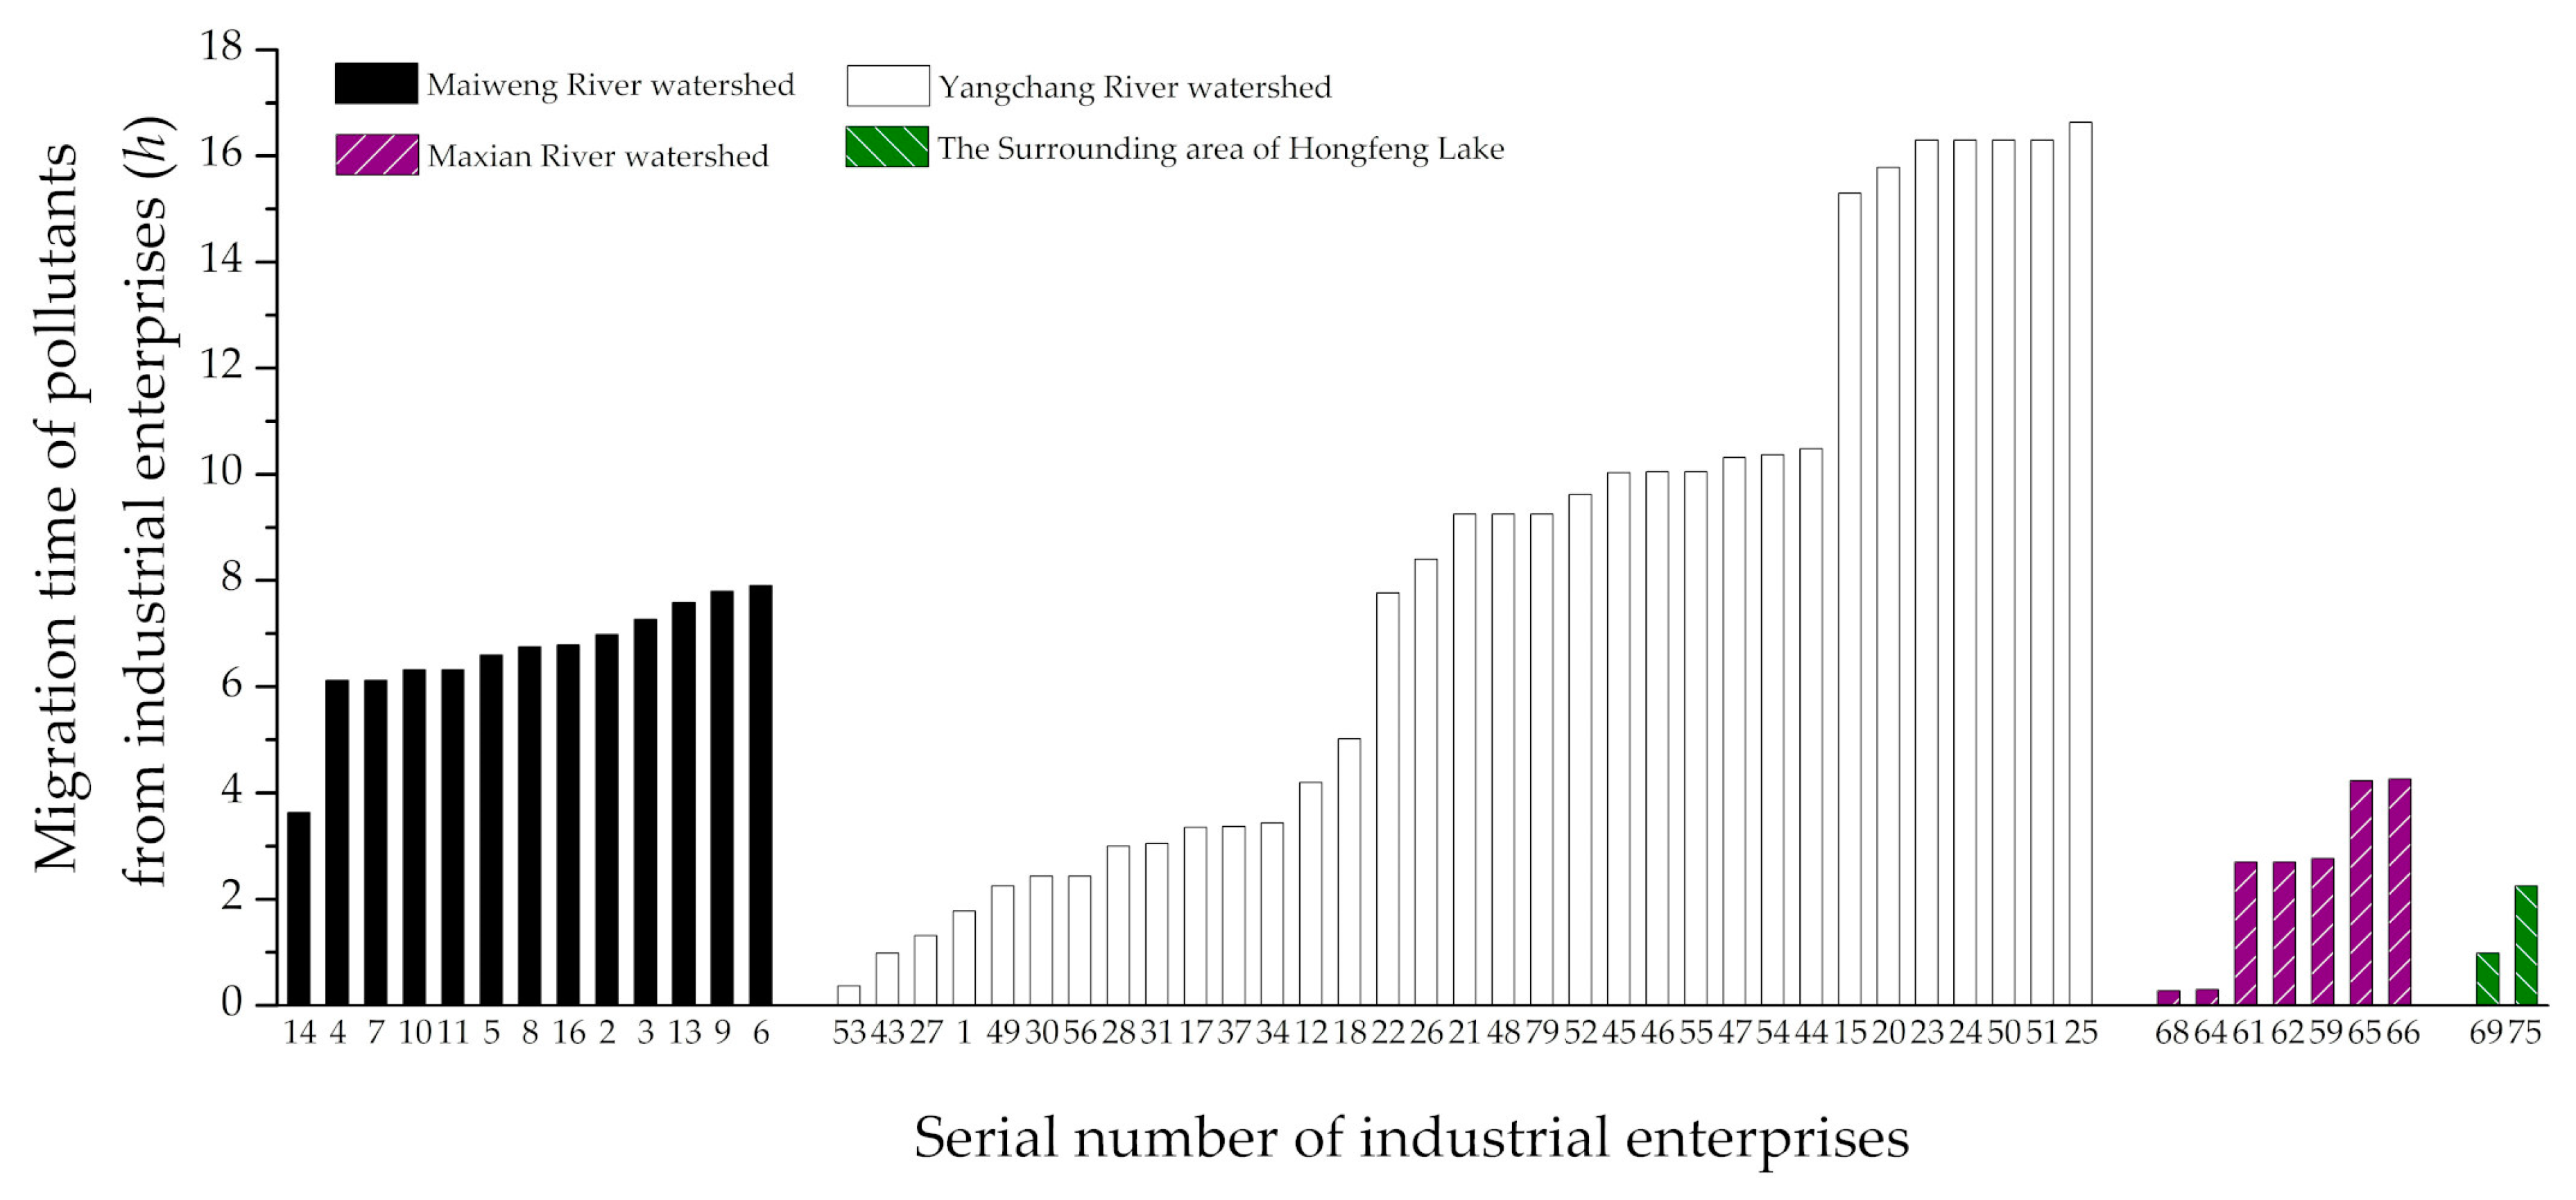
3.2.1. Simulating the Migration Time for Pollutants from Enterprises

Migration Time from the Enterprise to the Hongfeng Lake Inlet
A total of 132 sub-watersheds and reaches of the HLW were divided by the SWAT model, which is shown in Figure 5.
The precipitation series data of the HLW from the years 2000 to 2016 were used to simulate monthly average flow discharge of each reach. Then, the simulated flow discharge was adjusted by using the measured flow data of the hydrological stations in the HLW. The calculated monthly average discharge of each reach from 2000 to 2016 was obtained. Comparing the monthly average discharge of each reach during the flood seasons (June–August) of 2000 to 2016, it was found that the discharge in August 2000 was the largest. Therefore, the monthly average discharge of each reach in August 2000 was selected as the flow data, which is listed in Table 1.
Due to the lack of hydrological data, it was assumed that the migration velocity of the leaking pollutants was equal to the average flow velocity in the hydrological network of the HLW. The time for pollutants migrating from each industrial enterprise to the lake inlet was classified according to the sub-regions, which is presented in Figure 6.
Some enterprises in the Yangchang River watershed had a long migration time, nearly 17 h (Figure 6). The average migration time of the Maiweng River watershed, the Yangchang River watershed, the Maxian River watershed, and the surrounding area of Hongfeng Lake was, respectively, 6.6 h, 8.0 h, 2.5 h and 1.6 h. The average migration time of the Yangchang River watershed was the longest, while the time of the surrounding area of the lake was the shortest. This result corresponded to the spatial distribution of industrial enterprises in the HLW (Figure 1).
Migration Time from the Lake Inlet to the Drinking Water Intake
The main heavy metal pollutant Hg was taken as an example to determine the degradation and diffusion coefficient. Since the degradation process of heavy metals was negligible, the degradation coefficient in this study was considered to be the sedimentation coefficient of heavy metals. The surface area of Hognfeng Lake is large but the water body of this lake is rarely connected with other watersheds so the hydrological condition of this lake is unfavorable of the movement of the pollutants. According to the above, the model comprehensively considered the water flow and diffusion to simulate the migration time. The migration time from the water inlet of Maiweng River to the drinking water intake was more than 100 days, mainly because Maiweng River was in the northwest of Hongfeng Lake. Only a small amount of the pollutants migrated to the drinking water intake against the water flow by diffusion. The migration time for the pollutants from the lake inlet of Yangchang River, Maxian River, and Houliu River to the drinking water intakes was 38, 44 and 42 days, which was quite long. In terms of the risk of early warning and response to burst pollution accidents, it was meaningless for managers to deal with the issue in such a long period. From a safety standpoint, it was inevitable that managers should cope with this problem at first as soon as the leaking pollutants enter the lake. Therefore, in the practical calculation, the migration time of pollutants from enterprises to the lake inlet was used as ti,k in Equation (9).

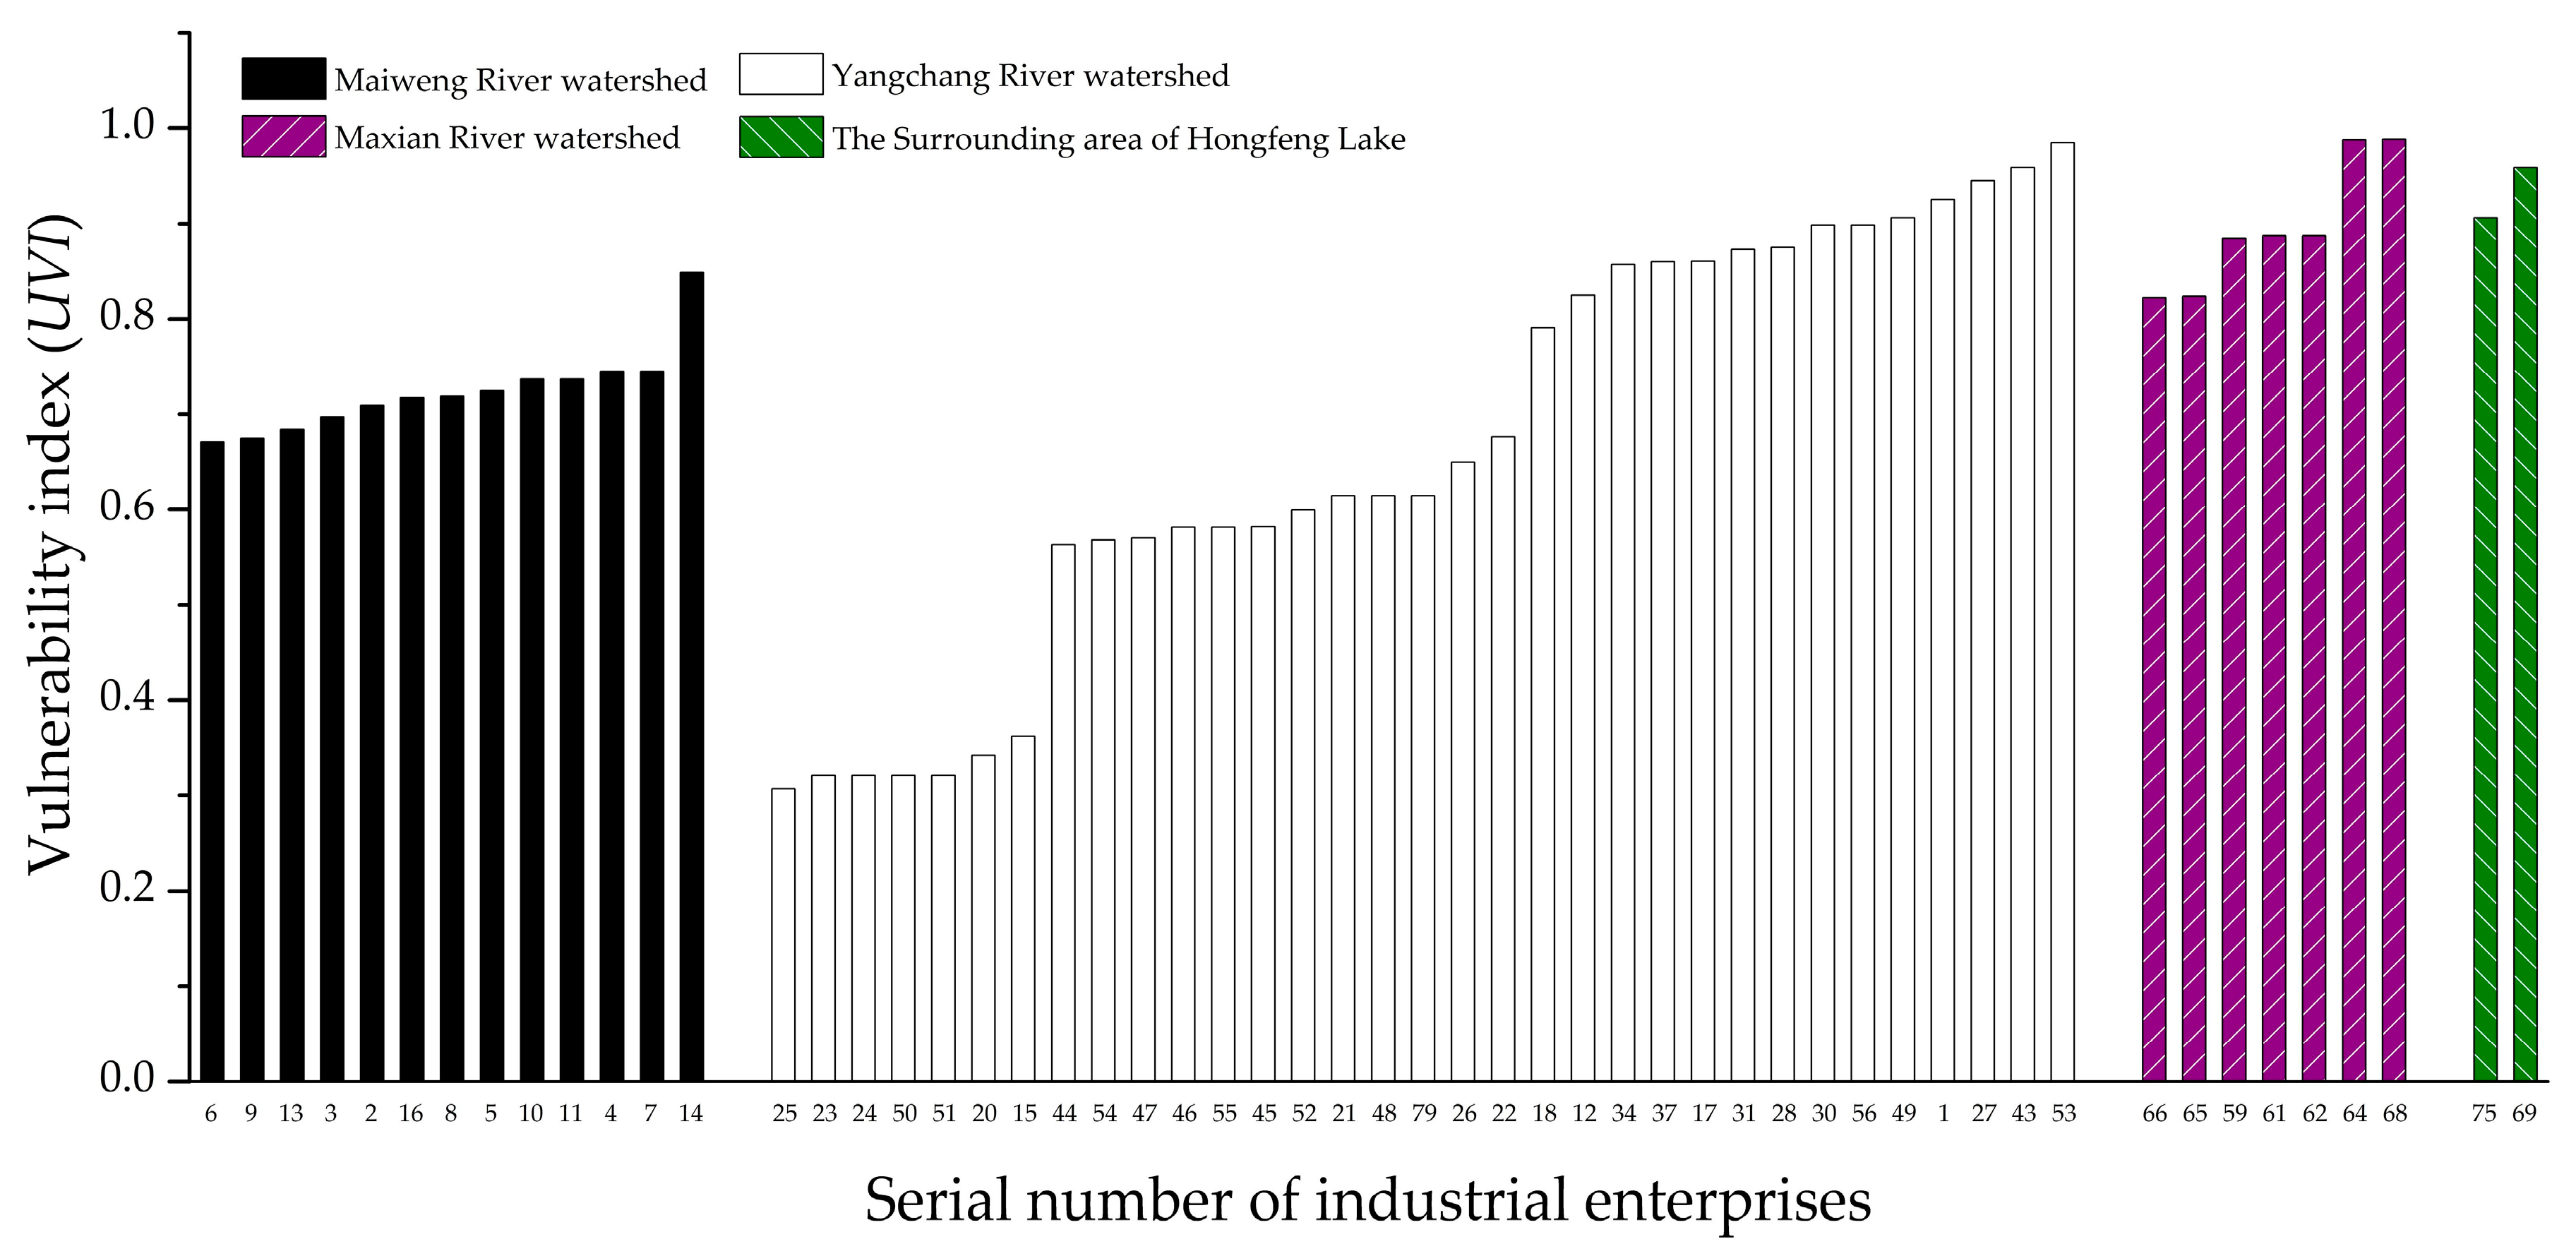
3.2.2. Calculation of Vulnerability Index

For all cases, the value of ti,k was less than 24 h (Figure 6); thus, tmax was set to 24 h in this case study. The information of water withdrawal of drinking water intakes of Hongfeng Lake is presented in Table 2, and the vulnerability index (UVI) for each enterprise of Hongfeng Lake is illustrated in Figure 7.
The value of UVI in Hongfeng Lake area was different from that of the potential hazard index (Figure 7). The average UVI value of Maiweng River, Maxian River, and the surrounding area of the lake was 0.72, 0.90 and 0.93, respectively. The UVI of enterprises in the Yangchang River watershed varied greatly, with an average of 0.67.

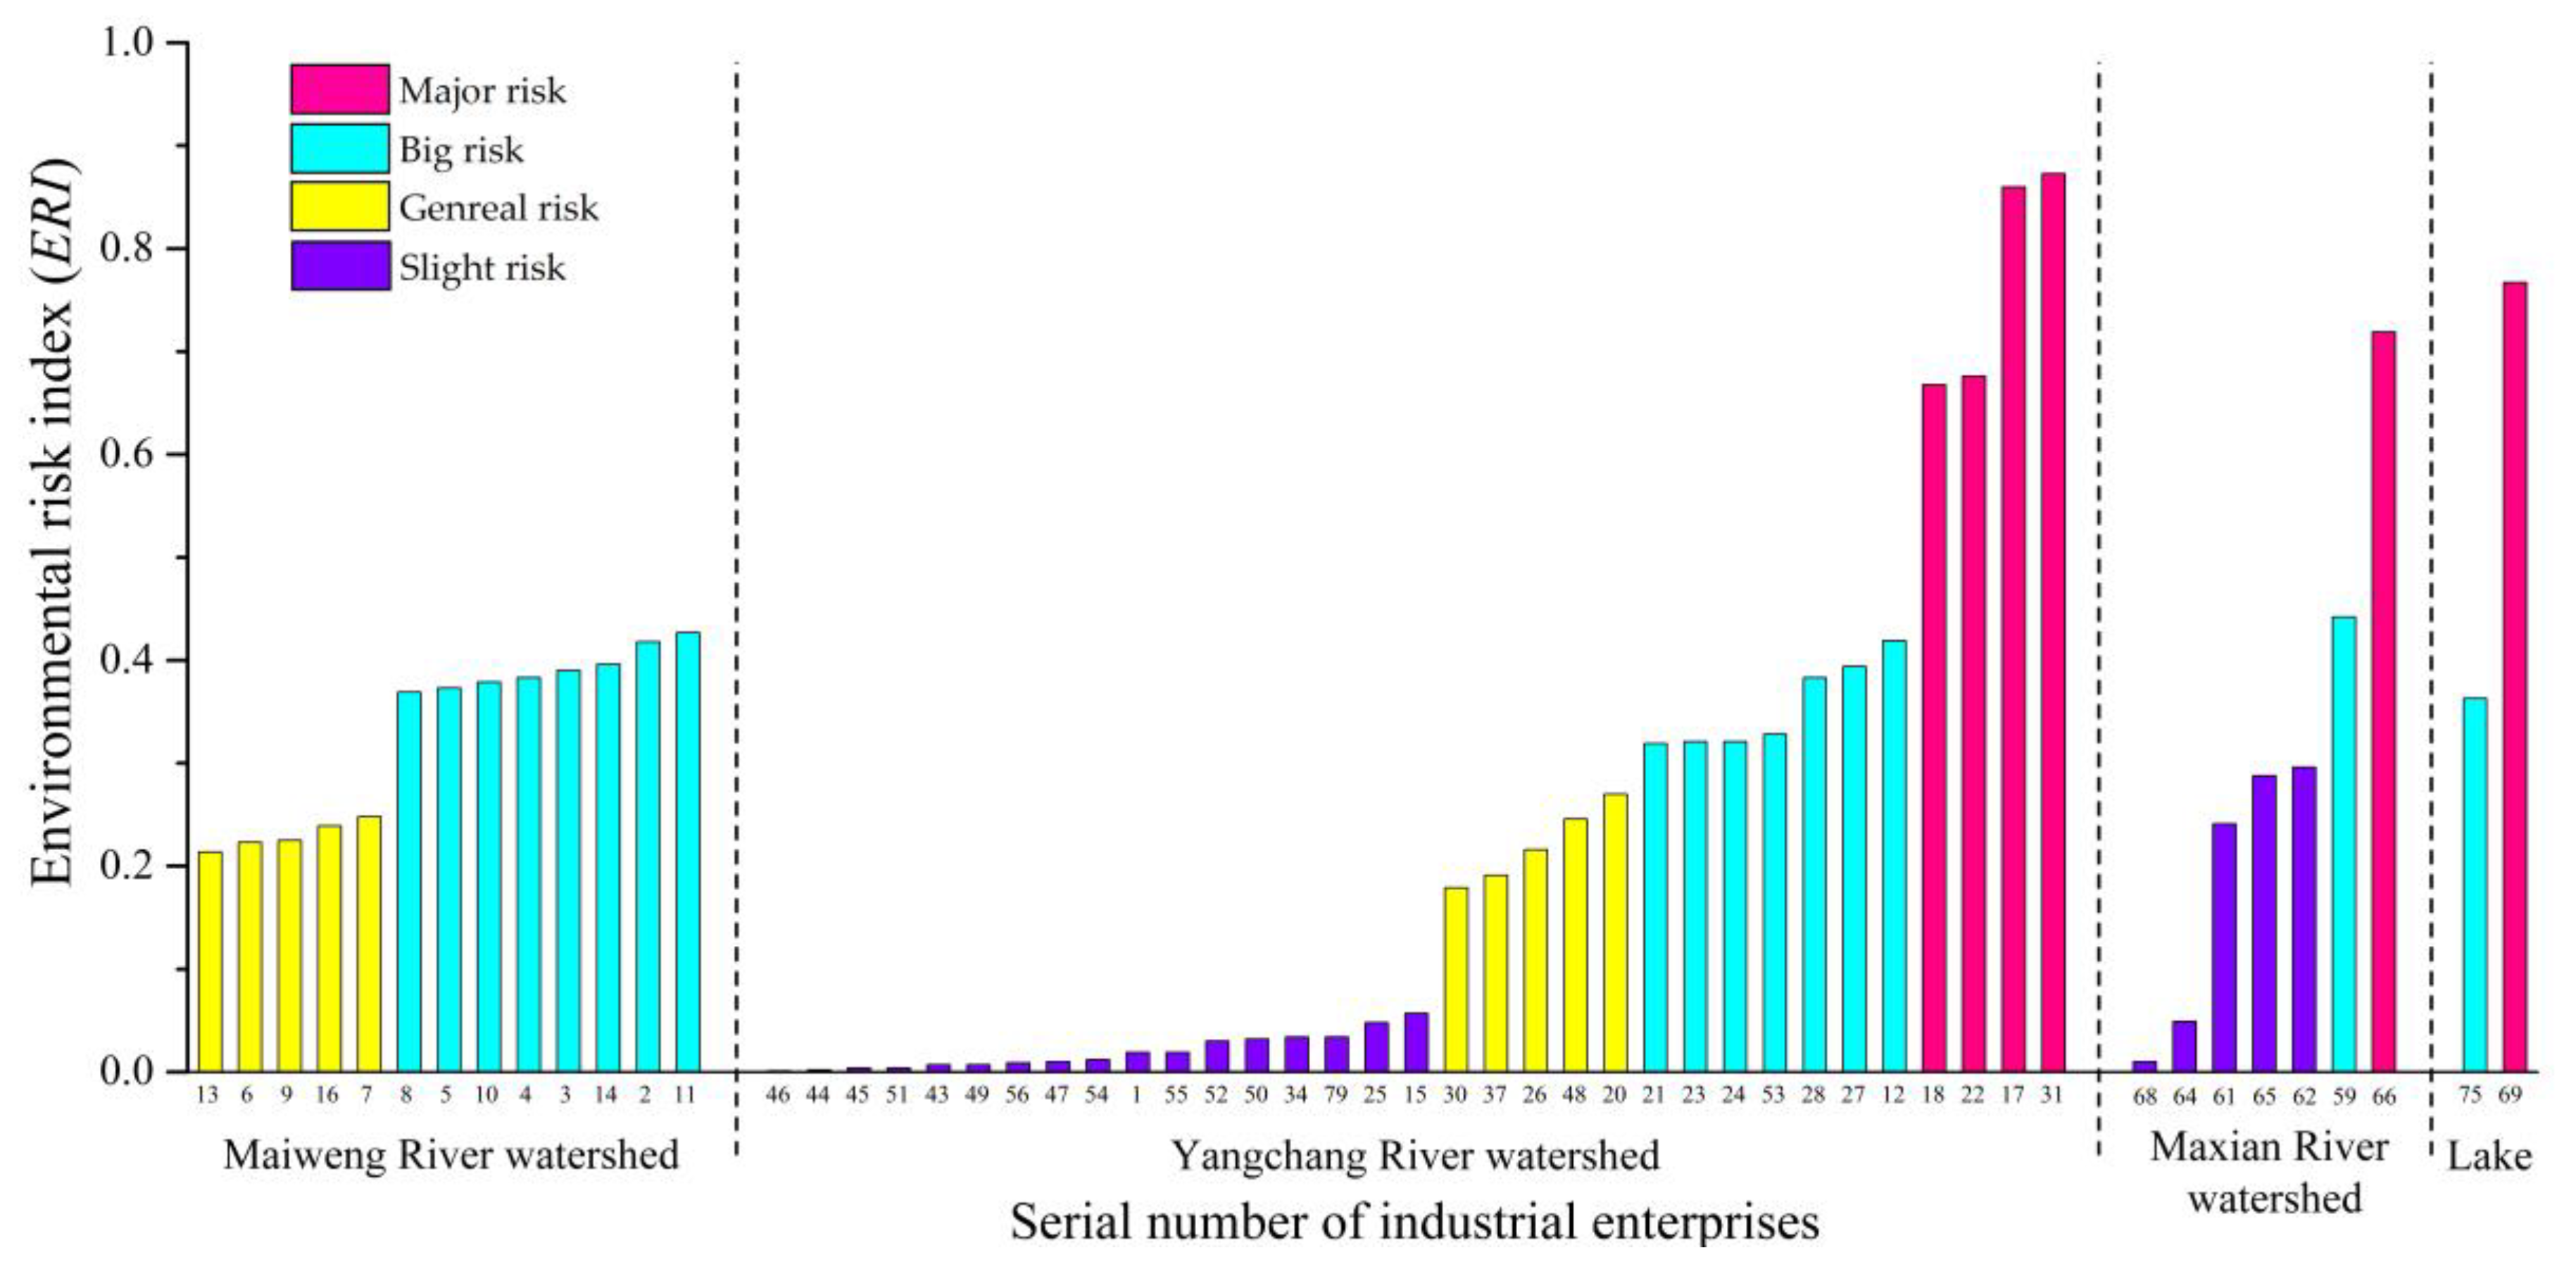
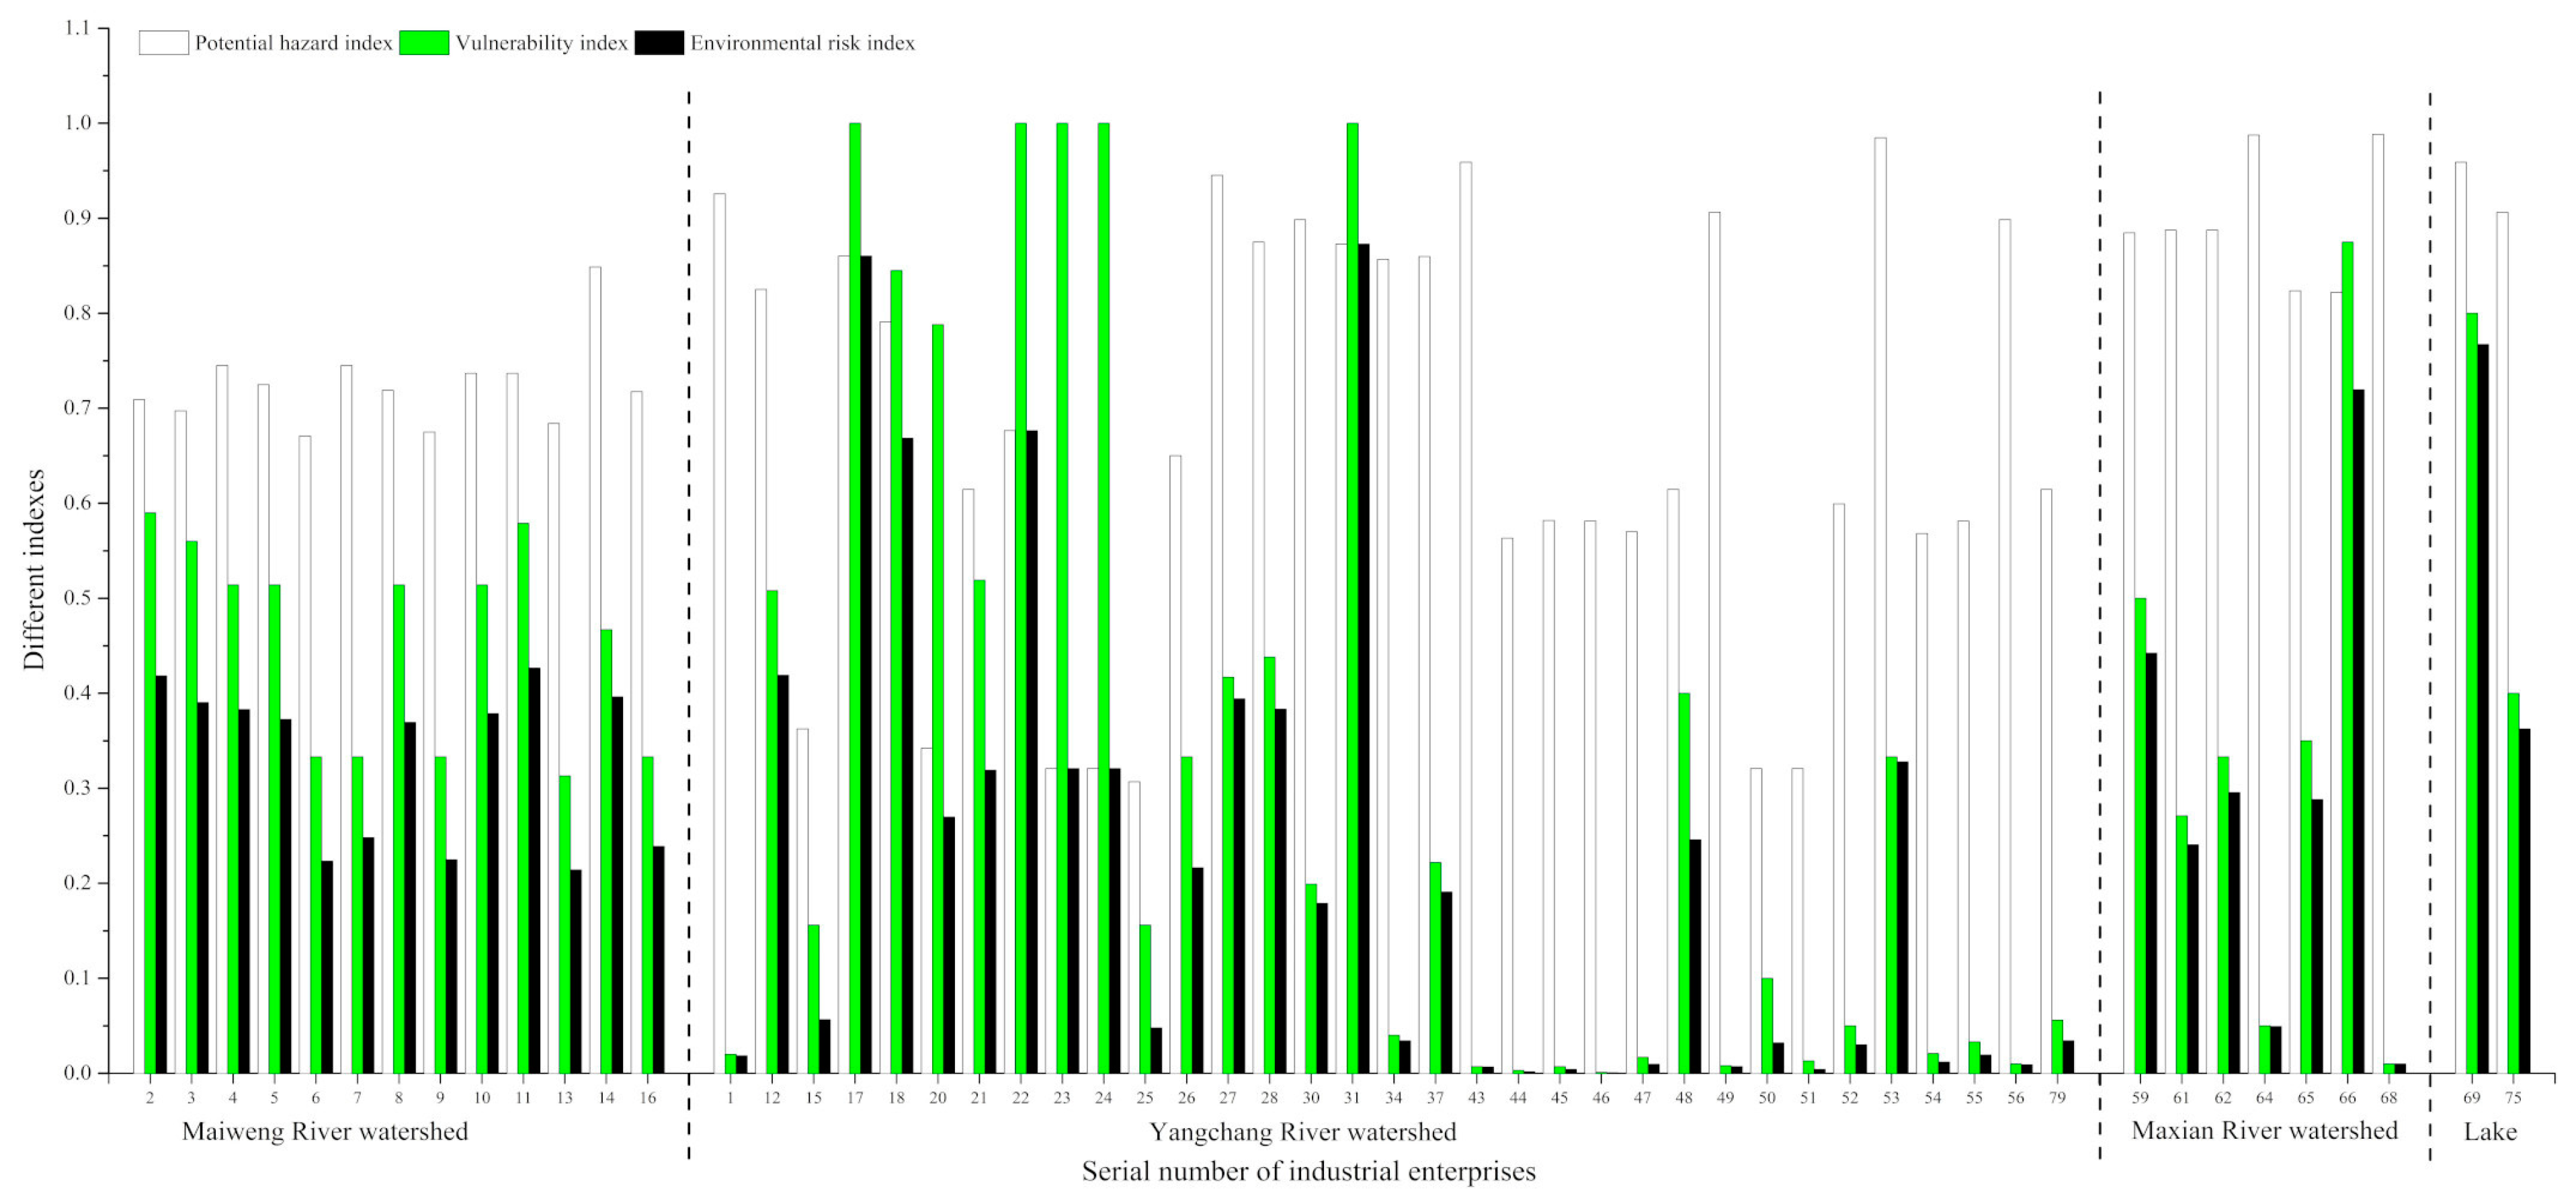
3.3. Integrated Environmental Risk Index

According to the results of the potential hazard index (PHI) and the vulnerability index (UVI), the integrated environmental risk index (ERI) of each industrial enterprise in the HLW was calculated. In addition, the industrial enterprises were divided into different risk grades according to the value of ERI. These results are shown in Figure 8 and Table 3.
The industrial enterprises were classified according to the sub-region in which they were located. Overall, the range of the value of ERI varied greatly. The variation of ERI of each sub-region was great. The value of ERI of each enterprise in the Yangchang River watershed varied quite differently. The average ERI of the Maiweng River watershed was 0.33; the Yangchang River watershed was 0.21; the Maxian River watershed was 0.29; and the surrounding area of Hongfeng Lake was 0.57. The environmental risk index was classified according to different types of enterprises, and the quantities of different types of industrial enterprises were counted, which are illustrated in Figure 9.
It was found that the ERI value of the building material, coal mining, and chemical production enterprises were larger than that of other enterprises. The results indicate that the value of ERI was related to the type and the quantity of enterprises. For each type of enterprise, the average ERI value of all the enterprises was calculated. The maximum mean ERI value of the types of enterprises were metal smelting (0.85) and manufacturing (0.77), while the minimum mean ERI value existed in the types of food production and pharmaceutical.

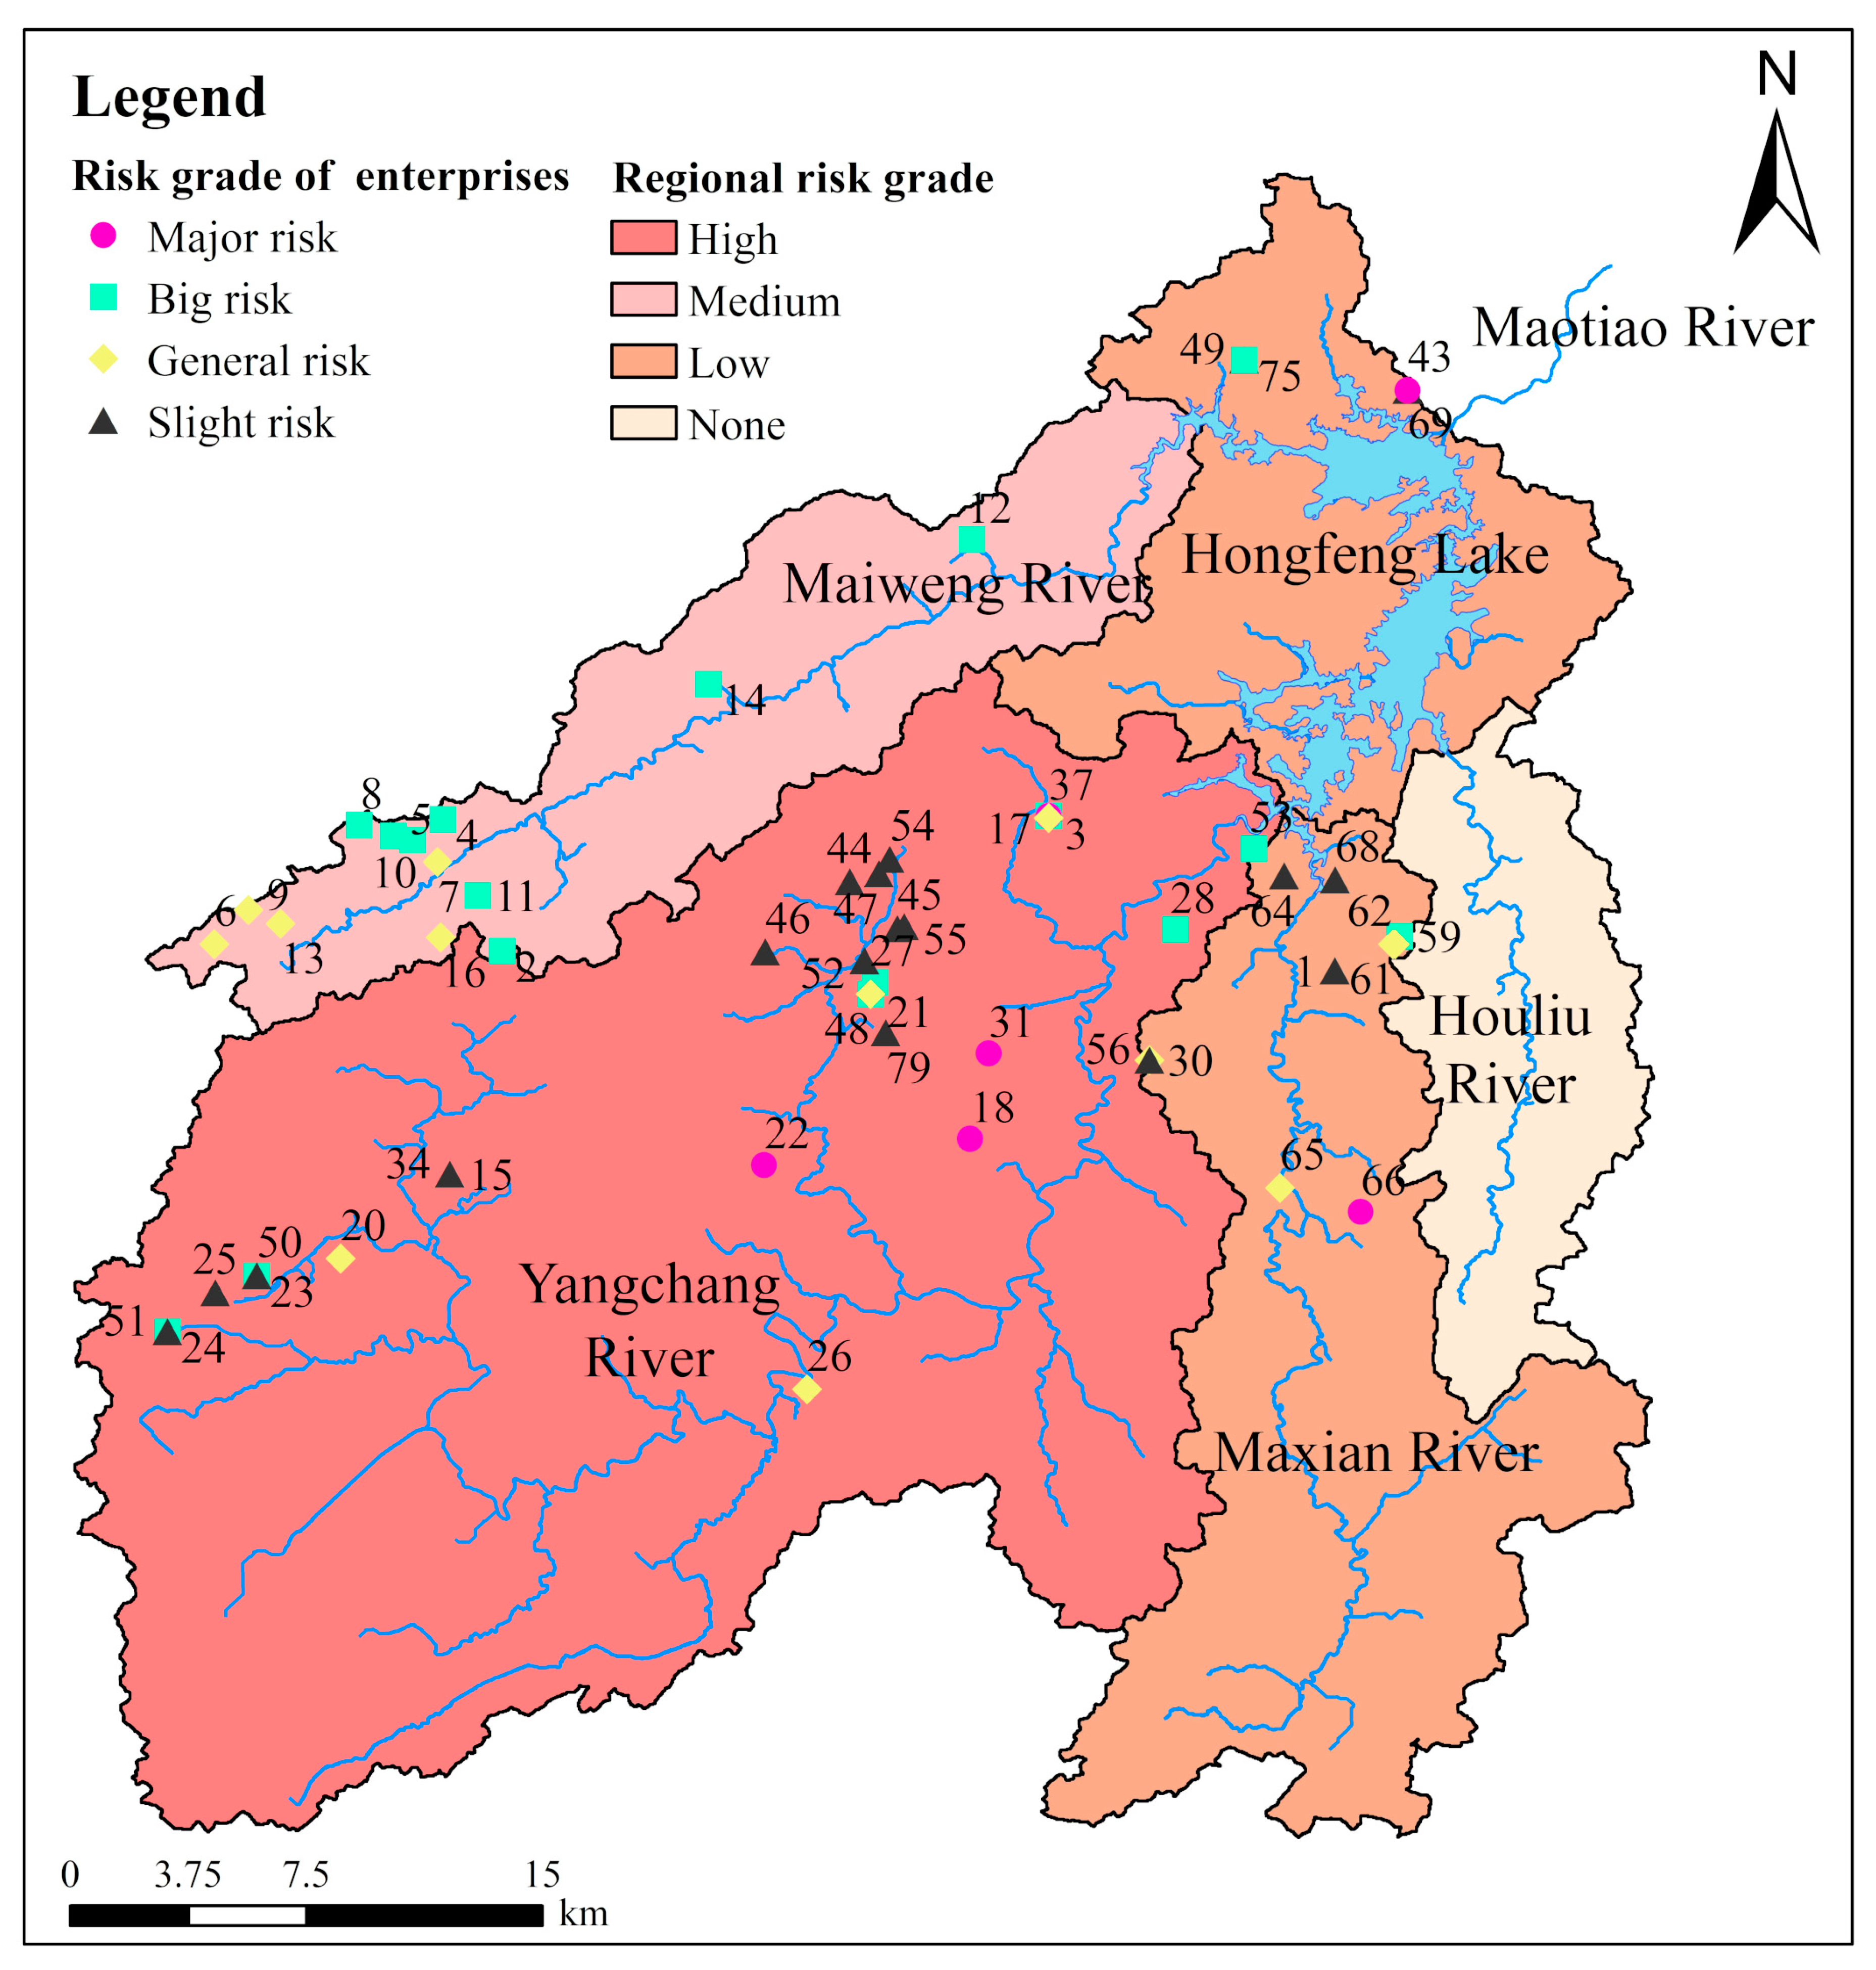
3.4. Classification of Regional Environmental Risk Level

In order to understand the environmental risk level of each sub-region, the values of ERI for all enterprises in each sub-region were accumulated to get the regional environmental risk index (ERIs), which is presented in Table 4.
The risk level of the Maiweng River watershed was medium. Although many coal mining enterprises were established around the tributary of the Maiweng River watershed which had potential hazard because of no sewage treatment measures, most of the leakage pollutants continued floating towards north along with the water flow to the Maotiao River after entering the lake and then migrated out of Hongfeng Lake. Only a small amount of the leakage migrated to the drinking water intake by diffusion. The risk level of the Yangchang River watershed was high. The industrial enterprises in Yangchang River watershed were relatively developed, which were densely distributed on both sides of Yangchang River, such as chemical production, metal smelting, building material production, industrial production, and other types of enterprises The Maxian River watershed was a low risk region, with an ERIs value of 2.05.
The number of industrial enterprises distributed in the Maxian River watershed was not many, and there were not many hazardous substances. The environmental risk level of the surrounding area of the lake was low, which had only two risky enterprises. After the sewage flowed into Hongfeng Lake, it flowed out of Hongfeng Lake from Maotiao River, instead of flowing through the drinking water intake. Due to lack of potentially hazardous enterprises in the Houliu River watershed, the region had no risk.
A hazard and risk grade map for industrial enterprises and sub-regions of the HLW was made based on the ERI and ERIs, which is demonstrated in Figure 10.
There were 6 major risk enterprises, 17 big risk enterprises, 13 general risk enterprises and 19 slight risk enterprises. Most industrial enterprises were general and slight. The number and risk grades of industrial enterprises were closely related to the risk grade of the sub-region.

4. Discussion

The coupling model was used to quantitatively conduct an environmental risk assessment that was consistent with the field survey results. From the drinking water crisis in the Taihu Lake watershed in 2007, chemical industry was regarded as the main water risk source [40]. Besides, Liu et al. conducted an environmental risk assessment in the Laoguan River Basin and found that heavy metal mine tailing ponds provided the majority of risk sources [16]. Liu et al. found that the mine tailing ponds had significant detriment in the Guangting Reservoir watershed within Zhangjiakou [41]. Yao et al. analyzed the surface water pollution accidents from 1985 to 2012 and found that machinery chemical production (64.69%) was the main risk source [6]. Wang et al. studied the heavy metals in surficial sediment of the Hongfeng Lake watershed (HLW) and found that the highest concentration in the HLW was Pb which may be due to the traffic volume. The ecological evaluation of heavy metals in the sediments of the HLW conducted by Wang et al. indicated that coal combustion, coal-fired power plant and chemical industries were the main pollution sources in the HLW [27]. Mining and chemical industrial enterprises were the main risk sources for the HLW [14]. Moreover, Cao et al. investigated the Chinese environmental events from 2006 to 2018 [1]. The results indicated that hazardous chemical was the main type of risk sources and chemical manufacturing was the main type of sector. In this study, we calculated the potential hazard index (PHI) and integrated environmental risk index (ERI) for a single enterprise of different types of enterprises. The potential hazard index of building materials, coal mining, and chemical production was 6.14, 6.07 and 4.41, which were the main risk sources. The environmental risk index of the smelting, manufacturing, and coal mining was 0.85, 0.77 and 0.47, which had significant influence on the environmental risk level of the HLW. The potential hazard index, vulnerability index, and environmental risk index varied greatly in each sub-region. The potential hazard index, vulnerability index, and environmental risk index varied greatly in each sub-region. To investigate the relationship between the three indexes for each industrial enterprise, the indexes are presented in Figure 11.
For each industrial enterprise (Figure 11), the value of vulnerability index was in a threshold between the value of potential hazard index (higher) and the integrated environmental risk index (lower). If only potential hazard of risk sources was considered, the environmental risk index would be too large due to the neglect of the vulnerability of risk receptors (drinking water intakes), which would lead to an increase in the cost of disposing the pollution incident. In response to accidental pollution incidents, each emergency of environmental risk is corresponded with a treatment, and the more serious the environmental risk level is, the more cost is needed. As the water itself has self-purification ability and the distance from the risk source to the drinking water intake point is too long, the vulnerability of the receptor is of great significance for proper evaluation on the risk of the water source. The trend of the vulnerability index has more similarities with that of the environmental risk index than the potential risk index, which indicates that the vulnerability has a greater impact on the integrated environmental risk level.
Yao et al. assessed the risk of upper-middle reaches of the Luanhe River Basin in sudden water pollution incidents based on control units of water function areas [2]. They evaluated the hazard and vulnerability of the Luanhe River Basin and then obtained the environmental risk value. Although they used the PSR model, they calculated hazard, vulnerability, and risk index to represent the environmental risk, which indicated that our indicator selection was reasonable. A coupling model was created to evaluate the environmental risks of industrial enterprises in lake-type drinking water sources in this study. The migration process of the pollutants was thoroughly simulated.
In addition, the environmental risk rating was more specific. Tian et al. used the analytic hierarchy process (AHP) to evaluate the environmental risks of industrial enterprises in drinking water sources in the HLW [11]. Due to the different methods, the calculation results of Tian were larger than that in this study. The results of the analytic hierarchy process were largely influenced by the weights taken. The weight of each indicator was scored by consulting experts, which may provide inaccurate assessment results of the vulnerability of the drinking water intake. Compared with the analytic hierarchy process (AHP), the coupling model was more quantifiable, concise, convenient, and objective. In both studies, the Yangchang River watershed had the highest risk value, followed by the Maiweng River watershed. The Maxian River watershed and the surrounding area of Hongfeng Lake was relative low. The relative risk model was used with the multi-index comprehensive evaluation method, as well as some other methods, to evaluate the risk sources and risk receptors [15]. Due to the excessive number of indicators, some indicators were difficult to make precise. The interrelation between risk sources and receptors was unidentified within a single assessing region, which may cause double counting to affect the accuracy of the results. Compared with the fuzzy model and interval-evidential reasoning approach, the coupling model was more concise, required fewer data, and the calculation was simple and rapid, which was more suitable for regional environmental risk assessment [17].
Although this coupling model used a lake-type drinking water source as a case in this study, it was also applicable to river-type drinking water sources. The coupling model has a good compatibility for environmental risk assessment of accidental pollution incidents of industrial enterprises on the scale of watersheds or large regions.

5. Conclusions

This study analyzed the potential hazard of industrial enterprises and the vulnerability of drinking water sources to conduct a quantitative environmental risk assessment of 81 industrial enterprises in the HLW, and classified the grade of environmental risk of different sub-regions of the HLW by the coupling model.
The evaluation results based on the types and quantities of hazardous substances stored in enterprises indicated that there were 55 potentially hazardous enterprises in the HLW, including 5 high hazard enterprises, 13 medium hazard enterprises, and 37 low hazard enterprises—with 26 no hazard enterprises. Building material production and coal mining were the dominant types of enterprises to threaten the safety of drinking water intakes in the HLW.
The UVI was affected by the migration time and population served by the water intake. The results of the vulnerability assessment showed that the vulnerability index of the Yangchang River watershed was the largest. Besides, it is essential to consider the vulnerability assessment when conducting an environmental risk assessment due to the different sensitivities of risk receptors to accidental pollution events. The environmental risk assessment showed that each industrial enterprise varied considerably in ERI. High-risk industrial enterprises should be the focus of risk management, and regular safety inspections and risk analysis should be conducted. Building material production and coal mining enterprises played an important role in increasing the environmental risk. The risk grade of the Yangchang River and Maiweng River watersheds was high and medium, respectively. The risk level of both the Maxian River watershed and the surrounding area of Hongfeng lake were low.
For accidental water pollution incidents in the HLW, building a three-level drinking water source prevention system of “risk source–water body connection–water intake” is the prerequisite of conducting a regional environmental risk prevention and control program.

Author Contributions

Conceptualization, methodology, software, formal analysis, investigation, resources, data curation, writing—original draft preparation: P.T. and T.W. Writing—review and editing: H.W., T.Y., W.Z., F.J., and Z.Z.; Project administration and funding acquisition: T.W.

Funding

This research was jointly funded by the Natural Science Foundation of China Project (41907061, 41701323), the Fundamental Research Funds for the Central Universities (CCNU18XJ048, CCNU18QN003), and the CRSRI Open Research Program (CKWV2019761/KY).

Acknowledgments

We would like to thank the National Natural Science Foundation of China Project (41907061, 41701323), Central China Normal University (CCNU18XJ048, CCNU18QN003), and the Changjiang River Scientific Research Institute (CKWV2019761/KY), and for the opportunity to contribute to this project and for providing the financial support to carry out this study. We thank Jessica Thomas for the help of reviewing the English language of this paper. The authors are grateful to the anonymous reviewers for their constructive criticism and comments.

Conflicts of Interest

The authors declare no conflicts of interest.

Abbreviations

HLWHongfeng Lake watershed
YRWYangchang River watershed
MRW1Maiweng River watershed
MRW2Maxian River watershed
PHIPotential hazard index
PHISCumulative potential hazard index of a sub-region
UVIVulnerability index of the urban area
AVIVulnerability index of the agriculture area
ERIEnvironmental risk index
ERISCumulative environmental risk index of a sub-region
IVIVulnerability index of the industrial area
DIAi,jThe i-th agricultural water intake distance index affected by j enterprise
DIIi,jThe i-th industrial water intake distance index affected by j enterprise
pmaxThe population served by all the drinking water intakes
piThe population served by the i-th drinking water intake
tmaxThe leak duration reasonable estimation
ti,jThe migration time of leaking pollutants to the drinking water intake of the j-th enterprise
wfuThe weighting factor of the urban area
wfaThe weighting factor of the agricultural area
wfiThe weighting factor of the industrial area
Mi,jNumber of dangerous in type j owned by the i-th enterprise
LiThe length of the i-th reach
D0The distance from the leak point to the nearest reach
v0The average velocity of the leakage flowing into the nearest reach
viThe average velocity of the i-th reach

References

  1. Cao, G.; Yang, L.; Liu, L.; Ma, Z.; Wang, J.J. Environmental incidents in China: Lessons from 2006 to 2015. Sci. Total Environ. 2018, 633, 1165–1172. [Google Scholar] [CrossRef] [Green Version]
  2. Xiao, Y.; Huang, S.; Zhou, J.; Kong, F.; Liu, M.; Li, Y. Risk Assessment of Upper-Middle Reaches of Luanhe River Basin in Sudden Water Pollution Incidents Based on Control Units of Water Function Areas. Water 2018, 10, 1268. [Google Scholar] [CrossRef]
  3. Chen, M.; Yang, L. A Case Study of Major Emergencies in 2016. Environ. Prot. 2017, 45, 57–59. [Google Scholar]
  4. Wiens, J.A.; Parker, K.R. Analyzing the effects of accidental environmental impacts: Approaches and assumptions. Ecol. Appl. 1995, 5, 1069–1083. [Google Scholar] [CrossRef]
  5. Han, X.; Huang, Y. Statistical analysis of sudden water pollution accidents. Water Resour. Prot. 2010, 26, 84–86. [Google Scholar]
  6. Yao, H.; Zhang, T.; Liu, B.; Lu, F.; Fang, S.; You, Z. Analysis of surface water pollution accidents in China: Characteristics and lessons for risk management. Environ. Manag. 2016, 57, 868–878. [Google Scholar] [CrossRef] [PubMed]
  7. Wu, L.; Qi, T.; Li, D.; Yang, H.; Liu, G.; Ma, X.Y.; Gao, J.E. Current status, problems and control strategies of water resources pollution in China. Water Policy 2015, 17, 423–440. [Google Scholar] [CrossRef]
  8. Li, C.; Sun, L.; Jia, J.; Cai, Y.; Wang, X. Risk assessment of water pollution sources based on an integrated k-means clustering and set pair analysis method in the region of Shiyan, China. Sci. Total Environ. 2016, 557, 307–316. [Google Scholar] [CrossRef]
  9. Depledge, M.H.; Fossi, M.C. The role of biomarkers in environmental assessment (2). Invertebrates. Ecotoxicology 1994, 3, 161–172. [Google Scholar] [CrossRef]
  10. Salvi, O.; Debray, B. A global view on ARAMIS, a risk assessment methodology for industries in the framework of the SEVESO II directive. J. Hazard. Mater. 2006, 130, 187–199. [Google Scholar] [CrossRef]
  11. Tian, P.; Fu, Q.; Zheng, B.; Wang, G.; Yao, X. Environmental Risk Assessment of Industrial Enterprises in Drinking Water Sources of Hongfeng Lake. Res. Environ. Sci. 2013, 26, 787–792. [Google Scholar]
  12. Peng, J.; Song, Y.; Yuan, P.; Xiao, S.; Han, L. A novel identification method of the environmental risk sources for surface water pollution accidents in chemical industrial parks. J. Environ. Sci. 2013, 25, 1441–1449. [Google Scholar] [CrossRef]
  13. Meng, X.; Zhang, Y.; Yu, X.; Bai, J.; Chai, Y.; Li, Y. Regional environmental risk assessment for the Nanjing Chemical Industry Park: An analysis based on information-diffusion theory. Stoch. Environ. Res. Risk Assess. 2014, 28, 2217–2233. [Google Scholar] [CrossRef]
  14. Wang, Y.; Yin, K.; Lin, G.; Peng, S. Environmental risk assessment for the urban drinking water sources: Methodology and case study. J. Saf. Environ. 2014, 14, 316–320. [Google Scholar]
  15. Zhang, K.; Liu, R.; Zhang, Z.; Hu, L.; Jia, Z.; Zhuo, Y. A Method of Environmental Risk Assessment for Abrupt Water Pollution Accidents in River Basin. J. Basic Sci. Eng. 2014, 22, 675–684. [Google Scholar]
  16. Liu, R.Z.; Zhang, K.; Zhang, Z.J.; Borthwick, A.G. Watershed-Scale Environmental Risk Assessment of Accidental Water Pollution: The Case of Laoguan River, China. J. Environ. Inform. 2018, 31, 87–96. [Google Scholar] [CrossRef]
  17. Gu, Q.; Li, J.; Deng, J.; Lin, Y.; Ma, L.; Wu, C.; Hong, Y. Eco-environmental vulnerability assessment for large drinking water resource: A case study of Qiandao Lake Area, China. Front. Earth Sci. 2015, 9, 578–589. [Google Scholar] [CrossRef]
  18. Luo, H.; Jiang, Y.; Luo, J.; Xie, R.; Wang, H. Water environmental risk assessment of drinking water source area of Taizhou Third Waterworks. J. Hohai Univ. (Nat. Sci.) 2015, 43, 114–120. [Google Scholar]
  19. Xing, Y.; Wang, X.; Ke, X.; Wu, T.; Teng, W. Method of regional acute environmental risk assessment based on risk field. China Environ. Sci. 2016, 36, 1268–1274. [Google Scholar]
  20. Jia, Q.; Cao, G.; Yu, F.; Zhou, W. Environmental Risk Assessment of Yangtze River Basin Emergent Water Pollution Incident Based on Environmental Risk System Theory. Saf. Environ. Eng. 2017, 24, 84–88. [Google Scholar]
  21. Jiang, C.; Wu, D.; Hu, J.; Liu, F.; Huang, X.; Li, C.; Jin, M. Application of chemical fractionation and X-ray powder diffraction to study phosphorus speciation in sediments from Lake Hongfeng, China. Chin. Sci. Bull. 2011, 56, 2098–2108. [Google Scholar] [CrossRef] [Green Version]
  22. Feng, X.; Meng, B.; Yan, H.; Fu, X.; Yao, H.; Shang, L. Biogeochemical Cycle of Mercury in Reservoir Systems in Wujiang River Basin, Southwest China; Springer: Singapore, 2018; pp. 201–302. [Google Scholar]
  23. Chen, Q.; Chen, J.; Wang, J.; Guo, J.; Jin, Z.; Yu, P.; Ma, Z. In situ, high-resolution evidence of phosphorus release from sediments controlled by the reductive dissolution of iron-bound phosphorus in a deep reservoir, southwestern China. Sci. Total Environ. 2019, 666, 39–45. [Google Scholar] [CrossRef] [PubMed]
  24. Wu, B.; Wang, G.; Wu, J.; Fu, Q.; Liu, C. Sources of heavy metals in surface sediments and an ecological risk assessment from two adjacent plateau reservoirs. PLoS ONE 2014, 9, e102101. [Google Scholar] [CrossRef] [PubMed]
  25. Cheng, H.; Li, M.; Zhao, C.; Yang, K.; Li, K.; Peng, M.; Cui, Y. Concentrations of toxic metals and ecological risk assessment for sediments of major freshwater lakes in China. J. Geochem. Explor. 2015, 157, 15–26. [Google Scholar] [CrossRef]
  26. Wang, J.; Chen, J.; Ding, S.; Guo, J.; Christopher, D.; Dai, Z.; Yang, H. Effects of seasonal hypoxia on the release of phosphorus from sediments in deep-water ecosystem: A case study in Hongfeng Reservoir, Southwest China. Environ. Pollut. 2016, 219, 858–865. [Google Scholar] [CrossRef] [PubMed]
  27. Wang, G.; Hu, X.; Zhu, Y.; Jiang, H.; Wang, H. Historical accumulation and ecological risk assessment of heavy metals in sediments of a drinking water lake. Environ. Sci. Pollut. Res. 2018, 25, 24882–24894. [Google Scholar] [CrossRef] [PubMed]
  28. Holla, K. Lessons learned from the implementation of the Seveso III Directive in the Slovak Republic. Wit Trans. Built Environ. 2018, 174, 25–31. [Google Scholar]
  29. Fu, L.; Hu, J.; Tian, L.; Huang, X.; Luo, J.; Li, L. Distribution, fraction and risk assessment of vanadium in surface sediments from a Chinese karstic lake: A case study of Hongfeng Lake. Int. J. Environ. Pollut. 2014, 56, 28–47. [Google Scholar] [CrossRef]
  30. Zhu, Y.; Zhang, R.; Wu, F.; Qu, X.; Xie, F.; Fu, Z. Phosphorus fractions and bioavailability in relation to particle size characteristics in sediments from Lake Hongfeng, Southwest China. Environ. Earth Sci. 2013, 68, 1041–1052. [Google Scholar] [CrossRef]
  31. Zheng, J.; Wu, F.; Yamada, M.; Liao, H.; Liu, C.; Wan, G. Global fallout Pu recorded in lacustrine sediments in Lake Hongfeng, SW China. Environ. Pollut. 2008, 152, 314–321. [Google Scholar] [CrossRef]
  32. Wu, F.; Wang, L.; Zhang, R.; Li, W.; Liao, H. Characterization of dissolved organic matter fractions from Lake Hongfeng, Southwestern China Plateau. J. Environ. Sci. 2009, 21, 581–588. [Google Scholar]
  33. Zhou, Z.; Song, L.; Chen, H.; Teng, Y.; Li, J.; Chen, M. Environmental risk assessment based on an improved Seveso III Directive for industrial chemicals: A case study of Jinjiang watershed in Quanzhou. China Environ. Sci. 2012, 32, 1715–1721. [Google Scholar]
  34. Papazoglou, I.A.; Nivolianitou, Z.S.; Bonanos, G.S. Land use planning policies stemming from the implementation of the SEVESO-II Directive in the EU. J. Hazard. Mater. 1998, 61, 345–353. [Google Scholar] [CrossRef]
  35. Wood, M.H.; Fabbri, L.; Struckl, M. Writing Seveso II safety reports: New EU guidance reflecting 5 years’ experience with the Directive. J. Hazard. Mater. 2008, 157, 230–236. [Google Scholar] [CrossRef] [PubMed]
  36. O’Mahony, M.T.; Doolan, D.; O’Sullivan, A.; Hession, M. Emergency planning and the Control of Major Accident Hazards (COMAH/Seveso II) Directive: An approach to determine the public safety zone for toxic cloud releases. J. Hazard. Mater. 2008, 154, 355–365. [Google Scholar] [CrossRef] [PubMed]
  37. Sikorova, K.; Bernatik, A.; Lunghi, E.; Fabiano, B. Lessons learned from environmental risk assessment within the framework of Seveso Directive in Czech Republic and Italy. J. Loss Prev. Process Ind. 2017, 49, 47–60. [Google Scholar] [CrossRef]
  38. Ren, S.; Chen, M.; Ren, Y.; Huang, J.; Wang, J.; Li, J. Assessment of Industrial Hazard Based on SEVESO III Directive. Environ. Sci. Technol. 2013, 6, 157–161. [Google Scholar]
  39. Zolghadr, M.; Hashemi, M.R.; Zomorodian, S.M.A. Assessment of mike21 model in dam and dike-break simulation. Iranian Journal of Science and Technology. Trans. B Eng. 2011, 35, 247–262. [Google Scholar]
  40. Yuan, F.; Wei, Y.; Gao, J.; Chen, W. Water crisis, environmental regulations and location dynamics of pollution-intensive industries in China: A study of the Taihu Lake watershed. J. Clean. Prod. 2019, 216, 311–322. [Google Scholar] [CrossRef]
  41. Liu, R.; Liu, J.; Zhang, Z.; Borthwick, A.; Zhang, K. Accidental Water Pollution Risk Analysis of Mine Tailings Ponds in Guanting Reservoir Watershed, Zhangjiakou City, China. Int. J. Environ. Res. Public Health 2015, 12, 15269–15284. [Google Scholar] [CrossRef] [Green Version]
Figure 1. The location of the Hongfeng Lake watershed (HLW).
Sustainability 11 05403 g001
Figure 2. A coupling model for environmental risk assessment of accidental pollution incidents in a drinking water source area.
Sustainability 11 05403 g002
Figure 3. Potential hazard index of industrial enterprises in different sub-regions of the Hongfeng Lake watershed.
Sustainability 11 05403 g003
Figure 4. The cumulative potential hazard index of different types of hazardous industrial enterprises.
Sustainability 11 05403 g004
Figure 5. The division of small catchments and reaches of the Hongfeng Lake watershed.
Sustainability 11 05403 g005
Figure 6. The time required for the pollutants from enterprises migrating into the lake inlet.
Sustainability 11 05403 g006
Figure 7. Vulnerability index of urban area in different sub-regions of the Hongfeng Lake watershed.
Sustainability 11 05403 g007
Figure 8. Different risk grades of industrial enterprises in the Hongfeng Lake watershed.
Sustainability 11 05403 g008
Figure 9. Environmental risk index of different types of industrial enterprises in the Hongfeng Lake area.
Sustainability 11 05403 g009
Figure 10. A hazard and risk grade map for industrial enterprises and sub-regions of the Hongfeng Lake watershed.
Sustainability 11 05403 g010
Figure 11. The potential hazard index, vulnerability index, and integrated environmental risk index corresponding to each industrial enterprise in the Hongfeng Lake watershed.
Sustainability 11 05403 g011
Table 1. Average flow discharge of each tributary flowing into the Hongfeng Lake used in this study.
TributaryHydrological StationMean Discharge (m3 s−1)Remark
Maiweng RiverMaiweng station11.95Measurement
Yangchang RiverHuangmaocun station37.55Measurement
Maxian RiverND17.44Simulation
Houliu RiverND6.14Simulation
Table 2. The water withdrawal per day of two drinking water intakes of Hongfeng Lake.
Serial NumberDrinking Water IntakesWater Withdrawal (wk, 104 m3 d−1)
1Xijiao waterworks25
2Bailongdong waterworks2
Table 3. The grade division of the environmental risk level of different industrial enterprises.
ERIQuantities of Industrial EnterprisesRisk Grade of Industrial Enterprises
ERI ≥ 0.56Major
0.3 ≤ ERI < 0.517Big
0.1 ≤ ERI < 0.313General
0.0 ≤ ERI < 0.119Slight
Table 4. The grade division of regional environmental risk of different sub-regions.
Sub-Regions of the HLWERIsRisk Grade
Yangchang River watershed7.00High
Maiweng River watershed4.29Medium
Maxian River watershed2.05Low
The surrounding area of the Lake1.13Low
Houliu River watershed0.00None
ERIs refers to the accumulation of environmental risk index.

